Dynamic Floating Stations Model for Emergency Medical Services with a Consideration of Traffic Data

1
Department of Geography, National Taiwan University, Taipei 10617, Taiwan
2
Department of Industrial Engineering &Management, National Taipei University of Technology, Taipei 10608, Taiwan
3
Department of Laboratory Medicine, Taipei Medical University, Taipei 11031, Taiwan
4
School of Medical Laboratory Science and Biotechnology, Taipei Medical University, Taipei 11031, Taiwan
5
Pulmonary Research Center, Wan Fang Hospital, Taipei Medical University, Taipei 11698, Taiwan
6
Fire Department, Disaster Rescue Section, New Taipei City 220225, Taiwan
*
Author to whom correspondence should be addressed.
ISPRS Int. J. Geo-Inf. 2020, 9(5), 336; https://doi.org/10.3390/ijgi9050336
Submission received: 24 March 2020
/
Revised: 14 May 2020
/
Accepted: 15 May 2020
/
Published: 20 May 2020
(This article belongs to the Special Issue Enhanced Modeling and Surveying Tools for Smart Cities)
Abstract
:To equally distribute the workload and minimize the travel distance for fire departments, we developed a new dynamic floating stations model (DFSM) to target traffic-related emergency medical services (EMS) during peak hours. This study revealed that traffic-related EMS incidents have different characteristics to other EMS incidents. The number of floating stations was determined by the number of available ambulances at a given time. The optimum floating station location was identified by using the given capacity to establish the smallest service radius. In DFSM simulations using floating stations with a capacity of 100 and 150 EMS incidents, the result shows significant improvements in comparison to the current situation.
1. Introduction
Emergency medical services (EMS) systems are typically established to increase survival in life-threatening situations [1,2]. The term EMS refers to the well-trained teams that provide first aid treatment in a medical emergency. The main objective of EMS is related to the name itself—to offer initial treatment to people requiring critical medical attention. Moreover, EMS is responsible for transporting patients from their location to the hospital in a safe and efficient manner, which allows patients to receive more definitive care if they require it. EMS exists to enhance people’s quality of life. Without the daily sacrifice of these crews to save people’s lives, society might face an even higher death rate.
Despite being in existence since the beginning of the 18th century and having served countless people since then, EMS must still improve to provide an even higher quality service. Rapidly arriving at the patient’s location is a crucial goal of EMS teams. Therefore, improving solutions to location accuracy problems and addressing timing concerns are imperative. The goal of this study was to solve these problems and provide an operational model and application that enables the fire department to decide when, where, and how many ambulances to deploy. Therefore, this study describes a floating station that can be employed to improve EMS.
This study uses a floating ambulance station because New Taipei City’s geographical location presents challenges for the movement of EMS teams and because work is asymmetrically divided between stations [3]. In New Taipei City, acute illness represents the highest number of EMS incidents, followed by traffic-related injuries and general wounds. To accurately evaluate the demand for EMS from acute illness, this study excluded all other categories, such as traffic-related injuries and general wounds. Therefore, the new floating stations only target one category.
Some other considerations are clearer, such as the diverse routes taken by EMS to reach patients. Nontraffic-related EMS incidents typically occur off the road; thus, the patients cannot be reached by the ambulance itself. An emergency medical technician (EMT) must carry the stretcher and equipment through open spaces and lobbies and use elevators and stairs to reach the patient inside a building compound or in an off-road field. This increases the time it takes for EMS personnel to reach a victim and is not included in the traveling time of conventional set-covering models. By contrast, traffic-related EMS requests typically have traffic police on the scene, who can help the ambulance reach a patient on the roadside. This is why the idea of assigning floating ambulance stations to the roadside to address traffic-related EMS incidents involves the New Taipei City Fire Department. For convenience, floating ambulance stations can be located along the road in areas with high EMS requests, such as at a nearby intersection. For this reason, the current study evaluated intersections as potential floating station candidates.
A floating ambulance station can be defined as a roadside depot that is used at certain times, such as during workday peak hours. The actual location is connected with a certain intersection, and the ambulance accepting the assignment remains stationary, but within sight of the given intersection, without interfering with regular traffic movement. The on-site ambulance can immediately respond to an accident in its area or receive assignments from the dispatch center to travel to a nearby area. The goal of this study was to diminish the high occurrence of traffic-related EMS incidents at certain intersections and enhance the service quality. The success of the floating ambulance stations was measured according to the decrease in total travel distance and the increase in coverage area. By enlarging the study area to encompass the remaining parts of the city, the observed improvements in EMS performance can be extended to the entire city.
The rest of this paper is organized as follows. In Section 2, the literature is reviewed and ambulance location research is discussed. In Section 3, the study problem is defined and data are described. Section 4 elaborates on the proposed dynamic floating stations model (DFSM) and related procedures. Section 5 presents and discusses the experimental results. Finally, conclusions and future directions are provided in Section 6.
2. Literature Review
Several papers have reviewed recent developments in ambulance location and relocation research. For example, locating service facilities and vehicles [4,5], scheduling crew shifts [6], dispatching vehicles to call locations [7,8], and dynamically relocating available vehicles when other vehicles are busy [9].
Brotcorne, Laporte and Semet [4] reviewed major studies on ambulance location and relocation models and classified them as deterministic, probabilistic, and dynamic models. Li, et al. [10] separated the operating models of ambulance facility depots into several types: covering models, which use a predefined distance to cover EMS calls; p-median models, which determine the minimum average distance to all demand points; and p-center models, which determine the minimum of the maximum distances to all demand points. They treated emergency calls as the demand for EMS.
The initial location set-covering problem was proposed by Toregas, et al. [11], and this simplifies real-time EMS management. The set-covering indicates that a demand point is covered if at least one EMS facility can service the emergency call within a predefined distance. Then, covering models are widely used and studied [10]. Furthermore, the maximal covering location problem was proposed by [12]. It means that the available ambulance bases cannot sufficiently cover all the demand points. This model maximizes the total demand covered by a limited number of ambulance bases.
Other extensions of the maximal covering location problem can be found in the literature, including the double standard model proposed by [13], maximum expected covering location problem proposed by [14], maximum availability location problem proposed by [15], dynamic double standard model proposed by [13], and dynamically available coverage location model propsoed by [16]. For example, Erkut, et al. [17] incorporated a survival function into the covering model and proposed the maximum survival location problem. Zarandi, et al. [18] developed a large-scale approach to solve the problem within a reasonable time. Dell’Olmo, et al. [19] developed a multi-period optimization model by considering an urban traffic network to maximize road control and minimize the number of accidents.
Most set-covering models for ambulance location and relocation use a plane with a homogeneous surface as the starting point. They consider the travel distance as the variable and the minimum acceptable range, or they reduce the overall travel distance, as previously mentioned. Some models use the road distance (Manhattan distance) to measure the space between the EMS request and the fire station [20,21], whereas most other models use the straight line distance (Euclidean distance). However, most set-covering models employ a simulated number as the capacity constraint, instead of using the EMS incident locations received by an ambulance station to determine the location of the new ambulance station. Current and Storbeck [22] listed previouisly developed capacitated set-covering location problems and capacitated maximal covering location problems.
The aforementioned covering models are static models, which are suitable for the strategic level, but lack the flexibility required for the operational level. The demands of real-time emergencies vary spatially and temporally. To maximize the coverage of emergency calls, idle EMS bases located in low-demand areas should be moved to high-demand areas. Moreover, a decision maker can redeploy ambulance bases to provide better coverage. In 1971, Scott studied a dynamic location–allocation facility problem to anticipate the future demand. Recently, the real-time redeployment problem was thoroughly studied and various models were proposed. These models considered temporally and spatially varying demands in the dynamic location model. Maxwell et al. (2009) divided research on dynamic allocation problems into three categories: (1) reposition ambulances in real-time, (2) precompute the optimal position, and (3) incorporate system randomness into the model.
Many countries have similar traffic-related EMS incident problems. In Brazil, traffic-related death (26.2%) is the second leading cause of preventable death [23]. Road traffic injury is also the leading cause of premature death and disability in Iran [24]. Iran has one of the highest road traffic accident rates in the world [25]. In Taiwan, motorcyclists account for 13% and 16% of all annual traffic-related fatalities and inpatient injuries, respectively [26]. The Taiwan National Highway Traffic Safety Administration reported that motorcyclists are approximately 30 times more likely to die in a motor vehicle crash than motor vehicle occupants in 2011 [27]. Moreover, fatal motorcycle injury rates are highest in the Americas [28]. Some studies have used peak periods to determine the ambulance travel time [29,30,31,32]. Other studies have used weekday ambulance location data [33,34]. However, no studies have used peak hour and weekday data as target location factors.
The dynamic allocation model for the real-time redeployment of ambulances must change periodically to reposition the ambulance base locations throughout the day, in order to respond to the real-time demand and reduce the response time [4]. In practice, dynamic relocation of a base is costly and complicated; each relocation increases workloads for ambulance crews and potentially reduces their readiness to respond to an emergency call. Therefore, in this study, we propose a dynamic floating stations model that focuses on updating ambulance base locations by detecting historical traffic data.
3. Methodology
To improve the ambulance service in the city, we developed the DFSM approach. We first identified areas with poor EMS services according to the existing service capacity. Within these poorly served areas, we identified new locations for floating ambulance stations. We selected locations that were far from existing fire stations and that had sufficient EMS incidents. Timing was also considered, with a focus on peak hours with the heaviest traffic and high EMS requests. We established a new operational model to address the aforementioned challenges and suggested several floating station locations on the basis of the distribution of past EMS incidents. Model simulations suggested significant improvements in both the area coverage and coverage ratio for EMS incidents after floating station implementation.
This study formulated a new dynamic decision-making model to facilitate the selection of floating ambulance stations by considering existing fire stations and the location and frequency of past EMS incidents. The model is dynamic because when a new floating station has been selected, the covered EMS incidents are excluded from the model itself and the next floating station receives a new set of uncovered EMS points to inform location selection.
The model aims to increase the service quality by reducing the travel time to save lives in traffic-related accidents during peak hours. Given the aforementioned location challenges of existing fire stations, the deployment of new floating stations at appropriate locations during peak hours would reduce the travel time and, therefore, provide a better service.
The model first used the average capacity of each existing station to establish the optimum service radius; each station has the resources to respond to EMS requests within its radius. Subsequently, a circle was drawn around the existing stations, and the determined radius was used to define the coverage area. After we identified the radii of all existing stations in the city, the areas uncovered by circles indicated areas requiring floating ambulance stations.
Next, the model identified all of the intersections in the uncovered areas and calculated the radius of each using the capacity given and measuring all points covered. At this stage, all of the potential floating ambulance stations had similar EMS incident capacities. The model then searched for the first smallest radius available from the potential stations and set that floating station as the suggested new station. Once a new floating station was chosen, it was added to the existing fire stations and its service radius was drawn. The process was then repeated to identify the next best potential floating station, until the maximum number of stations was reached.
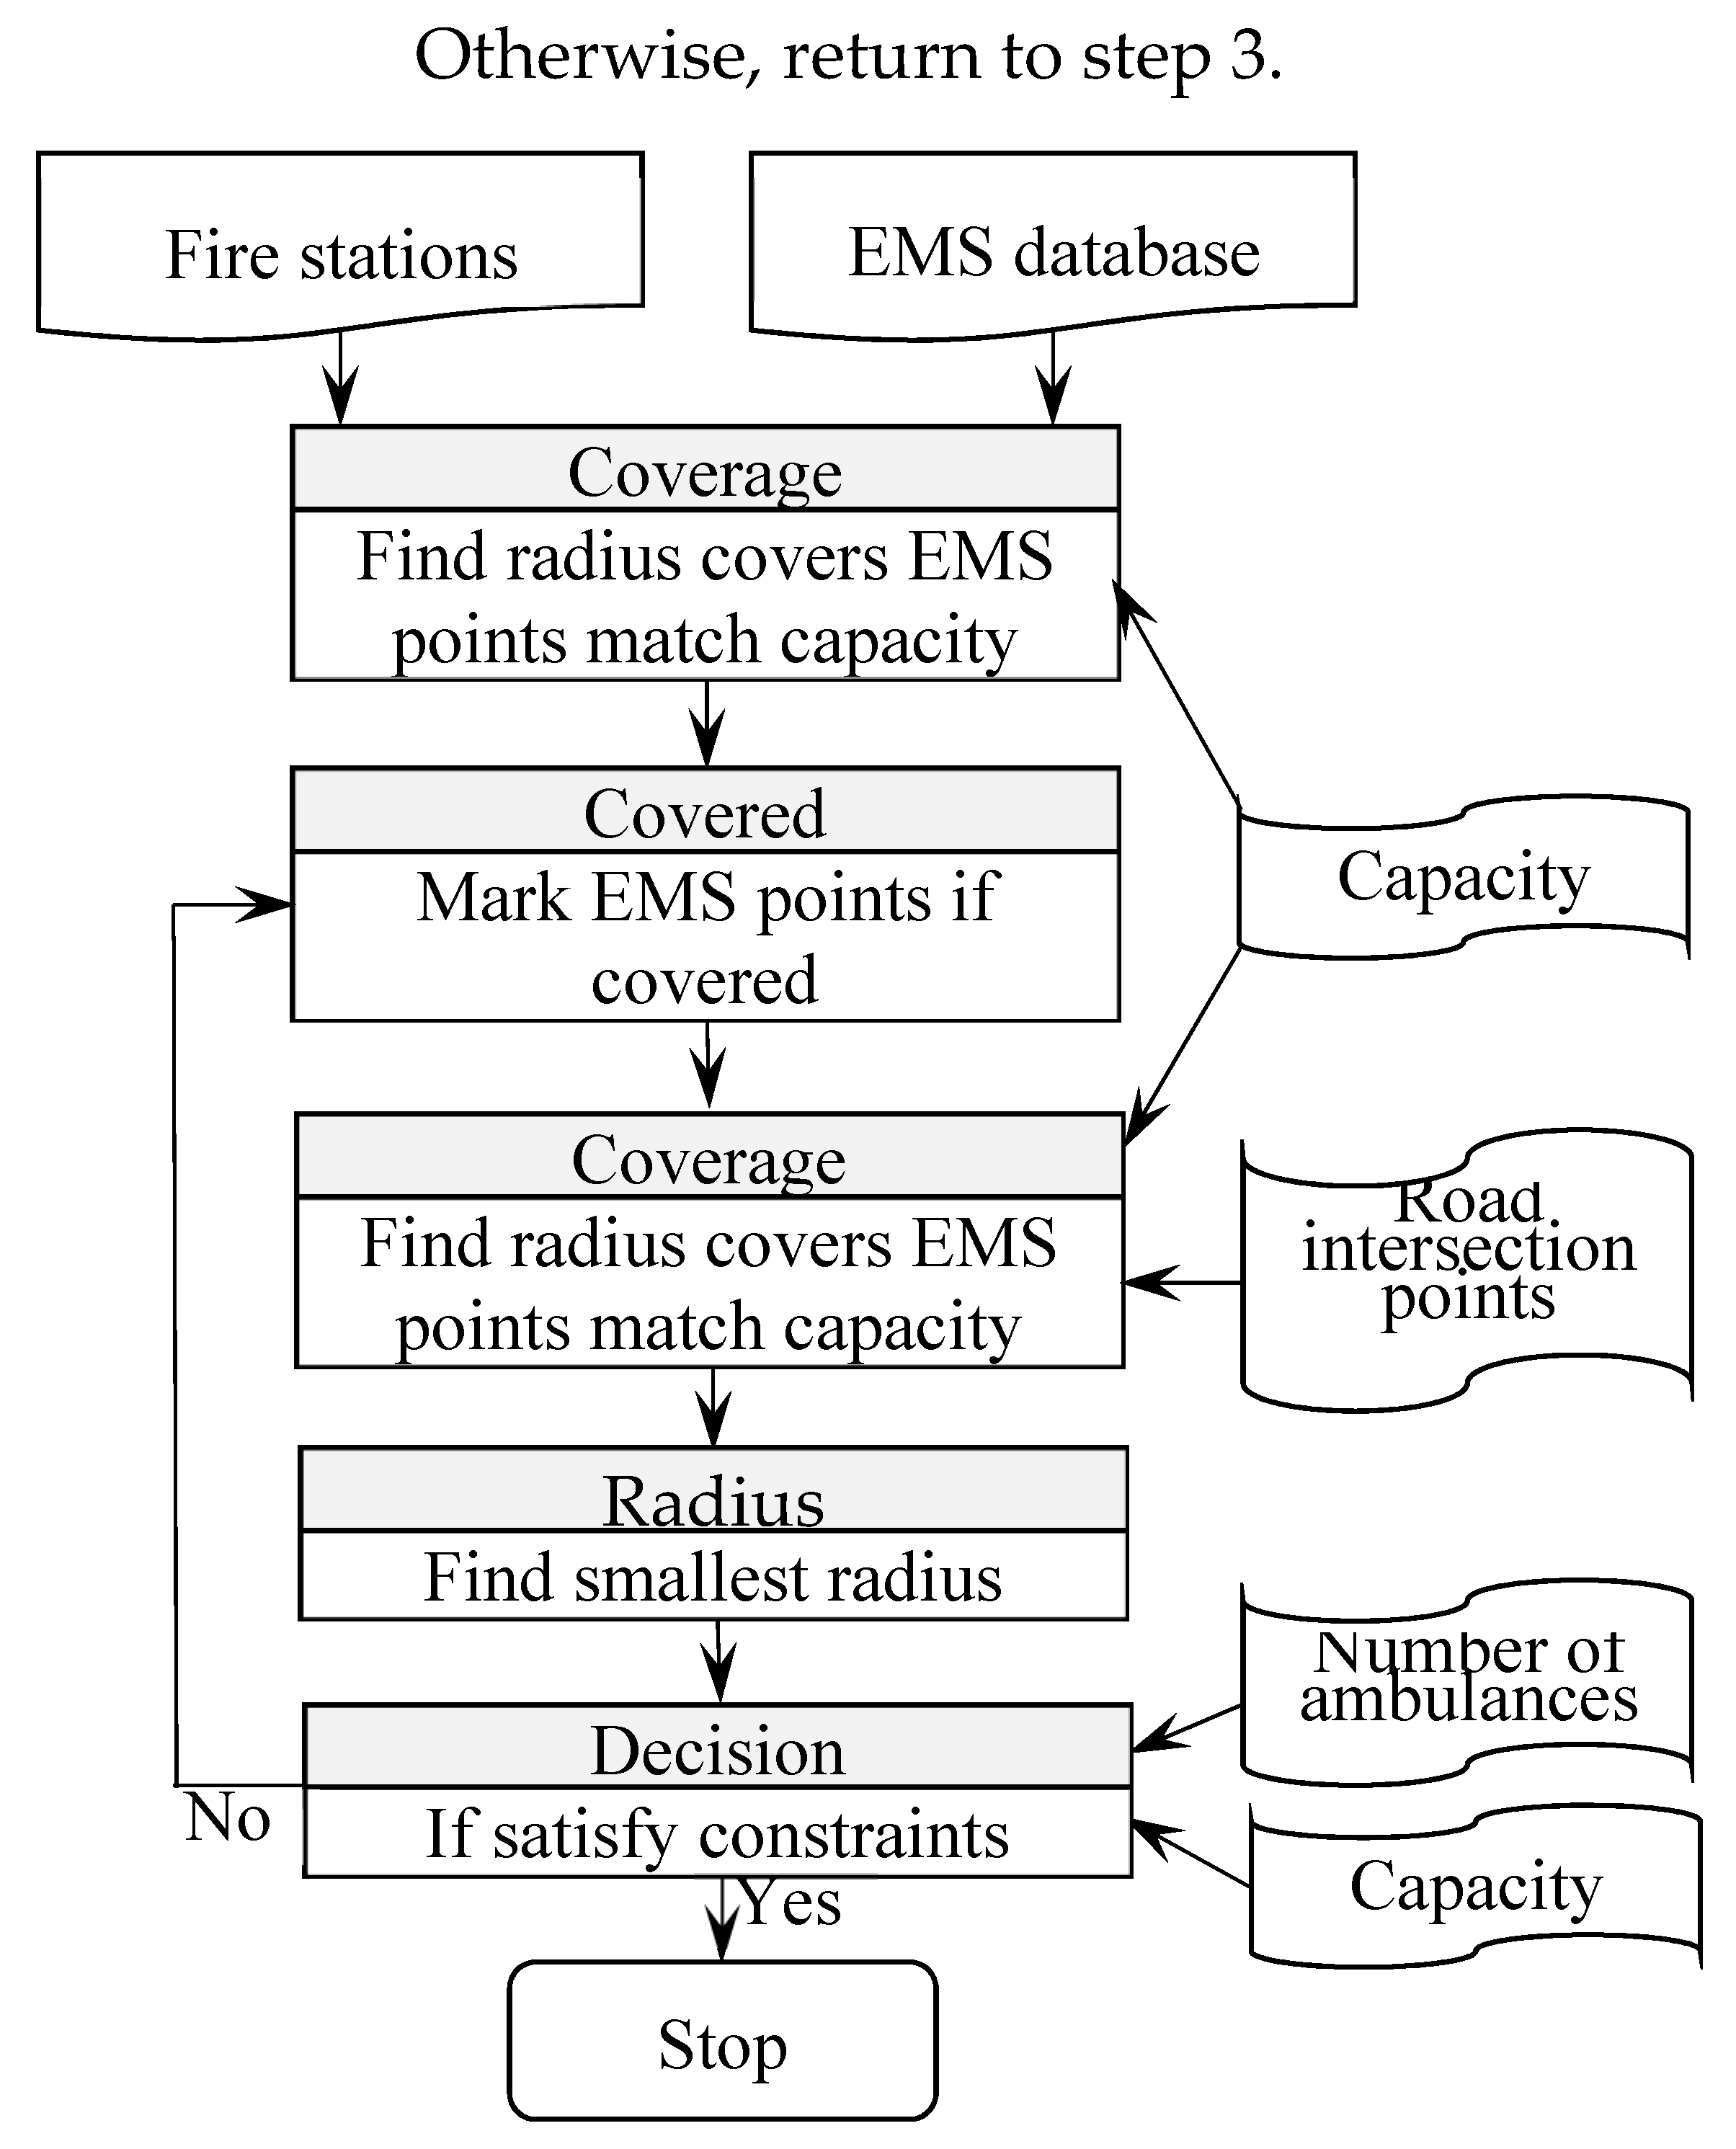
Because the model uses stations’ maximum capacity and minimum service radii, when the iteration process identifies several locations, the one with the smallest radius is chosen as the suggested floating station. If more than one suggested station is identified, the first location is chosen. The location with the same conditions is chosen next, and so on. Figure 1 illustrates the steps involved in identifying new floating stations.
The model proceeds as follows:
- Draw a radius around each fire station that covers all EMS incidents in the area until the station’s capacity is reached;
- Mark all EMS points located within all fire station radii as “covered”;
- From all road intersections, identify radii that contain uncovered EMS points until reaching the capacity given;
- Locate the first smallest radius from the road intersection points as the next new floating station;
- If no new floating stations with appropriate EMS capacity points are identified, the process stops;
- For any new floating station, draw a circle using the radius found and mark all of the EMS points within that circle as “covered”;
- If the maximum number of new floating stations is reached, the process stops.
The model has two stopping procedures: at step 5 and 7. Step 7 uses the given maximum new floating station number to stop the model. Step 5 stops the model if no additional potential fire stations reach the capacity given.
The equations used in the DFSM are as follows:
where W represents the study area; Fi represents the fire stations; and i = 1, 2, … n, where n represents the total number of fire stations. The term Ik is the number of potential new predefined floating stations (in this model, we used road intersections), and k = 1, 2, … r, where r is the maximum number of all potential floating ambulance sites that are intersections. The term R(x) refers to the radius of location x when it covers the maximum number of EMS points, x = { Ik | Fi }. C is the amount of capacity given.
Fi+1 = Min R(Ik) s. t.
Ik ∉ R(Fi), i = 1, 2, … n,
R(Ik) <= C, k = 1, 2, … r,
R(Fi) <= C, i = 1, 2, … n
Function (1) is the objective function from which we can identify the first smallest radius from the potential floating stations. Function (2) indicates whether a potential new floating station is located outside of the existing fire stations’ capacity radius. Function (3) seeks the appropriate radius for all potential new floating stations that satisfy the capacity given. Function (4) is the same as function (3), except that it uses existing fire stations. Through an iterative process, the DFSM identifies new floating stations until the maximum number is reached or it is unable to locate a potential station with a sufficient capacity.
The Cauchy distribution described by Pillai and Meng is ideal because it has infinite variance and does not have an upper bound or a mean [35]. Most set-covering models consider the travel distance and use the minimum acceptable range or reduction in overall travel distance as assumptions. This study used the capacity of the service area as the main variable to determine the locations of new floating ambulance stations. A few studies have used the similar concept. The ambulance allocation capacity model (AACM) created by Shiah and Chen used EMS incidents in Taichung City as the demand and local fire stations as the supply, similar to the current study, to provide a fair distribution of services to residents [36]. The multi-capacity ambulance location model (MCAL) developed by Shiah, Hung, and Chen further considers the traveling distance, address point (population), and EMS incident location as the factors to determine the locations and the number of ambulances required [36,37].
4. Case Study
4.1. Problem Definition
In this study, we considered New Taipei City—a major city in Taiwan with a population of more than 4 million and an urban area of 2052.57 km2—in Taiwan as the research area [3]. Over the past 4 years, the city has recorded approximately 161,000 annual EMS requests, which is equivalent to 441 EMS requests per day, and these numbers are increasing. In March 2018, the New Taipei City Fire Department had 69 fire stations with ambulances and approximately 125 ambulances in service.
The current study used the fire department’s database of 632,024 records with exact location coordinates. In total, 98.3% of EMS requests required the ambulance to travel fewer than 5 km in a straight line. In terms of the distance, the highest frequency (mode) was 700 m (7.02% of all requests), and the average number of trips for all fire stations at this distance was 643. The next most common distance was 800 m, representing 6.98% of all trips and 639.7 trips on average per station. The fire station with the highest EMS request frequency reported 26,215 trips over the past 4 years (4.15% of all EMS requests), and the station with the lowest frequency required only 306 trips (0.05% of all requests). The two stations with the highest and lowest frequency had 6554 and 76 average yearly trips, respectively. Therefore, the busiest fire station had approximately 18 trips per day, whereas the least busy fire station only averaged one trip every 5 days. Furthermore, over the past 4 years, 33 stations (nearly half of all fire stations) have received more than six requests a day, with 12 stations receiving more than 12 requests a day. These numbers illustrate the unequal workload between stations.
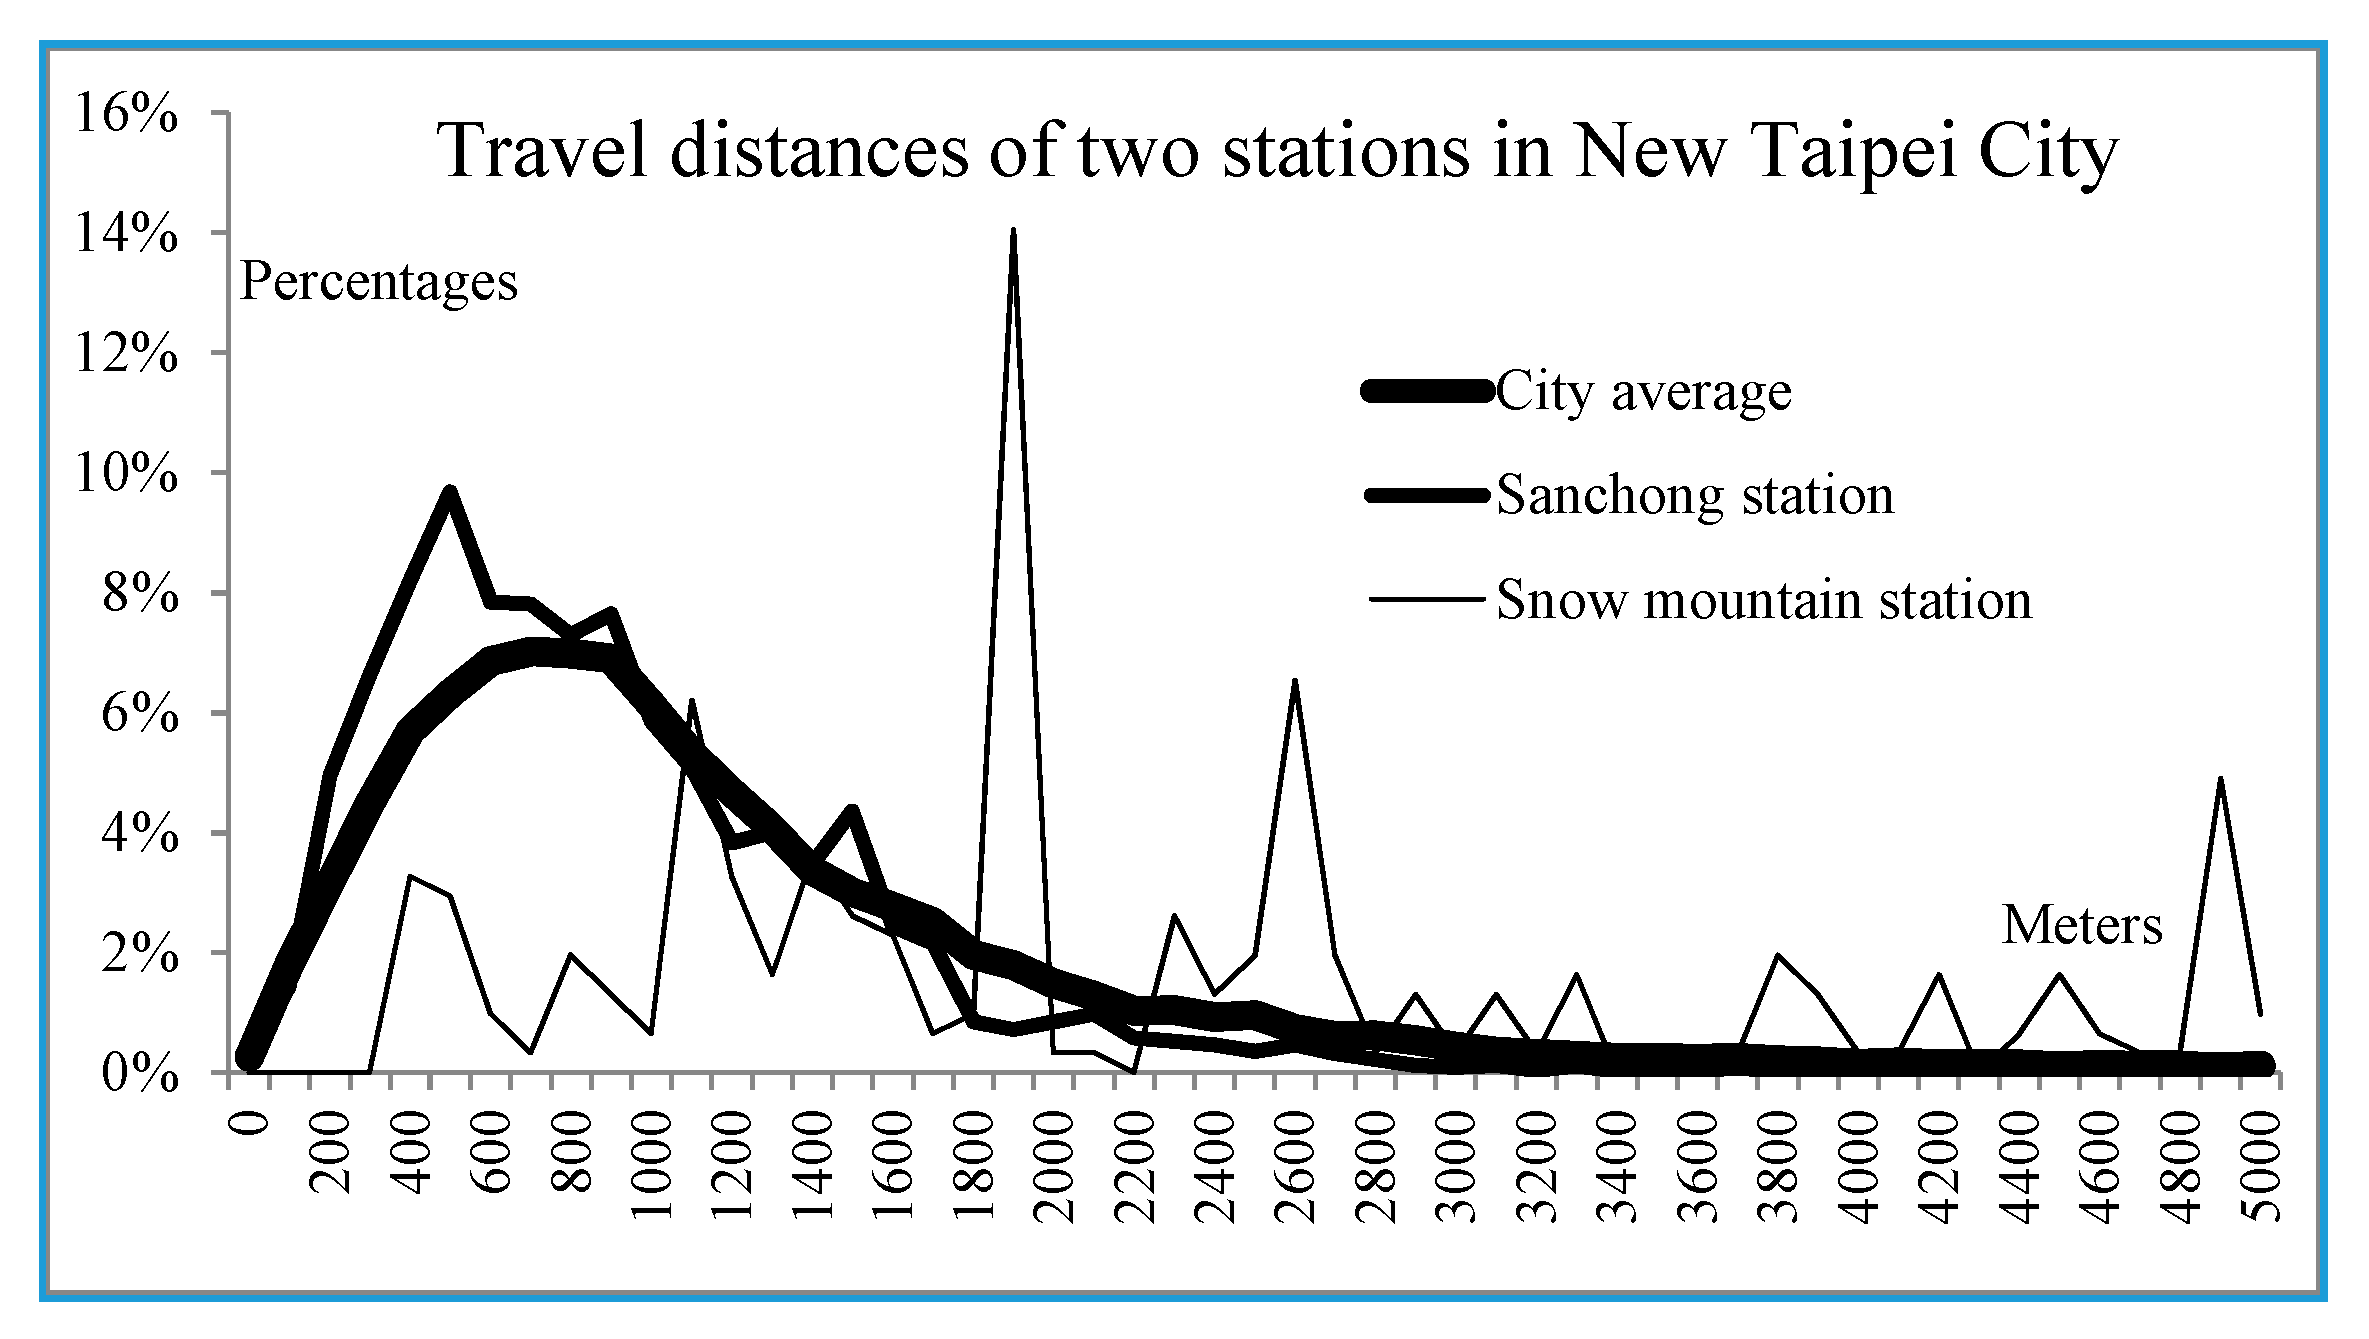
The unequal distribution also relates to the location of the station and the resulting travel distance. Sanchong station is one of the busiest stations in this study area, whereas Snow Mountain station (with only 306 trips a year) is the least busy of all stations. The travel distance distribution between these two stations is disparate (Figure 2). Most trips from Sanchong station involved shorter distances than the city average. However, distributions for Snow Mountain station were spread less evenly. This means that ambulances from Sanchong station were more likely to reach the EMS incident location within a few minutes than ambulances departing from Snow Mountain station. This unique problem is caused by the location of both stations, as well as that of all other stations. Sanchong station is located in a high-density urban area, whereas Snow Mountain station is located in a mountainous area.
4.2. Data Description
The study area is mostly surrounded by rivers (Figure 3), isolating it from other areas by minimizing the border effect. The study area consists of two districts of New Taipei City—Sanchong and Luzhou—covering 23.76 km2 of highly developed land (1.16% of New Taipei City’s area) and containing 14.73% of the city’s population. Figure 2 illustrates that large areas in the middle right of the study area are far from any existing fire stations. This is because no space is available for a new fire station in that area.
The border effect, as used in this study, refers to two types of EMS incidents: (1) an EMS incident that is located outside of the study area, but is served by a fire station inside the study area, and (2) an EMS incident that is located inside the study area, but is served by an outside fire station. Events that involve crossing the study area border are referred to as the border effect. The border effect employed in this study is similar to the concept of a “busy fraction” that has been used in numerous studies [4,29,38,39,40,41].
The study area has seven fire stations with a total of 16 ambulances, representing 12.8% of the city’s 125 ambulances, which is less than the proportion of the city’s population living in the area. The average annual workload (in terms of EMS incidents) of each ambulance in the study area and the whole city was 1588 and 1273, respectively (Table 1). The differences between the study area and the city average in terms of traffic-related EMS requests, weekday EMS incidents, and weekday peak-hour incidents were 485 versus 377, 357 versus 279, and 103 versus 85, respectively. When considering an average of 250 workdays a year, each ambulance in the study area responded to approximately 0.41 EMS incidents every working day, compared with an average of 0.34 for the entire city. The aforementioned numbers for the study area were between 122% and 129% of the values for the entire city. Therefore, the study area clearly lacks sufficient fire stations and ambulances compared with the rest of the city. Because no space is available in the study area to construct a new fire station and the area has a shortage of ambulances, the only option to address these concerns is to request assistance from outside ambulances and use a model to establish floating ambulance stations at appropriate locations and times.
Another problem that must be addressed is the need for a detailed analysis of EMS data in various categories from New Taipei City and the provision of appropriate solutions. Acute illness and traffic-related EMS incidents, for example, are distinct categories in ambulance operations and are discussed later. Set-covering research on ambulances has typically used all EMS data as the main reference to determine future EMS deployment sites [40,42,43]. Thus far, no study has divided EMS incidents into different categories to discuss differences between them. The current research observed large differences between traffic-related EMS incidents and other categories, depending on the time of day. For that reason, the decision-making process used for the floating station location was different from that in other cover models.
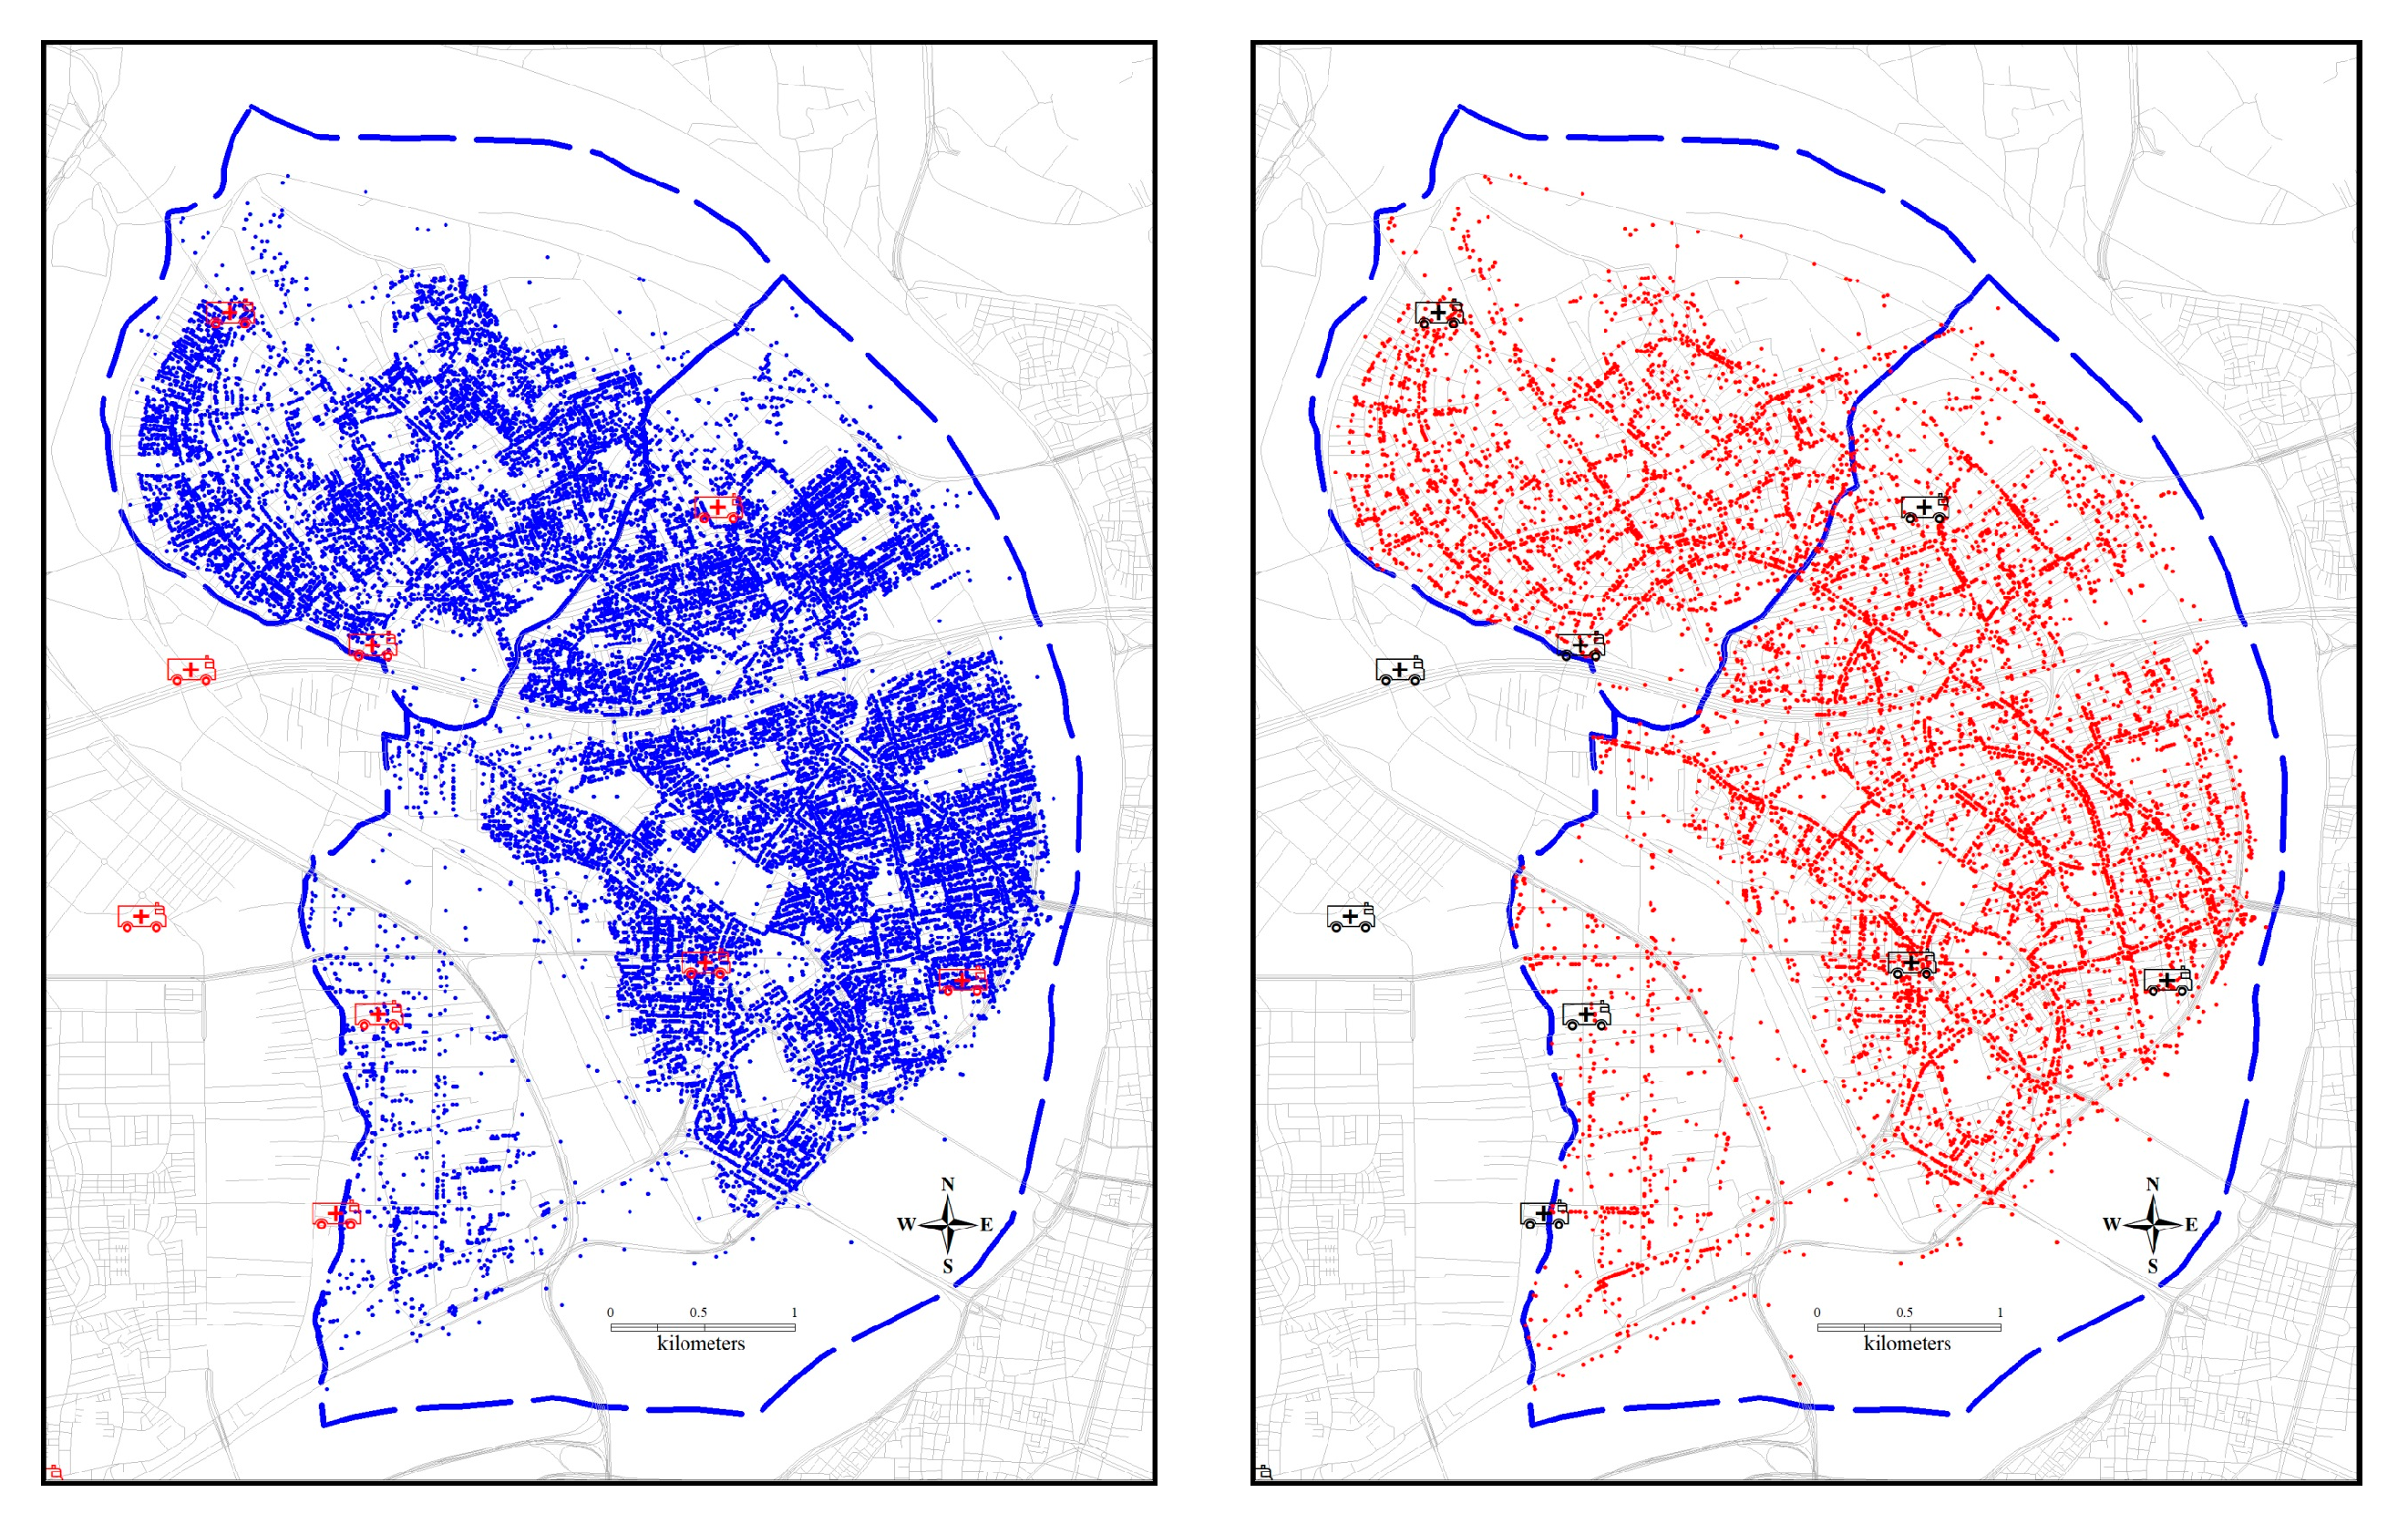
The differences between traffic EMS and nontraffic EMS incidents are clear and straightforward. First, the fire department data revealed that the distribution of traffic-related EMS incidents is concentrated on main roads or on the roadside. By contrast, nontraffic-related EMS incidents are also located close to roads, but extend more to the housing or buildings nearby (Figure 3). The nontraffic EMS locations are distributed in a fashion resembling city blocks (Figure 3, left panel), whereas the traffic-related EMS locations are distributed along lines (Figure 3, right panel). This difference greatly constrains site selection for floating ambulance stations. Conventional set-covering models do not consider the lined distribution of traffic-related EMS locations, mainly because traffic-related EMS incidents do not constitute the largest proportion of all EMS incidents. Acute illness incidents tend to affect the location of new floating ambulance stations because they comprise nearly half of all EMS records. Traffic-related EMS incidents comprised less than one-third of all EMS incidents evaluated in this study. Therefore, conventional models might not be suitable for such incidents.
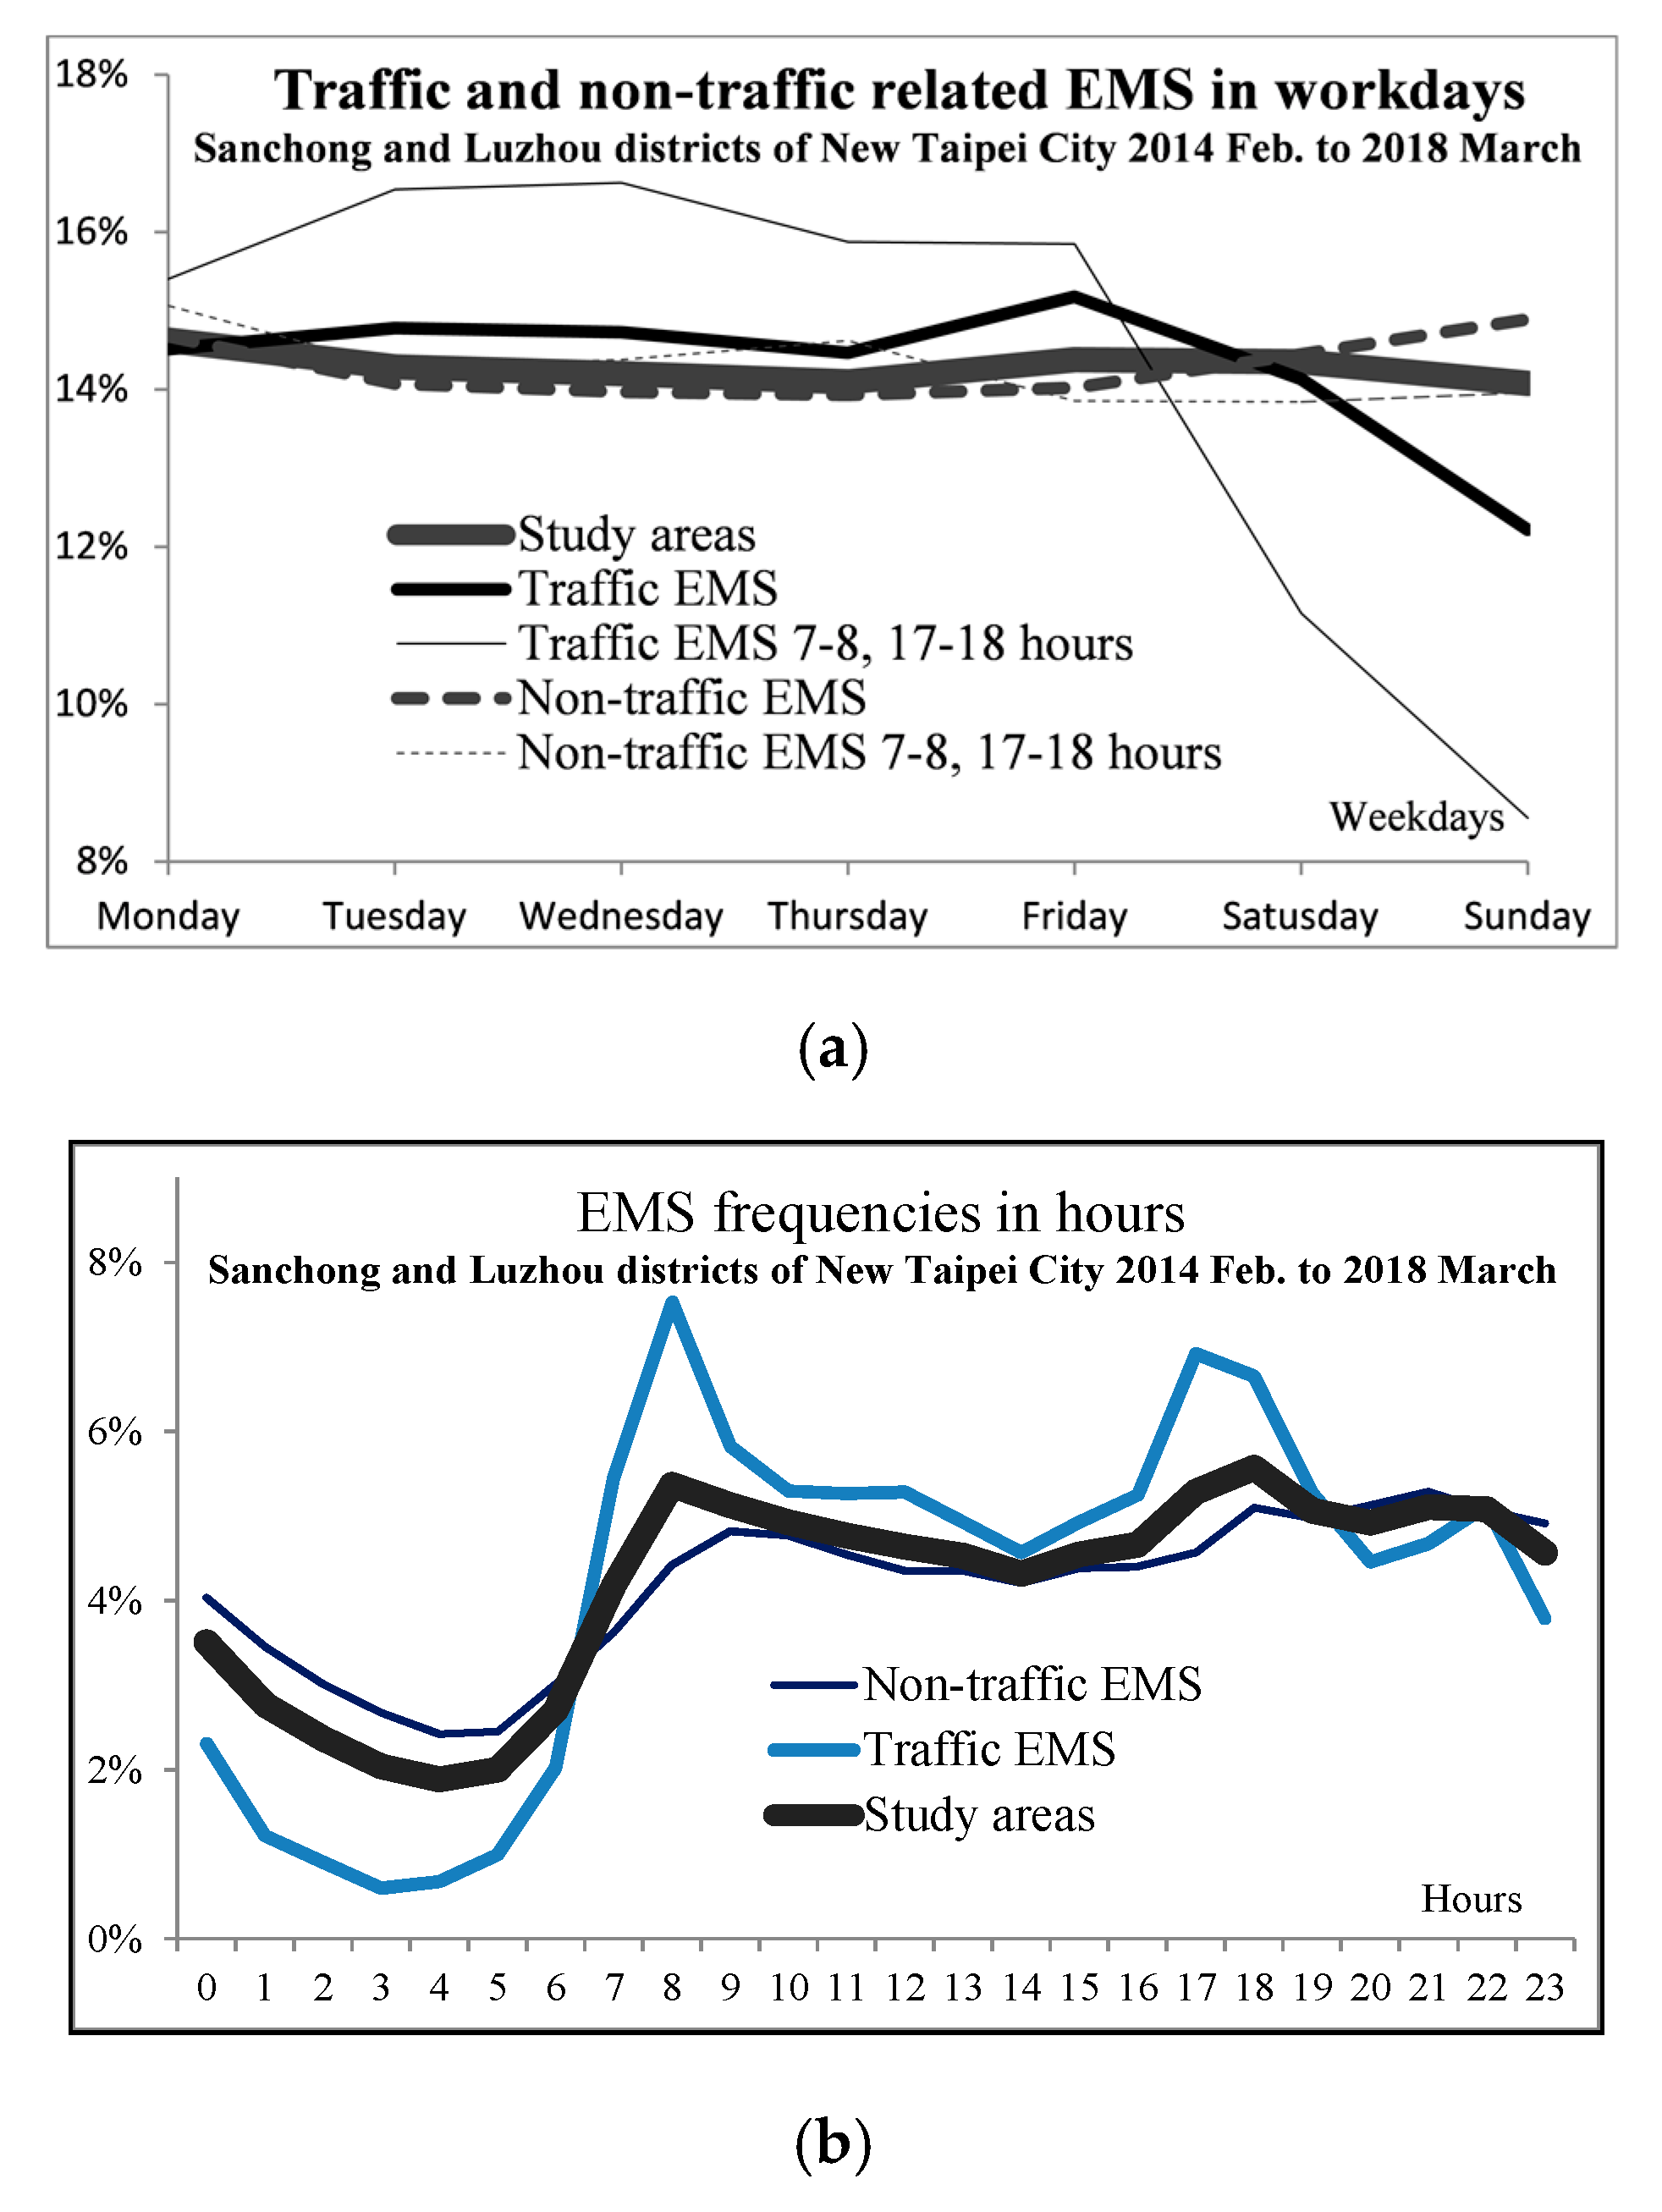
The next consideration is time. New Taipei City EMS data revealed that the weekday and peak-hour frequencies (07:00–08:00 and 17:00–18:00) differ from all traffic-related EMS incidents, despite being in the same category. This difference also strongly suggests that they represent different types of EMS requests and should be treated separately. The daily and hourly frequency distributions for traffic- and nontraffic-related EMS incidents are illustrated in Figure 4 The right panel represents all EMS incidents in the study area alongside the traffic- and nontraffic-related EMS frequencies. The traffic-related EMS line and the nontraffic-related EMS line intersect at 07:00 and 20:00 on a typical day and are located on opposite sides of the line representing all EMS incidents in the study area. Nontraffic-related EMS incidents exhibit a higher frequency at night and a lower frequency at noon than traffic-related EMS incidents. The two peak periods (07:00–08:00 and 17:00–18:00) are the busiest periods of the day. These two hours account for 26.56% of all daily EMS requests.
The left panel of Figure 4 reveals that Friday is the dividing day. After Friday, the frequency of traffic-related EMS incidents and peak hour lines fall sharply, whereas nontraffic-related EMS lines remain relatively stable, with a slight increase on Sunday. The line representing all EMS incidents remains relatively stable throughout the week. The thick line representing traffic-related EMS incidents remains at the same level of 14% to 15% during weekdays and drops to 12% by Sunday. Traffic-related EMS incidents during peak hours are approximately 16% during weekdays and drop sharply to less than 9% on Sunday. These data indicate that traffic-related EMS incidents during peak hours have considerably different characteristics to other types.
Relative to EMS incident rates for the entire city, the study area had 15.97% more general EMS incidents and 16.48% more traffic-related EMS incidents, which are both higher than the area’s population proportion of 14.73%. The average number of annual EMS incidents during peak hours in the study area was 236.3 incidents, which is 153% of the city average of 154.1. The workload of each fire station in the study area is almost double that of the city average, which is one of the reasons why this area was chosen for this study.
Traffic-related EMS incidents during peak hours represent the busiest periods for the New Taipei City Fire Department. Fire stations outside of the study area responded to 7.43% of all traffic-related EMS incidents in the study area. For peak hours, the number was 7.86%. Reducing the travel time for each EMS incident to provide the seven fire stations with more time to attend to their own EMS incidents without outside support is a critical concern for the fire department.
The EMS database revealed 42,527 EMS incidents in the city during weekday peak hours, representing 30.5% of all weekday traffic-related EMS incidents, 22.59% of all traffic-related EMS incidents, and only 6.68% of all EMS incidents. This small portion of EMS incidents not only has unique characteristics, but can also help solve a major problem for the fire department.
In the study area, the average travel distance for EMS incidents was 1162 m, and the mode was 900 m (representing 7.8% of all EMS incidents in the study area); the next most common distance was 800 m (7.65% of the total). The average travel distance was only slightly higher than the mode, which suggests that, in the study area, the average travel distance is concentrated around the average (1162 m) and the mode (900 m). The study area data in Table 1 reveal that only 0.68%, 0.1%, and 0.001% of EMS trips involved distances greater than 5, 10, and 15 km, respectively. These numbers are substantially lower than the city-wide average.
The average travel distance for traffic-related EMS was 1424.6 m for the entire city; the mode was 900 m (6.85% of all traffic-related EMS incidents), followed by 700 m (6.48%). The corresponding distance in the study area was 1233.5 m; the mode was 900 m (8.37% of total), followed by 700 m (7.03%). The number in the study area without the aforementioned border effect was 1144.6 m; the mode was 900 m (8.4% of the total), followed by 700 m (7%).
The travel distance during peak hours for all EMS incidents in the entire city was 1458.9 m; the mode was 900 m (6.7% of total), followed by 700 m (6.4%). The peak hours travel distance in the study area was 1386.8 m; the mode was 900 m (7.9% of total), followed by 700 m (6.5%). The peak hours travel distance in the study area without considering the border effect was 1190.7 m; the mode was 900 m (8.3% of total), followed by 700 m (6.7%). We observed that our study area had shorter travel distances for all of the aforementioned categories (89.3% and 74.8% of the city-wide average for the average travel distance and peak hours distance, respectively).
The selection of an ideal location for a new floating station from the potential candidates was the main focus of the model. The annual average number of ambulance trips during weekday peak hours was 103 for the study area and 85 for the city. Therefore, the floating station model used 100 and 150 as the capacities required for operation and to generate results for comparisons and discussion (Table 1).
5. Results
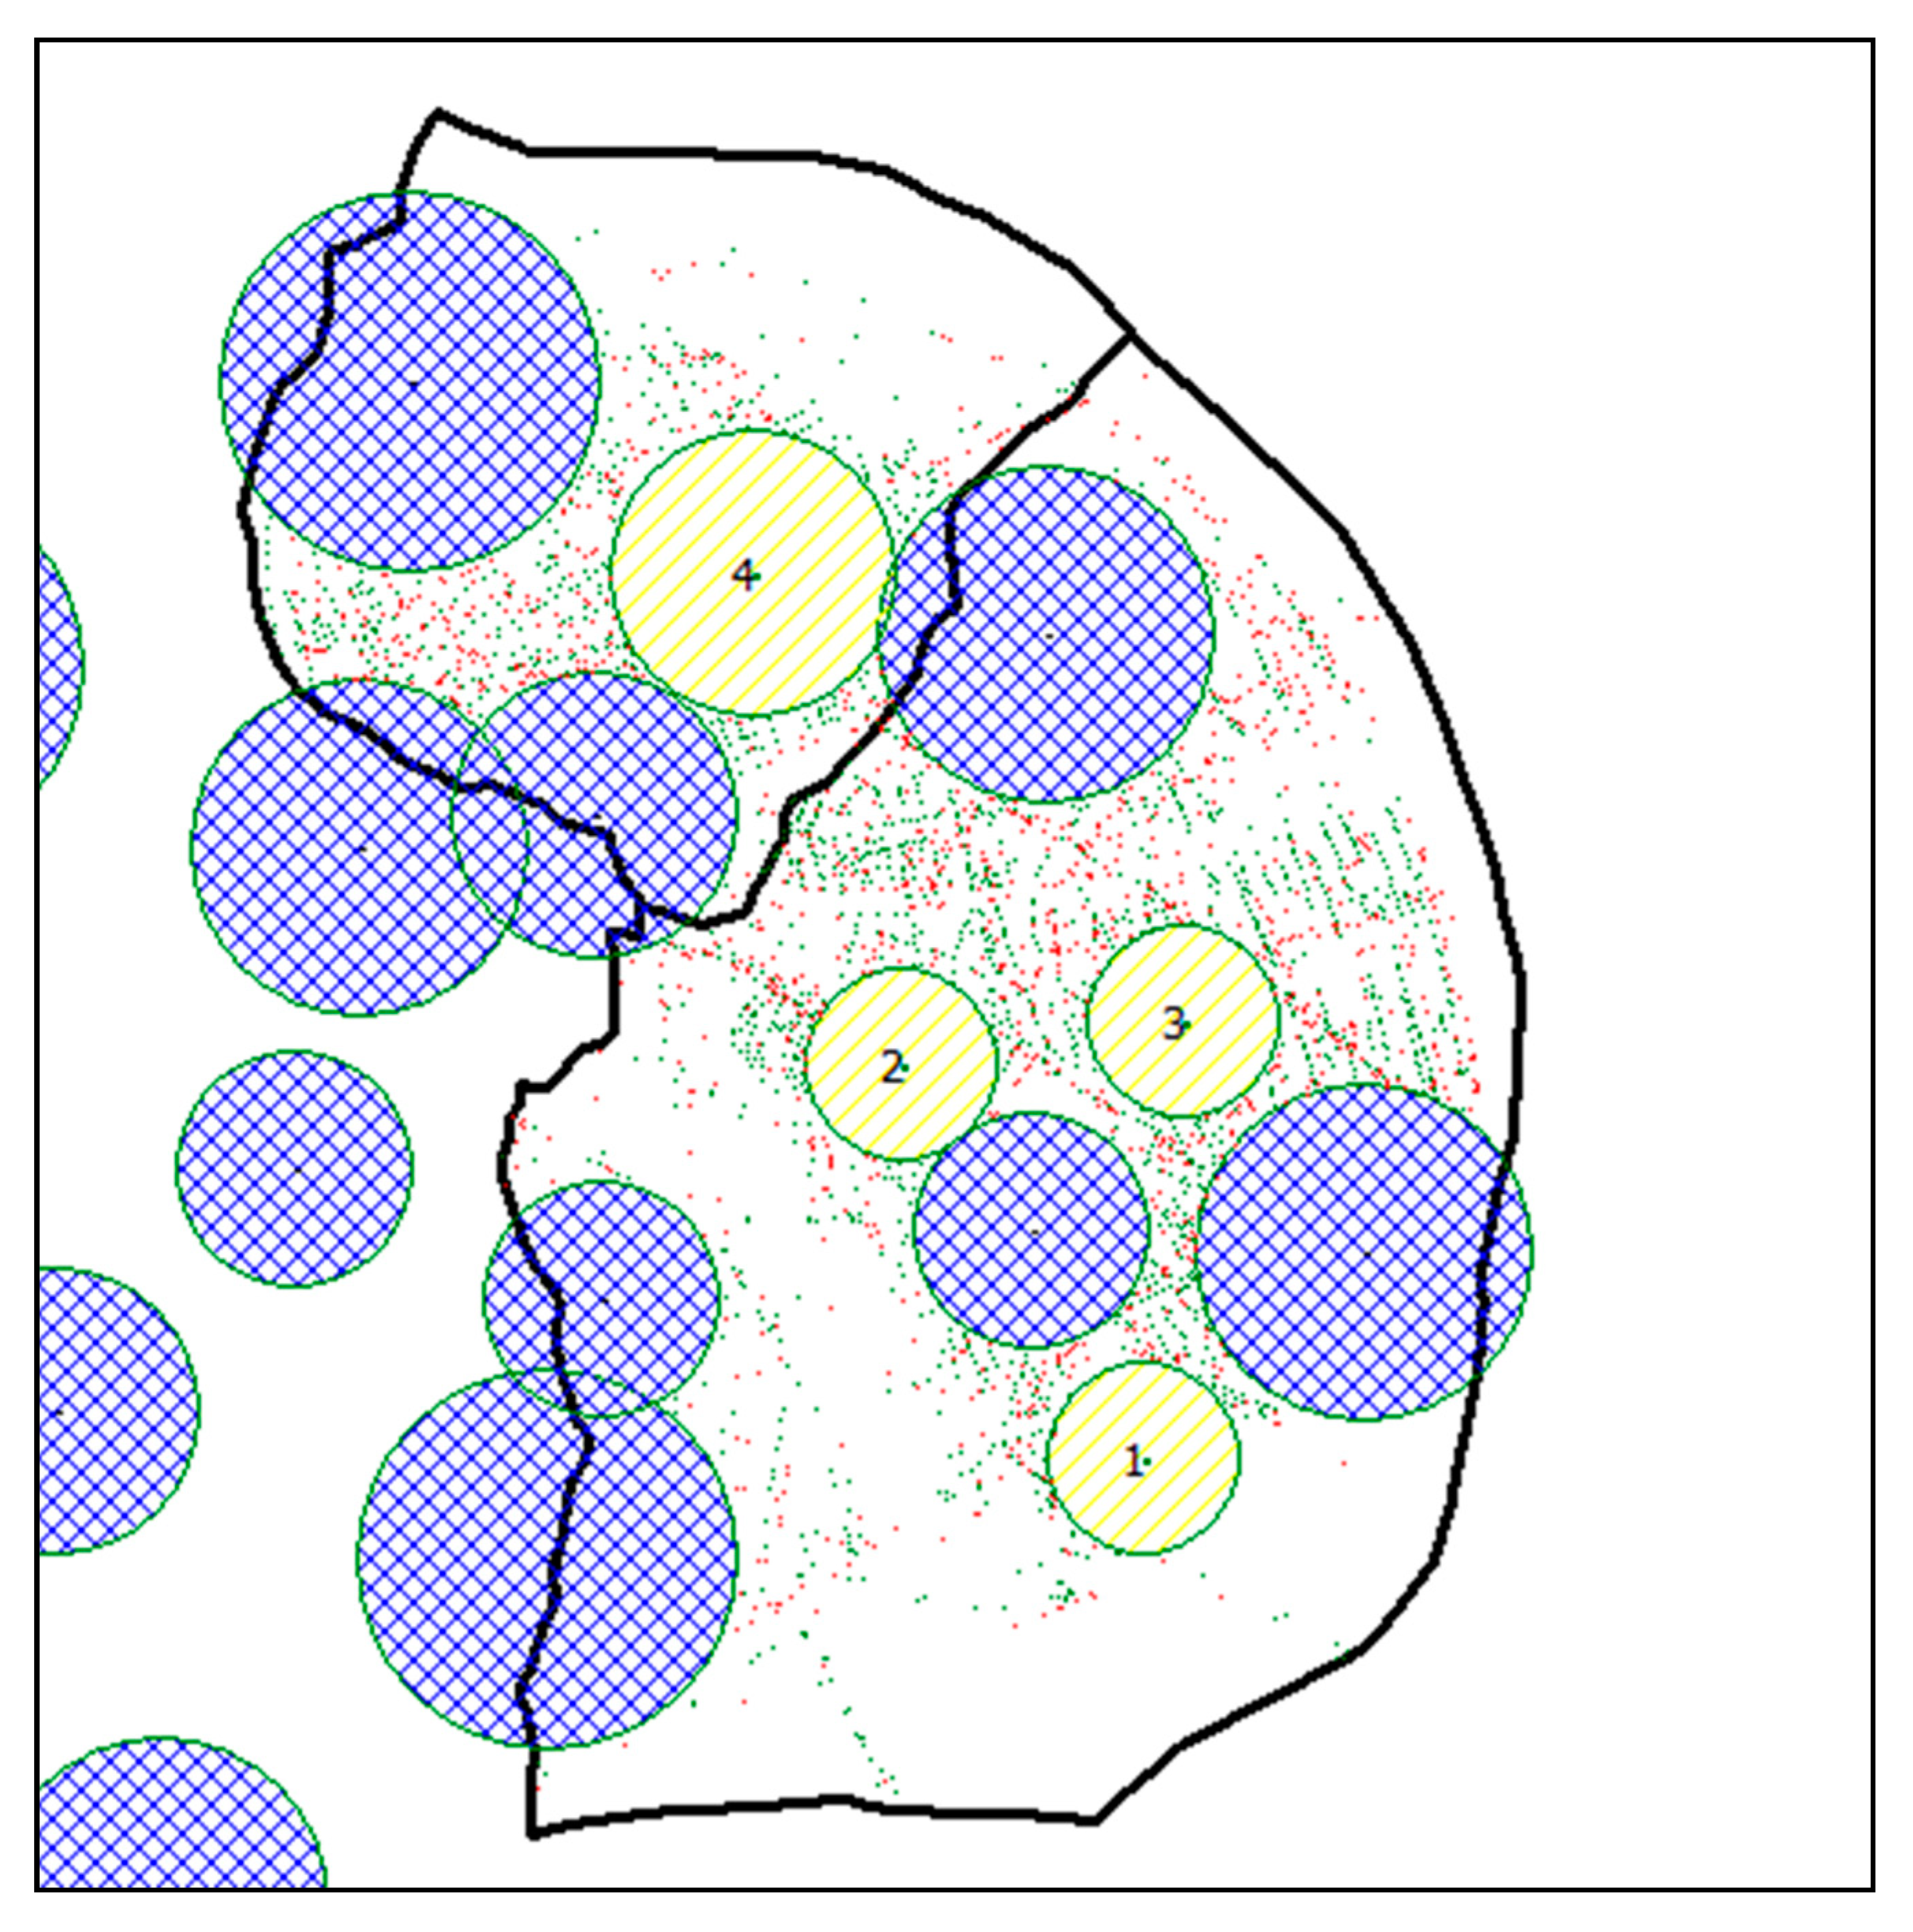
The simulated results from the implementation of the four new floating stations in the study area are illustrated in Figure 5 Given that each station had a capacity of 100 annual traffic-related EMS incidents during peak hours in the study area (Figure 5), implementation of the first floating station increased the coverage rate of traffic-related EMS incidents during peak periods by 5.54% (Table 2), and the second to fourth increased the rate by 5.39%, 4.22%, and 6.17%, respectively. The total coverage of traffic-related EMS incidents during peak hours increased from 31.1% when no floating stations were active to 36.614%, 42.005%, 46.225%, and 52.390% as one, two, three, and four floating stations were implemented, respectively. The radius of the three new stations was 400 m and 600 m for the other.
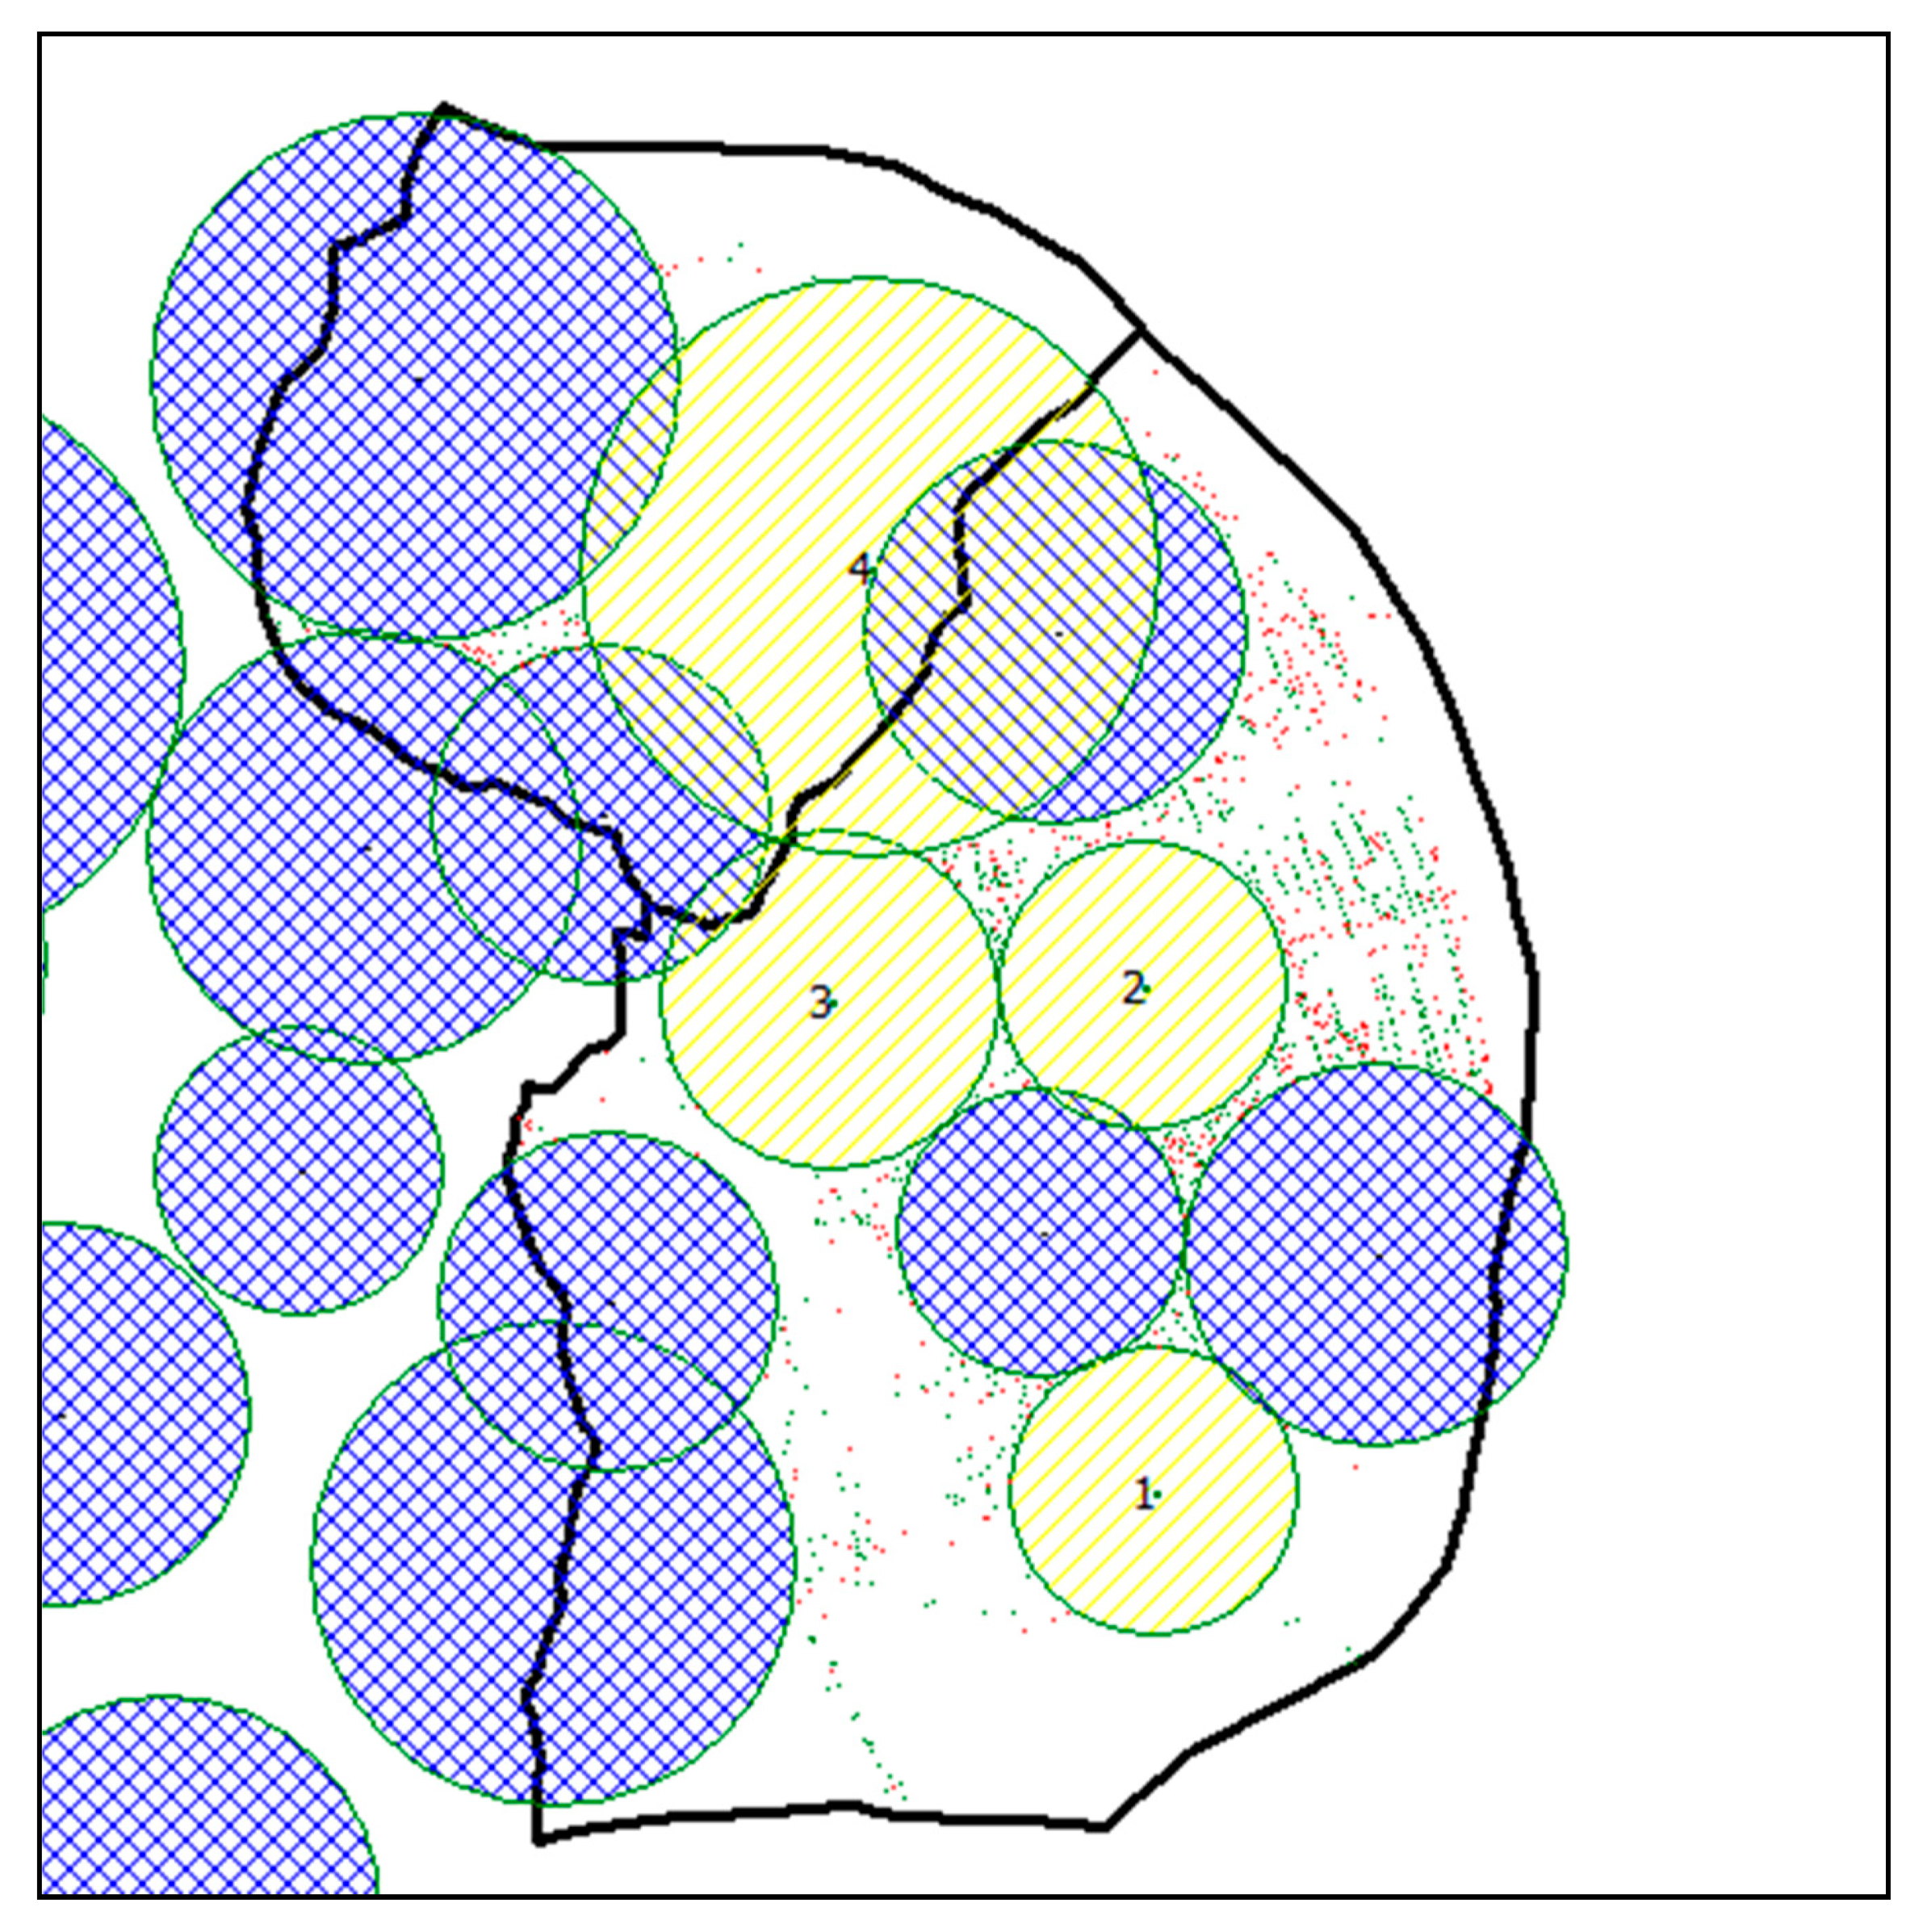
Given that each station had a capacity of 150 annual traffic-related EMS incidents during peak hours (Figure 6), the coverage rate of stations one to four increased by 9.281%, 8.078%, 9.298%, and 9.677%, respectively. The total coverage increased from 46.571% with no floating stations to 55.852%, 63.930%, 73.228%, and 82.905% as one to four new stations were installed, respectively. The radii of the new floating stations were 600, 600, 700, and 1200 m, respectively. The coverage increased by 68.6% and 78% when using floating stations with capacities of 100 and 150 EMS incidents, respectively, constituting significant improvements.
The area coverage of the seven existing fire stations was 31.1%, but increased to 52.4% after the installation of the four floating stations (with a capacity of 100 EMS incidents each), resulting in a 68.6% improvement (Table 2). When using floating stations with a capacity of 150 incidents per year, the area coverage improved from 46.57% to 82.91% (a 78% increase). Both improvements were significant.
When using four floating stations with a capacity of 100 incidents each, the average travel distance during peak hours was 1074 m; the mode was 400 m (11.1% of all trips), followed by 500 m (7.9%). The average travel distance without the border effect was 989.4 m; the mode was 400 m (12% of all trips), followed by 500 m (8.5%). For the four floating stations with a capacity of 150 incidents each, the average travel distance during peak periods was 889.7 m; the mode was 500 m (12.2% of all trips), followed by 600 m (11.4%). The average travel distance without the border effect was 824 m; the mode was 500 m (13.1% of all trips), followed by 600 m (12.2%). Relative to the same numbers in Table 1, significant improvements were observed in the travel distance for both capacity conditions. The average travel distance during peak hours was 87.1% and 72.1% that of typical values after the implementation of floating stations with capacities of 100 and 150 incidents, respectively. Without the border effect, these values were 71.3% and 59.5% that of typical values when stations with a capacity of 100 and 150 were installed, respectively.
6. Conclusions
This study has proposed a new dynamic decision-making model to facilitate the selection of floating ambulance stations by considering existing fire stations and the location and frequency of past EMS incidents. Traditional covering models are static models, which are suitable for the strategic level, but lack the flexibility required for the operational level. The demands of real-time emergencies vary spatially and temporally. In practice, the dynamic relocation of a base is costly and complicated; each relocation increases the workloads for ambulance crews and potentially reduces their readiness to respond to an emergency call. Furthermore, most set-covering models consider the travel distance and use the minimum acceptable range or reduction in overall travel distance as assumptions.
The dynamic allocation model for the real-time redeployment of ambulances must change periodically to reposition the ambulance base locations throughout the day, in order to respond to the real-time demand and reduce the response time. Therefore, in this study, we have proposed a dynamic floating stations model that focuses on updating ambulance base locations by detecting historical traffic data. The Cauchy distribution has been applied for the frequency of traffic EMS incidents. This study used weekday peak hours as the target category for floating stations, mainly to facilitate operations and management.
For the case simulation, the new floating stations cover large areas of EMS points; those points were previously served by existing fire stations farther away than the new floating stations. With those new floating stations, the average travel distance will certainly be shortened, which is the expectation for this type of operation. Simulations revealed significant improvements when using our model; however, the reality may differ considerably. For more accurate results, this model should be implemented in a real-world system using everyday data and making corrections from on-site feedback. Before such implementation, we can only use the results from the model simulation to prove the improvements. The results also revealed that the model only improved the problem areas with the limited ambulances provided, instead of affecting coverage in the full study area where the service should ideally be provided. However, based on this discussion, the applicability of the floating stations might be appropriate for other cities or countries which have limited ambulance resources.
Our model considered capacity as the main constraint when identifying new floating station locations. Only four ambulances were available to assign. Therefore, it was a small-scale operation; however, it did address EMS concerns in terms of the travel distance and workload. Because of the limited ambulance resources, we used the first found maximum capacity to identify potential new stations to prioritize support in areas with the greatest difficulties.
Through this dynamic deployment of ambulances, ambulance resources can be effectively used during peak traffic hours. In the non-peak period of traffic, the original service mode of the ambulance unit will be restored, without the need to activate the dynamic deployment mode of ambulances. Because the speed of ambulances can be faster during non-peak traffic hours, and the service coverage of ambulances is also larger than that during peak traffic hours, the original ambulance can meet the response time of the ambulance during the non-peak period of traffic.
Considering that existing fire departments are immovable and urban development is unpredictable, floating stations seem to constitute a suitable solution for urban areas. The scenario in urban areas and non-urban areas may require different deployment approaches. The road network in non-urban areas is not as dense as that in urban areas. Future studies may extend research to non-urban area coverage, as another constraint measurement, to identify the optimum solutions. Moreover, excluding nontraffic-related EMS incidents and determining the floating ambulance station locations were the goals of this study. In future studies, we may develop another model to simulate nontraffic-related EMS incidents, such as those for acute illness.
Author Contributions
Supervision, Chih-Hong Sun; Writing, Po-Huan Hsiao; Original draft, Po-Huan Hsiao; Editing, Chen-Yang Cheng; Conceptualization, Cheng-Hui Wang; Review, Chen-Yang Cheng. All authors have read and agreed to the published version of the manuscript
Funding
This research received no external funding.
Acknowledgments
The authors gratefully acknowledge the Fire Department of New Taipei City, Taiwan, ROC, for providing support. This article was subsidized by Ministry of Science and Technology and National Taiwan University (NTU), Taiwan.
Conflicts of Interest
The authors declare no conflict of interest.
References
- McLay, L.A. Emergency medical service systems that improve patient survivability. Wiley Encycl. Oper. Res. Manag. Sci. 2010. [Google Scholar]
- MacFarlane, C.; Benn, C. Evaluation of emergency medical services systems: A classification to assist in determination of indicators. Emerg. Med. J. 2003, 20, 188–191. [Google Scholar] [CrossRef] [PubMed] [Green Version]
- New Taipei City Government Fire Department Disaster Relief Rescue Dispatch Center Rescue Case GPS Coordinates Database; New Taipei City Government Fire Department: New Taipei City, Taiwan, 2018.
- Brotcorne, L.; Laporte, G.; Semet, F. Ambulance location and relocation models. Eur. J. Oper. Res. 2003, 147, 451–463. [Google Scholar] [CrossRef]
- Sorensen, P.; Church, R. Integrating expected coverage and local reliability for emergency medical services location problems. Socio-Econ. Plan. Sci. 2010, 44, 8–18. [Google Scholar] [CrossRef]
- Goldberg, J.B. Operations research models for the deployment of emergency services vehicles. Ems Manag. J. 2004, 1, 20–39. [Google Scholar]
- Schmid, V. Solving the dynamic ambulance relocation and dispatching problem using approximate dynamic programming. Eur. J. Oper. Res. 2012, 219, 611–621. [Google Scholar] [CrossRef] [Green Version]
- Lim, C.S.; Mamat, R.; Braunl, T. Impact of ambulance dispatch policies on performance of emergency medical services. Ieee Trans. Intell. Transp. Syst. 2011, 12, 624–632. [Google Scholar] [CrossRef]
- Kolesar, P.; Green, L. Improving emergency responsiveness with management science. Manag. Sci. 2004, 50, 1001–1014. [Google Scholar]
- Li, X.; Zhao, Z.; Zhu, X.; Wyatt, T. Covering models and optimization techniques for emergency response facility location and planning: A review. Math. Methods Oper. Res. 2011, 74, 281–310. [Google Scholar] [CrossRef]
- Toregas, C.; Swain, R.; ReVelle, C.; Bergman, L. The location of emergency service facilities. Oper. Res. 1971, 19, 1363–1373. [Google Scholar] [CrossRef]
- Church, R.; ReVelle, C. The maximum covering location problem. Reg. Sci. Assoc. 1973, 32. [Google Scholar]
- Gendreau, M.; Laporte, G.; Semet, F. A dynamic model and parallel tabu search heuristic for real-time ambulance relocation. Parallel Comput. 2001, 27, 1641–1653. [Google Scholar] [CrossRef] [Green Version]
- Daskin, M.S. A maximum expected covering location model: Formulation, properties and heuristic solution. Transp. Sci. 1983, 17, 48–70. [Google Scholar] [CrossRef] [Green Version]
- ReVelle, C.; Hogan, K. The maximum availability location problem. Transp. Sci. 1989, 23, 192–200. [Google Scholar] [CrossRef]
- Rajagopalan, H.K.; Saydam, C.; Xiao, J. A multiperiod set covering location model for dynamic redeployment of ambulances. Comput. Oper. Res. 2008, 35, 814–826. [Google Scholar] [CrossRef]
- Erkut, E.; Ingolfsson, A.; Erdoğan, G. Ambulance location for maximum survival. Nav. Res. Logist. (NRL) 2008, 55, 42–58. [Google Scholar] [CrossRef]
- Zarandi, M.F.; Davari, S.; Sisakht, S.H. The large scale maximal covering location problem. Sci. Iran. 2011, 18, 1564–1570. [Google Scholar] [CrossRef]
- Dell’Olmo, P.; Ricciardi, N.; Sgalambro, A. A multiperiod maximal covering location model for the optimal location of intersection safety cameras on an urban traffic network. Procedia-Soc. Behav. Sci. 2014, 108, 106–117. [Google Scholar]
- Boscoe, F.P.; Henry, K.A.; Zdeb, M.S. A nationwide comparison of driving distance versus straight-line distance to hospitals. Prof. Geogr. 2012, 64, 188–196. [Google Scholar] [CrossRef] [Green Version]
- Nordin, N.A.M.; Zaharudin, Z.A.; Maasar, M.A.; Nordin, N.A. Finding shortest path of the ambulance routing: Interface of A∗ algorithm using C# programming. In Proceedings of the 2012 IEEE Symposium on Humanities, Science and Engineering Research, Kuala Lumpur, Malaysia, 24–27 June 2012; pp. 1569–1573. [Google Scholar]
- Current, J.R.; Storbeck, J.E. Capacitated covering models. Environ. Plan. B Plan. Des. 1988, 15, 153–163. [Google Scholar] [CrossRef]
- Gawryszewski, V.P.; Rodrigues, E.M.S. The burden of injury in Brazil, 2003. São Paulo Med J. 2006, 124, 208–213. [Google Scholar] [CrossRef] [PubMed] [Green Version]
- Ardalan, A.; MASOUMI, G.; GOUYA, M.M.; Sarvar, M.; Hadadi, M.; Miadfar, J.; Rezvani, F.; SHAH, M.M. Road traffic injuries: A challenge for Iran’s health system. Iran. J. Public Health 2009, 38, 98–101. [Google Scholar]
- Paravar, M.; Hosseinpour, M.; Salehi, S.; Mohammadzadeh, M.; Shojaee, A.; Akbari, H.; Mirzadeh, A.S. Pre-hospital trauma care in road traffic accidents in kashan, iran. Arch. Trauma Res. 2013, 1, 166. [Google Scholar] [CrossRef] [Green Version]
- Hsieh, C.-H.; Hsu, S.-Y.; Hsieh, H.-Y.; Chen, Y.-C. Differences between the sexes in motorcycle-related injuries and fatalities at a Taiwanese level I trauma center. Biomed. J. 2017, 40, 113–120. [Google Scholar] [CrossRef] [PubMed]
- Administration National Highway Traffic Safety Administration (N. H. T. S.). Motorcycles Traffic Safety Fact Sheet; Administration National Highway Traffic Safety Administration (N. H. T. S.): Washington, DC, USA, May 2013.
- Rodrigues, E.M.; Villaveces, A.; Sanhueza, A.; Escamilla-Cejudo, J.A. Trends in fatal motorcycle injuries in the Americas, 1998–2010. Int. J. Inj. Control Saf. Promot. 2014, 21, 170–180. [Google Scholar] [CrossRef] [Green Version]
- Budge, S.; Ingolfsson, A.; Zerom, D. Empirical analysis of ambulance travel times: The case of Calgary emergency medical services. Manag. Sci. 2010, 56, 716–723. [Google Scholar] [CrossRef]
- Schmid, V.; Doerner, K.F. Ambulance location and relocation problems with time-dependent travel times. Eur. J. Oper. Res. 2010, 207, 1293–1303. [Google Scholar] [CrossRef] [Green Version]
- Zhen, L.; Wang, K.; Hu, H.; Chang, D. A simulation optimization framework for ambulance deployment and relocation problems. Comput. Ind. Eng. 2014, 72, 12–23. [Google Scholar] [CrossRef]
- Takeda, R.A.; Widmer, J.A.; Morabito, R. Analysis of ambulance decentralization in an urban emergency medical service using the hypercube queueing model. Comput. Oper. Res. 2007, 34, 727–741. [Google Scholar] [CrossRef]
- Dolney, T.J.; Sheridan, S.C. The relationship between extreme heat and ambulance response calls for the city of Toronto, Ontario, Canada. Environ. Res. 2006, 101, 94–103. [Google Scholar] [CrossRef]
- Eaton, D.J.; U, H.M.L.S.; Lantigua, R.R.; Morgan, J. Determining ambulance deployment in santo domingo, dominican republic. J. Oper. Res. Soc. 1986, 37, 113–126. [Google Scholar] [CrossRef]
- Pillai, N.S.; Meng, X.-L. An unexpected encounter with Cauchy and Lévy. Ann. Stat. 2016, 2089–2097. [Google Scholar] [CrossRef]
- Shiah, D.-M.; Chen, S.-W. Ambulance allocation capacity model. In Proceedings of the 2007 9th International Conference on e-Health Networking, Application and Services, Taipei, Taiwan, 19–20 June 2007; pp. 40–45. [Google Scholar]
- Shiah, D.-M.; Hung, C.-T.; Chen, S.-W. Multi-capacities ambulance location model. In Proceedings of the 2009 5th International Conference on Testbeds and Research Infrastructures for the Development of Networks & Communities and Workshops, Washington, DC, USA, 6–8 April 2009; pp. 1–6. [Google Scholar]
- Ingolfsson, A.; Budge, S.; Erkut, E. Optimal ambulance location with random delays and travel times. Health Care Manag. Sci. 2008, 11, 262–274. [Google Scholar] [CrossRef] [PubMed]
- Jagtenberg, C.J.; Bhulai, S.; van der Mei, R.D. An efficient heuristic for real-time ambulance redeployment. Oper. Res. Health Care 2015, 4, 27–35. [Google Scholar] [CrossRef] [Green Version]
- Revelle, C.; Hogan, K. The maximum reliability location problem and α-reliablep-center problem: Derivatives of the probabilistic location set covering problem. Ann. Oper. Res. 1989, 18, 155–173. [Google Scholar] [CrossRef]
- Shariat-Mohaymany, A.; Babaei, M.; Moadi, S.; Amiripour, S.M. Linear upper-bound unavailability set covering models for locating ambulances: Application to Tehran rural roads. Eur. J. Oper. Res. 2012, 221, 263–272. [Google Scholar] [CrossRef]
- Chanta, S.; Mayorga, M.E.; McLay, L.A. Improving emergency service in rural areas: A bi-objective covering location model for EMS systems. Ann. Oper. Res. 2014, 221, 133–159. [Google Scholar] [CrossRef]
- Moeini, M.; Jemai, Z.; Sahin, E. Location and relocation problems in the context of the emergency medical service systems: A case study. Cent. Eur. J. Oper. Res. 2015, 23, 641–658. [Google Scholar] [CrossRef]
Figure 1.
Procedures of the dynamic floating stations model (DFSM).

Figure 2.
Travel distance distributions for Sanchong and Snow Mountain stations. (x: meters, y: frequency).
Figure 2.
Travel distance distributions for Sanchong and Snow Mountain stations. (x: meters, y: frequency).

Figure 3.
Nontraffic-related emergency medical services (EMS) (left) and traffic-related EMS (right) incidents for Sanchong and Luzhou districts.
Figure 3.
Nontraffic-related emergency medical services (EMS) (left) and traffic-related EMS (right) incidents for Sanchong and Luzhou districts.

Figure 4.
EMS incident frequencies for weekdays (a) and hours of the day (b) for Sanchong and Luzhou districts.
Figure 4.
EMS incident frequencies for weekdays (a) and hours of the day (b) for Sanchong and Luzhou districts.

Figure 5.
The four new floating stations suggested, with existing fire stations and uncovered EMS points with a capacity of 100 incidents per year during peak periods.
Figure 5.
The four new floating stations suggested, with existing fire stations and uncovered EMS points with a capacity of 100 incidents per year during peak periods.

Figure 6.
The four new floating stations suggested, with existing fire stations and uncovered EMS points with a capacity of 150 incidents per year during peak periods.
Figure 6.
The four new floating stations suggested, with existing fire stations and uncovered EMS points with a capacity of 150 incidents per year during peak periods.


Table 1.
Study area descriptions (unit: number of incidents).
| Study Area (A) | New Taipei City (B) | (A/B) % | |
|---|---|---|---|
| Area km2 | 23.76 | 2052.57 | 1.158% |
| Population | 587,306 | 3,986,911 | 14.731% |
| Number of fire stations | 7 | 69 | 10.145% |
| Number of ambulances | 16 | 125 | 12.800% |
| EMS records | 644,544 | ||
| EMS with locations | 101,609 | 636,395 | 15.966% |
| Yearly average for stations | 3629 | 2306 | 157.383% |
| Yearly average of ambulances | 1588 | 1273 | 124.737% |
| Traffic-related EMS | 31,027 | 188,286 | 16.479% |
| Yearly average for stations | 1108 | 682 | 162.432% |
| Yearly average of ambulances | 485 | 377 | 128.739% |
| Weekday EMS | 22,859 | 139,383 | 16.400% |
| Yearly average for stations | 816 | 505 | 161.658% |
| Yearly average of ambulances | 357 | 279 | 128.126% |
| Weekday peak hours EMS | 6616 | 42,527 | 15.557% |
| Yearly average for stations | 236.29 | 154.08 | 153.349% |
| Yearly average of ambulances | 103 | 85 | 121.540% |
| Average travel distance intervals for all EMS of each fire station | |||
| 700 m | 7.506% | 7.020% | |
| 800 m | 7.651% | 6.984% | |
| 900 m | 7.795% | 6.906% | |
| Greater than 5 km | 0.677% | 1.721% | |
| Greater than 10 km | 0.100% | 0.187% | |
| Greater than 15 km | 0.001% | 0.023% | |
| Average travel distance | |||
| All EMS | 1162.45 | 1302.40 | 89.254% |
| Traffic-related EMS | 1233.51 | 1424.57 | 80.344% |
| Weekday peak hours EMS | 1091.73 | 1458.88 | 74.834% |
Table 2.
Results of the four floating stations installed.
| Before | 1 Floating Station | 2 Floating Stations | 3 Floating Stations | 4 Floating Stations | |
|---|---|---|---|---|---|
| Using capacity 100 | |||||
| EMS uncovered | 4181 | 3845 | 3518 | 3262 | 2888 |
| % | 68.925% | 63.386% | 57.995% | 53.775% | 47.610% |
| EMS covered | 1885 | 2221 | 2548 | 2804 | 3178 |
| % | 31.075% | 36.614% | 42.005% | 46.225% | 52.390% |
| Increase covered | 336 | 327 | 256 | 374 | |
| % | 5.539% | 5.391% | 4.220% | 6.166% | |
| Radius | 400 | 400 | 400 | 600 | |
| Using capacity 150 | |||||
| EMS uncovered | 3241 | 2678 | 2188 | 1624 | 1037 |
| % | 53.429% | 44.148% | 36.070% | 26.772% | 17.095% |
| EMS covered | 2825 | 3388 | 3878 | 4442 | 5029 |
| % | 46.571% | 55.852% | 63.930% | 73.228% | 82.905% |
| Increase covered | 563 | 490 | 564 | 587 | |
| % | 9.281% | 8.078% | 9.298% | 9.677% | |
| Radius meters | 600 | 600 | 700 | 1200 |
Note: Data from the Fire Department of New Taipei City Government.
© 2020 by the authors. Licensee MDPI, Basel, Switzerland. This article is an open access article distributed under the terms and conditions of the Creative Commons Attribution (CC BY) license (http://creativecommons.org/licenses/by/4.0/).
Share and Cite
MDPI and ACS Style
Sun, C.-H.; Cheng, C.-Y.; Wang, C.-H.; Hsiao, P.-H. Dynamic Floating Stations Model for Emergency Medical Services with a Consideration of Traffic Data. ISPRS Int. J. Geo-Inf. 2020, 9, 336. https://doi.org/10.3390/ijgi9050336
AMA Style
Sun C-H, Cheng C-Y, Wang C-H, Hsiao P-H. Dynamic Floating Stations Model for Emergency Medical Services with a Consideration of Traffic Data. ISPRS International Journal of Geo-Information. 2020; 9(5):336. https://doi.org/10.3390/ijgi9050336
Chicago/Turabian StyleSun, Chih-Hong, Chen-Yang Cheng, Cheng-Hui Wang, and Po-Huan Hsiao. 2020. "Dynamic Floating Stations Model for Emergency Medical Services with a Consideration of Traffic Data" ISPRS International Journal of Geo-Information 9, no. 5: 336. https://doi.org/10.3390/ijgi9050336
Note that from the first issue of 2016, this journal uses article numbers instead of page numbers. See further details here.