Article

Role of Potassium Substitution in the Magnetic Properties and Magnetocaloric Effect in La0.8−xKxBa0.05Sr0.15MnO3 (0 ≤ x ≤ 0.20)

by
Dhawud Sabilur Razaq
1,
Budhy Kurniawan
1,*,
Dicky Rezky Munazat
1,
Kazumitsu Watanabe
2 and
Hidekazu Tanaka
2
1
Department of Physics, Universitas Indonesia, Depok 16424, Indonesia
2
Department of Physics, Tokyo Institute of Technology, Meguro-Ku, Tokyo 152-8551, Japan
*
Author to whom correspondence should be addressed.
Crystals 2020, 10(5), 407; https://doi.org/10.3390/cryst10050407
Submission received: 19 April 2020 / Revised: 11 May 2020 / Accepted: 16 May 2020 / Published: 19 May 2020
(This article belongs to the Special Issue Magnetocalorics)

Abstract

:
The magnetic and magnetocaloric effects of potassium-substituted La0.8−xKxBa0.05Sr0.15MnO3 (0 ≤ x ≤ 0.20) manganite were explored. The samples in polycrystalline form were synthesized by the sol–gel method, with a final sintering temperature of 1100 °C. Powder X-ray diffraction (XRD) patterns refined by Rietveld refinement show that all samples crystallized in rhombohedral structure with R-3c space group. The unit cell volume of the samples decreases with increasing potassium concentration. In addition, small changes in average bond length and bond angle are also observed in the samples. Scanning electron microscope (SEM) images reveal that the largest average grain size was observed for x = 0.10. Field-cooled (FC) magnetization measurements show that the Curie temperature ( T C ) of the samples increases from 320 K for x = 0 to 360 K for x = 0.2. The largest magnetocaloric (MCE) effect, which is represented by maximum magnetic entropy change (− Δ S M ,   M A X ), reaches its greatest value for the x = 0.10 sample. The monotonous increase in T C suggests that TC is mainly governed by the ferromagnetic coupling between Mn ions induced by the changes on average bond length and bond angle. The obtained − Δ S M ,   M A X value suggests that MCE property is more sensitive to Zener theory of double exchange, which is strongly related to the Mn3+/Mn4+ ratio of the samples.

1. Introduction

The demand for alternative refrigerant technology has significantly increased in the last decade. This is due to the use of harmful substances in conventional vapor compression technology, which is also involved in the ozone depletion phenomenon. To overcome this issue, magnetic refrigerant technology has been proposed and developed. Magnetic refrigerant technology uses the principle of the magnetocaloric effect (MCE) property of ferromagnetic materials [1]. MCE can be defined as the ability of ferromagnetic materials to change its temperature in the presence of an external magnetic field [1]. This makes MCE an environmentally friendly technology and, thus, can contribute to limit the use of harmful substances in the refrigerant system. MCE property of ferromagnetic materials can be represented by two expressions which are magnetic entropy change ( Δ S M ) and adiabatic temperature change ( Δ T a d ) [2]. These two expressions arise from two different methods, which were used to observe the magnitude of the MCE property [3]. Of these two expressions, Δ S M is usually the most used expression in research on the MCE property, due to the simplicity of the experimental set up.
The main objective in researching the MCE property of ferromagnetic materials is finding a material that has a large Δ S M value. Additionally, this large Δ S M value needs to occur at near room temperature with a sufficiently large Relative Cooling Power (RCP) value. RCP value can be defined as the efficiency of the MCE property. Large RCP values indicate the working temperature range of the magnetocaloric material without losing more than 50% of its maximum Δ S M value. In the beginning, pure Gd metals and Gd-based alloys were found to exhibit large Δ S M values near room temperature [4,5]. However, the expensive cost of Gd (4000 $/kg) sets a limitation on the development of magnetic refrigerant technology. To overcome this limitation, exploration to find another possible candidate for magnetocaloric materials, such as MnAs-based alloys, LaFeSi alloys, and LaMnO3 (LMO)-based compounds, has been conducted [6,7,8]. Among these groups, LMO-based compounds have been demonstrated to possess unique properties that are not found in the other mentioned candidates, including colossal magnetoresistance (CMR), microwave absorbance, and solid oxide fuel cells (SOFC) [9,10,11]. Additionally, its high chemical stability and simple sample preparation method have led to an increase in the interest in further studying the MCE property of this material [12,13,14,15].
Currently, optimization in Δ S M value is the main objective in research regarding the MCE property of LMO-based compounds. In LMO-based compounds, there are several factors that can be regarded as the reason behind the increase in the Δ S M value. These factors are the Mn3+/Mn4+ ratio, average A-site ionic radius ( < r A > ), and A-site cationic mismatch ( σ 2 ). According to previous research, the Δ S M value of LMO-based compounds is expected to increase until the value of Mn3+/Mn4+ ratio reaches around 7/3 or 2/1 [16,17]. Beyond this ratio, the Δ S M value is expected to decrease monotonously as Mn4+ content increases. Examples of this can be found in La1−xCaxMnO3 and La1−xSrxMnO3 [18,19]. On the other hand, there are several cases where Δ S M value increases with the increase in < r A > and σ 2 . Examples of this can be seen in La0.6Ca0.4−xSrxMnO3, La0.7−xDyxCa0.3MnO3, and La0.5Ca0.5−xPbxMnO3 [20,21,22]. However, special consideration is needed when dealing with a more complex LMO-based compounds, especially potassium (K+)-substituted LMO-based compounds. This is due to the fact that monovalent ion converts twice the amount of Mn3+ to Mn4+ ion and the fact that K+ ion has the largest ionic radius among monovalent ions, which is commonly substituted to LMO-based compounds [23,24,25,26]. There have been some cases where substitution of K+ ion increased the maximum Δ S M value of LMO-based compounds. Examples of this can be seen in La0.7Sr0.2M0.1MnO3 (M = Na, K), La0.7M0.2M’0.1MnO3 (M = Sr, Ba and M’ = Na, Ag, K), and La0.75Ba0.1M0.15MnO3 (M = Na, Ag, and K) [27,28,29]. On the other hand, there have been several cases where substitution of K+ ion reduced the maximum Δ S M value of LMO-based compounds. Examples of this can be seen in La0.8Ag0.2−xKxMnO3 and La0.65M0.3M’0.05MnO3 (M = Ba, Ca and M’ = Ba, Ag, K) [30,31]. The mentioned results show that the main factor behind the evolution of Δ S M value in K+ ion substituted LMO-based compounds is still open to debate.
To investigate the most dominant factor behind the changes in the Δ S M value of a K+ ion substituted LMO-based compounds, a comprehensive study on the MCE property of La0.8−xKxBa0.05Sr0.15MnO3 (0 ≤ x ≤ 0.20) was performed. La0.8Ba0.05Sr0.15MnO3 was chosen to be the parent compound, because the combination of Ba and Sr ions in La-Ba-Sr-MnO3 compound is less studied than other substituted LMO-based compounds such as La-Ba-Ca-MnO3 and La-Ca-Sr-MnO3 [4,8,32]. Additionally, the combination of Ba and Sr ions in the A-site of perovskite structure has the potential to exhibit a large Δ S M value in perovskite manganite compounds. This is proved by the results obtained by Phan et al. in La0.6Ba0.2Sr0.2MnO3 ( Δ S M = 2.26 J/kg K at 1 T), Banik et al. in Pr0.7Ba0.16Sr0.14MnO3 ( Δ S M = 4.80 J/kg K at 5 T), and Pham et al. in Pr0.7Ba0.1Sr0.2MnO3 ( Δ S M = 5.67 J/kg K at 5 T) [33,34,35]. Additionally, the composition of Ba ion was determined to be less than Sr ion with the expectation that the resulting compound will demonstrate a large Δ S M value as seen in Pr0.7Ba0.1Sr0.2MnO3. With a constant composition of divalent ions (Ba2+ and Sr2+), the substitution of La3+ ion by K+ ion in La0.8−xKxBa0.05Sr0.15MnO3 will increase the population of Mn4+ ion while simultaneously decreasing the population of Mn3+ ion to preserve charge neutrality. This condition will affect the Mn3+/Mn4+ ratio of the samples. Additionally, the large ionic radius of K+ ion will ensure that < r A > (< r A > =   x i   r i ; x i is the fractional occupancy of A-site ions and r i is the corresponding ionic radius) and σ 2 ( σ 2 = < r A 2 > − < r A >2; < r A 2 > =   x i   r i 2 ) will only increase as the concentration of K+ ion increases. This experimental setup will help to investigate which of the mentioned factors (Mn3+/Mn4+ ratio, < r A >, and σ 2 ) that is more dominant in affecting the evolution of Δ S M value in La0.8−xKxBa0.05Sr0.15MnO3 (0 ≤ x ≤ 0.20).

2. Materials and Methods

Polycrystalline La0.8−xKxBa0.05Sr0.15MnO3 (0 ≤ x ≤ 0.20) samples, denoted as LKBS-0 (x = 0), LKBS-05 (x = 0.05), LKBS-10 (x = 0.10), LKBS-15 (x = 0.15), and LKBS-20 (x = 0.20) in powder form were prepared using the sol–gel method. A stoichiometric amount of La2O3, KNO3, BaNO3, SrNO3, Mn(NO3)2·4H2O, and C6H8O7·H2O were initially dissolved in double-distilled water. In this experiment, La2O3 needs to be converted into nitrate form by reacting with nitric acid. Citric acid was used in the present work as a metal ion complexant and as a fuel during the combustion process. The amount of citric acid can be calculated from the ratio of citric acid (CA) to total metal nitrate (MN) equal to 1:1.2 [36,37]. All the dissolved precursors were mixed together into a single solution and then heated until the temperature of the solution reaches 80 °C. Afterward, the pH of the solution was adjusted until it reaches around 7 by adding ammonium solution, and then the solution was left to evaporate under constant stirring until a viscous gel is formed. The resulting gel was dehydrated until a dried gel was formed and then calcined at 550 °C to liberate the organic compound inside the gel. Pre-calcination was done at 900 °C to make sure there was no organic compound left in the sample. The powder samples were pressed into a pellet with axial pressure about 10 tons for approximately 10 min in order to obtain a square-shaped bulk with 12 mm sides. Sample preparation was completed with sintering process at 1100 °C for 12 h.
The crystal structure and phase purity of the samples were examined using powder X-ray Diffraction (XRD) using Cu-kα radiation (λ = 1.54059 Å) at room temperature. The diffraction angle was recorded in an angular range from 10° to 90° with a step size of 0.02°. In the present work, the Rietveld refinement process was carried out using the General Structure and Analysis software II (GSAS-II) [38]. The morphology of the samples was examined with a scanning electron microscope (SEM). The chemical composition, as well as its distribution, was examined using Energy Dispersive X-ray (EDX) with the elemental mapping method. The magnetic properties of the sample were determined using magnetic properties measurement system (MPMS).

3. Results

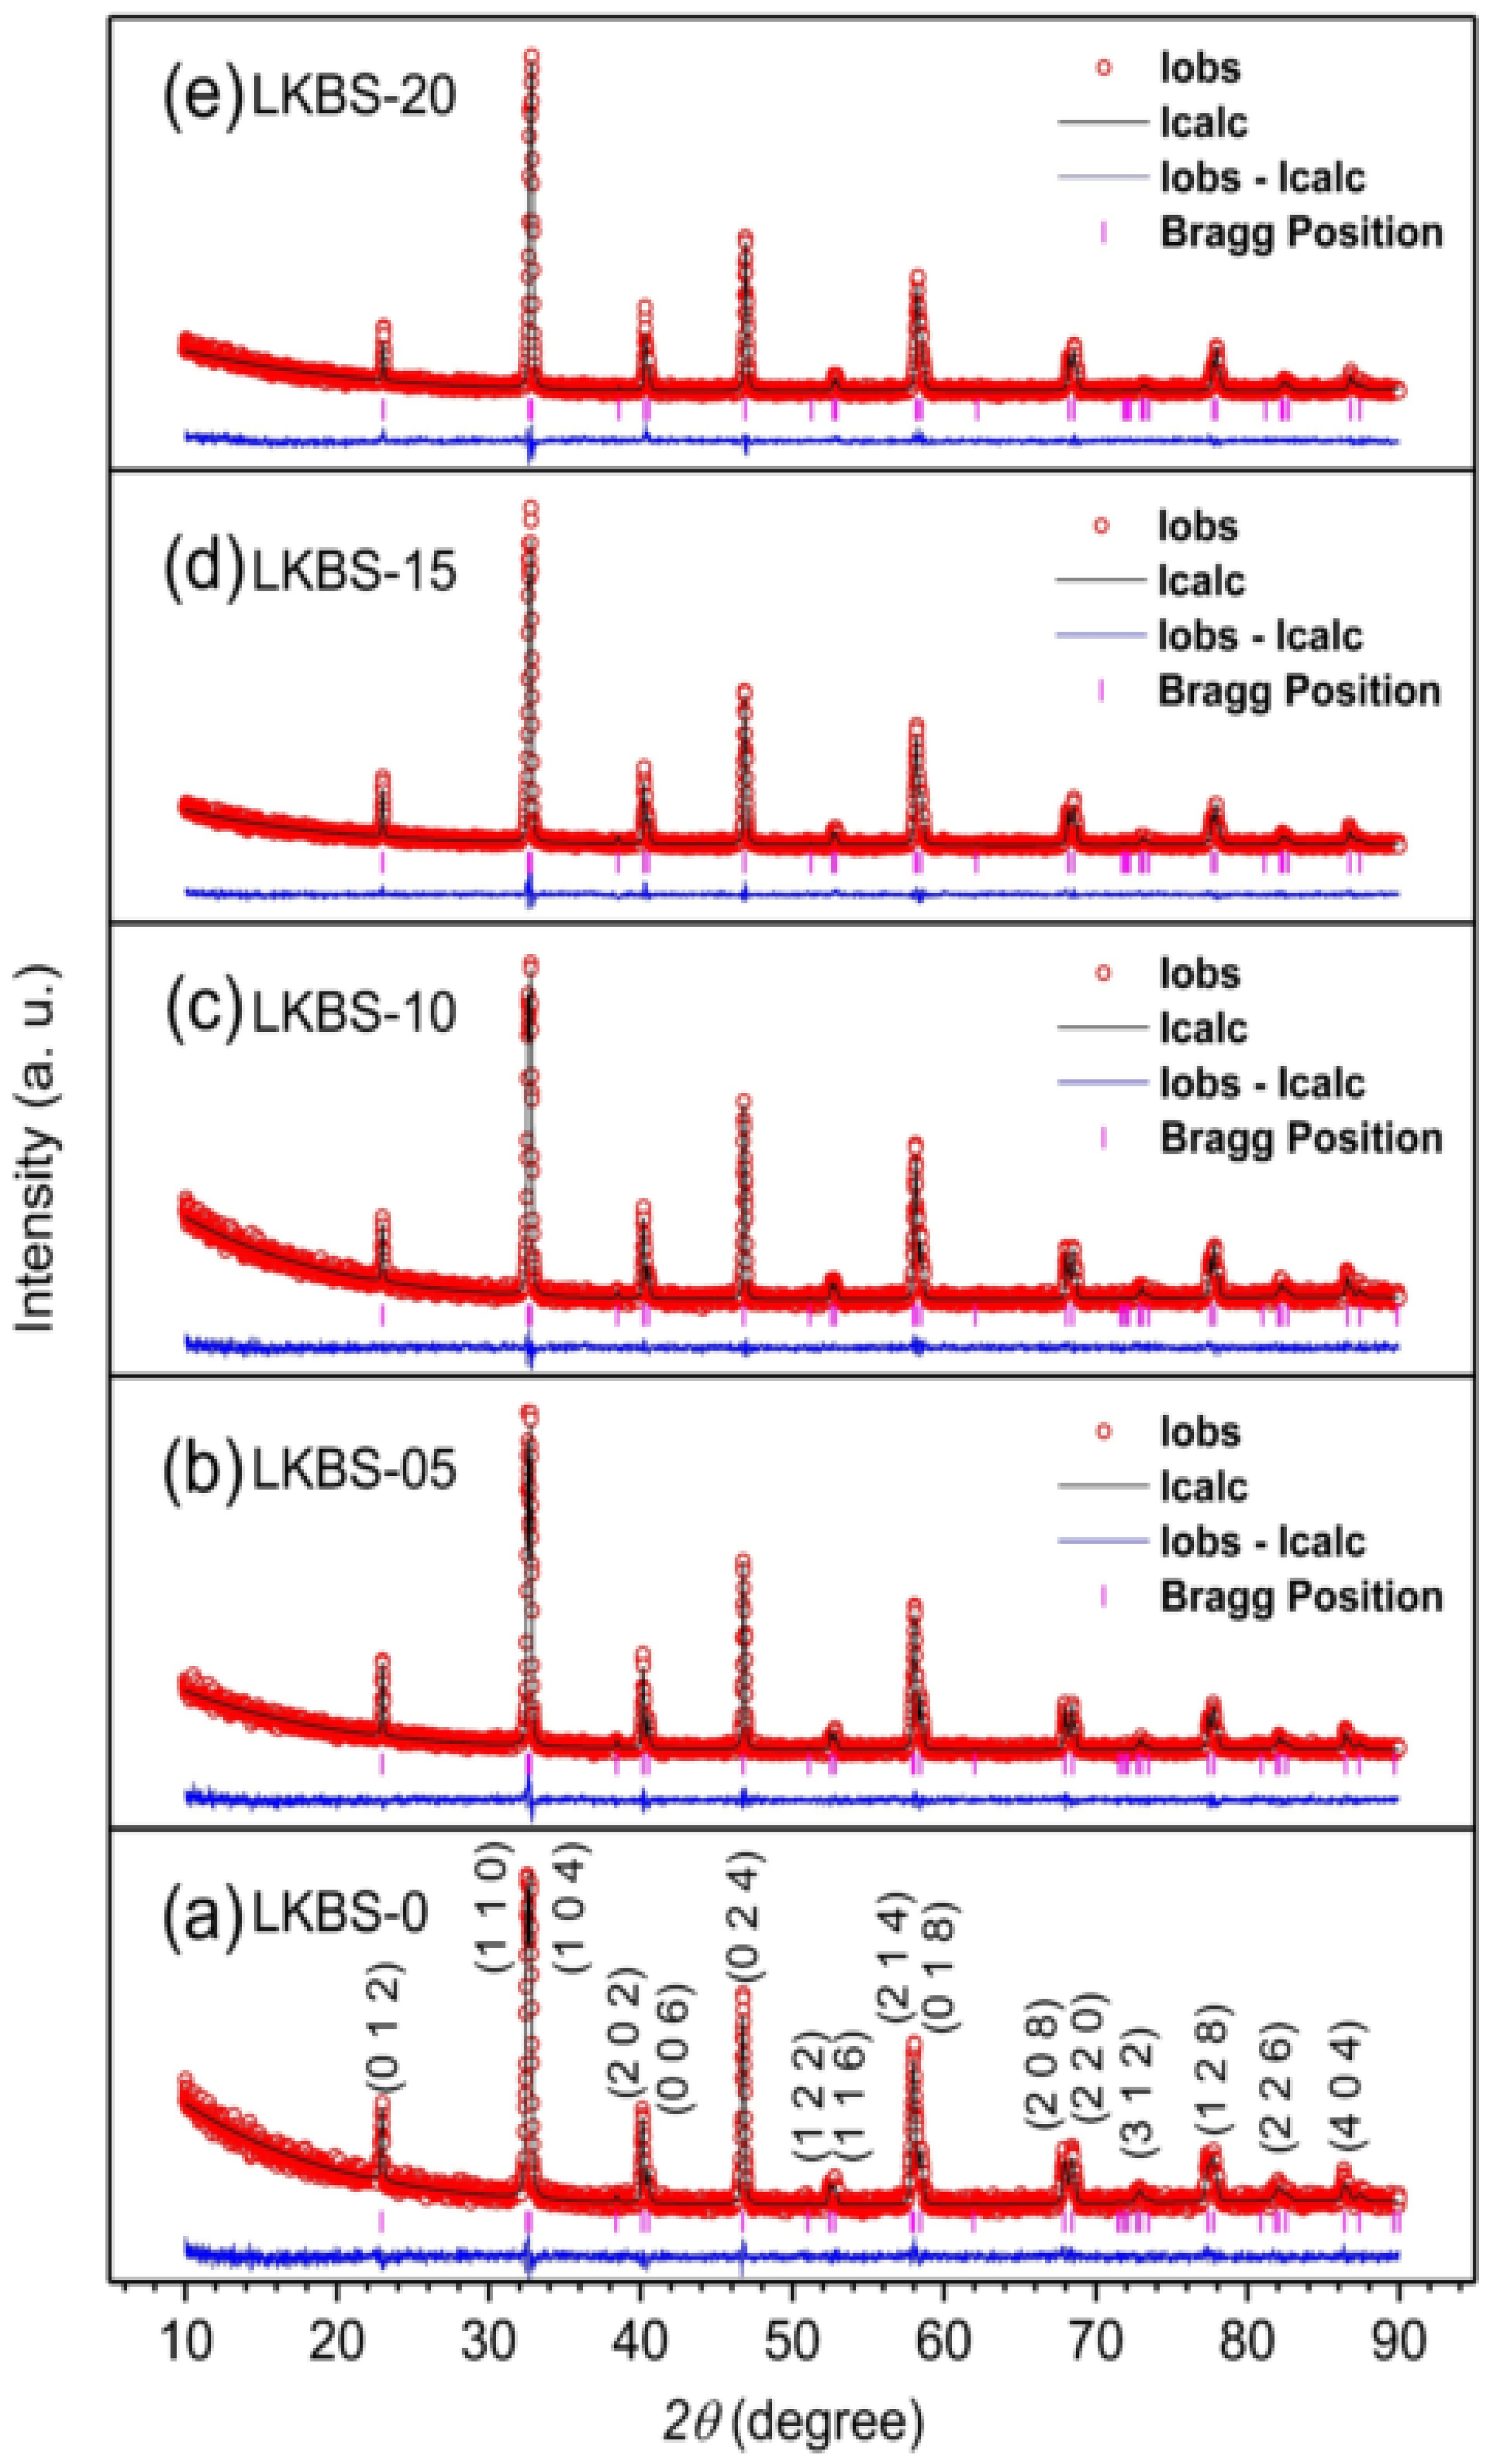
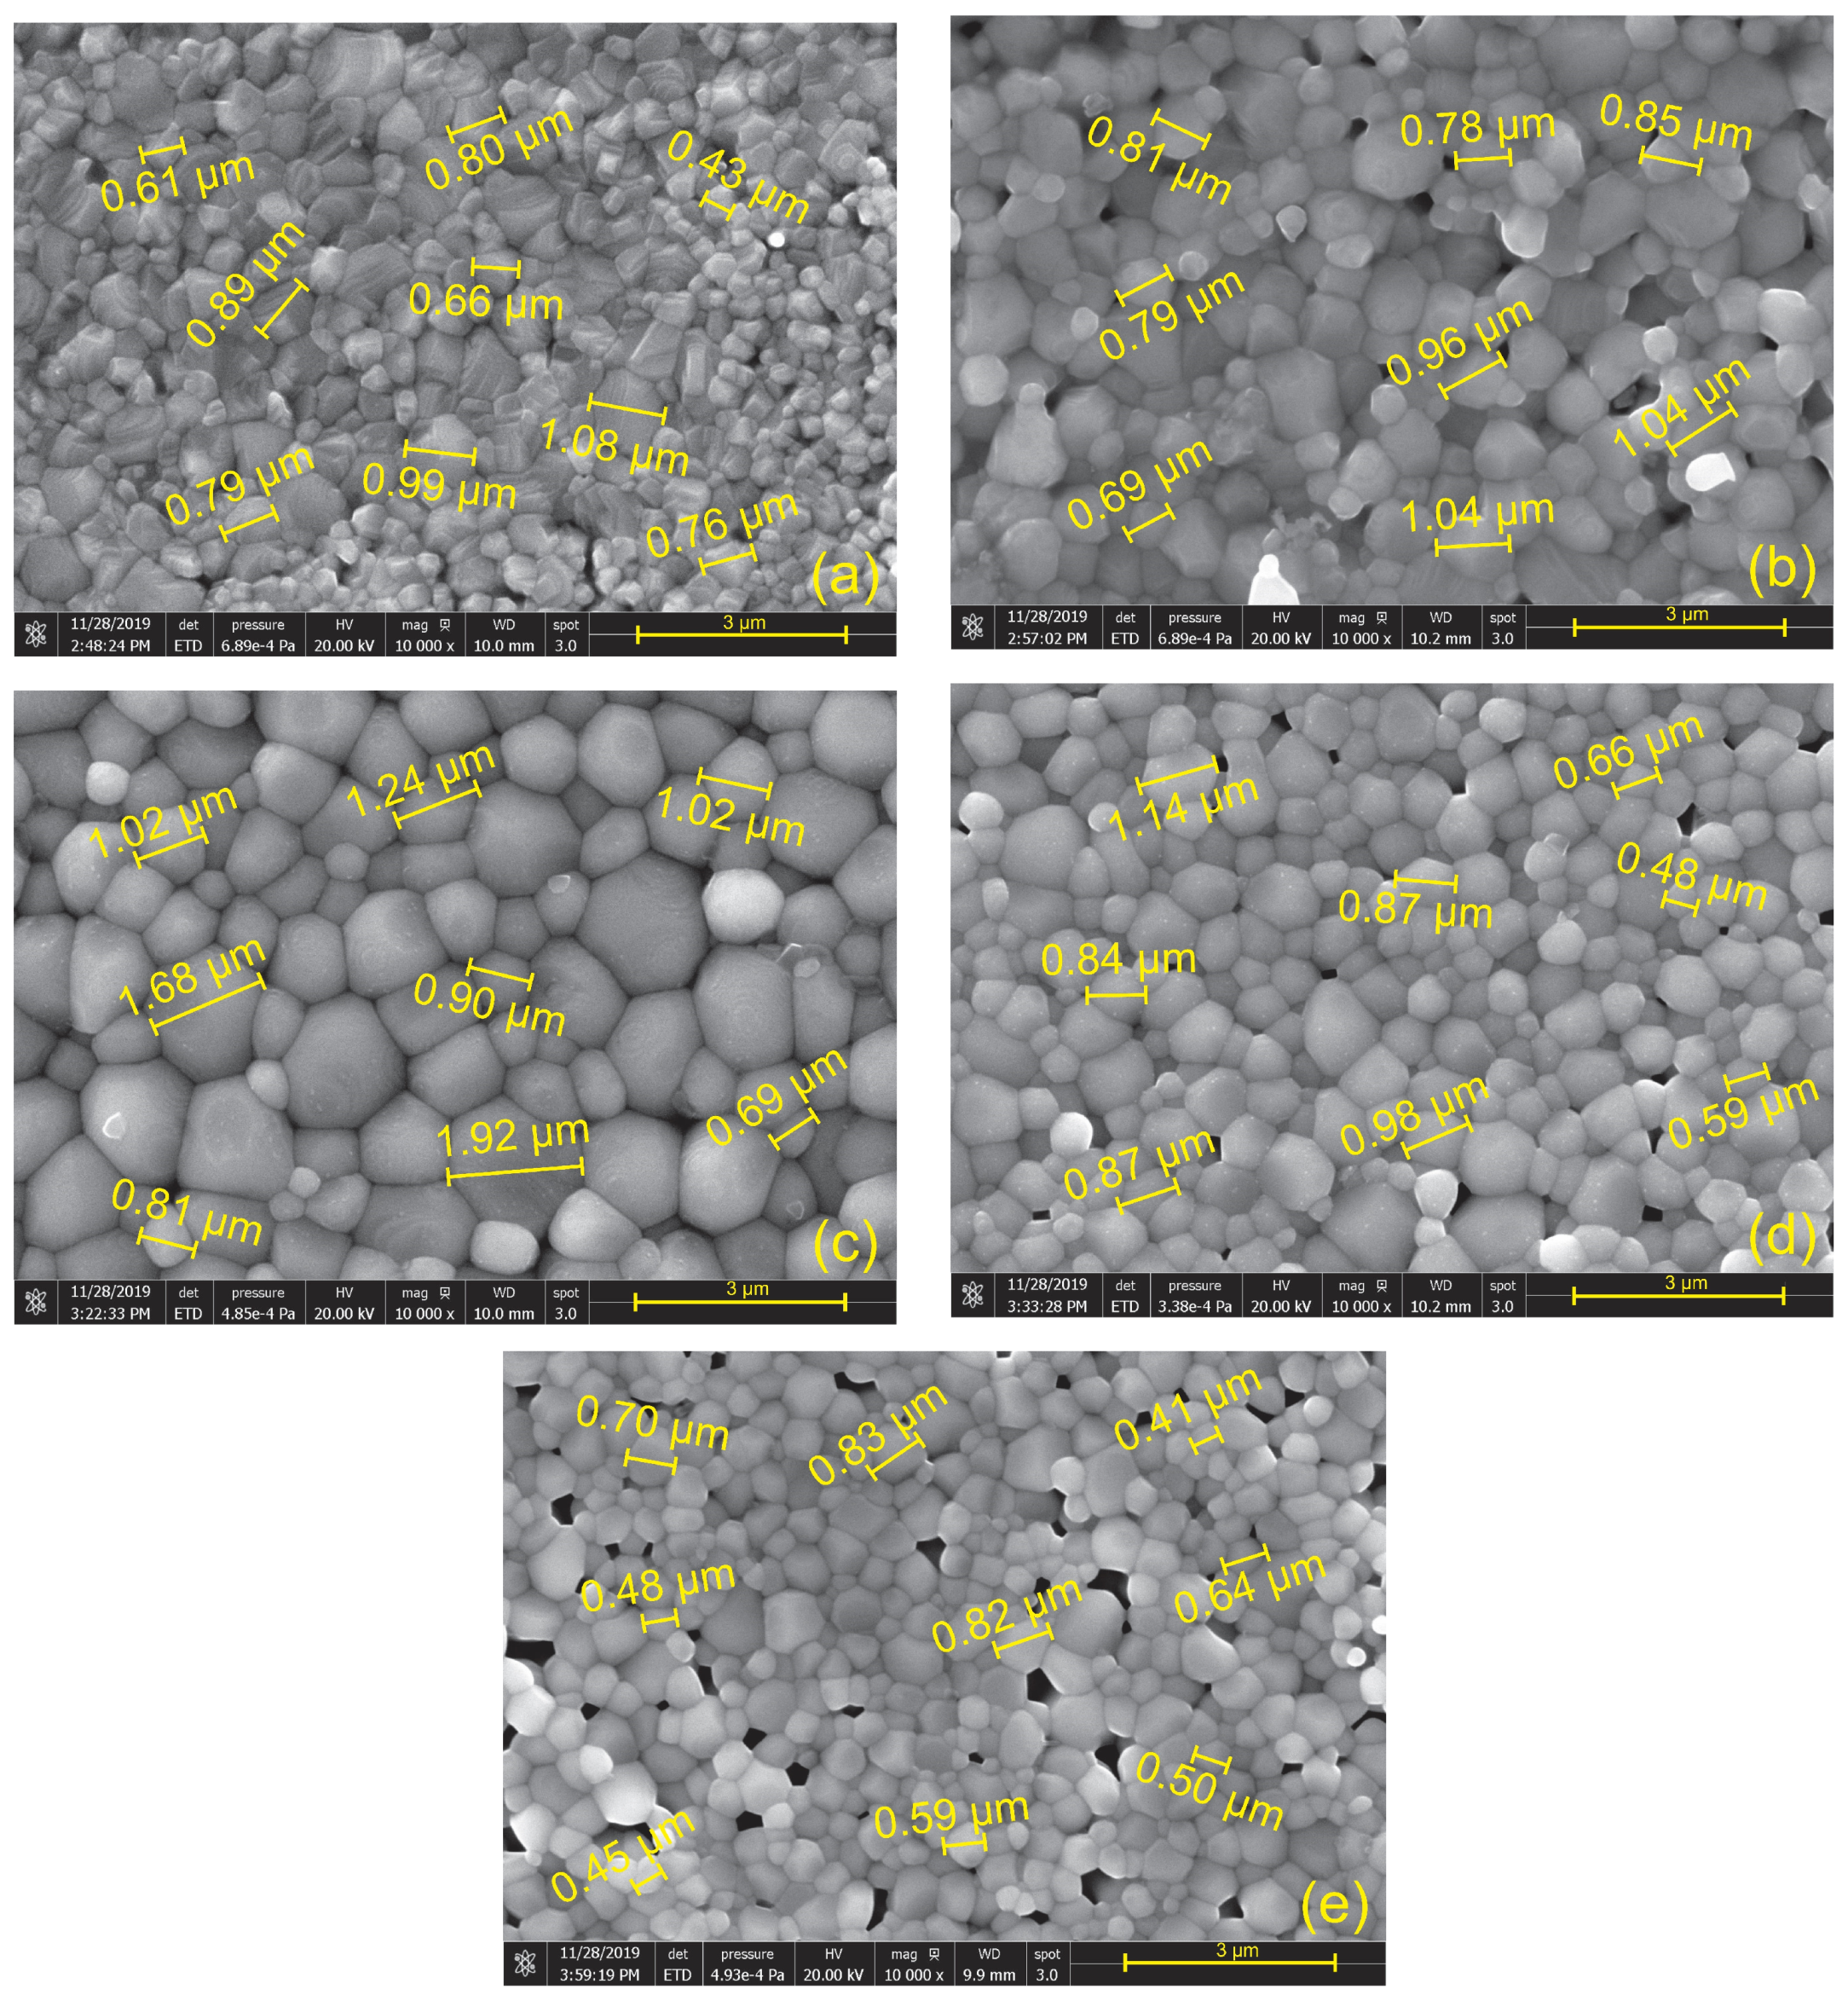
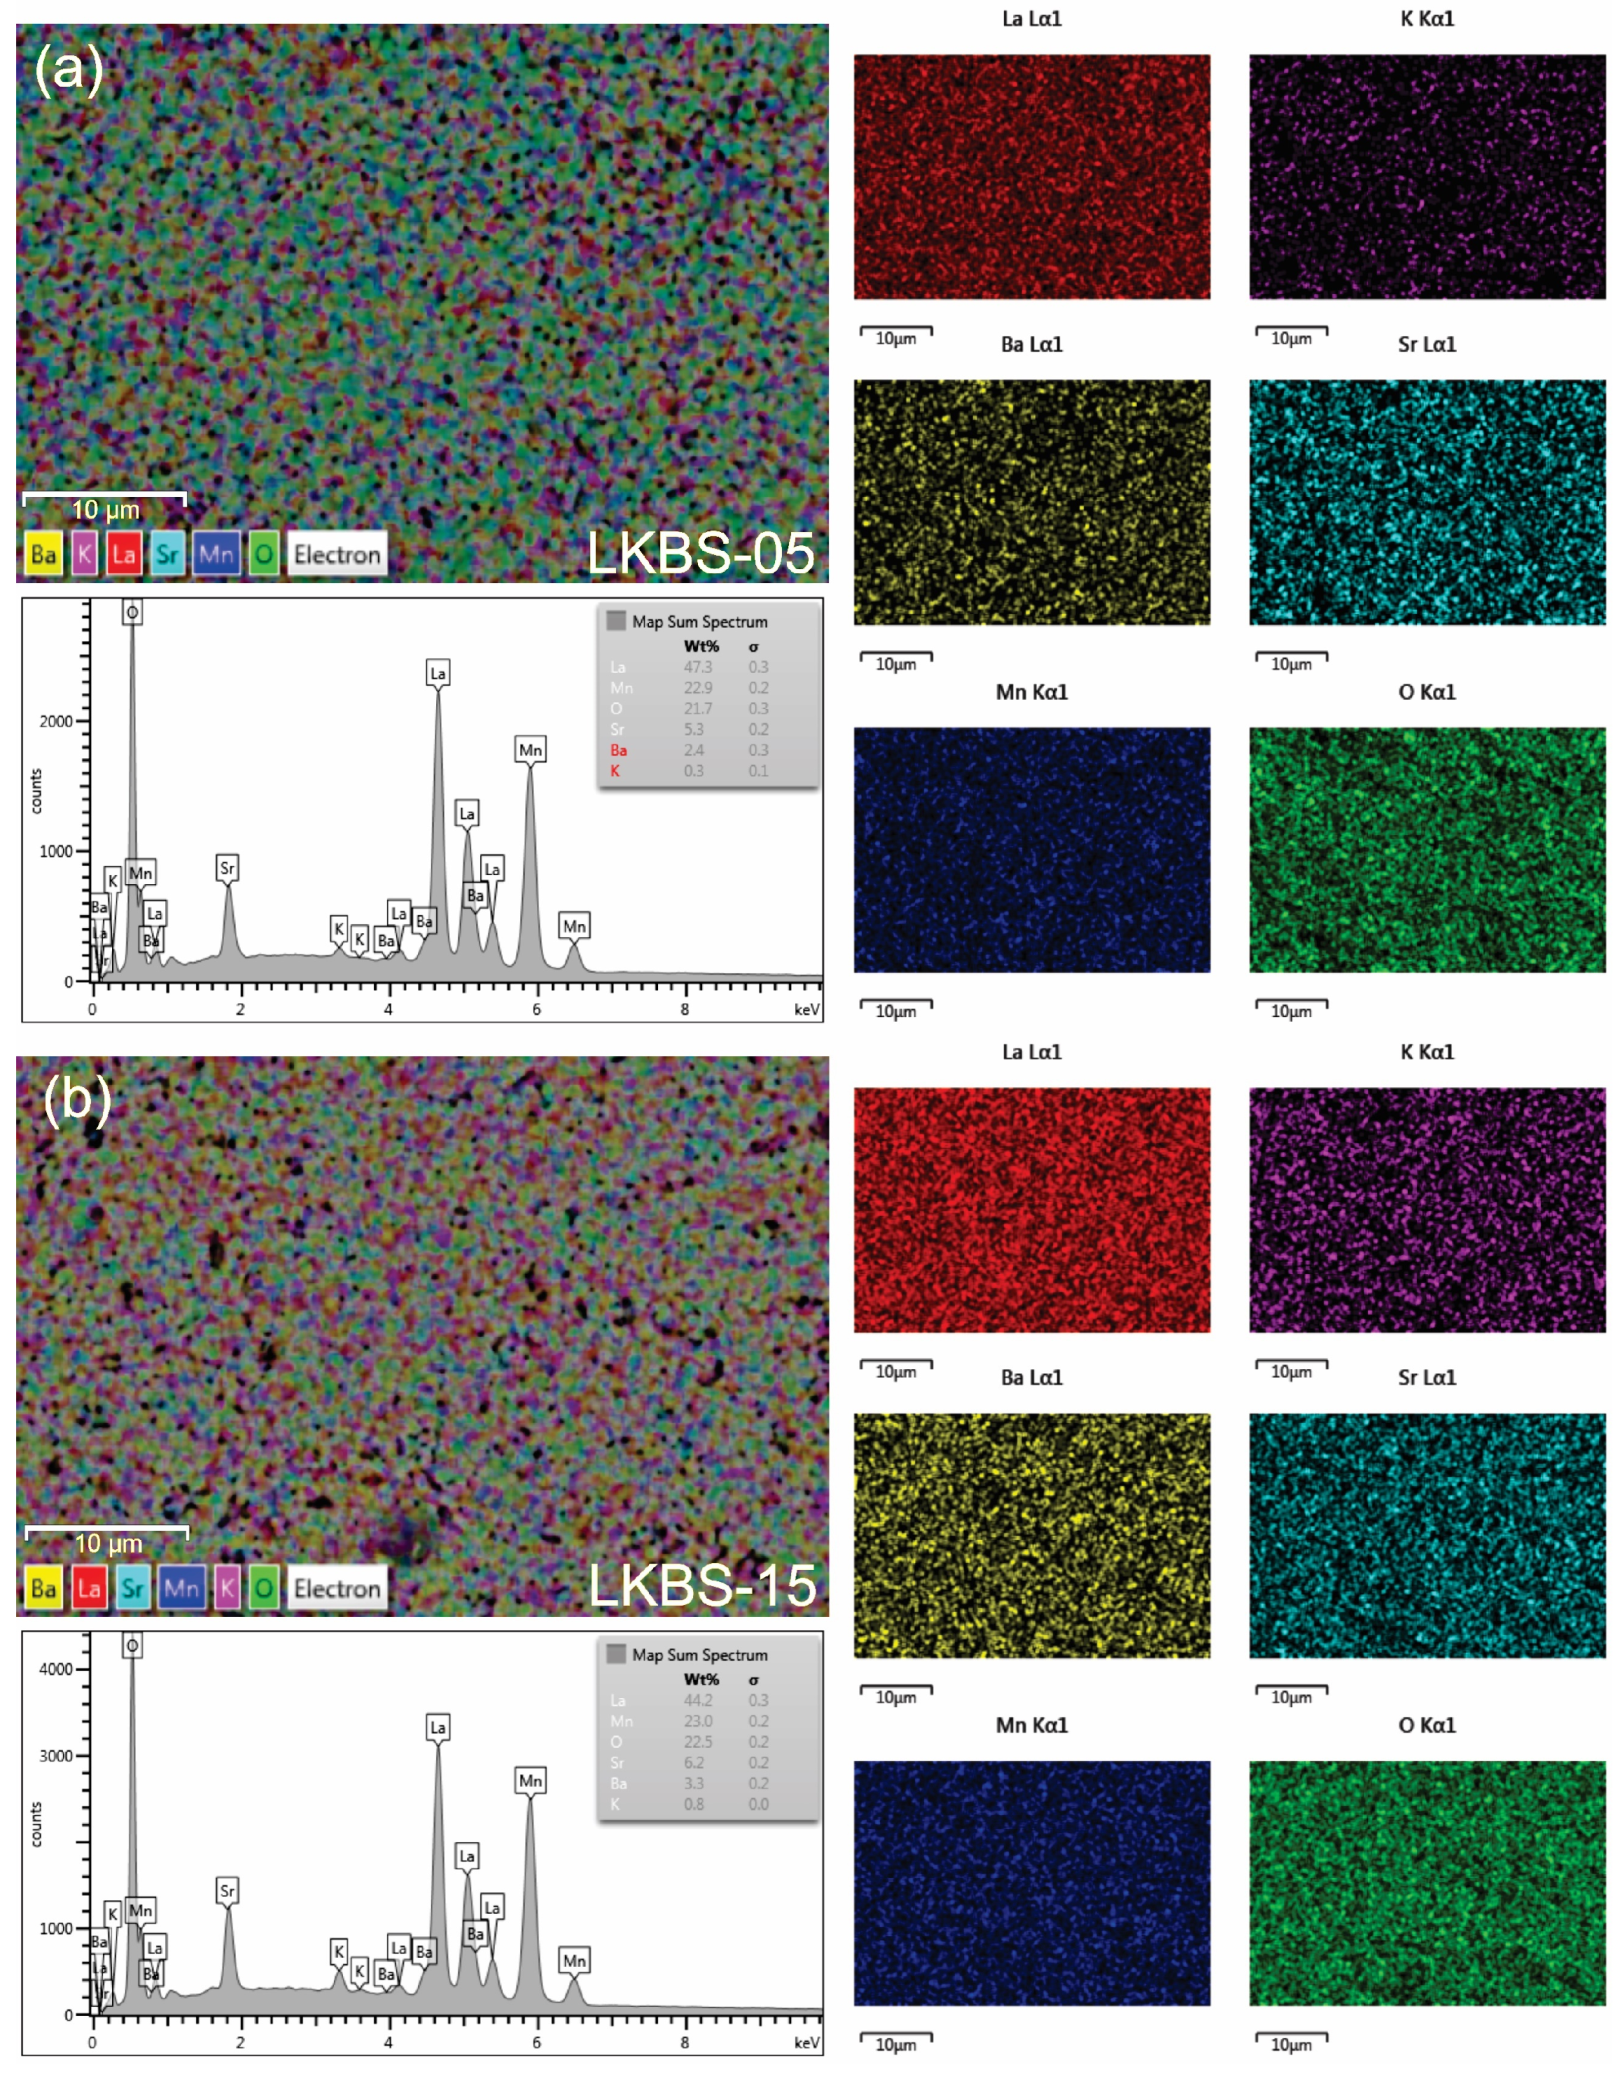
3.1. Structural and Morphology Analysis

The powder diffraction patterns of La0.8−xKxBa0.05Sr0.15MnO3 (0 ≤ x ≤ 0.20) samples measured at room temperature are shown in Figure 1. There is almost no significant difference in the powder diffraction pattern of samples that were substituted by K+ ion. This implies that substituting up to 20% K+ ion into the samples does not affect the crystal structure of the samples. This argument is also supported by the result of the Rietveld refinement process, which shows that the Miller indices of all the samples belong to the rhombohedral structure with R-3c space group. Furthermore, Rietveld refinement process also proves that all samples are single phase without any detectable impurities. The structural parameters obtained through the Rietveld refinement process are listed in Table 1.
Substitution with K+ ion is observed to slightly reduce the unit cell volume. This can be correlated with the increasing concentration of Mn4+ ion, which has the smallest ionic radius within the samples, due to the substitution of La3+ by K+ ion. Similar cases where the unit cell volume of LMO-based compounds decreased due to substitution by larger ion have been observed by Shaikh and Varshney in La1−xKxMnO3 (x = 0.1; 0.125; and 0.15) compounds and Chebanee et al. in La0.65Ce0.05Sr0.3Mn1−xCuxO3 (0 ≤ x ≤ 0.15) compounds [39,40]. Substitution by K+ ion also increases the < r A > from 1.243 to 1.310 for LKBS-0 and LKBS-20, respectively. This, in turn, causes the values of Goldschmidt tolerance factor, t G , and σ 2 to have an increasing trend from 0.930 to 0.965 and 3.833 × 10⁻³ to 18.101 × 10⁻³, respectively.
The average crystallite size of all samples was calculated using two different methods, namely the Scherrer method and the Williamson-Hall method. The calculation of the average crystallite from the Scherrer method can be performed by following the equation given as [41]:
C S C H = 0.9   λ β cos θ
where C S C H is the average crystallite size from the Scherrer method, λ is the wavelength of Cu-K α radiation (1.5406 Å), θ is the corresponding diffraction peaks from powder diffraction patterns, and β is the full-width at half maximum (FWHM) of each corresponding diffraction peaks. In the present work, only the prominent peaks were used to calculate the β cos θ value. Alternatively, the calculation of average crystallite size can also be performed using the W-H plot. The average crystallite size can be obtained from the linear fit of the 4 sin θ versus β cos θ graph according to the following equation [42]:
β cos θ = 0.9   λ C W H + 4 ε sin θ
where   C W H is defined as the average crystallite size from W-H method, β is defined as β = β e x p 2 β s 2 . Here, β e x p is the FWHM estimated from powder diffraction pattern and β s is the FWHM of a standard silicon sample. The intercept with the y-axis will show the value of average crystallite size ( C W H ), and the gradient of the slope will show the strain effect ( ε ) on the crystallites. The average crystallite size calculated using the Scherrer method and the W-H plot is listed in Table 1. The average crystallite size obtained from the W-H plot is larger compared to that obtained from the Scherrer method. This is due to the fact that the Scherrer method excludes the effect of strain and instrumental broadening on the crystallite of the sample. The obtained C S C H and C W H values are listed in Table 1.
Figure 2 shows the typical SEM images for La0.8−xKxBa0.05Sr0.15MnO3 samples in the secondary electron (SE) mode. It can be seen that there is an increasing trend of grain size for sample LKBS-0, LKBS-05, and LKBS-10. However, the grain sizes of LKBS-15 and LKBS-20 are smaller compared to LKBS-10. A similar case where larger grain size exists due to K+ ion substitution has been reported by Thaljaoui et al. in Pr0.6Sr0.4−xKxMnO3 and Jerbi et al. in Pr0.55Sr0.45−xKxMnO3 [43,44]. Figure 2 also reveals the fact that the observed grain size varies between 0.4 μm and 1.92 μm.
The difference in the crystallite size and the grain size observed from SEM measurement can be explained in terms of the method to determine the crystallite size of the sample. Zhou and Greer mentioned that the calculation of crystallite size from powder diffraction pattern will be in good agreement with the grain size observed from an electron microscope (either SEM or TEM) when the particle size of the sample is within the nanometer scale [45]. This is clearly not the case in the present work. Additionally, Uvarov and Popov also proved that in cases where two different crystal sizes exist—big crystals several microns in size and small crystals with a size of around 100 nm—the powder diffraction pattern would tend to detect only the presence of the small crystals [46]. Although the crystallite size of the samples reaches a resolution that can be detected through SEM measurement, it can be seen that the smallest grain size that can be seen in Figure 2 is 0.4 μm. This result indicates that each grain observed with SEM measurement comprises a secondary grain, which has aggregated into a single large grain. To determine this secondary grain, more sophisticated measurements, such as Atomic Force Microscopy (AFM) and Lateral Force Microscopy (LFM), will be needed [47].
To confirm the existence of K+ ion in the samples, EDX analysis together with elemental mapping analysis was performed. The elemental maps for each sample also demonstrate that each element is distributed evenly in the samples, hence proving that the sample has a high homogeneity. The elemental mapping of K+ ion for LKBS-15 sample is brighter compared to LKBS-05. This proves that the concentration of K+ ion in LKBS-15 sample is indeed higher compared to LKBS-05 sample. It is noteworthy to mention that the collection time in the elemental mapping of K+ ion in LKBS-15 sample is shorter than LKBS-05. This result suggests that the concentration of K+ ion in LKBS-15 sample is higher compared to the LKBS-05 sample, and the measurement result was not influenced by the collection time. Representative EDX spectra and elemental maps of LKBS-05 and LKBS-15 samples shown in Figure 3 ensure that K+ ion was successfully substituted inside the samples. EDX quantitative analysis further confirms that K+ has been successfully substituted in the samples. The results of EDX quantitative analysis for La0.8−xKxBa0.05Sr0.15MnO3 (0 ≤ x ≤ 0.20) are listed in Table 2.

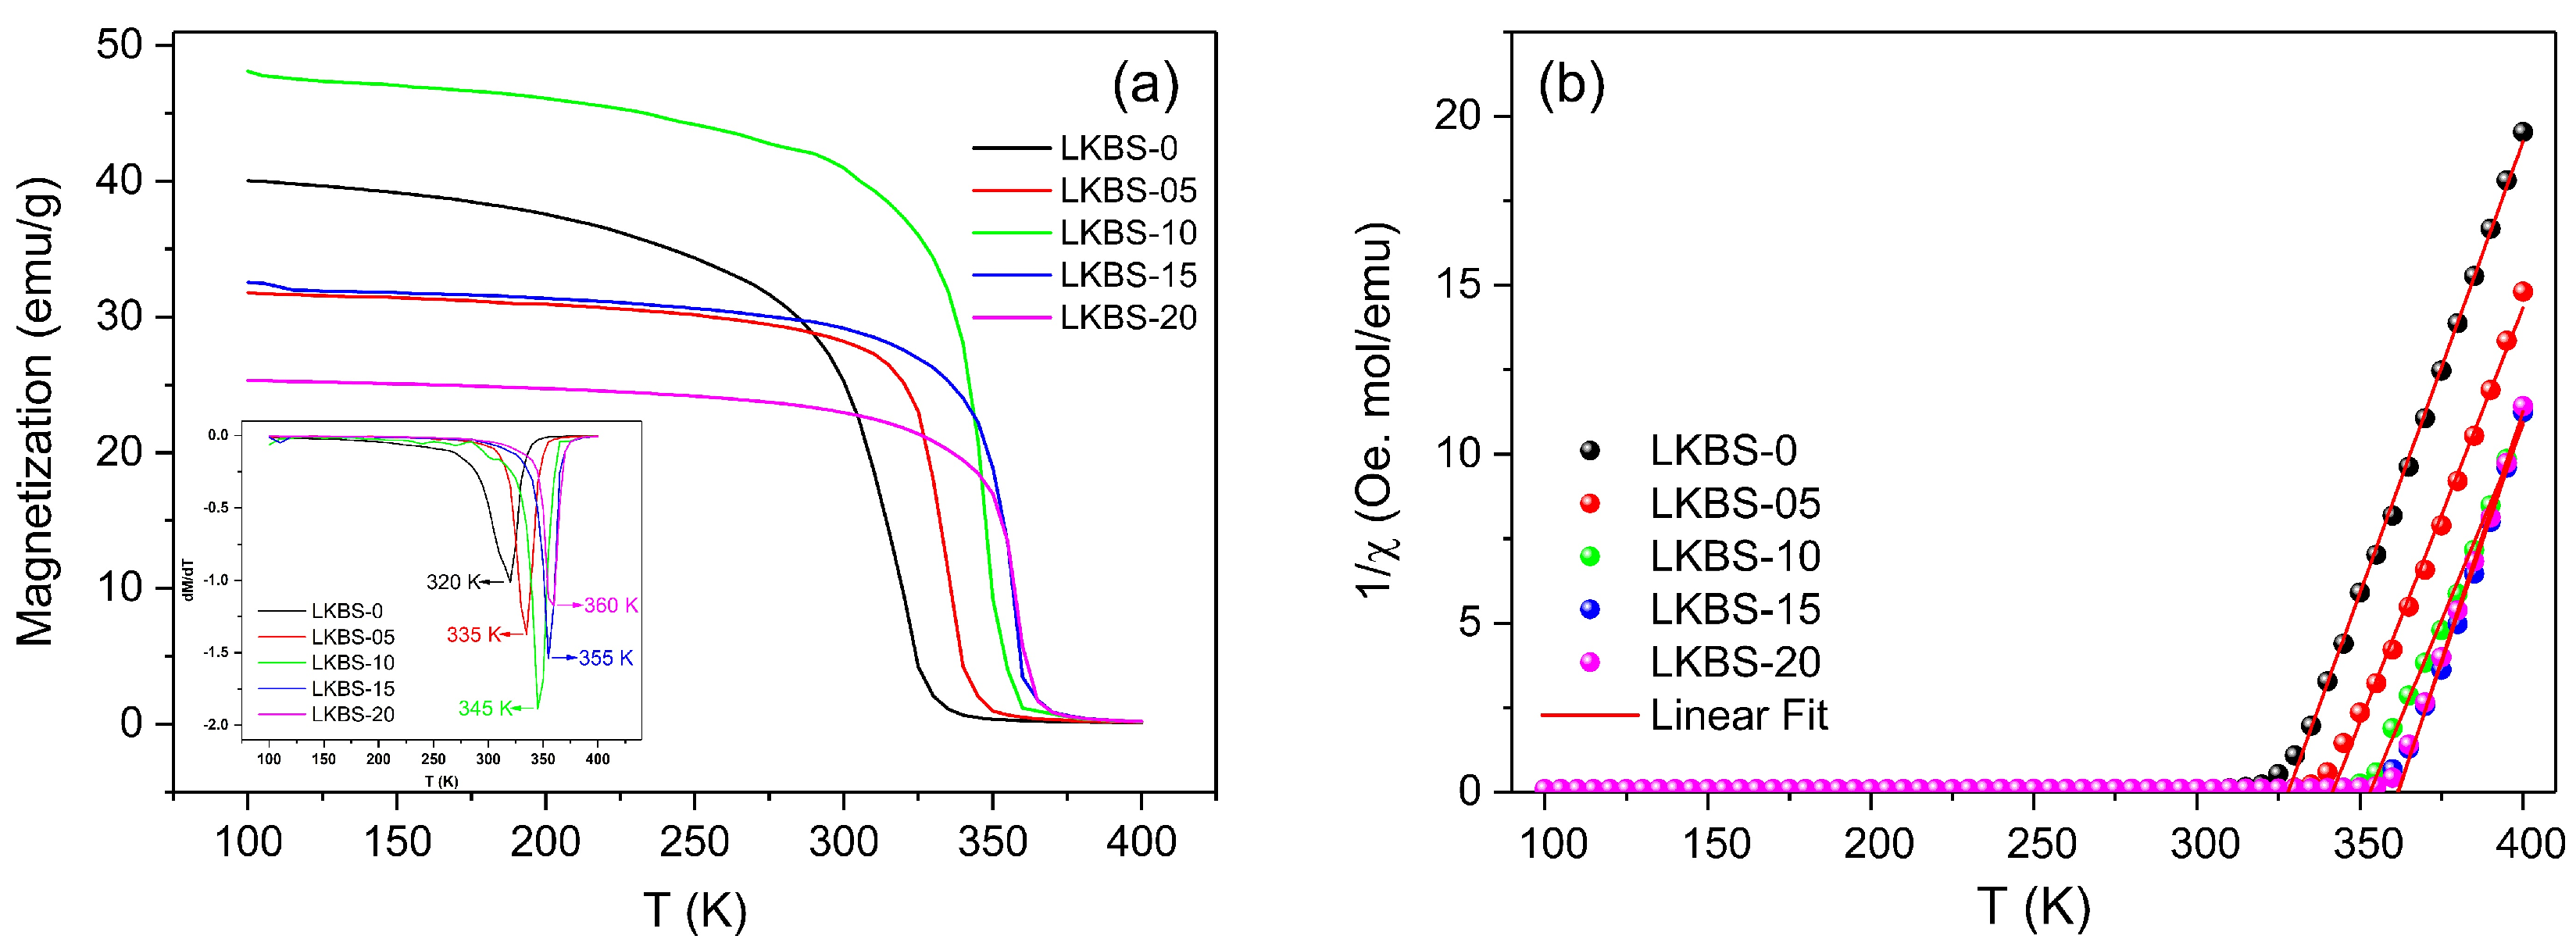
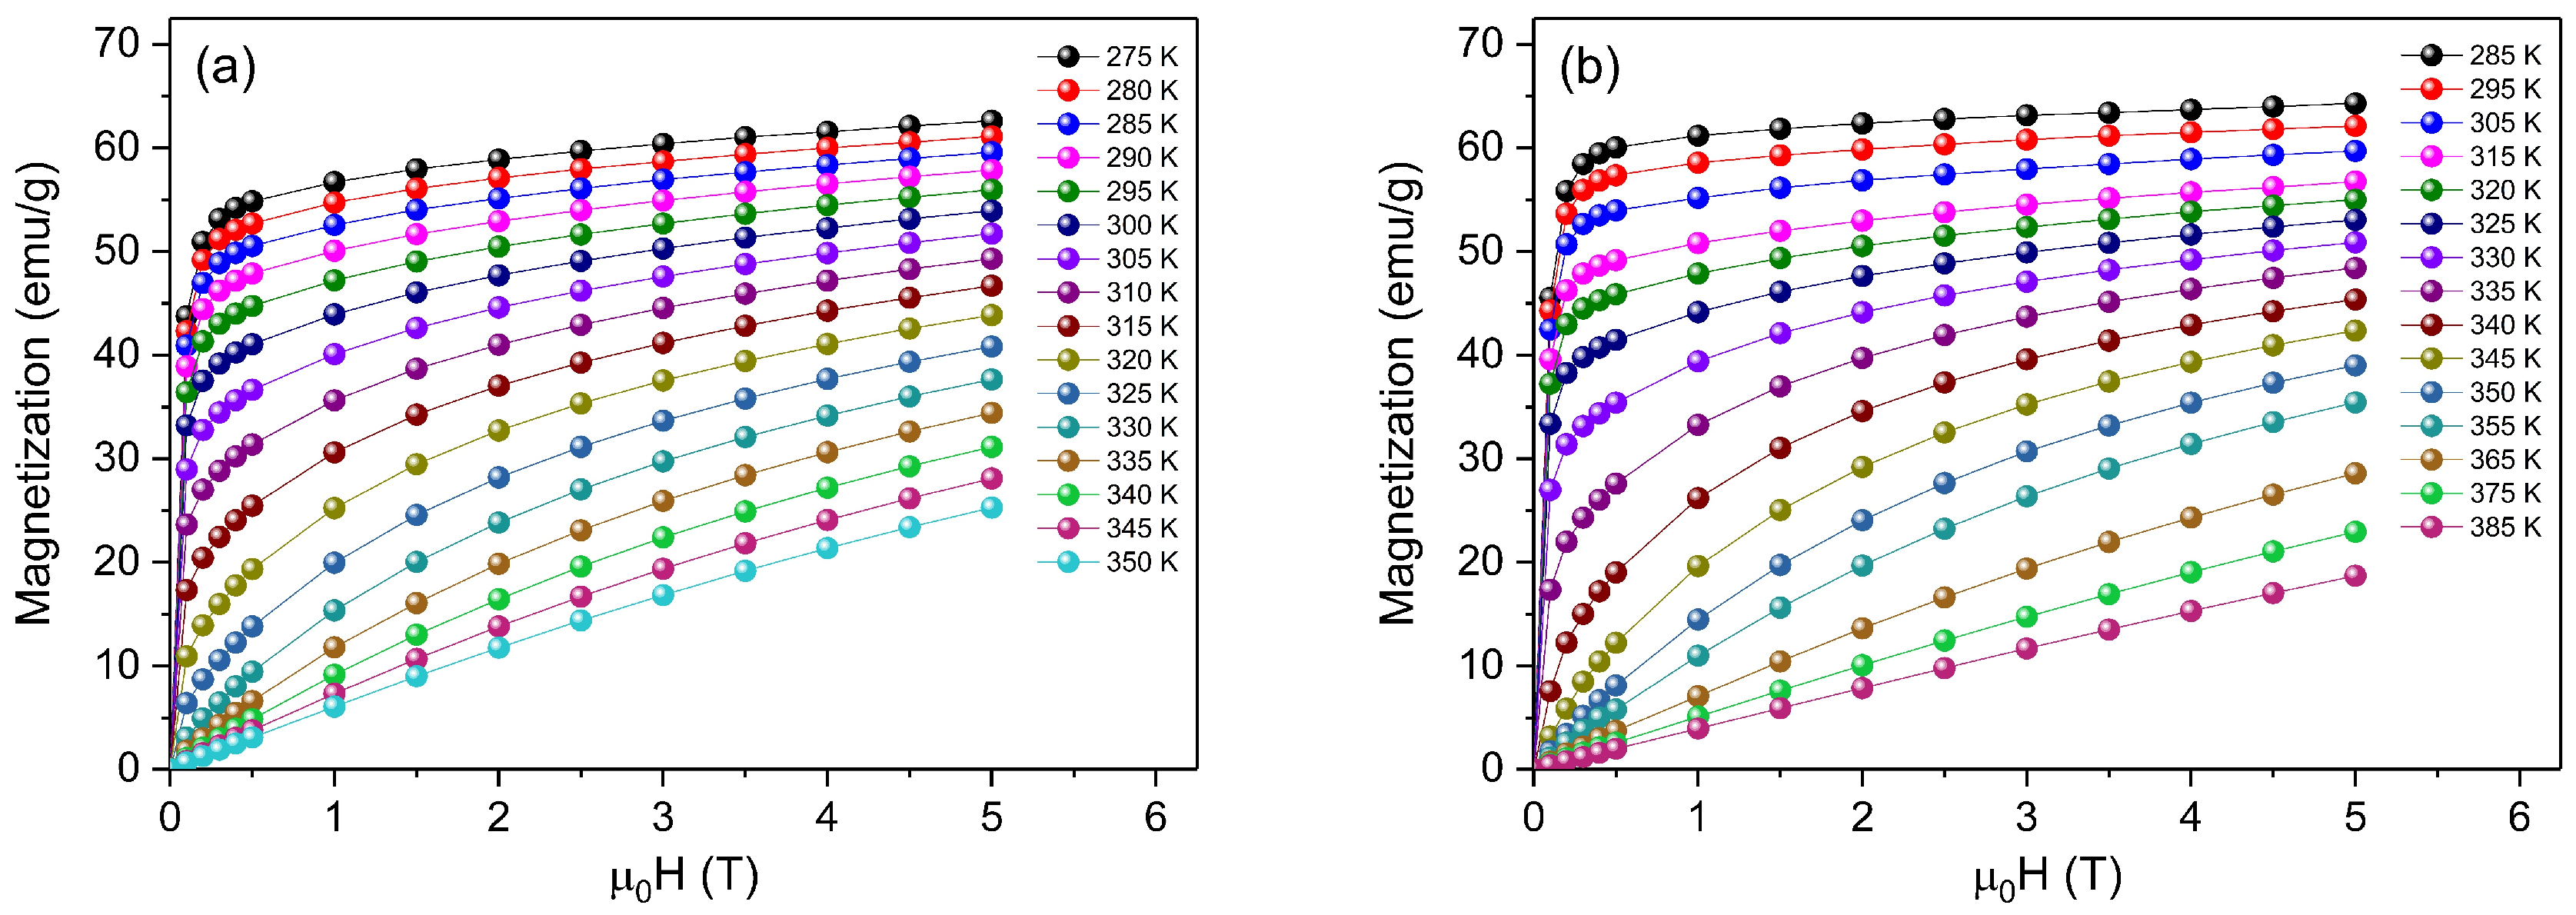
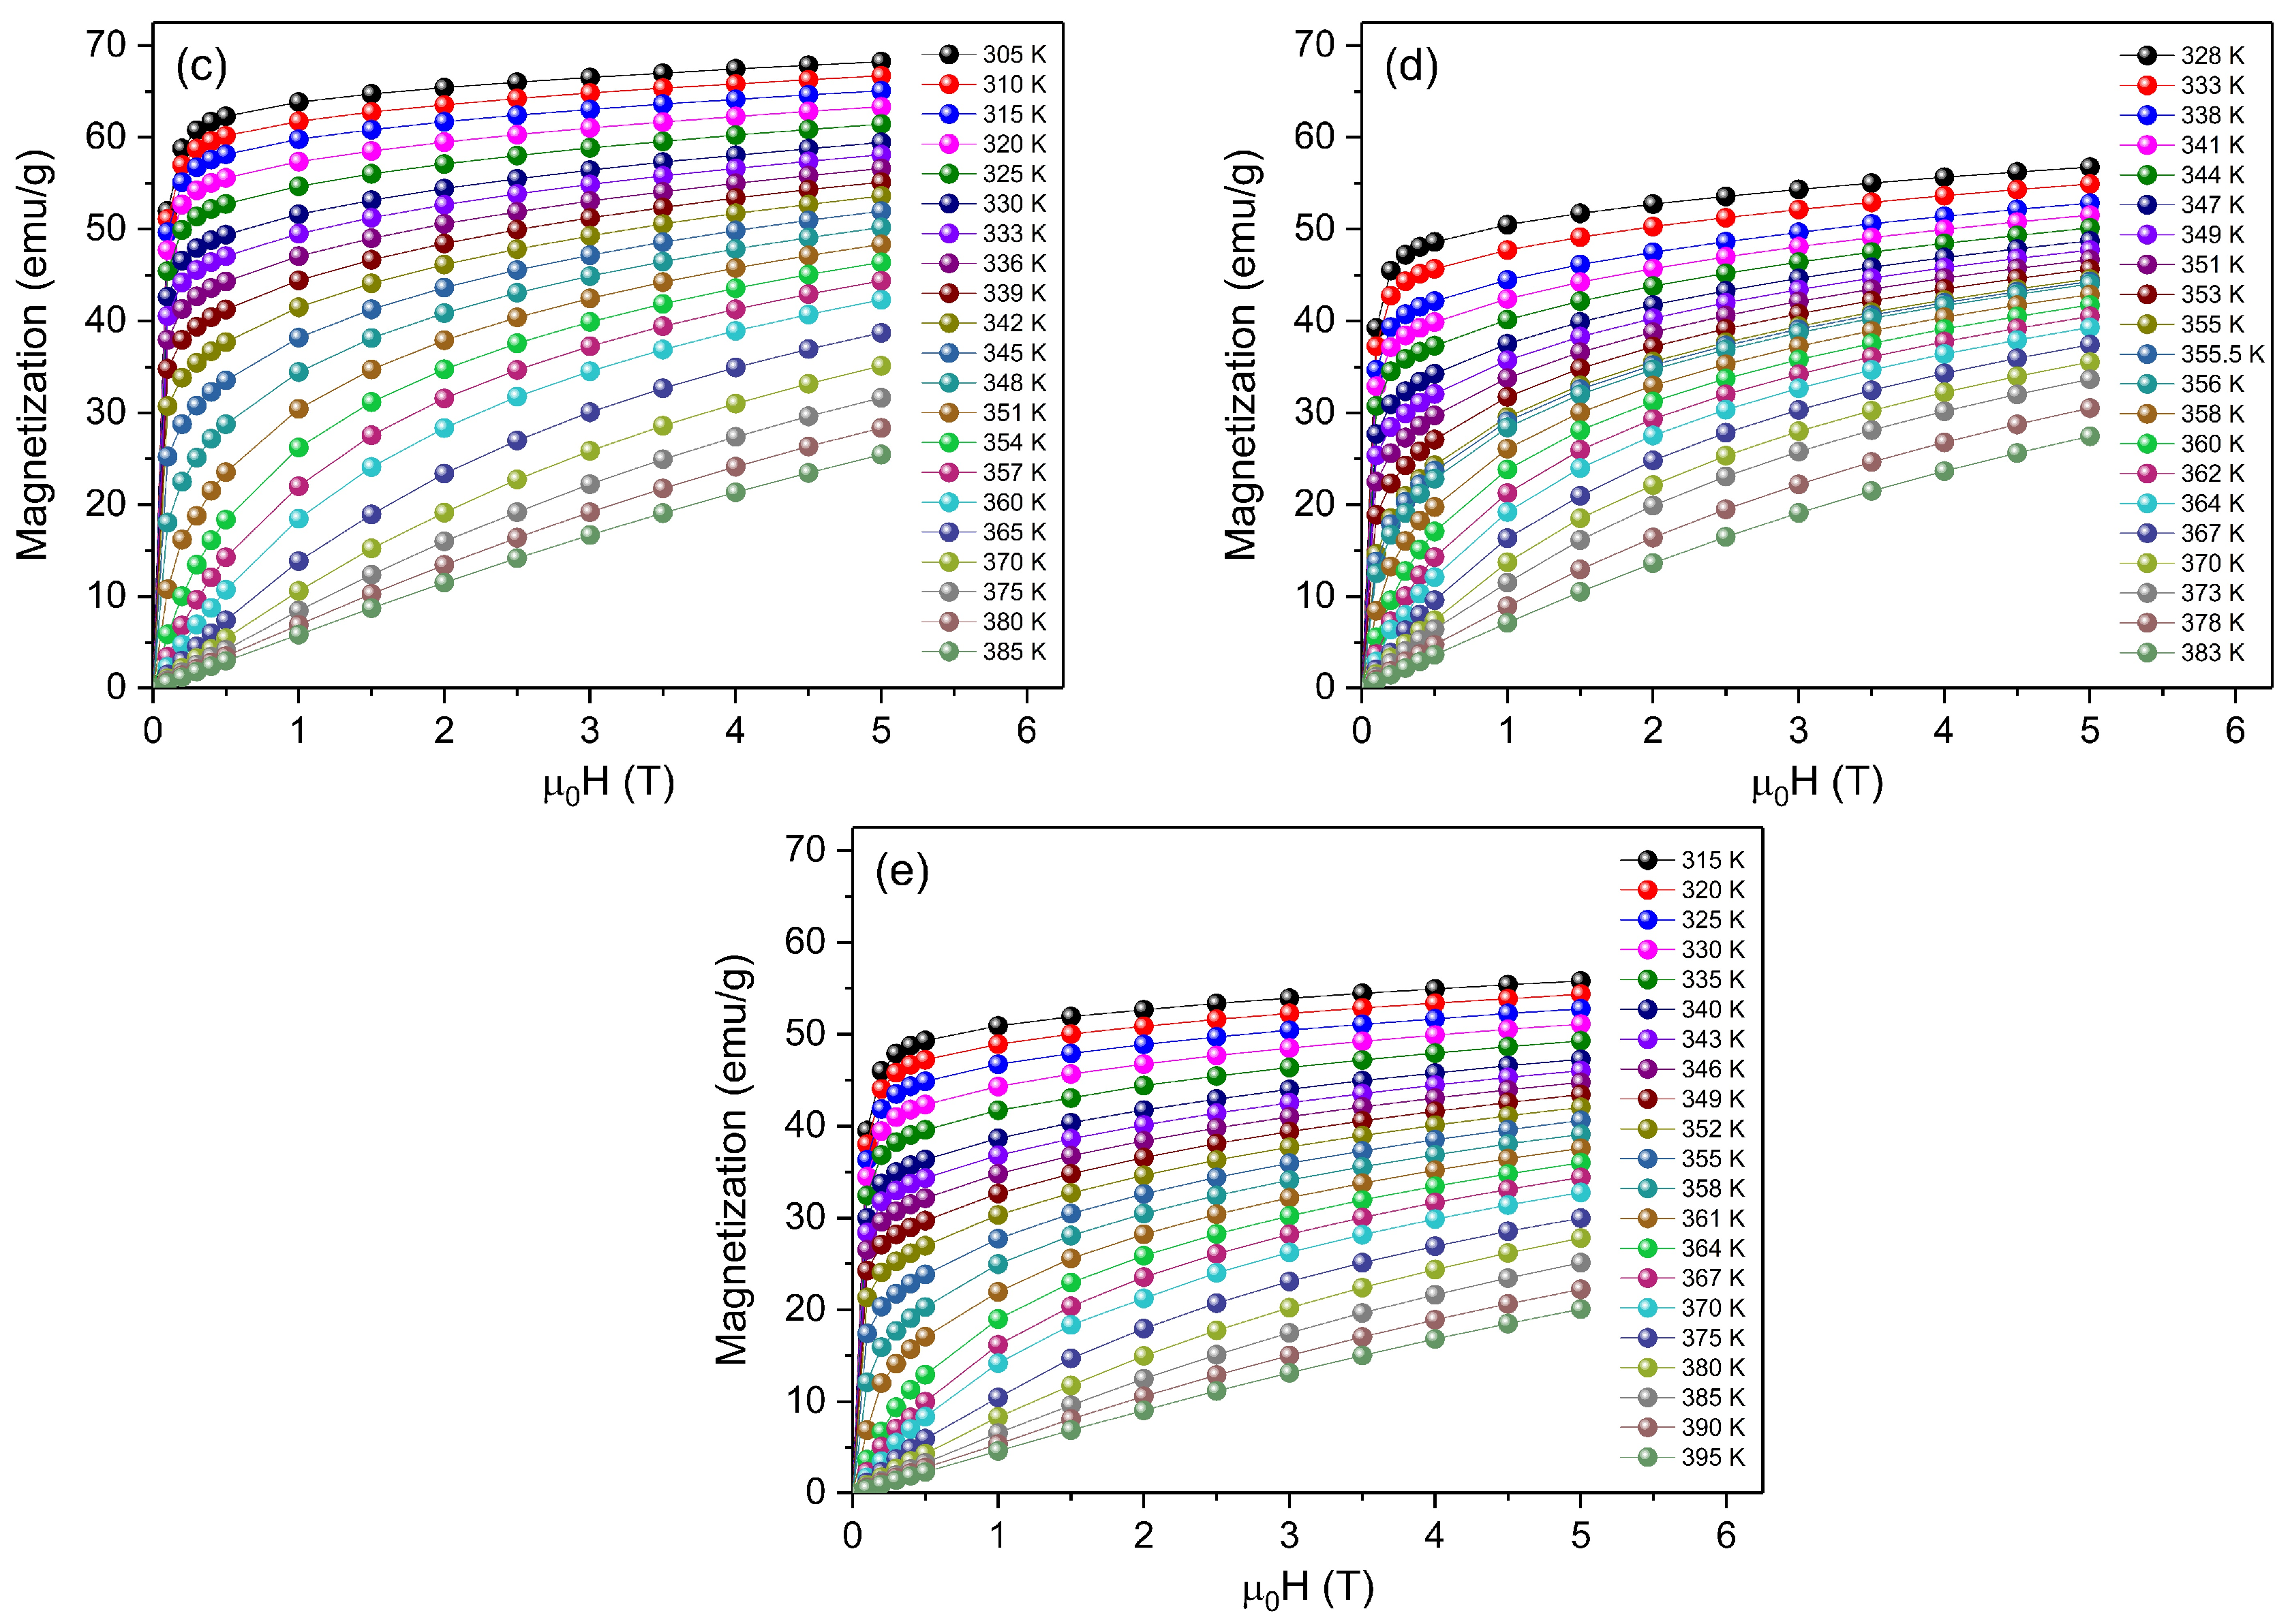
3.2. Magnetic Property Analysis

The temperature dependence of magnetization measured at an applied field of μ 0 H = 0.05 T for La0.8−xKxBa0.05Sr0.15MnO3 samples (Figure 4a) shows that all samples exhibit a clear ferromagnetic-paramagnetic (FM-PM) transition. The Curie temperature ( T C ) of La0.8−xKxBa0.05Sr0.15MnO3 samples were determined from the minimum value obtained from the first derivative of temperature dependence magnetization with respect to temperature (inset of Figure 4a). The results show that T C increases monotonously with the increasing concentration of K+ ion. The increasing trend of T C can be interpreted in terms of the increase in Mn4+ concentration from 20%, for LKBS-0, to 40%, for LKBS-20. According to the Zener theory of double exchange, the T C of perovskite manganite-based material is expected to increase until it reaches a maximum value, which happens at a certain ratio of Mn3+/Mn4+ [48]. According to several reports, the optimum value of Mn3+/Mn4+ ratio was found to be around 7/3 or 2/1 [49,50,51]. The optimum value of Mn3+/Mn4+ will favor the double exchange interaction between Mn3+-O2−-Mn4+ ions while an excessive amount of Mn4+ will favor the superexchange interaction between Mn4+-O2−-Mn4+ ions [52,53]. It is interesting to note that LKBS-20 sample with an expected Mn3+/Mn4+ ratio of 3/2 has a higher T C compared to LKBS-15 sample, which has an expected Mn3+/Mn4+ ratio closer to optimum value. This can be interpreted in terms of electronic bandwidth ( W ) which can be calculated by the following equation [54]:
W c o s 1 2   [ π < M n O M n > ] d <   M n O   >   3.5
where d < M n O > and < M n O M n > is the average bond length and bond angle, respectively. These two values can be obtained from Rietveld refinement analysis of powder diffraction pattern. A larger value of W implies that there is an enhancement in the exchange coupling of neighboring Mn ions, which results in higher T C value [55]. The obtained d < M n O > , < M n O M n > , W , and T C are listed in Table 3.
The inverse of magnetic susceptibility of the La0.8−xKxBa0.05Sr0.15MnO3 samples was calculated, and the result can be seen in Figure 4b. A linear trend in the high-temperature region suggests that the La0.8−xKxBa0.05Sr0.15MnO3 samples follow the Curie–Weiss law, defined as [14]:
χ = C T θ C W
here, χ is the magnetic susceptibility, C is the curie constant and θ C W is the Curie–Weiss temperature. The value of C can be obtained from the slopes of the graph while θ C W can be obtained from the intercept of the slope with the temperature axis.
Fitting the high-temperature region of the inverse molar magnetic susceptibility with Curie–Weiss law will give valuable information regarding the magnetic property of the samples such as θ C W and effective paramagnetic moment. The obtained θ C W values of all samples were positive, which confirms the FM interactions between spins in the La0.8−xKxBa0.05Sr0.15MnO3 samples [56]. The value of θ C W is higher compared to the value T C . This result suggests that there is a presence of short-range FM ordering in the temperature range slightly above T C [57]. The presence of short-range ferromagnetic order can also be related to the presence of magnetic inhomogeneity in the samples [57].
The experimental effective paramagnetic moment ( μ e f f e x p ) can be calculated using the following equation [58]:
μ e f f e x p = 3   k B N A   μ B = 8   C   μ B
where N A = 6.023 × 10²³ mol−1 is the Avogadro number, k B = 1.38016 × 10⁻²³ J·K−1 is the Boltzmann constant, and μ B = 9.274 × 10⁻²¹ emu is the Bohr magneton. According to the chemical formula L a 0.8 x 3 + K x + B a 0.05 2 + S r 0.15 2 + ( M n 0.8 x 3 + M n 0.2 + x 4 + ) O 3 2 , the theoretical effective paramagnetic moment ( μ e f f t h e o ) can also be calculated using the following equation:
μ e f f t h e o = ( 0.8 x ) [ μ e f f ( M n 3 + ) ] 2 + ( 0.2 + x )   [ μ e f f ( M n 4 + ) ] 2  
with μ e f f ( M n 3 + ) = 4.9 μ B and μ e f f ( M n 4 + ) = 3.87 μ B [59]. The obtained θ C W , μ e f f e x p , and μ e f f t h e o for La0.8−xKxBa0.05Sr0.15MnO3 samples are listed in Table 3. The difference between the value μ e f f e x p and μ e f f t h e o for all La0.8−xKxBa0.05Sr0.15MnO3 samples suggest that there is an existence of FM clusters within PM phase [44].

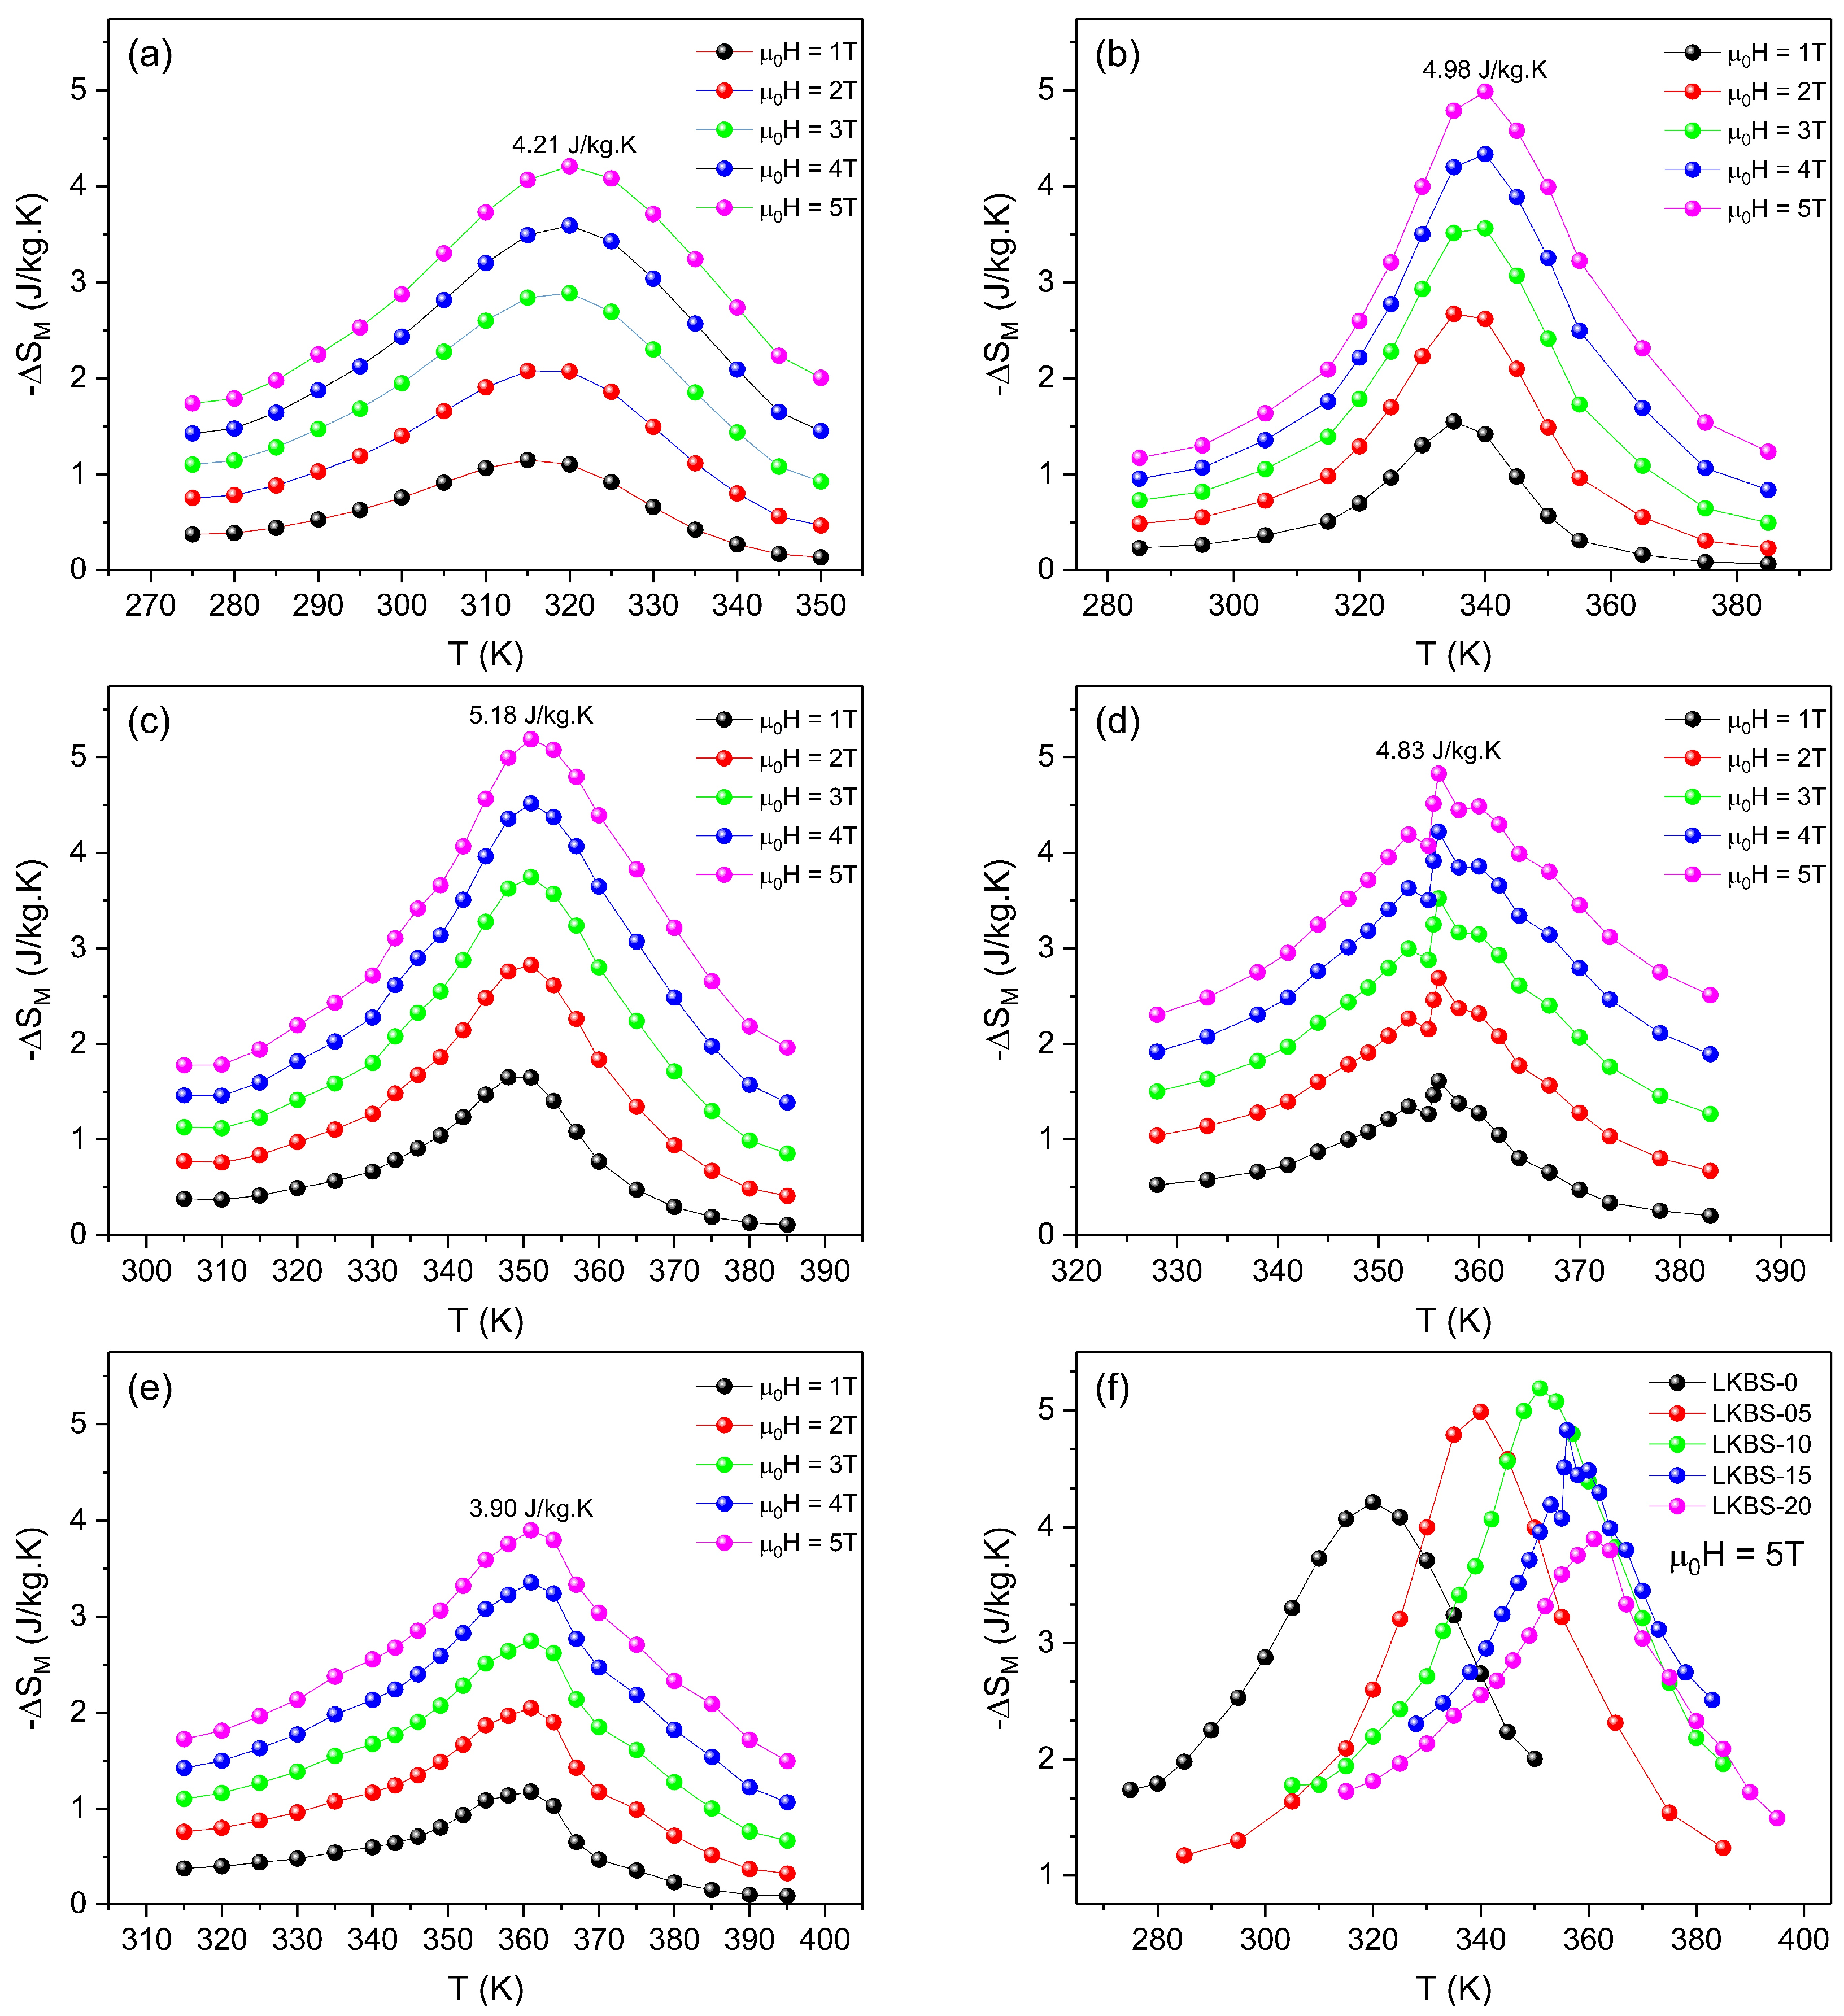
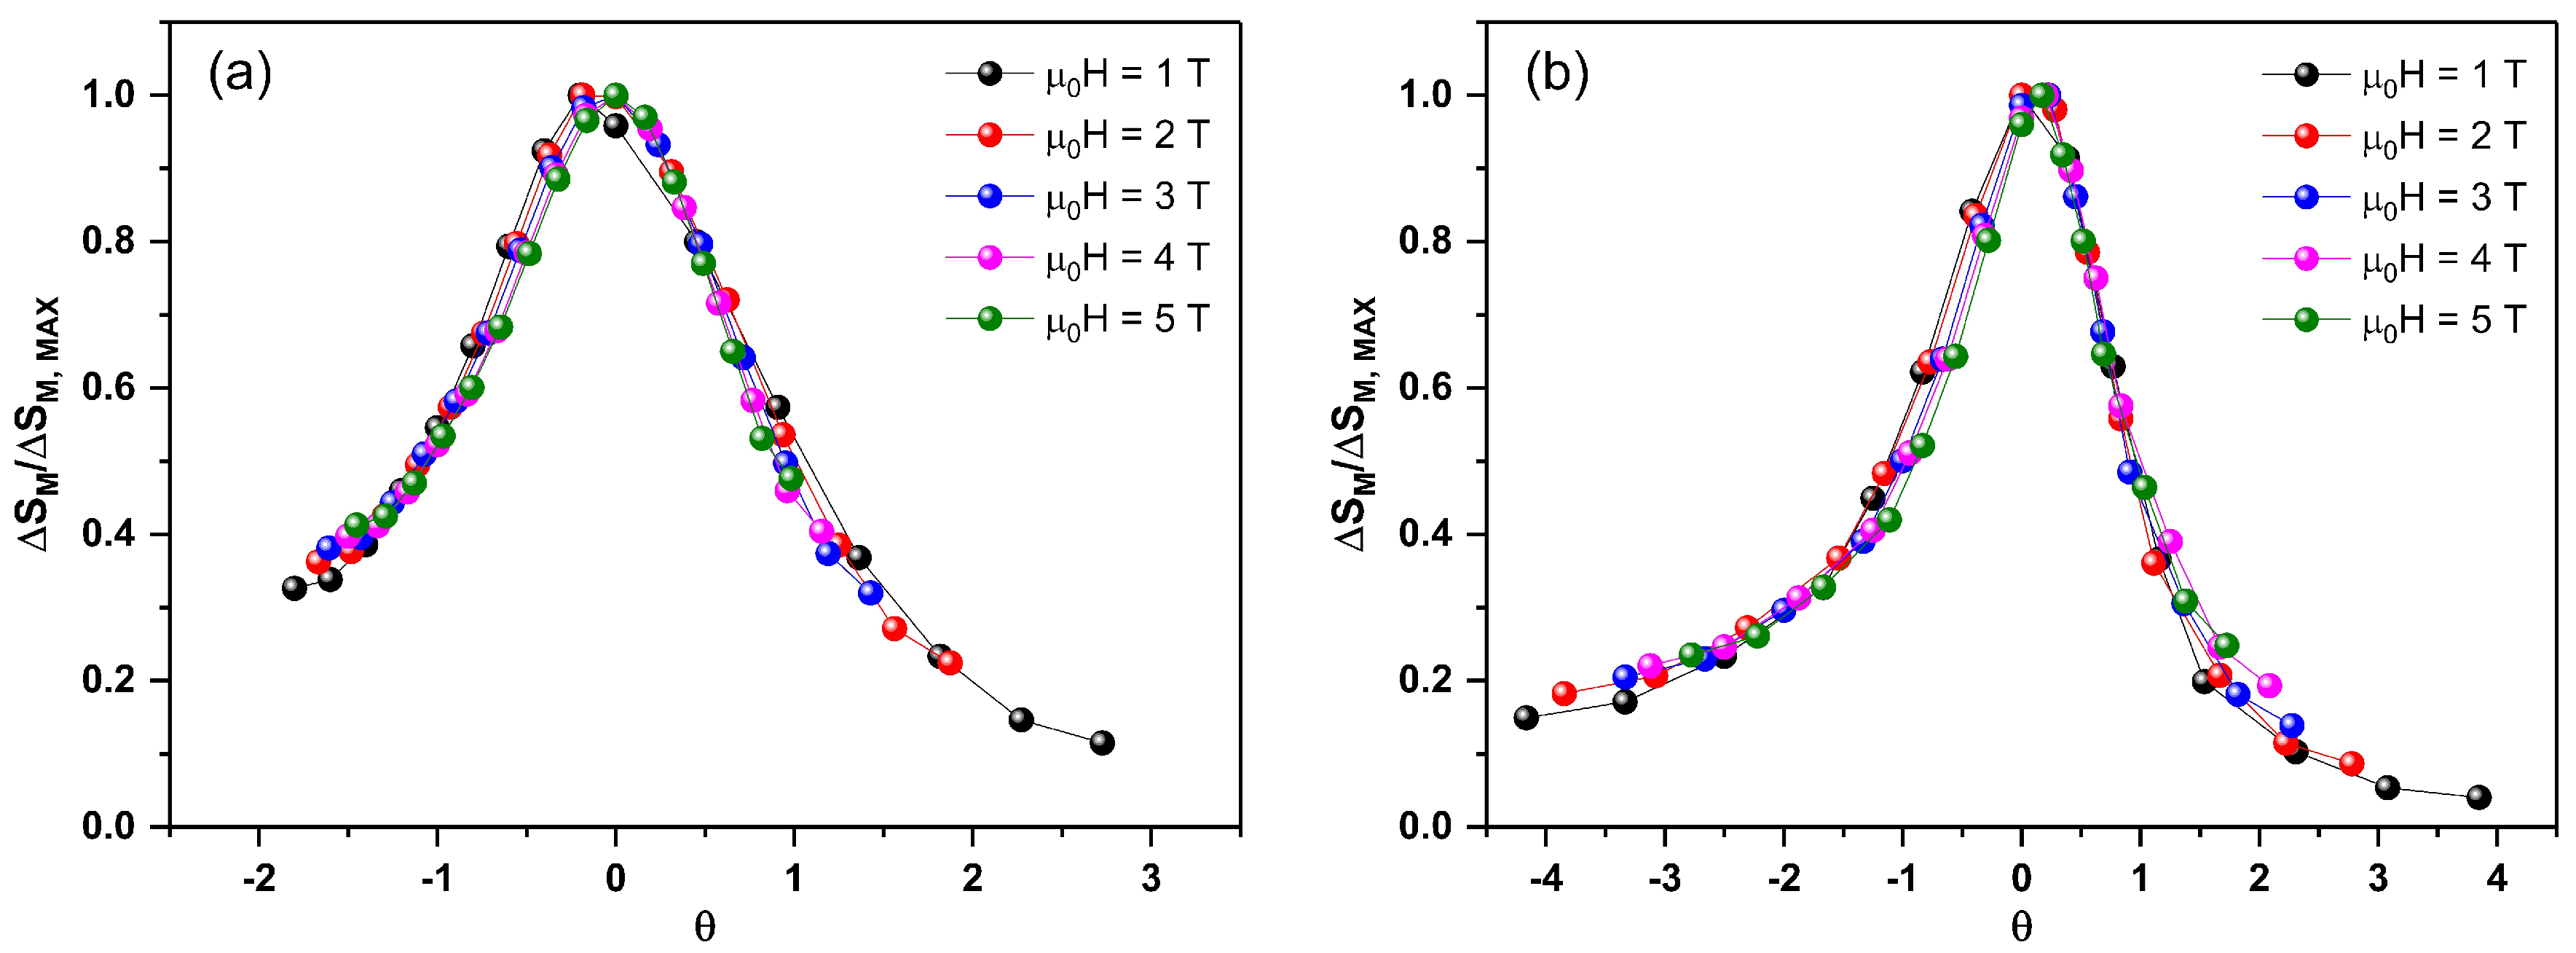
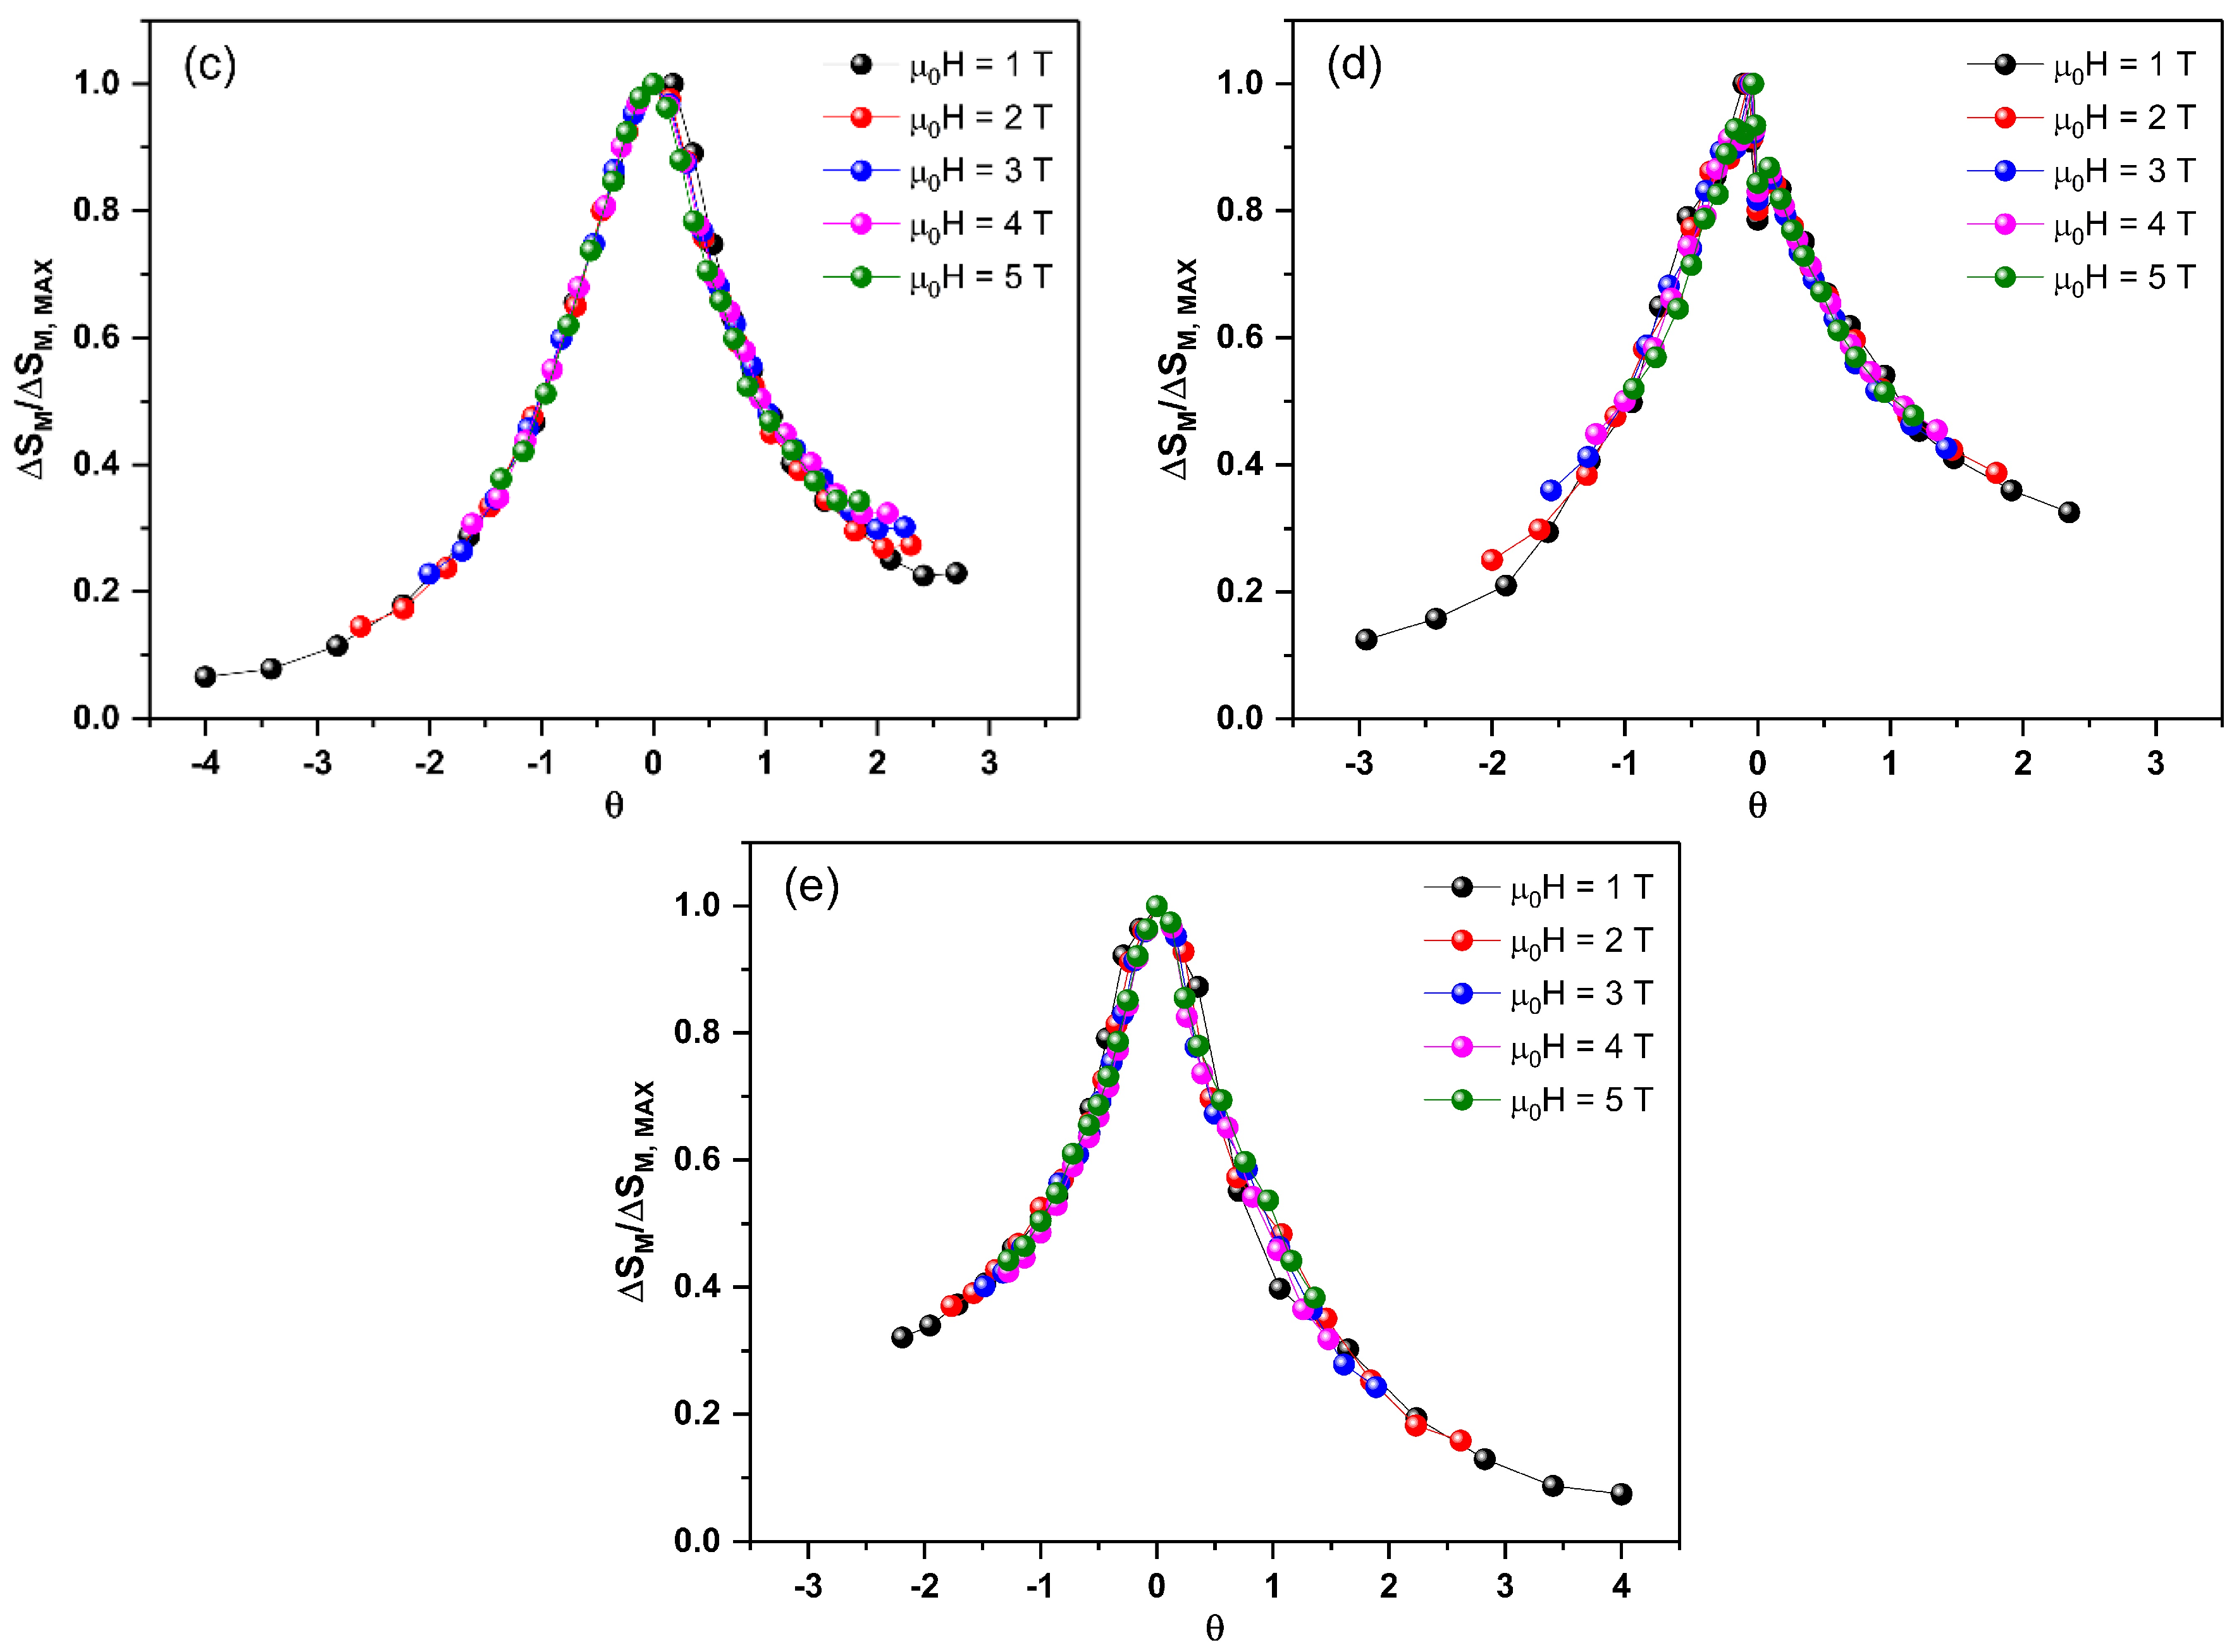
3.3. Magnetocaloric Effect (MCE)

The isothermal magnetization curves at various temperatures near FM-PM transition under an applied magnetic field of up to μ 0 H = 5 T are presented in Figure 5. The magnetization of all samples increases rapidly at temperatures below T C , which implies a ferromagnetic state. On the other hand, the magnetization measured at temperatures higher than T C shows a linear tendency. This can be related to the thermal effect that ruins the ferromagnetic order of the samples, thus implying a paramagnetic state.
The magnetic entropy change of La0.8−xKxBa0.05Sr0.15MnO3 samples can be calculated indirectly by calculating the magnetic entropy change ( Δ S M ( T ,   μ 0 H ) ) from the measured isothermal magnetization. According to Maxwell’s relation, the magnetic entropy change can be calculated from the following equation [60]:
Δ S M ( T ,   μ 0 H ) = 0 μ 0 H ( M ( T ,   μ 0 H ) T )   d ( μ 0 H )
The Δ S M values for the La0.8−xKxBa0.05Sr0.15MnO3 samples were calculated using Equation (7), and the results are presented in Figure 6. It can be noticed that the largest Δ S M value for all samples occurred around the T C of each corresponding sample. The broad Δ S M curves of all samples suggest that each sample exhibits a second-order phase transition nature [61]. The maximum values of the magnetic entropy changes at 5 T ( Δ S M ,     M A X ) were 4.21, 4.96, 5.18, 4.83, and 3.90 J/kg K for LKBS-0, LKBS-05, LKBS-10, LKBS-15, and LKBS-20, respectively. It is noteworthy to mention that according to Equation (7), the value of Δ S M is directly controlled by the first derivative of magnetization with respect to temperature (dM/dT). Referring to the dM/dT graph shown in the inset of Figure 4a, it can be seen that the slope reveals an increasing tendency until it reaches a maximum value, which belongs to the LKBS-10 sample. This fact is in a good agreement with the comparison of maximum Δ S M value at 5 T shown in Figure 6f which demonstrates that the largest Δ S M value is shown by the LKBS-10 sample.
Additionally, the evolution of Δ S M value is in accordance with the study of Hueso et al., which showed that in substituted LMO-based compounds the Δ S M value can also be affected by the grain size of the sample [62]. According to Hueso et al., the correlation between magnetocaloric property and the grain size of the sample is influenced by the presence of a magnetically disordered layer located at the outer part of the grain. This disordered layer will influence the magnetic phase transition at T C resulting in a more gradual slope in the magnetic phase transition. The effect of the disordered layer is more pronounced in samples with smaller grain size, hence resulting in a smaller Δ S M value. The consistency between the SEM micrograph (Figure 2) and the largest Δ S M value (Figure 6f) proves that the evolution of Δ S M value of La0.8−xKxBa0.05Sr0.15MnO3 samples is also influenced by the grain size of the sample.
It is clear that the Δ S M ( T ,   μ 0 H ) graphs also show a maximum value at a certain temperature, which usually known as T p e a k . Focusing the discussion on the Δ S M ( T ) at an applied magnetic field of 5 T, it can be seen that the value of T p e a k increases monotonously with increasing K+ ion concentration. The values of T p e a k obtained in the present work were 320, 340, 351, 356, and 361 for LKBS-0, LKBS-05, LKBS-10, LKBS-15, and LKBS-20, respectively. The obtained T p e a k values were slightly different compared to T C , except for the LKBS-0 sample. Differences between T p e a k and T C are often found in substituted LMO-based compounds [51,55]. According to Franco et al., the difference between the value of T C and T p e a k in magnetocaloric compounds can be correlated with the critical behavior of the corresponding sample [63]. Furthermore, Franco et al. also mentioned that for magnetocaloric compounds with a critical behavior close to the mean-field model, the value of T C can coincide with T p e a k [63]. The discussion regarding the critical behavior of La0.8−xKxBa0.05Sr0.15MnO3 samples will not be presented here, as this would require a different approach.
Another factor that holds a high degree of significance in the development of a magnetic refrigerator system is the cooling efficiency of the material, which is usually known as Relative Cooling Power (RCP). The RCP value can be calculated using the following equation [1]:
R C P = Δ S M ,   M A X × δ T F W H M
where Δ S M ,   M A X is the largest magnetic entropy change of the material and δ T F W H M is the full-width at half maximum (FWHM) of the corresponding magnetic entropy curve. The RCP for all samples at 5 T are 254, 219, 249, 301, and 173 J/kg for LKBS-0, LKBS-05, LKBS-10, LKBS-15, and LKBS-20, respectively. The large value of RCP obtained for all samples can also serve as a proof for the existence of second-order phase transition nature in the samples [61]. The obtained Δ S M and RCP value for all samples, as well as the values of other substituted LMO-based compounds are summarized in Table 4.
It is interesting to note that substitution by K+ ion increases the Δ S M ,   M A X of the sample until it reaches the maximum value of 5.189 J/kg K, which corresponds to the LKBS-10 sample. Beyond this value, the Δ S M ,   M A X decreases with the increase in K+ ion concentration. This result is in good agreement with the Zener theory of double exchange, which suggests that the physical properties of substituted LMO-based compounds are greatly influenced by Mn3+/Mn4+ ratio [48]. As mentioned earlier, substitution by K+ ion changes the Mn3+/Mn4+ ratio from 4/1 for LKBS-0 sample to 3/2 for LKBS-20 sample. Within this range, LKBS-10 is expected to have an optimum Mn3+/Mn4+ ratio, which is equal to 7/3. Thus, it can be concluded that Zener theory of double exchange is proven to be reliable in explaining the Δ S M ,   M A X value of La0.8−xKxBa0.05Sr0.15MnO3 samples.
Previously, there have been several works that report the effect of K+ ion substitution on the magnetic entropy change of LMO-based compounds. Roughly, the parental compound used in previous works can be classified into three different groups which are La-Cd-MnO3, La-Ca-MnO3, and La-Sr-MnO3 [55,67,68,69,70]. In La-Cd-MnO3 and La-Ca-MnO3 compounds, substitution by K+ ion increased the T C of the samples, accompanied by a monotonous increase in the value of Δ S M ,   M A X . According to the work of Dhahri et al., the T C for La0.8Cd0.2−xKxMnO3 increases from 260 K to 282 K [69]. Meanwhile, Messaoui et al. reported that the T C for La0.78Cd0.22−xKxMnO3 increased from 202 K to 326 K [68]. In line with the result of La-Cd-MnO3 compound, a similar result was also found in the work of Koubaa et al. and Ben Rejeb et al. According to the work of Koubaa et al., the T C of La0.65Ca0.35−xKxMnO3 increased from 248 to 310 K with K+ ion concentration [55]. This increasing trend of T C was also followed by an increase of Δ S M ,   M A X . An almost similar trend was also reported by Ben Rejeb et al., who also explored the effect of K+ substitution on the Δ S M ,   M A X value of La0.65Ca0.35−xKxMnO3 compound. In their work, Ben Rejeb et al. even proved that substitution of the K+ ion increased the values of T C (from 248K to 310 K and 275 K to 320 K for samples prepared using the solid–solid and sol–gel method, respectively) and Δ S M ,   M A X , despite the difference in the sample preparation method [67]. It is important to note that in both of these groups, the value of < r A > and σ 2 were increasing monotonously with K+ concentration. This trend is in line with La0.8−xKxBa0.05Sr0.15MnO3 samples. However, La0.8−xKxBa0.05Sr0.15MnO3 samples do not reveal a similar trend for the Δ S M ,   M A X value. Furthermore, it is important to mention that the increase of T C and Δ S M ,   M A X values for both La-Cd-MnO3 and La-Ca-MnO3 groups seems to disagree with the Zener theory of double exchange. In fact, the increasing value of Δ S M ,   M A X in La-Cd-MnO3 and La-Ca-MnO3 groups happened when the Mn4+ fractions were greater than the optimum values, which were 30% or 33%. In their work, Dhahri et al. suggested that the reason behind this result could be ascribed to the enhancement of spin-lattice coupling arising from a variation in the value of d < M n O > and < M n O M n > [69].
On the other hand, Cheikh-Rouhou Koubaa et al. studied the effect of K+ ion substitution on the T C and Δ S M ,   M A X value of La0.7Sr0.3−xKxMnO3 [70]. According to their work, the T C of La0.7Sr0.3−xKxMnO3 decreased monotonously with an increase in the concentration of K+ fraction from 365 K to 328 K, from x = 0 to x = 0.2, respectively. Additionally, the increasing concentration of K+ ion in La0.7Sr0.3−xKxMnO3 further reduced the value of Δ S M ,   M A X , with a minimum value of 1.2 J/kg K for x = 0.15. In their work, Cheikh-Rouhou Koubaa et al. suggested that the reduction in T C and Δ S M ,   M A X value could be ascribed to the weakening of the double exchange mechanism due to the increase of the Mn4+ fraction, which is expected to be greater than 30%. This result also suggests that the behavior of T C and Δ S M ,   M A X of La-Sr-MnO3 which have been substituted by K+ ion is in good agreement with the Zener theory of double exchange.
Summarizing the points mentioned above, it seems that the Zener theory of double exchange is less prominent in LMO-based compounds composed of at least one ion with small ionic radii such as Ca2+ and Cd2+ ions, with an ionic radius of 1.18 Å and 1.03 Å [26]. In such a compound, other factors such as < r A >, σ 2 , and spin-lattice coupling from d < M n O > and < M n O M n > apparently outperform the double exchange mechanism. On the other hand, the Zener theory of double exchange seems to be more prominent compared to other factors if the LMO-based compounds is composed of at least one ion with large ionic radii such as Sr2+ ion with ionic radius of 1.31 Å [26]. Returning to the current topic, it is clear that La0.8−xKxBa0.05Sr0.15MnO3 samples are composed of ions with large ionic radii. The ionic radii of each A-site ion in the La0.8−xKxBa0.05Sr0.15MnO3 samples are 1.22 Å, 1.31 Å, 1.47 Å, and 1.55 Å for La3+, Sr2+, Ba2+, and K+ ion, respectively [26]. Hence, it is expected that in La0.8−xKxBa0.05Sr0.15MnO3 samples, the Zener theory of double exchange will become a prominent factor in controlling the Δ S M ,   M A X value of La0.8−xKxBa0.05Sr0.15MnO3 samples. Comparisons of T C and Δ S M ,   M A X values for La0.8−xKxBa0.05Sr0.15MnO3 samples in graphical form, as well as the comparison with < r A > and σ 2 value, are presented in graphical form in Figure 7.
To support the previous argument whereby all of the La0.8−xKxBa0.05Sr0.15MnO3 samples belong to the second-order phase transition type, a universal master curve based on the phenomenological approach proposed by Franco et al. was constructed [71]. According to Franco et al., the measured Δ S M as a function of temperature under different applied magnetic fields will coincide with a single master curve for a material with second-order phase transition. In detail, this approach was carried out by normalizing magnetic entropy change to its maximum value for each applied magnetic field. Additionally, the temperature axis needs to be modified by rescaling the temperature with new variable θ , defined by the following equation:
θ = ( T T C ) / ( T r 1 T C )   f o r   T T C θ = ( T T C ) / ( T r 2 T C )   f o r   T > T C
where T r 1 and T r 2 are references temperature taken when the value of ∆SM is approximately half of the maximum value. The universal master curve for all La0.8−xKxBa0.05Sr0.15MnO3 samples is shown in Figure 8. It is obvious that the universal master curve of all La0.8−xKxBa0.05Sr0.15MnO3 samples coincides into a single curve. This result confirms that all La0.8−xKxBa0.05Sr0.15MnO3 samples belong to the second-order phase transition.

4. Conclusions

To summarize, the effect of K+ substitution on the crystal structure and magnetic property, as well as the magnetic entropy change of La0.8−xKxBa0.05Sr0.15MnO3 (0 ≤ x ≤ 0.20), was investigated. All samples were crystallized in a rhombohedral structure with R-3c space group. Magnetization investigation by means of the Field Cooling (FC) method revealed that all samples exhibited a clear ferromagnetic (FM) to paramagnetic (PM) transition at the Curie temperature ( T C ). Substitution by K+ ion increases the T C of La0.8−xKxBa0.05Sr0.15MnO3 (0 ≤ x ≤ 0.20) from 320 K to 360 K. Moreover, the magnetic entropy change ( Δ S M ) under an applied magnetic field of 5 T also increased to 4.21, 4.99, 5.19, 4.83, and 3.90 J/kg K for x = 0, 0.05, 0.1, 0.15, and 0.2, respectively. The fluctuation in Δ S M value can be interpreted in terms of variation in Mn3+/Mn4+ ratio due to the increasing population of Mn4+ ion as K+ concentration increases. The smallest relative cooling power (RCP) was 173 J/kg for LKBS-20 sample and the largest RCP was 301 J/kg for LKBS-15 sample. The obtained values of T C , Δ S M and RCP value of La0.8−xKxBa0.05Sr0.15MnO3 suggests that it can be considered as a good candidate for magnetic refrigeration system above room temperature.

Author Contributions

Conceptualization, D.S.R. and B.K.; methodology, D.S.R.; validation, B.K., D.R.M. and H.T.; formal analysis, D.S.R. and D.R.M.; investigation, D.S.R.; data curation, K.W.; writing—original draft preparation, D.S.R.; writing—review and editing, B.K., D.R.M. and H.T.; supervision, B.K.; project administration, B.K.; funding acquisition, B.K. All authors have read and agreed to the published version of the manuscript.

Funding

This research was funded by The Ministry of Research, Technology, and Higher Education (Kemenristek Dikti) with PDUPT 2019 grant number [NKB-1590/UN2.R3.1/HKP.05.00/2019]

Conflicts of Interest

The authors declare no conflict of interest.

References

  1. Gschneidner, K.A.; Pecharsky, V.K. Magnetocaloric materials. Annu. Rev. Mater. Sci. 2000, 30, 387–429. [Google Scholar] [CrossRef] [Green Version]
  2. Tishin, A.M.; Spichkin, Y.I. The Magnetocaloric Effect and Its Applications; IOP Publishing Ltd: Bristol, UK, 2016; Volume 6, ISBN 9781420033373. [Google Scholar]
  3. Pecharsky, V.K.; Gschneidner Jr, K.A. Magnetocaloric effect and magnetic refrigeration. J. Magn. Magn. Mater. 1999, 200, 44–56. [Google Scholar] [CrossRef]
  4. Gschneidner, K.A., Jr.; Pecharsky, V.K.; Tsokol, A.O. Recent developments in magnetocaloric materials. Reports Prog. Phys. 2005, 68, 1479–1539. [Google Scholar] [CrossRef]
  5. Pecharsky, V.K.; Gschneidner, K.A. Giant magnetocaloric effect in Gd5(Si2 Ge2). Phys. Rev. Lett. 1997, 78, 4494–4497. [Google Scholar] [CrossRef]
  6. Wada, H.; Tanabe, Y. Giant magnetocaloric effect of MnAs1−xSbx. Appl. Phys. Lett. 2001, 79, 3302–3304. [Google Scholar] [CrossRef]
  7. Fukamichi, K.; Fujita, A.; Fujieda, S. Large magnetocaloric effects and thermal transport properties of La(FeSi)13 and their hydrides. J. Alloys Compd. 2006, 408–412, 307–312. [Google Scholar] [CrossRef]
  8. Phan, M.-H.; Yu, S.-C. Review of the magnetocaloric effect in manganite materials. J. Magn. Magn. Mater. 2007, 308, 325–340. [Google Scholar] [CrossRef]
  9. Maignan, A.; Simon, C.; Caignaert, V.; Raveau, B. Colossal magnetoresistance properties of the manganese perovskites. La0.7−xYxCa0.3MnO3−δ. J. Appl. Phys. 1996, 79, 7891–7895. [Google Scholar] [CrossRef]
  10. Zhang, S.; Cao, Q. Electromagnetic and microwave absorption performance of some transition metal doped La0.7Sr0.3Mn1−xTMxO3±δ (TM = Fe, Co or Ni). Mater. Sci. Eng. B 2012, 177, 678–684. [Google Scholar] [CrossRef]
  11. Jiang, S.P. Development of lanthanum strontium manganite perovskite cathode materials of solid oxide fuel cells: A review. J. Mater. Sci. 2008, 43, 6799–6833. [Google Scholar] [CrossRef]
  12. Yamamoto, T.; Noguchi, S.; Yasumoto, K.; Itoh, H.; Takeda, Y. Chemical Stability of Lanthanum Manganite and Reactivity with Yttria-Stabilized Zirconia. In Solid State Ionics; World Scientific: Toh Tuck Link, Singapore, 2004; Volume 3, pp. 281–288. [Google Scholar]
  13. Turky, A.O.; Rashad, M.M.; Hassan, A.M.; Elnaggar, E.M.; Bechelany, M. Optical, electrical and magnetic properties of lanthanum strontium manganite La1−xSrxMnO3 synthesized through the citrate combustion method. Phys. Chem. Chem. Phys. 2017, 19, 6878–6886. [Google Scholar] [CrossRef] [PubMed]
  14. Ezaami, A.; Sellami-Jmal, E.; Chaaba, I.; Cheikhrouhou-Koubaa, W.; Cheikhrouhou, A.; Hlil, E.K. Effect of elaborating method on magnetocaloric properties of La0.7Ca0.2Ba0.1MnO3 manganite. J. Alloys Compd. 2016, 685, 710–719. [Google Scholar] [CrossRef]
  15. Moradi, J.; Ghazi, M.E.; Ehsani, M.H.; Kameli, P. Structural and magnetic characterization of La0.8Sr0.2MnO3 nanoparticles prepared via a facile microwave-assisted method. J. Solid State Chem. 2014, 215, 1–7. [Google Scholar] [CrossRef]
  16. Xu, Z.; Wei, C.; Ai-Jun, L.; Li-Mei, M.; Yun, Z. Structural, Magnetic and Magnetocaloric Properties of La-deficient La0.77−xSrxCa0.2MnO3 Perovskites. Chinese Phys. Lett. 2009, 26, 087401. [Google Scholar] [CrossRef]
  17. Demin, R.V.; Koroleva, L.I. Influence of the magnetic two-phase state on the magnetocaloric effect in manganites. Phys. Lett. A 2003, 317, 140–143. [Google Scholar] [CrossRef]
  18. Terashita, H.; Garbe, J.J.; Neumeier, J.J. Compositional dependence of the magnetocaloric effect in La1−xCaxMnO3 (0 ≤ x ≤ 0.52). Phys. Rev. B 2004, 70, 094403. [Google Scholar] [CrossRef]
  19. Szewczyk, A.; Gutowska, M.; Dabrowski, B.; Plackowski, T.; Danilova, N.P.; Gaidukov, Y.P. Specific heat anomalies in La1−xSrxMnO3 (0.12 ≤ x ≤ 0.2). Phys. Rev. B 2005, 71, 224432. [Google Scholar] [CrossRef]
  20. Jeddi, M.; Gharsallah, H.; Bekri, M.; Dhahri, E.; Hlil, E.K. Structural, magnetic, critical behavior and phenomenological investigation of magnetocaloric properties of La0.6Ca0.4−xSrxMnO3 perovskite. J. Mater. Sci. Mater. Electron. 2019, 30, 14430–14444. [Google Scholar] [CrossRef]
  21. Sfifir Debbebi, I.; Cheikhrouhou-Koubaa, W.; Cheikhrouhou, A.; Hlil, E.K. Structural, magnetic and magnetocaloric investigation of La0.7−xDyxCa0.3MnO3 (x = 0.00, 0.01 and 0.03) manganite. J. Mater. Sci. Mater. Electron. 2017, 28, 16965–16972. [Google Scholar] [CrossRef]
  22. Zarifi, M.; Kameli, P.; Raoufi, T.; Ghotbi Varzaneh, A.; Salazar, D.; Nouraddini, M.I.; Kotsedi, L.; Maaza, M. Direct and indirect measurement of the magnetocaloric effect in the La0.5Ca0.5−xPbxMnO3 (0 ≤ x ≤ 0.2) manganites. J. Magn. Magn. Mater. 2020, 494, 165734. [Google Scholar] [CrossRef]
  23. Tang, T.; Gu, K.; Cao, Q.; Wang, D.; Zhang, S.; Du, Y. Magnetocaloric properties of Ag-substituted perovskite-type manganites. J. Magn. Magn. Mater. 2000, 222, 110–114. [Google Scholar] [CrossRef]
  24. Thaljaoui, R.; Boujelben, W.; Pękała, K.; Pękała, M.; Cheikhrouhou-Koubaa, W.; Cheikhrouhou, A. Magnetocaloric study of monovalent-doped manganites Pr0.6Sr0.4−xNaxMnO3 (x = 0–0.2). J. Mater. Sci. 2013, 48, 3894–3903. [Google Scholar] [CrossRef]
  25. Varshney, D.; Dodiya, N. Metallic and semi-conducting resistivity behaviour of La0.7Ca0.3−xKxMnO3 (x = 0.05, 0.1) manganites. J. Theor. Appl. Phys. 2015, 9, 45–58. [Google Scholar] [CrossRef] [Green Version]
  26. Shannon, R.D. Revised effective ionic radii and systematic studies of interatomic distances in halides and chalcogenides. Acta Crystallogr. Sect. A 1976, 32, 751–767. [Google Scholar] [CrossRef]
  27. Ayadi, F.; Saadaoui, F.; Cheikhrouhou-Koubaa, W.; Koubaa, M.; Cheikhrouhou, A.; Sicard, L.; Ammar, S. Effect of monovalent doping on the physical properties of La0.7Sr0.3MnO3 compound synthesized using sol-gel technique. IOP Conf. Ser. Mater. Sci. Eng. 2012, 28, 012054. [Google Scholar] [CrossRef]
  28. Cheikh-Rouhou Koubaa, W.; Koubaa, M.; Cheikhrouhou, A. Effect of Monovalent Doping on the Structural, Magnetic and Magnetocaloric Properties in La0.7M0.2M′0.1MnO3 Manganese Oxides (M = Sr, Ba and M′ = Na, Ag, K). Phys. Procedia 2009, 2, 989–996. [Google Scholar] [CrossRef] [Green Version]
  29. Koubaa, M.; Koubaa, W.C.-R.; Cheikhrouhou, A. Magnetocaloric effect and magnetic properties of La0.75Ba0.1M0.15MnO3 (M = Na, Ag and K) perovskite manganites. J. Alloys Compd. 2009, 479, 65–70. [Google Scholar] [CrossRef]
  30. Regaieg, Y.; Koubaa, M.; Koubaa, W.C.; Cheikhrouhou, A.; Sicard, L.; Ammar-Merah, S.; Herbst, F. Structure and magnetocaloric properties of La0.8Ag0.2−xKxMnO3 perovskite manganites. Mater. Chem. Phys. 2012, 132, 839–845. [Google Scholar] [CrossRef]
  31. Koubaa, M.; Cheikhrouhou Koubaa, W.; Cheikhrouhou, A. Magnetic and magnetocaloric properties of monovalent substituted La0.65M0.3M′0.05MnO3 (M = Ba, Ca and M′ = Na, Ag, K) perovskite manganites. Phys. Procedia 2009, 2, 997–1004. [Google Scholar] [CrossRef] [Green Version]
  32. Zhong, W.; Au, C.-T.; Du, Y.-W. Review of magnetocaloric effect in perovskite-type oxides. Chin. Phys. B 2013, 22, 057501. [Google Scholar] [CrossRef]
  33. Phan, M.H.; Tian, S.B.; Hoang, D.Q.; Yu, S.C.; Nguyen, C.; Ulyanov, A.N. Large magnetic-entropy change above 300 K in CMR materials. J. Magn. Magn. Mater. 2003, 258–259, 309–311. [Google Scholar] [CrossRef]
  34. Banik, S.; Das, I. Effect of A-site ionic disorder on magnetocaloric properties in large band width manganite systems. J. Alloys Compd. 2018, 742, 248–255. [Google Scholar] [CrossRef]
  35. Pham, Y.; Manh, T.V.; Thanh, T.D.; Yang, D.S.; Yu, S.C.; Kim, D.H. Magnetic and table-like magnetocaloric properties of polycrystalline Pr0.7Ba0.1Sr0.2MnO3. J. Electron. Mater. 2019, 48, 6583–6590. [Google Scholar] [CrossRef]
  36. Li, Y.; Xue, L.; Fan, L.; Yan, Y. The effect of citric acid to metal nitrates molar ratio on sol–gel combustion synthesis of nanocrystalline LaMnO3 powders. J. Alloys Compd. 2009, 478, 493–497. [Google Scholar] [CrossRef]
  37. Xi, S.; Lu, W.; Sun, Y. Magnetic properties and magnetocaloric effect of La0.8Ca0.2MnO3 nanoparticles tuned by particle size. J. Appl. Phys. 2012, 111, 063922. [Google Scholar] [CrossRef]
  38. Toby, B.H.; Von Dreele, R.B. GSAS-II: The genesis of a modern open-source all purpose crystallography software package. J. Appl. Crystallogr. 2013, 46, 544–549. [Google Scholar] [CrossRef]
  39. Shaikh, M.W.; Varshney, D. Structural properties and electrical resistivity behaviour of La1−xKxMnO3 (x = 0.1, 0.125 and 0.15) manganites. Mater. Chem. Phys. 2012, 134, 886–898. [Google Scholar] [CrossRef]
  40. Chebaane, M.; Bellouz, R.; Oumezzine, M.; Hlil, E.K.; Fouzri, A. Copper-doped lanthanum manganite La0.65Ce0.05Sr0.3Mn1−xCuxO3 influence on structural, magnetic and magnetocaloric effects. RSC Adv. 2018, 8, 7186–7195. [Google Scholar] [CrossRef] [Green Version]
  41. Holzwarth, U.; Gibson, N. The Scherrer equation versus the “Debye-Scherrer equation”. Nat. Nanotechnol. 2011, 6, 534. [Google Scholar] [CrossRef]
  42. Williamson, G.; Hall, W. X-ray line broadening from filed aluminium and wolfram. Acta Metall. 1953, 1, 22–31. [Google Scholar] [CrossRef]
  43. Thaljaoui, R.; Boujelben, W.; Pękała, M.; Pękała, K.; Fagnard, J.-F.; Vanderbemden, P.; Donten, M.; Cheikhrouhou, A. Magnetocaloric effect of monovalent K doped manganites Pr0.6Sr0.4−xKxMnO3 (x = 0 to 0.2). J. Magn. Magn. Mater. 2014, 352, 6–12. [Google Scholar] [CrossRef]
  44. Jerbi, A.; Thaljaoui, R.; Krichene, A.; Boujelben, W. Structural, magnetic and electrical study of polycrystalline Pr0.55Sr0.45−xKxMnO3 (x = 0, 0.05 and 0.1). Phys. B Condens. Matter 2014, 442, 21–28. [Google Scholar] [CrossRef]
  45. Zhou, W.; Greer, H.F. What can electron microscopy tell us beyond crystal structures? Eur. J. Inorg. Chem. 2016, 2016, 941–950. [Google Scholar] [CrossRef] [Green Version]
  46. Uvarov, V.; Popov, I. Metrological characterization of X-ray diffraction methods at different acquisition geometries for determination of crystallite size in nano-scale materials. Mater. Charact. 2013, 85, 111–123. [Google Scholar] [CrossRef]
  47. Solanki, P.S.; Doshi, R.R.; Thaker, C.M.; Pandya, S.; Ganesan, V.; Kuberkar, D.G. Transport and Magnetotransport Studies on Sol–Gel Grown Nanostructured La0.7Pb0.3MnO3 Manganites. J. Nanosci. Nanotechnol. 2009, 9, 5681–5686. [Google Scholar] [CrossRef] [PubMed]
  48. Zener, C. Interaction between the d-shells in the transition metals. II. Ferromagnetic compounds of manganese with Perovskite structure. Phys. Rev. 1951, 82, 403–405. [Google Scholar] [CrossRef]
  49. Guo, Z.B.; Du, Y.W.; Zhu, J.S.; Huang, H.; Ding, W.P.; Feng, D. Large magnetic entropy change in perovskite-type manganese oxides. Phys. Rev. Lett. 1997, 78, 1142–1145. [Google Scholar] [CrossRef]
  50. Chau, N.; Nhat, H.N.; Luong, N.H.; Minh, D.L.; Tho, N.D.; Chau, N.N. Structure, magnetic, magnetocaloric and magnetoresistance properties of La1−xPbxMnO3 perovskite. Phys. B Condens. Matter 2003, 327, 270–278. [Google Scholar] [CrossRef]
  51. Das, S.; Dey, T.K. Magnetic entropy change in polycrystalline La1−xKxMnO3 perovskites. J. Alloys Compd. 2007, 440, 30–35. [Google Scholar] [CrossRef]
  52. Izyumov, Y.A.; Skryabin, Y.N. Double exchange model and the unique properties of the manganites. Uspekhi Fiz. Nauk 2001, 171, 147–148. [Google Scholar] [CrossRef]
  53. Abdelmoula, N.; Cheikh-Rouhou, A.; Reversat, L. Structural, magnetic and magnetoresistive properties of La0.7Sr0.3−xNaxMnO3 manganites. J. Phys. Condens. Matter 2001, 13, 449–458. [Google Scholar] [CrossRef]
  54. Radaelli, P.; Iannone, G.; Marezio, M. Structural effects on the magnetic and transport properties of perovskite A1−xA′xMnO3 (x = 0.25, 0.30). Phys. Rev. B 1997, 56, 8265–8276. [Google Scholar] [CrossRef]
  55. Koubaa, M.; Cheikhrouhou-Koubaa, W.; Cheikhrouhou, A. Effect of K doping on the physical properties of La0.65Ca0.35−xKxMnO3 (0 ⩽ x ⩽ 0.2) perovskite manganites. J. Phys. Chem. Solids 2009, 70, 326–333. [Google Scholar] [CrossRef]
  56. Ben Khlifa, H.; Othmani, S.; Chaaba, I.; Tarhouni, S.; Cheikhrouhou-Koubaa, W.; Koubaa, M.; Cheikhrouhou, A.; Hlil, E.K. Effect of K-doping on the structural, magnetic and magnetocaloric properties of Pr0.8Na0.2−xKxMnO3 (0 ≤ x ≤ 0.15) manganites. J. Alloys Compd. 2016, 680, 388–396. [Google Scholar] [CrossRef]
  57. Zaidi, A.; Cherif, K.; Dhahri, J.; Hlil, E.K.; Zaidi, M.; Alharbi, T. Influence of Na-doping in La0.67Pb0.33−xNaxMnO3 (0 ≤ x ≤ 0.15) on its structural, magnetic and magneto-electrical properties. J. Alloys Compd. 2015, 650, 210–216. [Google Scholar] [CrossRef]
  58. Modi, A.; Gaur, N.K. Effect of Sm substitution on magnetic and magnetocaloric properties of La0.7−xSmxBa 0.3MnO3 (0 ≤ x ≤ 0.2) compounds. J. Magn. Magn. Mater. 2017, 441, 217–221. [Google Scholar] [CrossRef]
  59. Cullity, B.D.; Graham, C.D. Introduction to Magnetic Materials; John Wiley & Sons: Hoboken, NJ, USA, 2011. [Google Scholar]
  60. Bohigas, X.; Tejada, J.; Marínez-Sarrión, M.; Tripp, S.; Black, R. Magnetic and calorimetric measurements on the magnetocaloric effect in La0.6Ca0.4MnO3. J. Magn. Magn. Mater. 2000, 208, 85–92. [Google Scholar] [CrossRef]
  61. Bouzaiene, E.; Dhahri, A.H.; Dhahri, J.; Hlil, E.K.; Bajahzar, A. Effect of A-site-substitution on structural, magnetic and magnetocaloric properties in La0.7Sr0.3Mn0.9Cu0.1O3 manganite. J. Magn. Magn. Mater. 2019, 491, 165540. [Google Scholar] [CrossRef]
  62. Hueso, L.E.; Sande, P.; Miguéns, D.R.; Rivas, J.; Rivadulla, F.; López-Quintela, M.A. Tuning of the magnetocaloric effect in La0.67Ca0.33MnO3−δ nanoparticles synthesized by sol-gel techniques. J. Appl. Phys. 2002, 91, 9943–9947. [Google Scholar] [CrossRef]
  63. Franco, V.; Conde, A.; Kuz’min, M.D.; Romero-Enrique, J.M. The magnetocaloric effect in materials with a second order phase transition: Are TC and Tpeak necessarily coincident? J. Appl. Phys. 2009, 105, 07A917. [Google Scholar] [CrossRef]
  64. Koubaa, W.C.-R.; Koubaa, M.; Cheikhrouhou, A. Magnetic entropy change in the monovalent doping La0.7Ba0.2M0.1MnO3 (M = Na, Ag, K) manganites. J. Mater. Sci. 2009, 44, 1780–1786. [Google Scholar] [CrossRef]
  65. Amano, M.E.; Betancourt, I.; Sánchez Llamazares, J.L.; Huerta, L.; Sánchez-Valdés, C.F. Mixed-valence La0.80(Ag1−xSrx)0.20MnO3 manganites with magnetocaloric effect. J. Mater. Sci. 2014, 49, 633–641. [Google Scholar] [CrossRef]
  66. Ben Jemaa, F.; Mahmood, S.; Ellouze, M.; Hlil, E.K.; Halouani, F.; Bsoul, I.; Awawdeh, M. Structural, magnetic and magnetocaloric properties of La0.67Ba0.22Sr0.11Mn1−xFexO3 nanopowders. Solid State Sci. 2014, 37, 121–130. [Google Scholar] [CrossRef]
  67. Ben Rejeb, M.; Cheikhrouhou-Koubaa, W.; Koubaa, M.; Cheikhrouhou, A. Effect of elaborating method on magnetic and magnetocaloric properties of La0.65Ca0.35−xKxMn0.3(0 ≤ x ≤ 0.2) manganites. J. Supercond. Nov. Magn. 2015, 28, 839–846. [Google Scholar] [CrossRef]
  68. Messaoui, I.; Riahi, K.; Kumaresavanji, M.; Cheikhrouhou Koubaa, W.; Cheikhrouhou, A. Potassium doping induced changes of magnetic and magnetocaloric properties of La0.78Cd0.22−xKxMnO3 (x = 0.00, 0.10, 0.15 and 0.20) manganites. J. Magn. Magn. Mater. 2018, 446, 108–117. [Google Scholar] [CrossRef]
  69. Dhahri, A.; Dhahri, J.; Dhahri, E. Effect of potassium doping on physical properties of perovskites La0.8Cd0.2−xKxMnO3. J. Alloys Compd. 2010, 489, 9–12. [Google Scholar] [CrossRef]
  70. Koubaa, W.C.-R.; Koubaa, M.; Cheikhrouhou, A. Effect of potassium doping on the structural, magnetic and magnetocaloric properties of La0.7Sr0.3−xKxMnO3 perovskite manganites. J. Alloys Compd. 2009, 470, 42–46. [Google Scholar] [CrossRef]
  71. Franco, V.; Conde, A.; Romero-Enrique, J.M.; Blázquez, J.S. A universal curve for the magnetocaloric effect: An analysis based on scaling relations. J. Phys. Condens. Matter 2008, 20, 285207. [Google Scholar] [CrossRef]
Figure 1. Powder diffraction pattern and the corresponding Rietveld refinement of La0.8−xKxBa0.05Sr0.15MnO3 (0 ≤ x ≤ 0.20) samples. (a) LKBS-0; (b) LKBS-05; (c) LKBS-10; (d) LKBS-15 and (e) LKBS-20.
Crystals 10 00407 g001
Figure 2. SEM micrograph of (a) LKBS-0, (b) LKBS-05, (c) LKBS-10, (d) LKBS-15, and (e) LKBS-20.
Crystals 10 00407 g002
Figure 3. EDX spectra and elemental maps for six different elements of (a) LKBS-05 and (b) LKBS-15 samples.
Crystals 10 00407 g003
Figure 4. Temperature dependence of (a) magnetization and (b) inverse of magnetic susceptibility for La0.8−xKxBa0.05Sr0.15MnO3 samples. Inset shows the first derivative of magnetization with respect to temperature.
Crystals 10 00407 g004
Figure 5. Isothermal magnetization curves taken at temperatures near the FM-PM transition for (a) LKBS-0, (b) LKBS-05, (c) LKBS-10, (d) LKBS-15, and (e) LKBS-20 samples.
Crystals 10 00407 g005aCrystals 10 00407 g005b
Figure 6. Magnetic entropy changes as a function of temperatures under an applied magnetic field ranging from 1 to 5 T for (a) LKBS-0, (b) LKBS-05, (c) LKBS-10, (d) LKBS-15, and (e) LKBS-20. (f) The comparison of the largest magnetic entropy changes of each sample obtained at 5 T.
Crystals 10 00407 g006
Figure 7. Comparison between T C and Δ S M ,   M A X   with < r A > and σ 2 value for La0.8−xKxBa0.05Sr0.15MnO3 samples.
Crystals 10 00407 g007
Figure 8. The universal master curve for (a) LKBS-0, (b) LKBS-05, (c) LKBS-10, (d) LKBS-15, and (e) LKBS-20 samples.
Crystals 10 00407 g008aCrystals 10 00407 g008b
Table 1. Results of Rietveld refinements obtained from powder diffraction pattern measured at room temperature for La0.8−xKxBa0.05Sr0.15MnO3 (0 ≤ x ≤ 0.20).
Structural ParametersSample Code
LKBS-0LKBS-05LKBS-10LKBS-15LKBS-20
a = b (Å)5.5265.5235.5155.5065.506
c (Å)13.39813.40313.39813.39413.4
V (Å3)354.296354.076352.959351.667351.720
t G 0.9300.9380.9470.9560.965
< r A > 1.2431.2601.2761.2931.310
σ 2 (×10−3 Å2)3.8338.23712.08315.37118.101
CSCH (nm)38.5761.7558.6658.3758.86
CW-H (nm)133.32211.07156.61172.08173.88
RWP (%)9.6819.2209.3038.6239.035
χ2 (%)1.131.141.091.191.21
Table 2. Weight percent of each element of La0.8−xKxBa0.05Sr0.15MnO3 (0 ≤ x ≤ 0.20) samples obtained from EDX quantitative analysis.
ElementsWeight Percent (%)
Sample Code
LKBS-0LKBS-05LKBS-10LKBS-15LKBS-20
O22.4922.0922.8922.6421.62
Mn22.1122.9123.2323.0223.3
K00.510.750.860.9
Sr5.295.16.216.656.43
Ba2.482.72.073.213.46
La47.6346.744.8543.6244.29
Total100100100100100
Table 3. Magnetic parameters of La0.8−xKxBa0.05Sr0.15MnO3 samples.
Magnetic ParametersSample Code
LKBS-0LKBS-05LKBS-10LKBS-15LKBS-20
Mn3+ (expected)0.80.750.70.650.6
Mn4+ (expected)0.20.250.30.350.4
Mn3+/Mn4+4/13/17/313/73/2
d < M n O > (°)1.971.971.961.971.95
< M n O M n > ( ° ) 164.10163.30164.60162.50168.03
W (× 10−2)9.389.429.489.539.56
T C (K)320335345355360
θ C W 328341.6353.1361.5361.8
μ e f f t h e o ( μ B )4.6764.624.5644.5084.452
μ e f f e x p ( μ B )5.4715.7105.885.3015.21
Table 4. Summary of Δ S M ,   M A X and RCP value of LKBS samples compared with several related compounds.
Sample T C   ( K ) Δ S M ,   M A X   ( J / kg .   K ) RCP (J/kg) Δ μ 0 H   ( T ) Re
LKBS-03201.15166.11this work
LKBS-053351.551301this work
LKBS-103451.651321this work
LKBS-153551.611031this work
LKBS-203601.181121this work
La0.7Ba0.2K0.1MnO3311.50.74-1[64]
La0.75Ba0.1K0.15MnO32591.28-1[29]
La0.6Ba0.2Sr0.2MnO33542.26-1[33]
LKBS-03204.212545this work
LKBS-053354.992195this work
LKBS-103455.192495this work
LKBS-153554.833015this work
LKBS-203603.901735this work
La0.8(Ag0.25Sr0.75)0.2MnO33363.42755[65]
La0.7Sr0.2Na0.1MnO33404.07118.45[28]
La0.67Ba0.22Sr0.11MnO33452.2581935[66]

