Luminescence Behavior of GdVO4: Tb Nanocrystals in Silica Glass-Ceramics

1
Key Laboratory of Materials for High Power Laser, Shanghai Institute of Optics and Fine Mechanics, Chinese Academy of Sciences, Shanghai 201800, China
2
Center of Materials Science and Optoelectronics Engineering, University of Chinese Academy of Sciences, Beijing 100049, China
3
Institute of Materials, China Academy of Engineering Physics, Mianyang 621000, China
*
Author to whom correspondence should be addressed.
Crystals 2020, 10(5), 396; https://doi.org/10.3390/cryst10050396
Submission received: 17 April 2020
/
Revised: 12 May 2020
/
Accepted: 12 May 2020
/
Published: 15 May 2020
(This article belongs to the Special Issue Transparent Glass Ceramics)
Abstract
:Glass ceramics with GdVO4: Tb nanocrystals impregnated in the highly transparent silica glass were prepared by the porous glass and sintering process and confirmed by XRD, Raman spectrum, and TEM. Spectral analysis shows that there are multifarious energy transfer processes in GdVO4: Tb nanocrystals, such as VO43− → Tb3+, Gd3+ → VO43−, Gd3+ → VO43− → Tb3+, and Gd3+ → Tb3+, and the main one is VO43− → Tb3+. In this process, 3T1,2 → 1A1 transition of VO43− transfers the energy to Tb3+ and generates 5D3 → 7F6,5,4,3,2 and 5D4 → 7F5 transitions of Tb3+. The energy transfer efficiency is 29.5%, and the excitation wavelength range of Tb3+ ions can be shifted from 230–260 nm to 280–365 nm. This shows that GdVO4 can effectively change the excitation wavelength of Tb3+, which is conducive to the application of Tb3+ ions excited by LED light sources.
1. Introduction
In recent years, rare-earth ion doped phosphors have been widely studied due to their excellent luminescent properties. Among many rare earth elements, the 5D4 → 7F5 transition of Tb3+ leads to a very strong green photoluminescence (PL) at around 545 nm. This kind of green fluorescence has strong potential applications in blue-green laser, undersea communication, and medical equipment [1,2]. However, due to the strictly forbidden 4f → 4f transitions, the optimal excitation wavelength of Tb3+ is near 240 nm, which is too short for a commercial Light-Emitting Diode (LED) light source, thus directly affecting the application of Tb3+ ions [3,4]. An effective way to change the excitation wavelength of Tb3+ is to introduce a suitable sensitizer, which can transfer the energy absorbed from LED light source to Tb3+. A large number of reports have been focused on this aspect, mainly through Ce3+ or Eu2+ to sensitize Tb3+ [1,5,6].
Rare earth doped gadolinium vanadate crystal (GdVO4: RE) is considered as an excellent luminescent material because of its excellent chemical stability, high thermal conductivity, strong energy absorption, and high energy transfer efficiency [7,8]. GdVO4: Tb can effectively improve the PL intensity and transfer excitation wavelength of Tb3+ due to its efficient absorption of ultraviolet light and energy transfer (ET) from Gd3+ and VO43− to Tb3+, so as to expand the application of Tb3+ luminescent materials [9,10]. There are many papers about the GdVO4: Tb, but most of them were nanocrystalline phosphors. If the nanocrystals can be synthesized into transparent glass, the application field of the luminescent nanocrystals will be further improved.
Due to their composition having more than 97% SiO2 and distributed interconnected nanopores, nano-porous silica glass (NPSG) has been researched. Lots of works have reported that NPSG can be used in many fields after doping and sintering due to its ability to effectively disperse rare-earth ions [11,12]. It is not difficult to imagine if luminescence nanocrystals can be grown in the connected nanopores, the size of the nanocrystals will be limited, and a transparent luminescence material could be obtained. In addition, luminescence nanocrystals can be effectively dispersed by interconnected nanopores in the glass, avoiding the clusters of luminescence ions and improving their luminescence properties. Simultaneously, as the protective shell of nanocrystals, silica glass can effectively improve the chemical, mechanical, and high temperature stability of luminescent materials.
The transparent glass ceramics doped with luminescent ions can effectively combine crystal and glass with many excellent properties, which makes it have many applications in the fields of luminescent, laser and nonlinear optics, and has been favored by many scholars in recent years [13,14,15,16]. Therefore, if we combine the excellent properties of GdVO4: Tb and silica glass together to synthesize a transparent glass ceramics, then this transparent luminescence glass-ceramics not only can be applicable to phosphor [17,18], but also to laser, such as laser medium materials [12,19], fiber core of microstructure fiber, and high-power fiber [20,21,22].
In general, the purpose of this research is to synthesize a transparent silica glass-ceramics (SGC) containing GdVO4: Tb nanocrystallites. The synthesized SGC contains the advantages of both silica glass and GdVO4: Tb crystal and is a green luminescent material. Moreover, we would comprehensively study the changes in the luminescent properties of Tb3+ and the ET process of Gd3+ and VO43− to Tb3+ in this SCG.
2. Experiment
2.1. Synthesis of NPSG and SGC
The phase-separated alkali-borosilicate glass was made first. Then, the borate phase was removed by leaching with hot nitric acid solutions and NPSG was obtained. The obtained glass has a content of silica as high as 97% or more [23]. After that, NPSG were immersed in Gd3+, V5+, and Tb3+ mixed-ion solutions (Gd(NO3)3·6H2O, VOSO4, and Tb(NO3)3·6H2O) for 1–2 h and dried at room temperature for 20–40 h. Subsequently, the porous glass embedded with active ions was sintered at 1050 °C and 1150 °C in an oxygen atmosphere [11]. Finally, SGC and uncrystallined glass were obtained after being ground and polished. Basic information of various samples with different ion concentration and crystalline statuses are listed in Table 1.
2.2. Instruments and Measurements
The X-ray diffraction (XRD) patterns of samples were carried out on a diffractometer with Cu Kα radiation (Smartlab9, Rigaku, Japan). Measurements were performed in the angular range 10° ≤ 2θ ≤ 60°. The Micro-Raman spectra were collected using a laser Raman microscope (Renishaw InVia, Wotton-under-Edge, UK) equipped with a 488-nm laser. The micromorphology of samples was characterized by transmission electron microscopy (TEM) (FEI Tecnai G2 F20, Thermo Fisher Scientific, Waltham, MA, USA). Transmittance spectra were recorded with a UV/visible/near-infrared spectrophotometer (Jasco V-570, Tokyo, Japan). The thickness of the samples is 1.5 mm. The photoluminescence excitation (PLE) spectra, photoluminescence (PL) spectra, and fluorescence lifetimes (FL) were measured at room temperature on a high-resolution spectrofluorometer (Photon Technology International (Canada) Inc. QM/TM/NIR, London, ON, Canada), utilizing a Xenon lamp as excitation source. Since the excitation and emission spectra are all arbitrary units, the experimental errors will not be discussed. The test errors of absorption spectra and lifetime are all within 5%. However, such errors do not affect the final research results.
3. Results and Discussion
3.1. Structure and Morphology
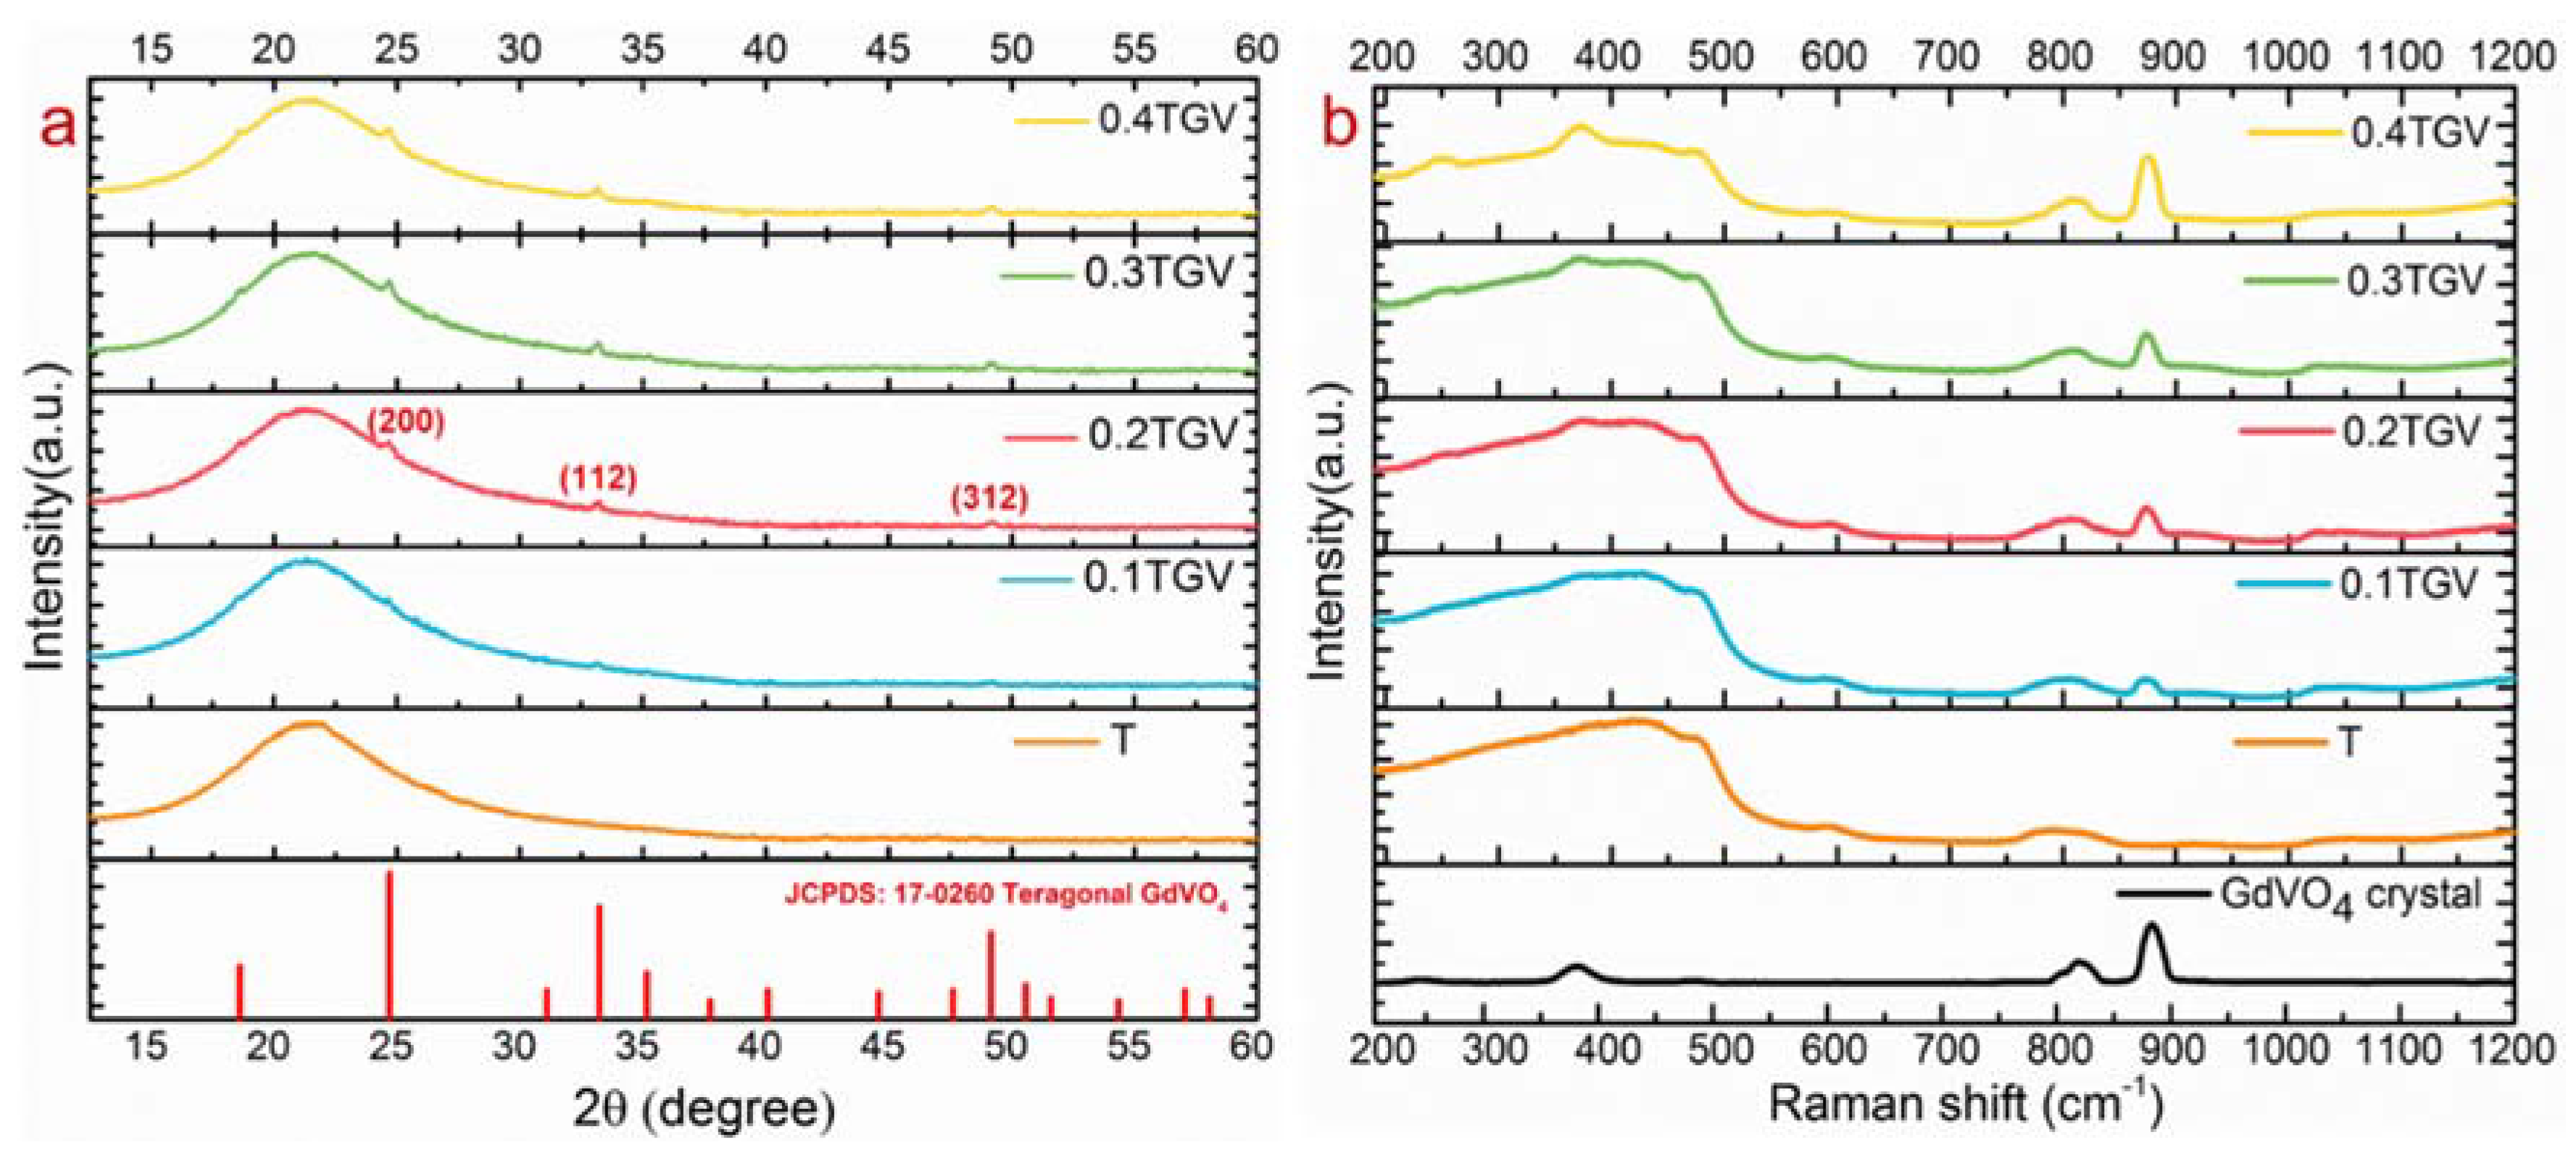
Figure 1a shows the XRD profiles of all samples. For the sample T, no diffraction peak was observed except for the typical amorphous broad scattering patterns, which can be ascribed to the silica glass substrate. In addition to the amorphous scattering patterns, the samples xTGV(x = 0.1–0.4) showed weak diffraction peaks at 2θ = 24.67°, 33.23°, and 49.15° due to the (2 0 0), (1 1 2), and (3 1 2) reflections of tetragonal GdVO4. These peaks indicate that GdVO4 nanocrystals were present in SGC.
Micro-Raman spectroscopes of samples and GdVO4 crystal were also tested and shown in Figure 1b. Several bands near 441, 495, 600, 800, and 1060 cm−1 can be seen in each sample, which can be assigned to the vibrational mode of SiO2 glass [24,25,26,27,28]. In addition, some vibrations were detected in the Raman spectra of xTGV(x = 0.1–0.4), which were located at 263, 380, 485, 820, and 880 cm−1. These peaks due to the modes of (VO4)3− in GdVO4 nanocrystals [29,30,31,32]. The observed peaks were detailed analysis in our early work [11]. Obviously, the existence of GdVO4: Tb was also confirmed by the micro-Raman spectra.
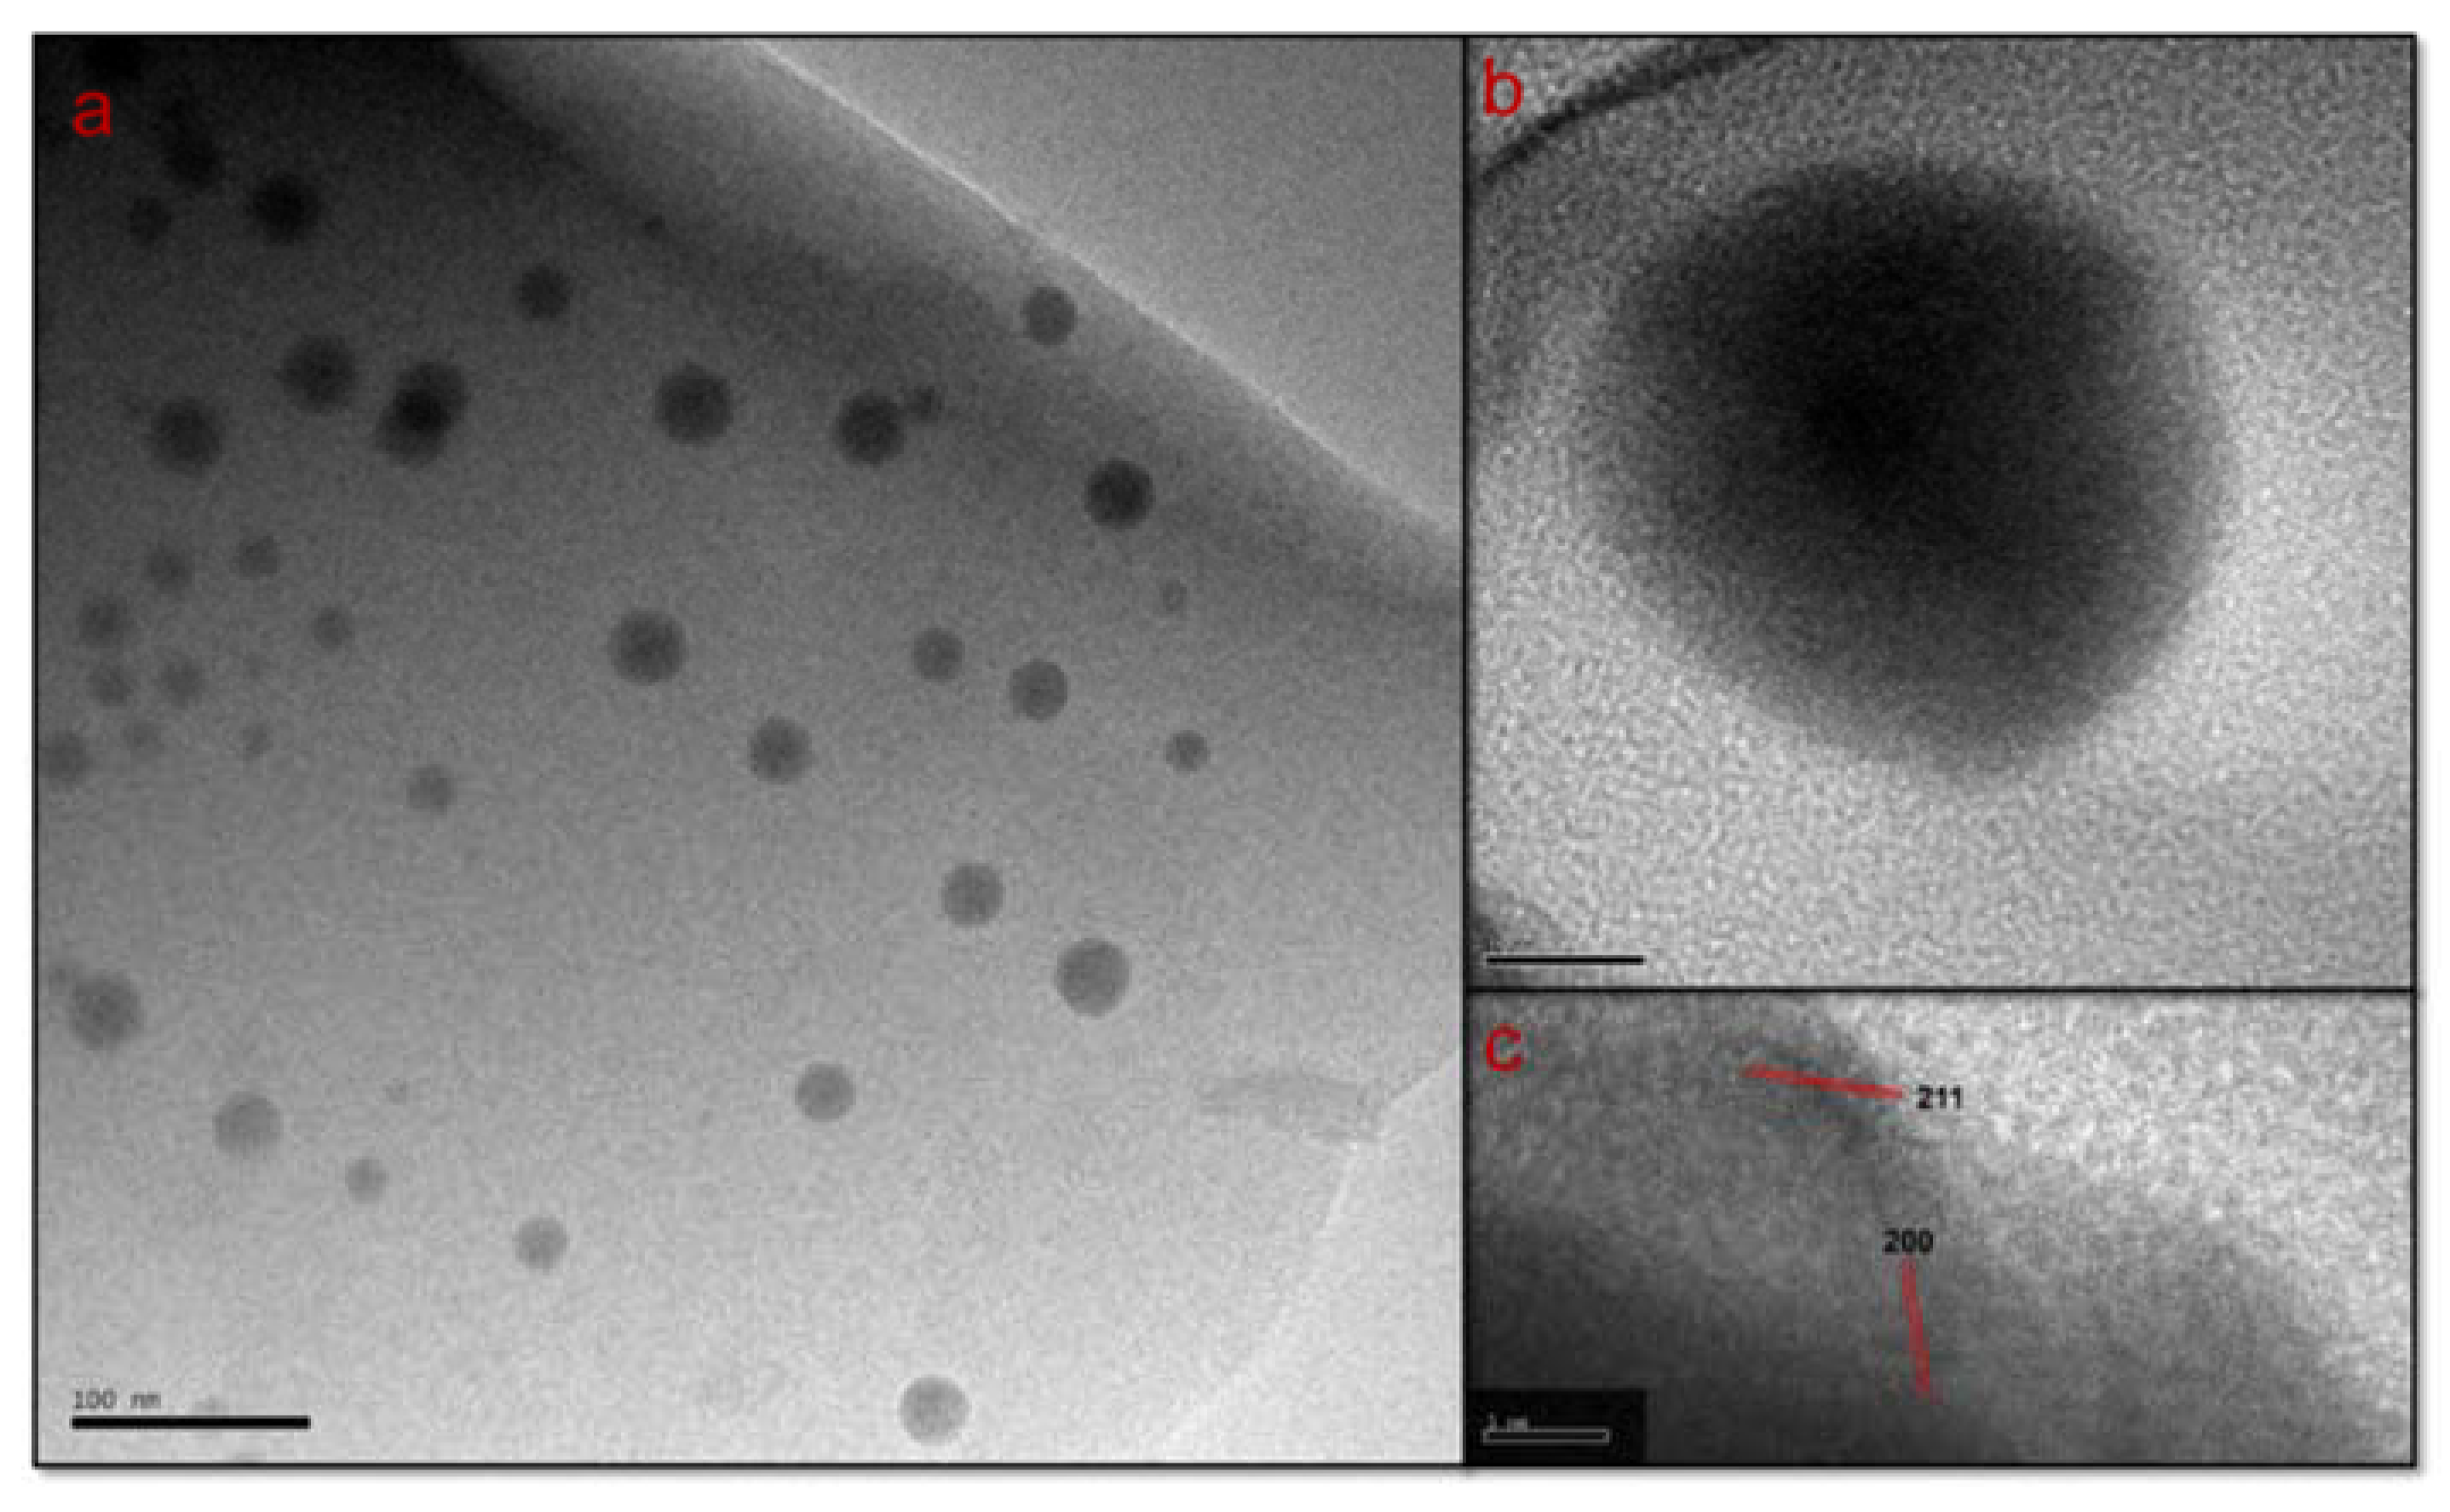
TEM and HR-TEM of sample 0.3TGV were investigated to exhibit the morphology of the grains GdVO4: Tb and its distribution in SGC. TEM micrograph in Figure 2a indicated that nanoparticles were uniformly distributed in SCG, and the diameters were less than 50 nm. Meanwhile, the HR-TEM micrograph in Figure 2b,c shows that a more obvious lattice fringe existed in the sample. The lattice fringes spaced by 0.36 nm and 0.29 nm coincide with the (2 0 0) and (2 1 1) planes of tetragonal GdVO4, respectively [11,33]. The results of the TEM and HR-TEM pictures prove the existence of GdVO4: Tb nanocrystals in SGC further.
3.2. Spectral Properties
3.2.1. Absorption Properties
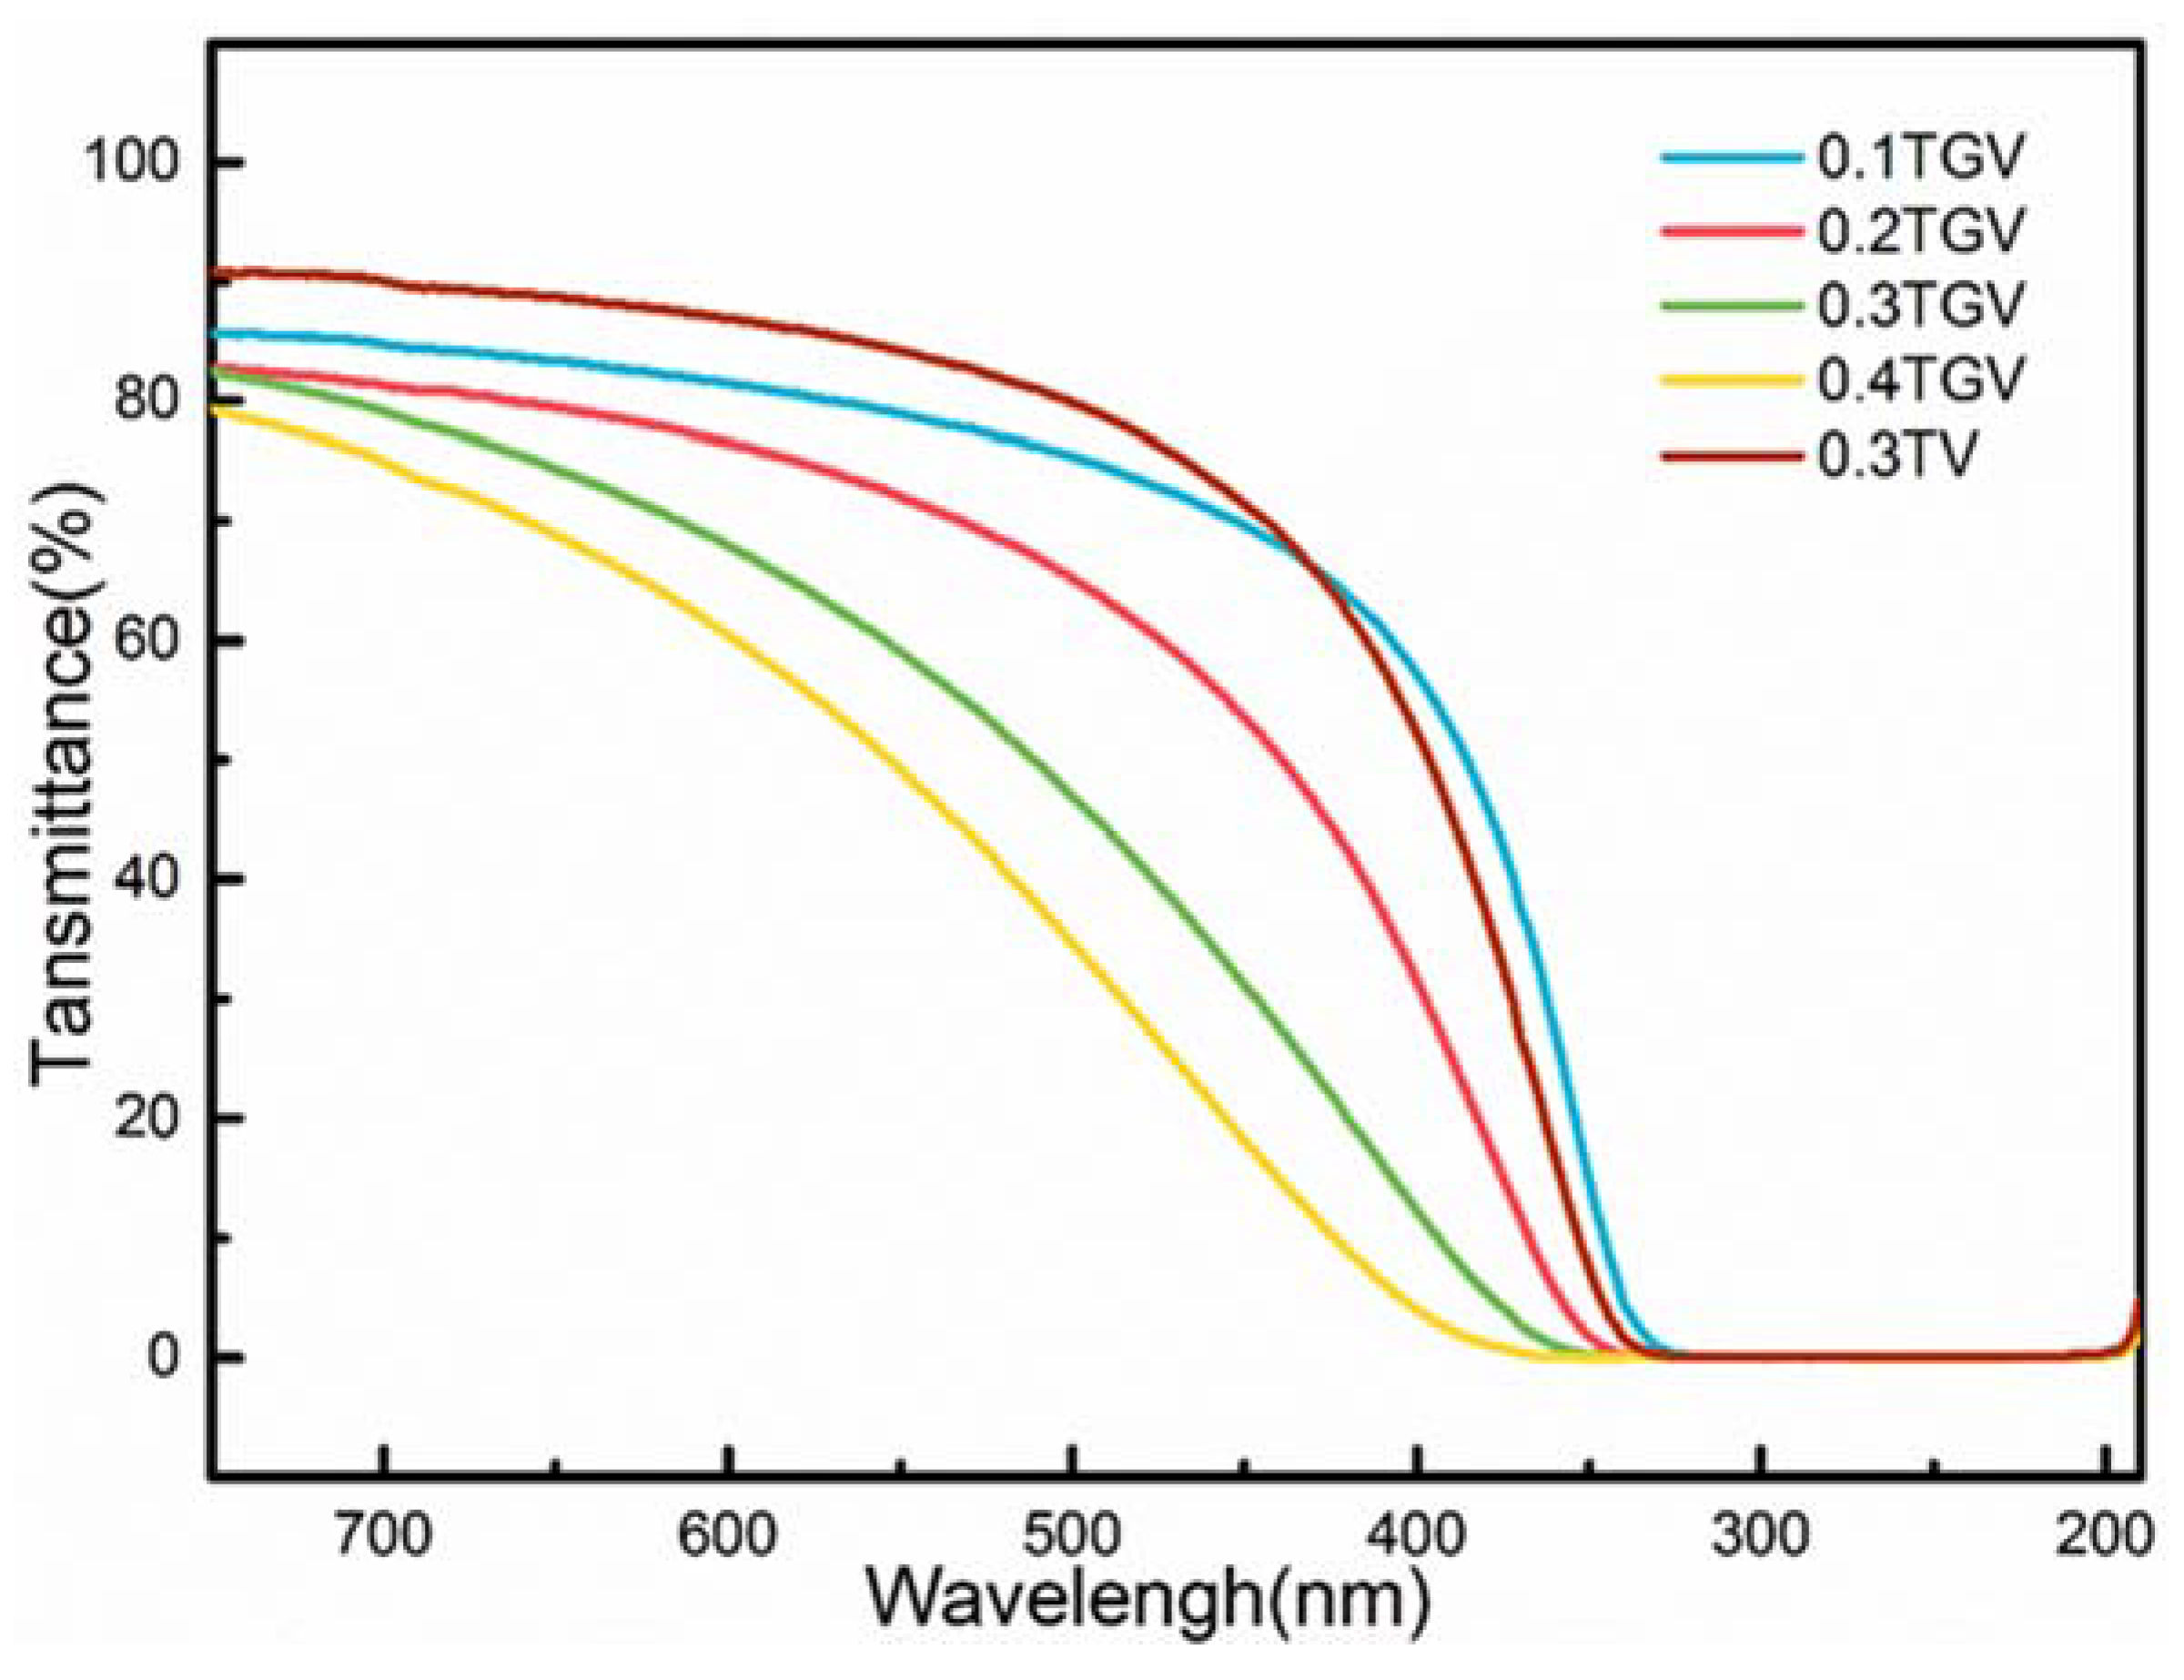
Figure 3 shows the transmittance spectra of xTGV (x = 0.1–0.4). It can be seen that the transmittance of the samples gradually decreased with the increase of the Tb3+ content, and the absorption edges shifted to long wavelengths, which implies that the increase of Tb3+ promotes the growth of microcrystalline in high silica glass. The results of some optical scattering and decreasing transmission is owing to the different refractive index between the particles and matrix glass. Another possibility of the red shifting is from nephelauxetic effect. Since the atomic number of Tb3+ is greater than Gd3+, and the outer layer of Tb3+ has a higher electron density, it causes a decrease in the energy of upper level VO43− through the electron cloud expansion. Therefore, the higher the concentration of Tb3+, the higher the electron density in the whole glass, which increased the covalency around Tb3+ ions and led to the red shift of the absorption edge [34,35].
3.2.2. PLE/PL Properties
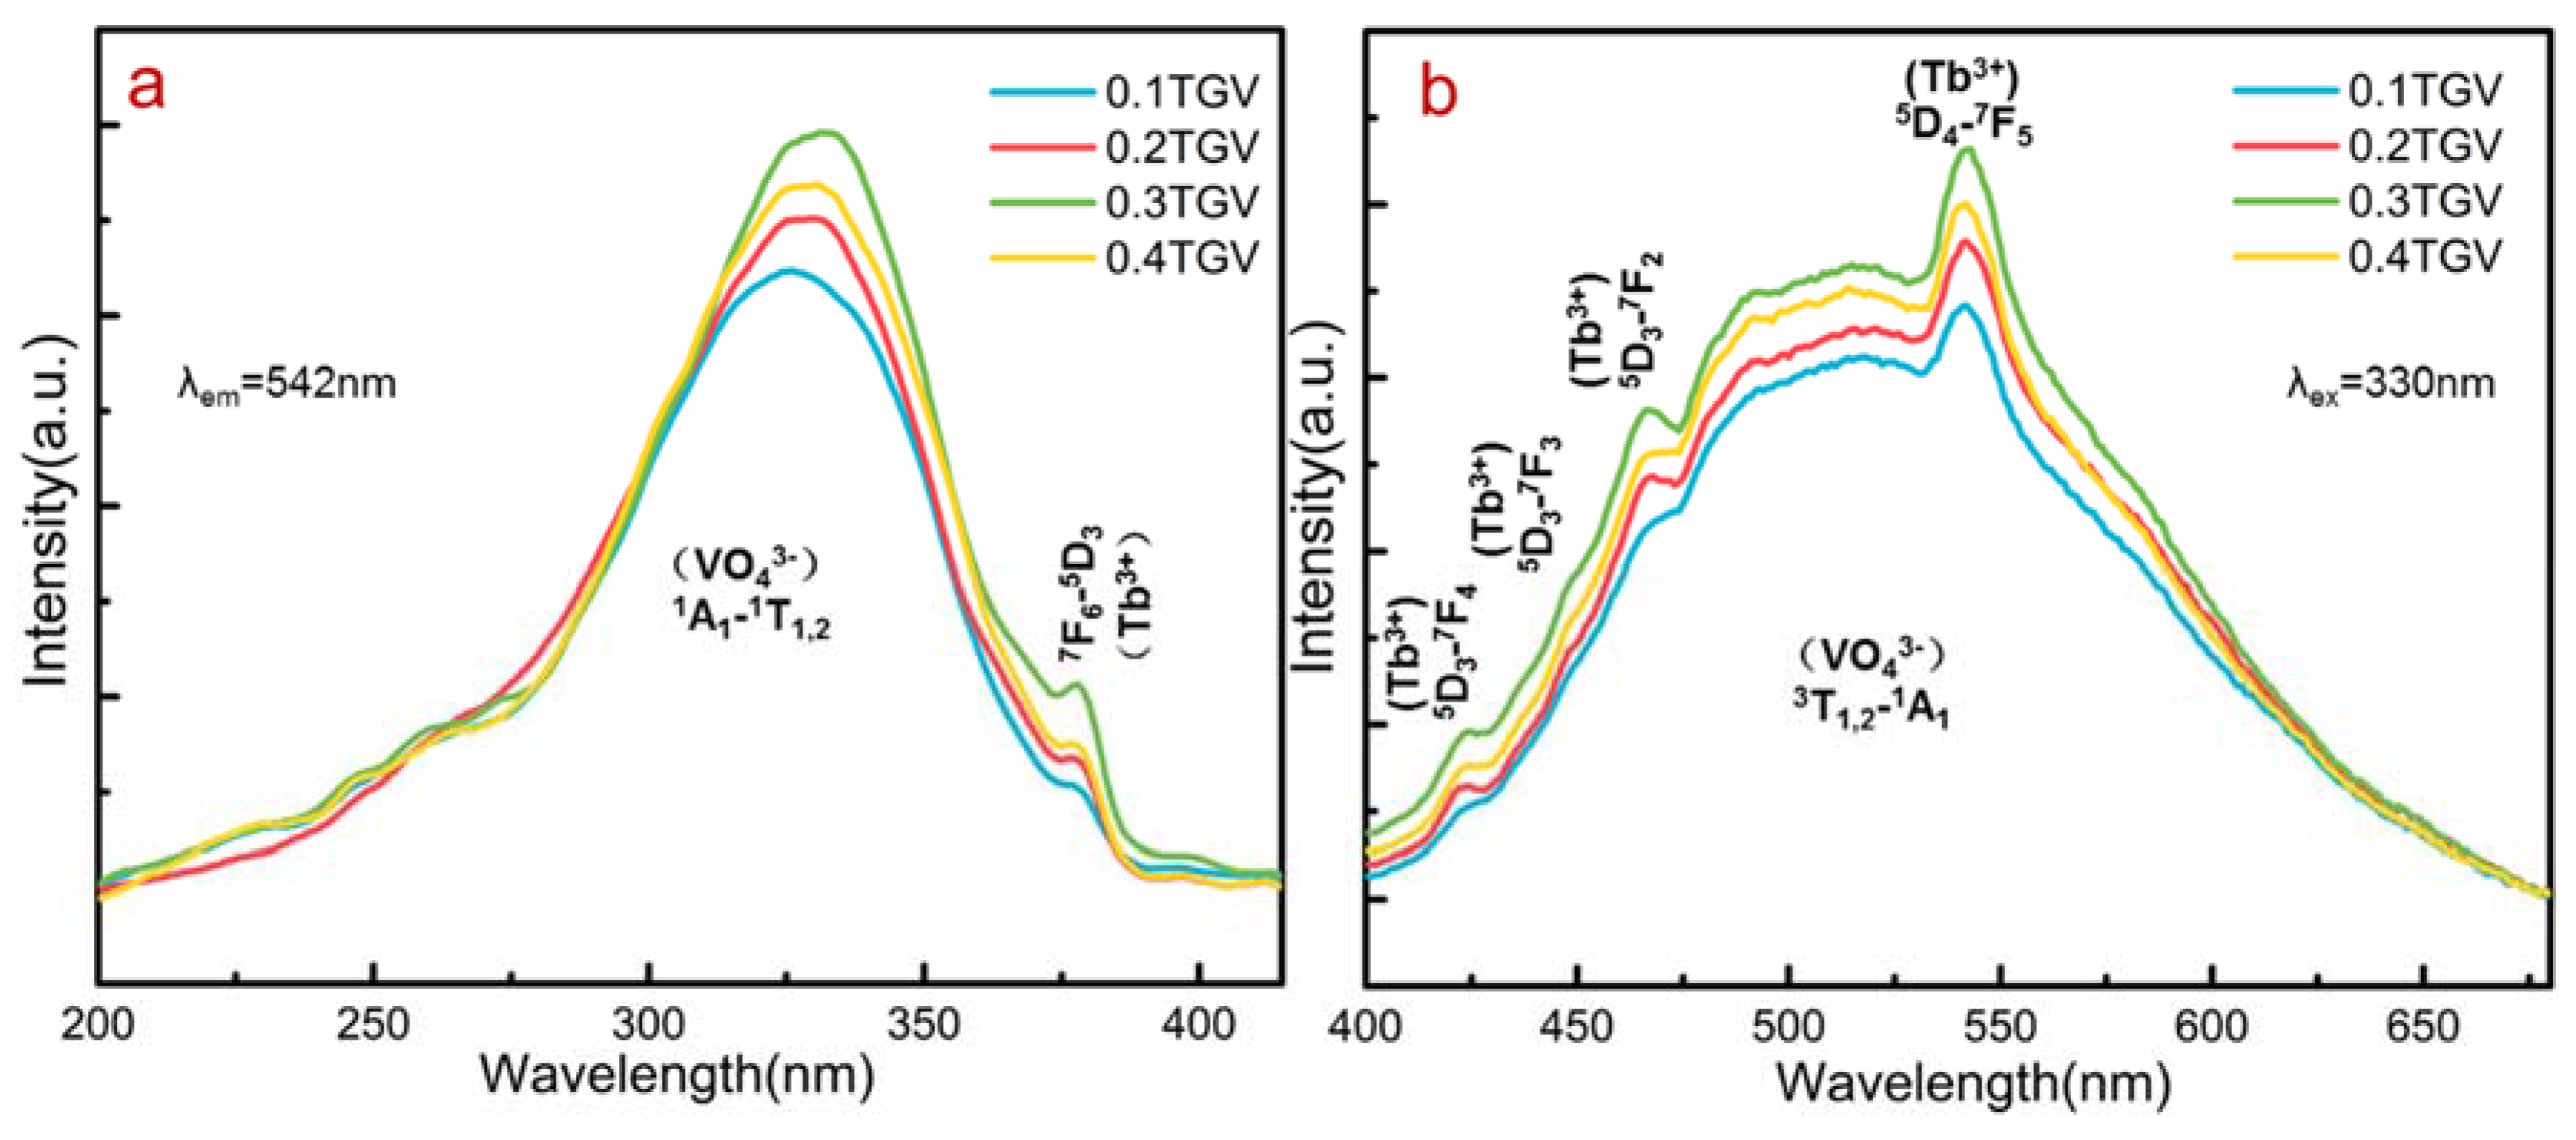
With a fixed concentration of Gd3+ and V5+ as 1 × 10²⁰ ion/cm3, samples with different contents of Tb3+ were fabricated, the PLE spectra and PL spectra were measured and shown in Figure 4. It can be seen that the peak shapes of the PLE and PL spectra for these samples were similar. The main difference was changes in PL intensity. The PL intensity first increases, then starts to decrease with the increased contents of Tb3+, and reaches the strongest when the doping concentration is 0.3 × 10²⁰ ion/cm3, which is due to the fluorescence quenching due to the high concentration of Tb3+. Therefore, the concentration of Tb3+ was fixed at 0.3 × 10²⁰ ion/cm3in the above and subsequent studies.
The PLE spectra of the 5D4 → 7F5 transition of Tb3+ monitored at 542 nm are shown in Figure 4a. It can be seen that the main excitation peak of all samples was located near 330 nm, which reflects an energy transfer process between VO43− and Tb3+ because the excitation peak is mainly caused by the absorption band of VO43− [36,37,38] in contrast to the PLE spectrum of single Tb3+ doped sample T, which will be discussed in the following sections. In addition to the absorption band at 330 nm, a weak absorption peak near 375 nm also can be seen, which can be ascribed to the absorption of the Tb3+ ion 7F6 → 5D3 transition [39,40]. Another change is slight red-shifting of the excitation peak with the concentration increase of Tb3+. The reason for this may be the electron cloud density increased with the increase content of Tb3+, which led to a decrease in the energy of the upper level of VO43− group [36]. The PL spectra of the 5D4 → 7F5 transition of Tb3+ excited at 330 nm are shown in Figure 4b. The emission of Gd3+6P7/2-8S7/2 transitions occurred at 310 nm under 274 nm excited, and therefore does not appear in Figure 4b. Similar to the PLE spectra, the intensity of the emission peak also increased first and then decreased with the increase of Tb3+ concentration, which is also caused by the fluorescence quenching. The broadband emission at 400–650 nm was caused by the 3T1,2 → 1A1 transition of VO43− in each emission spectrum [11]. In addition to this emission band, the PL peaks at 425, 450, 467, and 542 nm were caused by the 5D3 → 7F4,3,2 and 5D4 → 7F5 transitions of Tb3+ ions [39,41]. This further illustrated that ET existed in these samples, so the ET process will be discussed in the subsequent chapter.
3.2.3. Energy Transfer Mechanism
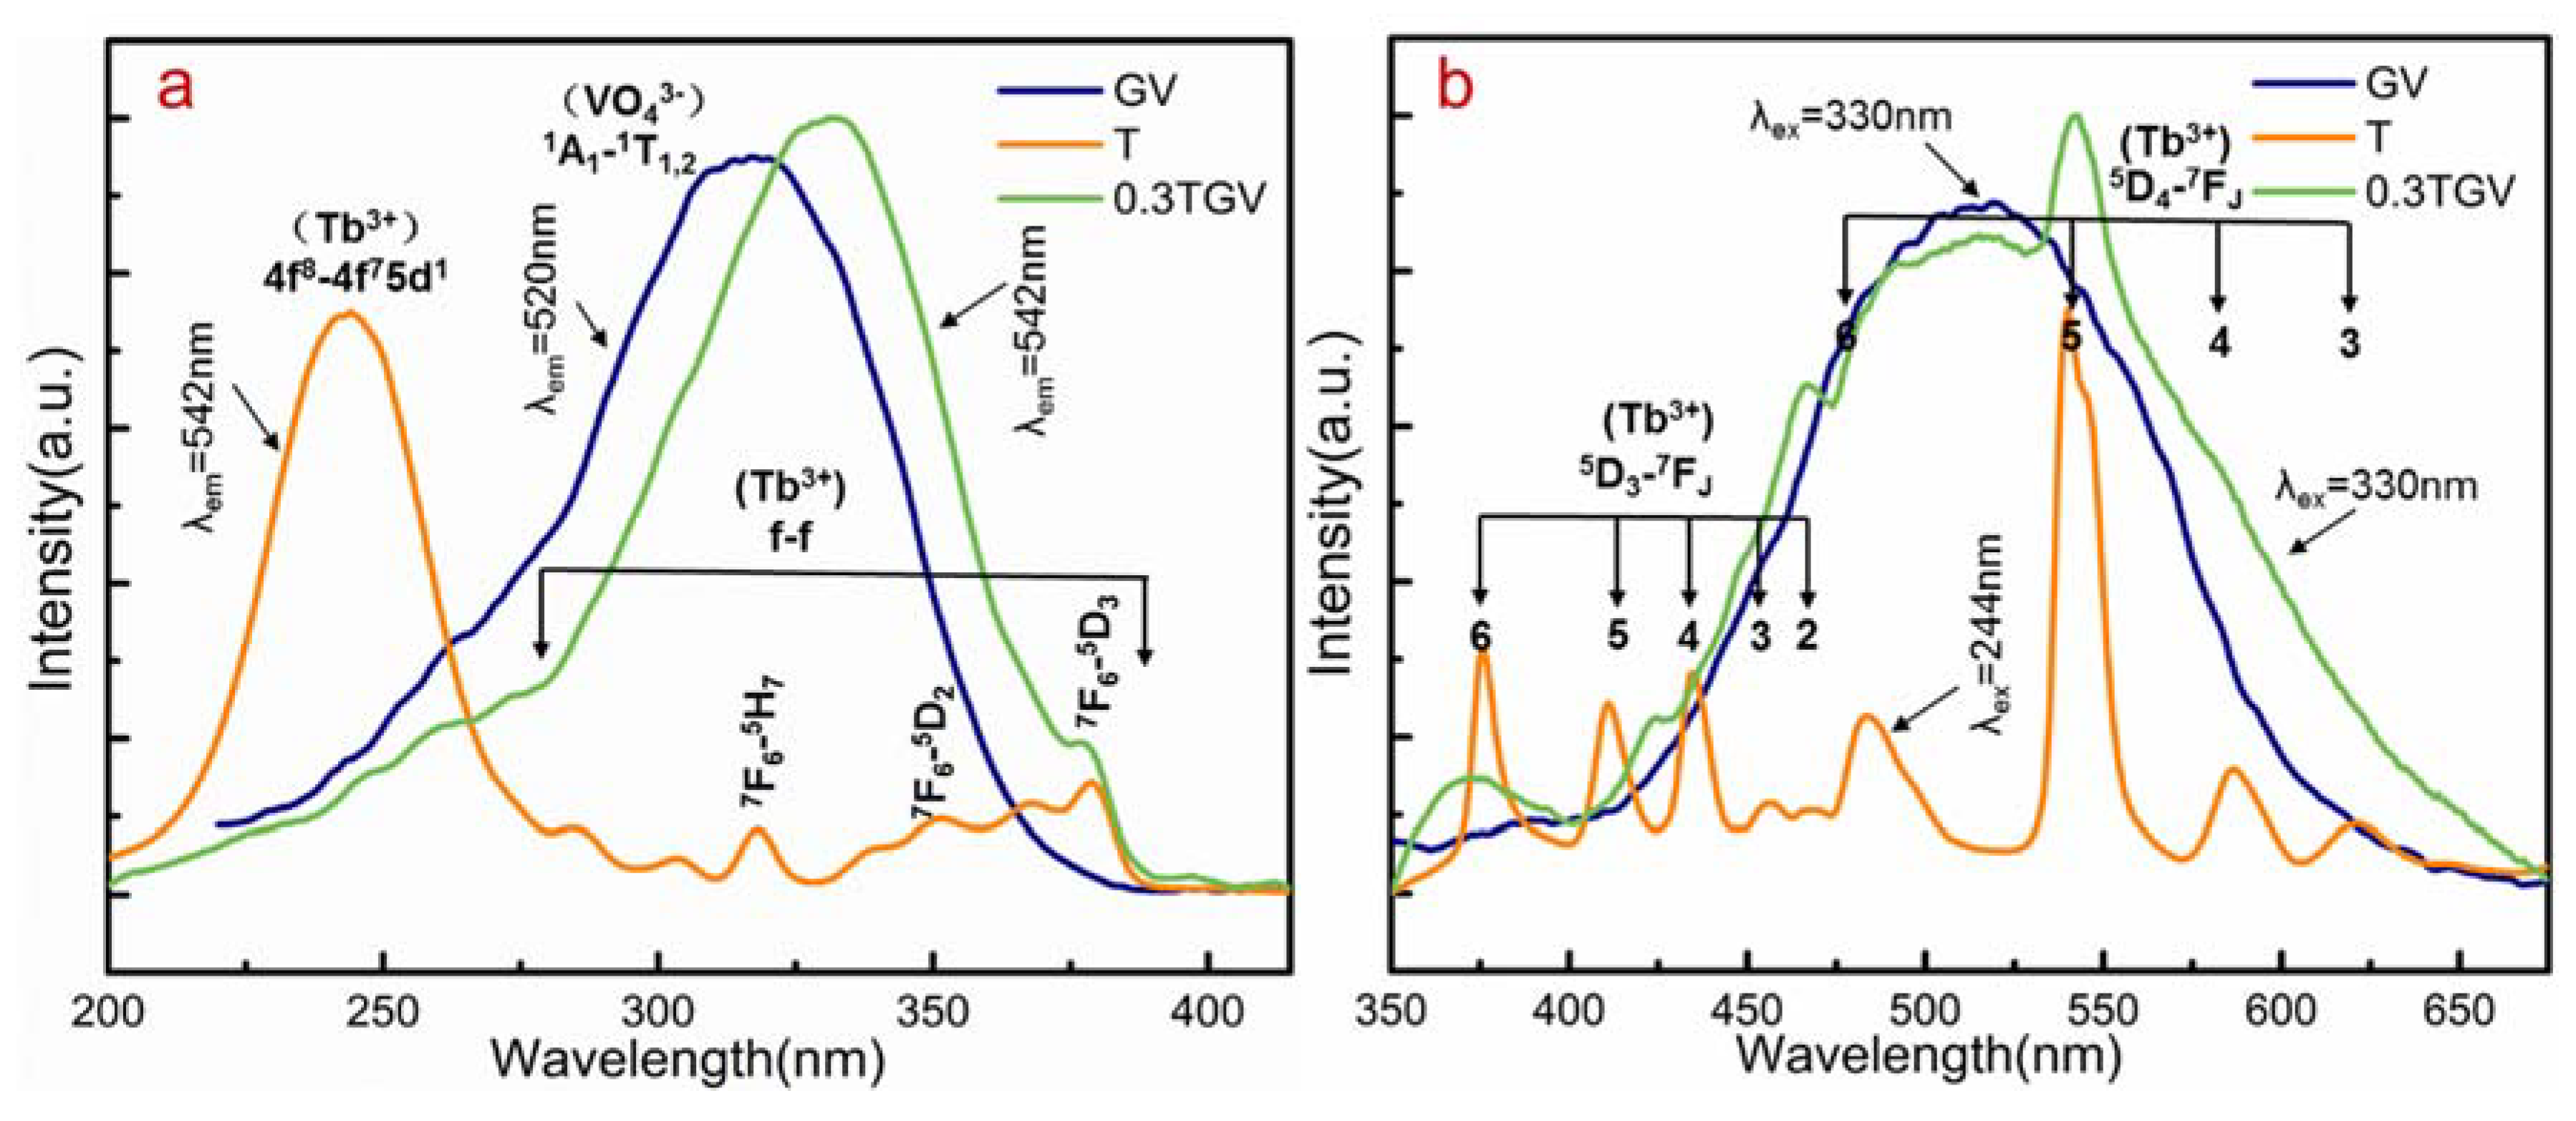
As mentioned, ET between VO43− and Tb3+ was observed in previous results. In order to clarify the ET processes between various active ions in GdVO4: Tb nanocrystals embedded in the synthesized SGC, the samples GV and T shown in Table 1 were fabricated, and PLE and PL spectra were measured, as displayed in Figure 5.
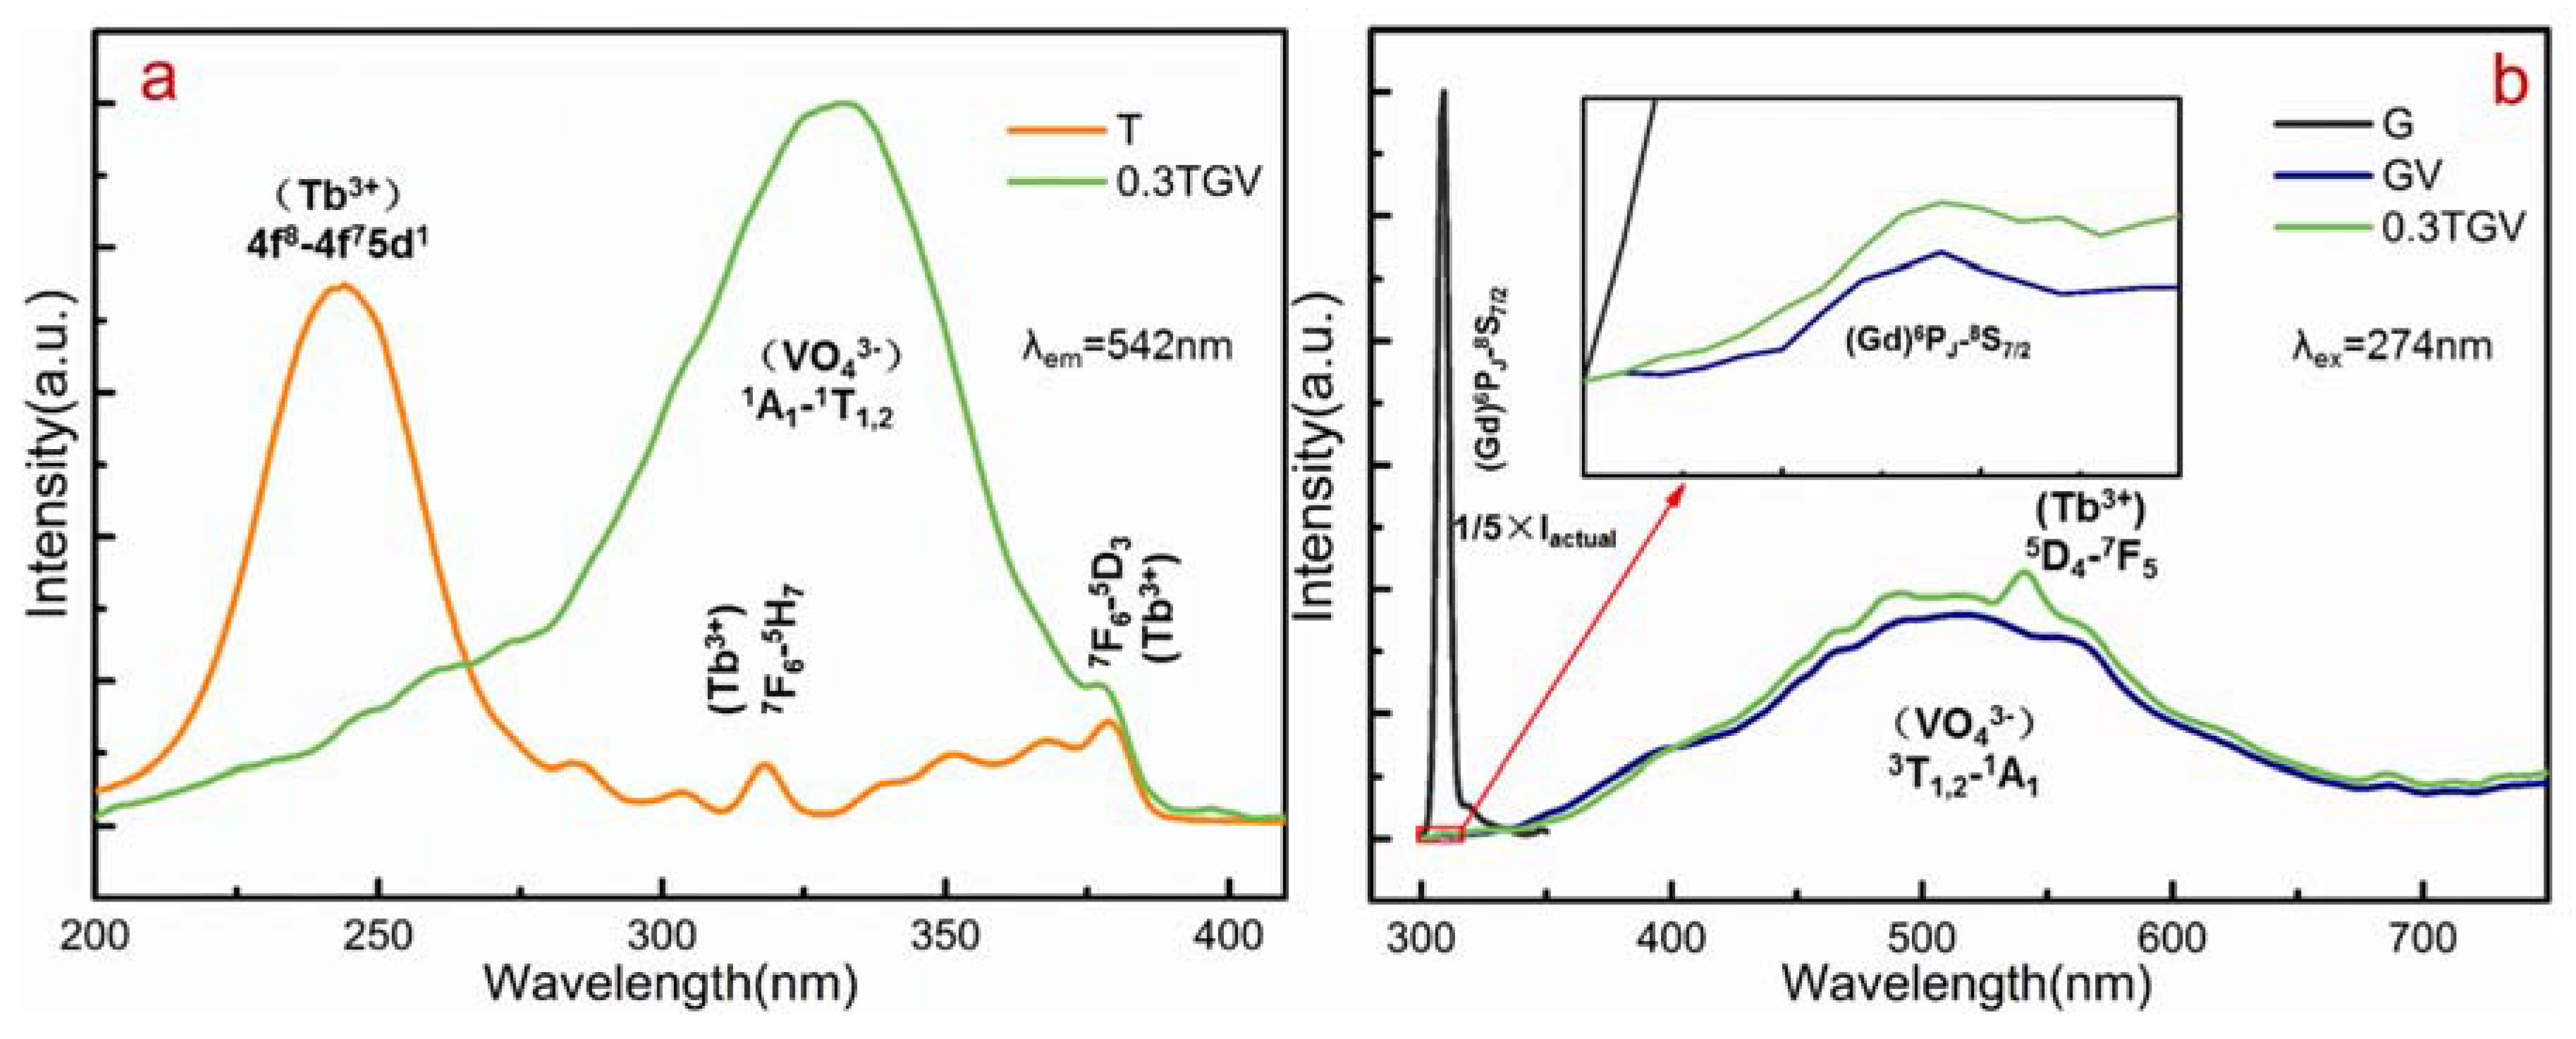
Firstly, the PLE spectra of samples T and 0.3TGV of the 5D4 → 7F5 transition of Tb3+ monitored at 542 nm were measured. For comparing, the PLE spectrum of sample GV monitored at 520 nm was also shown in Figure 5a. It can be seen that sample T also have some f →f transition absorptions in the range of 275–385 nm, including 7F6 → 5H7, 7F6 → 5D2, and 7F6 → 5D3 besides the main absorption band of 4f8 → 4f75d1 transition of Tb3+ ion near 244 nm [42]. However, they are very weak. On the other hand, sample GV also shows strong absorption peaks of 1A1 → 1T1,2 transitions of VO43− in the range of 225–375 nm [36,37,38]. Moreover, besides the absorption peaks of VO43−, a weak peak of 7F6 → 5D3 transition of Tb3+ ion near 380 nm could also be seen in sample 0.3TGV. It is easy to see by comparing the samples T and 0.3TGV that the most obvious change was the FWHM range of excitation wavelength of Tb3+ shifting from about 230–260 nm to 280–365 nm, and the strongest excitation peak shifting from around 244 to 330 nm. At the same time, the PL intensity of Tb3+ ions also increased. These results proved the existed ET process of VO43− → Tb3+ in SGC. Comparing the sample GV and 0.3TGV, it can be seen that there were two changes in the PLE spectra. One such change was a weak new absorption peak, which is resulting from 7F6 → 5D2 transition of Tb3+ ions, while the other was the position red-shifting of the optimal excitation wavelength, which may be due to the absorption red shifting of matrix after microcrystallization. In addition, it can be observed that the emission from 3T1,2 → 1A1 transition of VO43− was strong in Figure 4b and Figure 5b, implying that there was low energy transfer efficiency from VO43− to Tb3+. Thus, the disappearance of 4f8 → 4f75d1 transition of Tb3+ ion near 244 nm for 0.3TGV may be due to the 5d1 energy level causing a strong split after the Tb3+ entered the Gd3+ lattice, which resulted in a large red-shift of the 4f8 → 4f75d1 transition and overlapped with the1A1 → 1T1,2 transitions of VO43−.
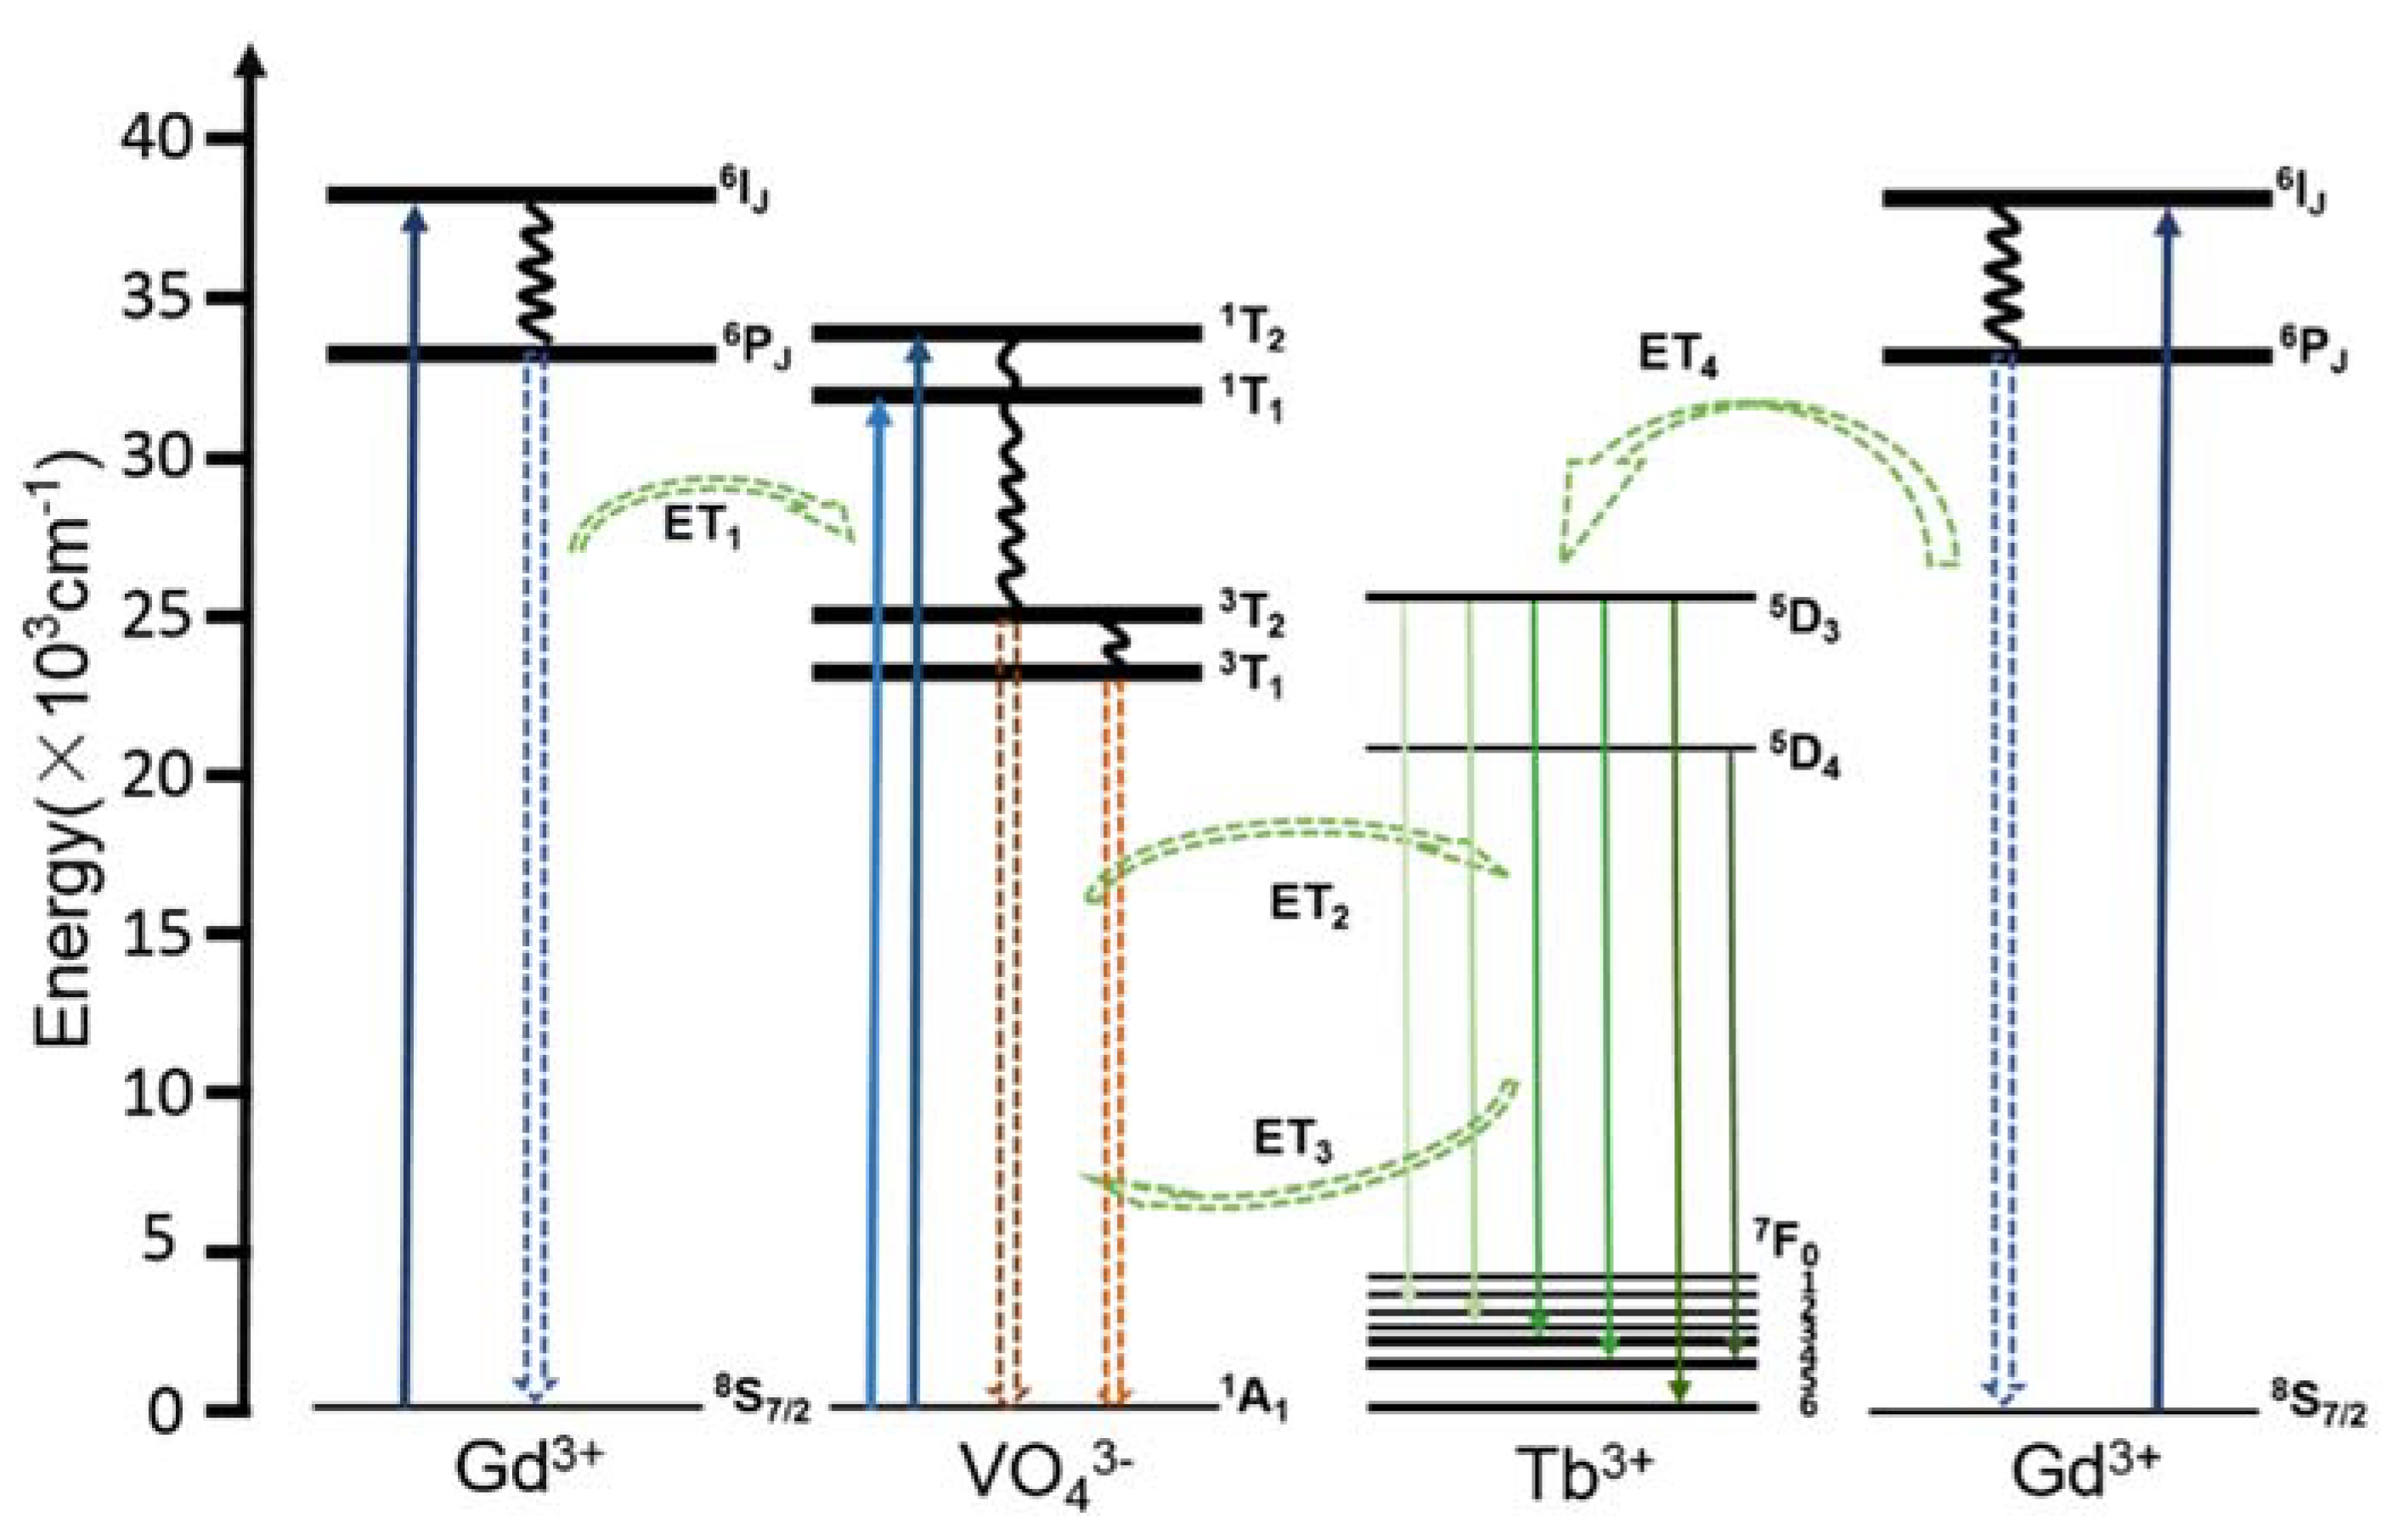
Figure 5b shows the PL spectra of samples GV, T, and 0.3TGV, and their respective characteristic excitation wavelengths were marked in the Figure 5b. The different between the PL spectra of GV and 0.3GVT were mainly two points. One was that the luminescence peak resulted from the 3T1,2 → 1A1 transition of VO43− at 400–650 nm was widened after adding Tb3+ ions, while the other was the emergence of some new emission peaks near 380, 425, 450, 467, and 542 nm, which can be ascribed to the 5D3 → 7F6,5,4,3,2 and 5D4 → 7F5 transitions of Tb3+ ions [39,41]. This shows again that partial energy of the 3T1,2 → 1A1 transition transferred to the Tb3+ ion. In order to illustrate the above process, a schematic of the ET process in SGC is suggested in Figure 6, and the process of VO43− → Tb3+ is ET2.
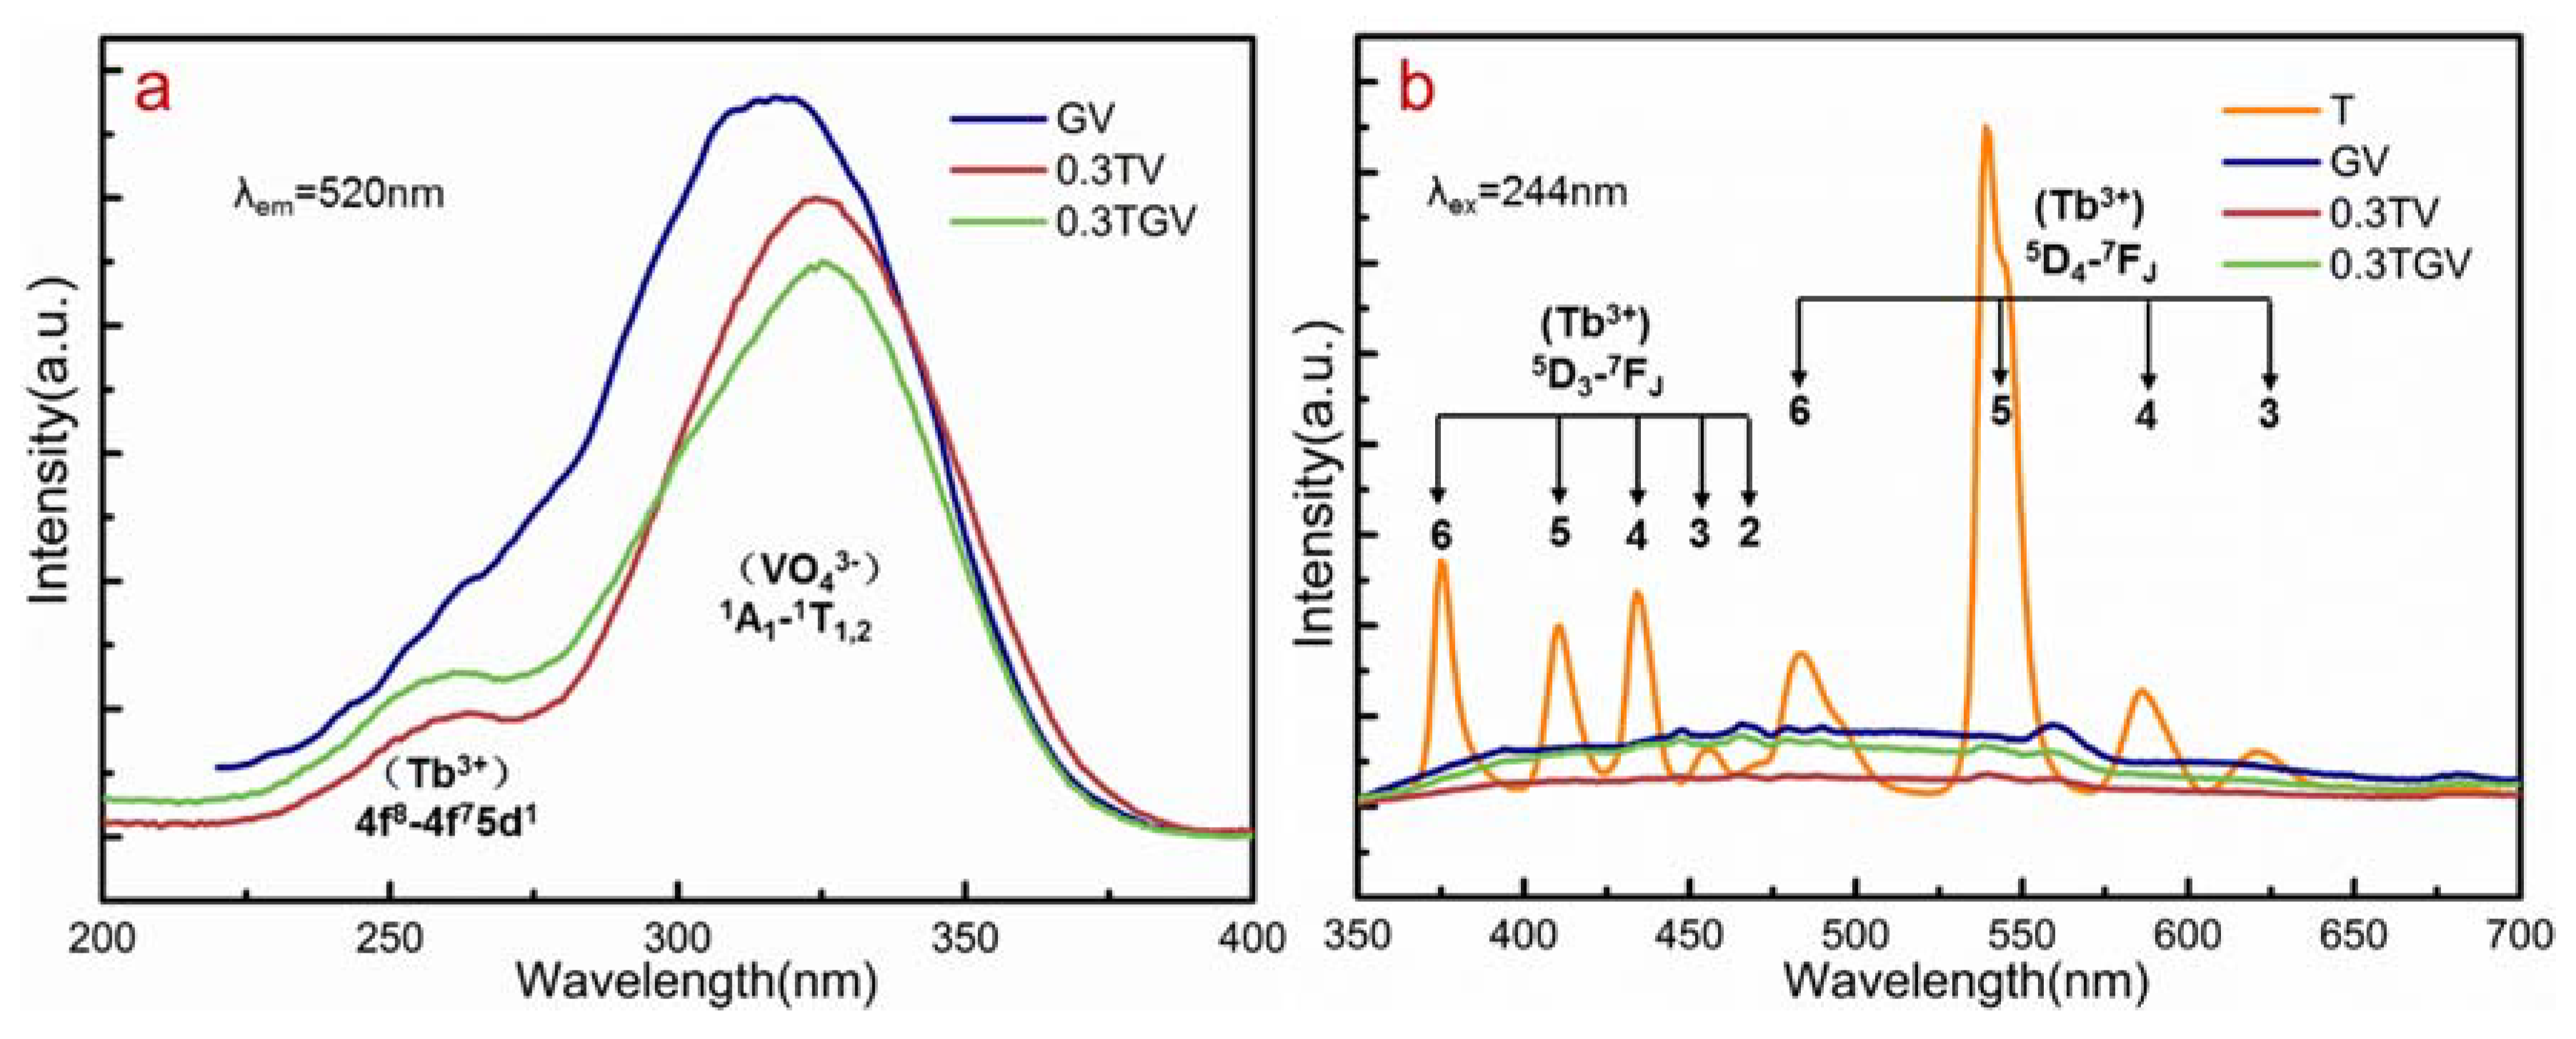
In addition to the emission of Tb3+, there were also emission of Gd3+ and VO43− in samples; and there were some overlap between the position of the emission peak of Tb3+ and the excitation wavelength of VO43− as shown in Figure 5. Therefore, in order to verify whether there was a reverse ET from Tb3+ to VO43− in the SGC, the sample 0.3TV was made and the PLE spectra of the samples GV, 0.3TV, and 0.3TGV monitored at 520 nm were measured and shown in Figure 7a. It can be seen that there were weak absorption peaks at 230–270 nm besides peaks of 1A1 → 1T1,2 transitions of VO43− in both samples of 0.3TV and 0.3TGV. This may be evidence of the reverse ET process of Tb3+ → VO43− in the SGC, but the transfer efficiency is low. This process is shown as ET3 in Figure 6. In addition, it can be clearly seen in the Figure 7a that the excitation peaks of both samples of 0.3TV and 0.3TGV shifted to long wavelength compared to GV. As mentioned earlier, this may be due to the changes of energy levels of VO43− group, which caused by the increased electron cloud density.
Further, the PL spectra of the samples T, GV, 0.3TV, and 0.3TGV were measured with the excitation wavelength of 244 nm, the results are shown in Figure 7b. The emission of Tb3+ in the sample T has been mentioned above, and thus is not repeated here. As can be seen, all samples behaved weak emission bands of 3T1,2 → 1A1 transition of VO43− except for sample T. There are two possibilities for the phenomenon. One may be that VO43− has some absorptive capacity for the ultraviolet at about 244 nm, which results in the emission of VO43−.The other may be resulting from the reverse ET process of Tb3+ → VO43−. Namely, Tb3+ ions transferred the absorbing energy to VO43−, and then VO43− transferred back to Tb3+. In these processes, a part of the energy generated 5D4 → 7F5 transition of Tb3+ ions, and another part of the energy was lost in the form of heat, which in turn reduces the PL intensity of VO43− in the sample 0.3TV and 0.3TGV. On the other hand, as mentioned above, the of 4f8 → 4f75d1 transition would be a red shift in a strong crystal field, so it resulted in a weak emission of Tb3+ under the excitation wavelength of 244 nm as shown in Figure 7b.
In our previous report [11], it was found that there were various energy transfer processes in GdVO4: Eu nanocrystalline silica glass, including Gd3+ → Eu3+, VO43− → Eu3+, Gd3+ → VO43−, and Gd3+→ VO43− → Eu3+. In this article, the Tb3+ is also in the GdVO4 matrix. Therefore, based on the above discussion and previous report, it can be considered that there are also multiple ET processes of VO43−→ Tb3+, Gd3+ → VO43−, and Gd3+ → VO43−→ Tb3+ in the SGC, that is, the ET2 and ET1 processes in Figure 6.
Is there an energy transfer process of Gd3+ → Tb3+ in the SGC? In order to verify the speculation, the PLE spectra of samples T and 0.3TGV were measured with a monitored wavelength of 542 nm, as shown in Figure 8a. It can be seen that there is a weak shoulder near 260–280 nm of sample 0.3TGV, which may be due to the 8S7/2 → 6IJ transition of Gd3+ [11] and it may make the intensity of this region enhanced [37,43]. However, the 4f8 → 4f75d1 transition of Tb3+ is also absorbed nearby as shown in Figure 8a, and the shoulder may also be caused by this absorption.
In order to clarify the role of Gd3+, sample G single doped with Gd3+ was prepared, and the PL spectra of G, GV, and 0.3TGV were tested with the excitation wavelength of 274 nm. The results are shown in Figure 8b. The peak at about 310 nm was reduced to 1/5 of the original intensity in sample G due to the strongly actual intensity (Iactual) of the 6PJ → 8S7/2 transition of Gd3+. Compared with sample G, the 6PJ → 8S7/2 transition emission intensity of Gd3+ near 310 nm in GV and 0.3TGV decreased sharply, which was replaced by the 3T1,2 → 1A1 transition emission peak of VO43−. This indicates that Gd3+ mainly transfers energy to VO43−. However, a weak luminescence peak of the 5D4 → 7F5 transition of Tb3+ ions can be seen near 542 nm in the sample 0.3 TGV, which also indicates that Gd3+ may transfer some energy to Tb3+ and includes the processes of Gd3+ → VO43− → Tb3+. In general, the both energy transfer processes of Gd3+ → VO43− → Tb3+ and Gd3+ → Tb3+ can be seen in the SGC, which are shown as ET1, ET2, and ET4 in Figure 6. However, there is no way to obtain each weight of both processes yet.
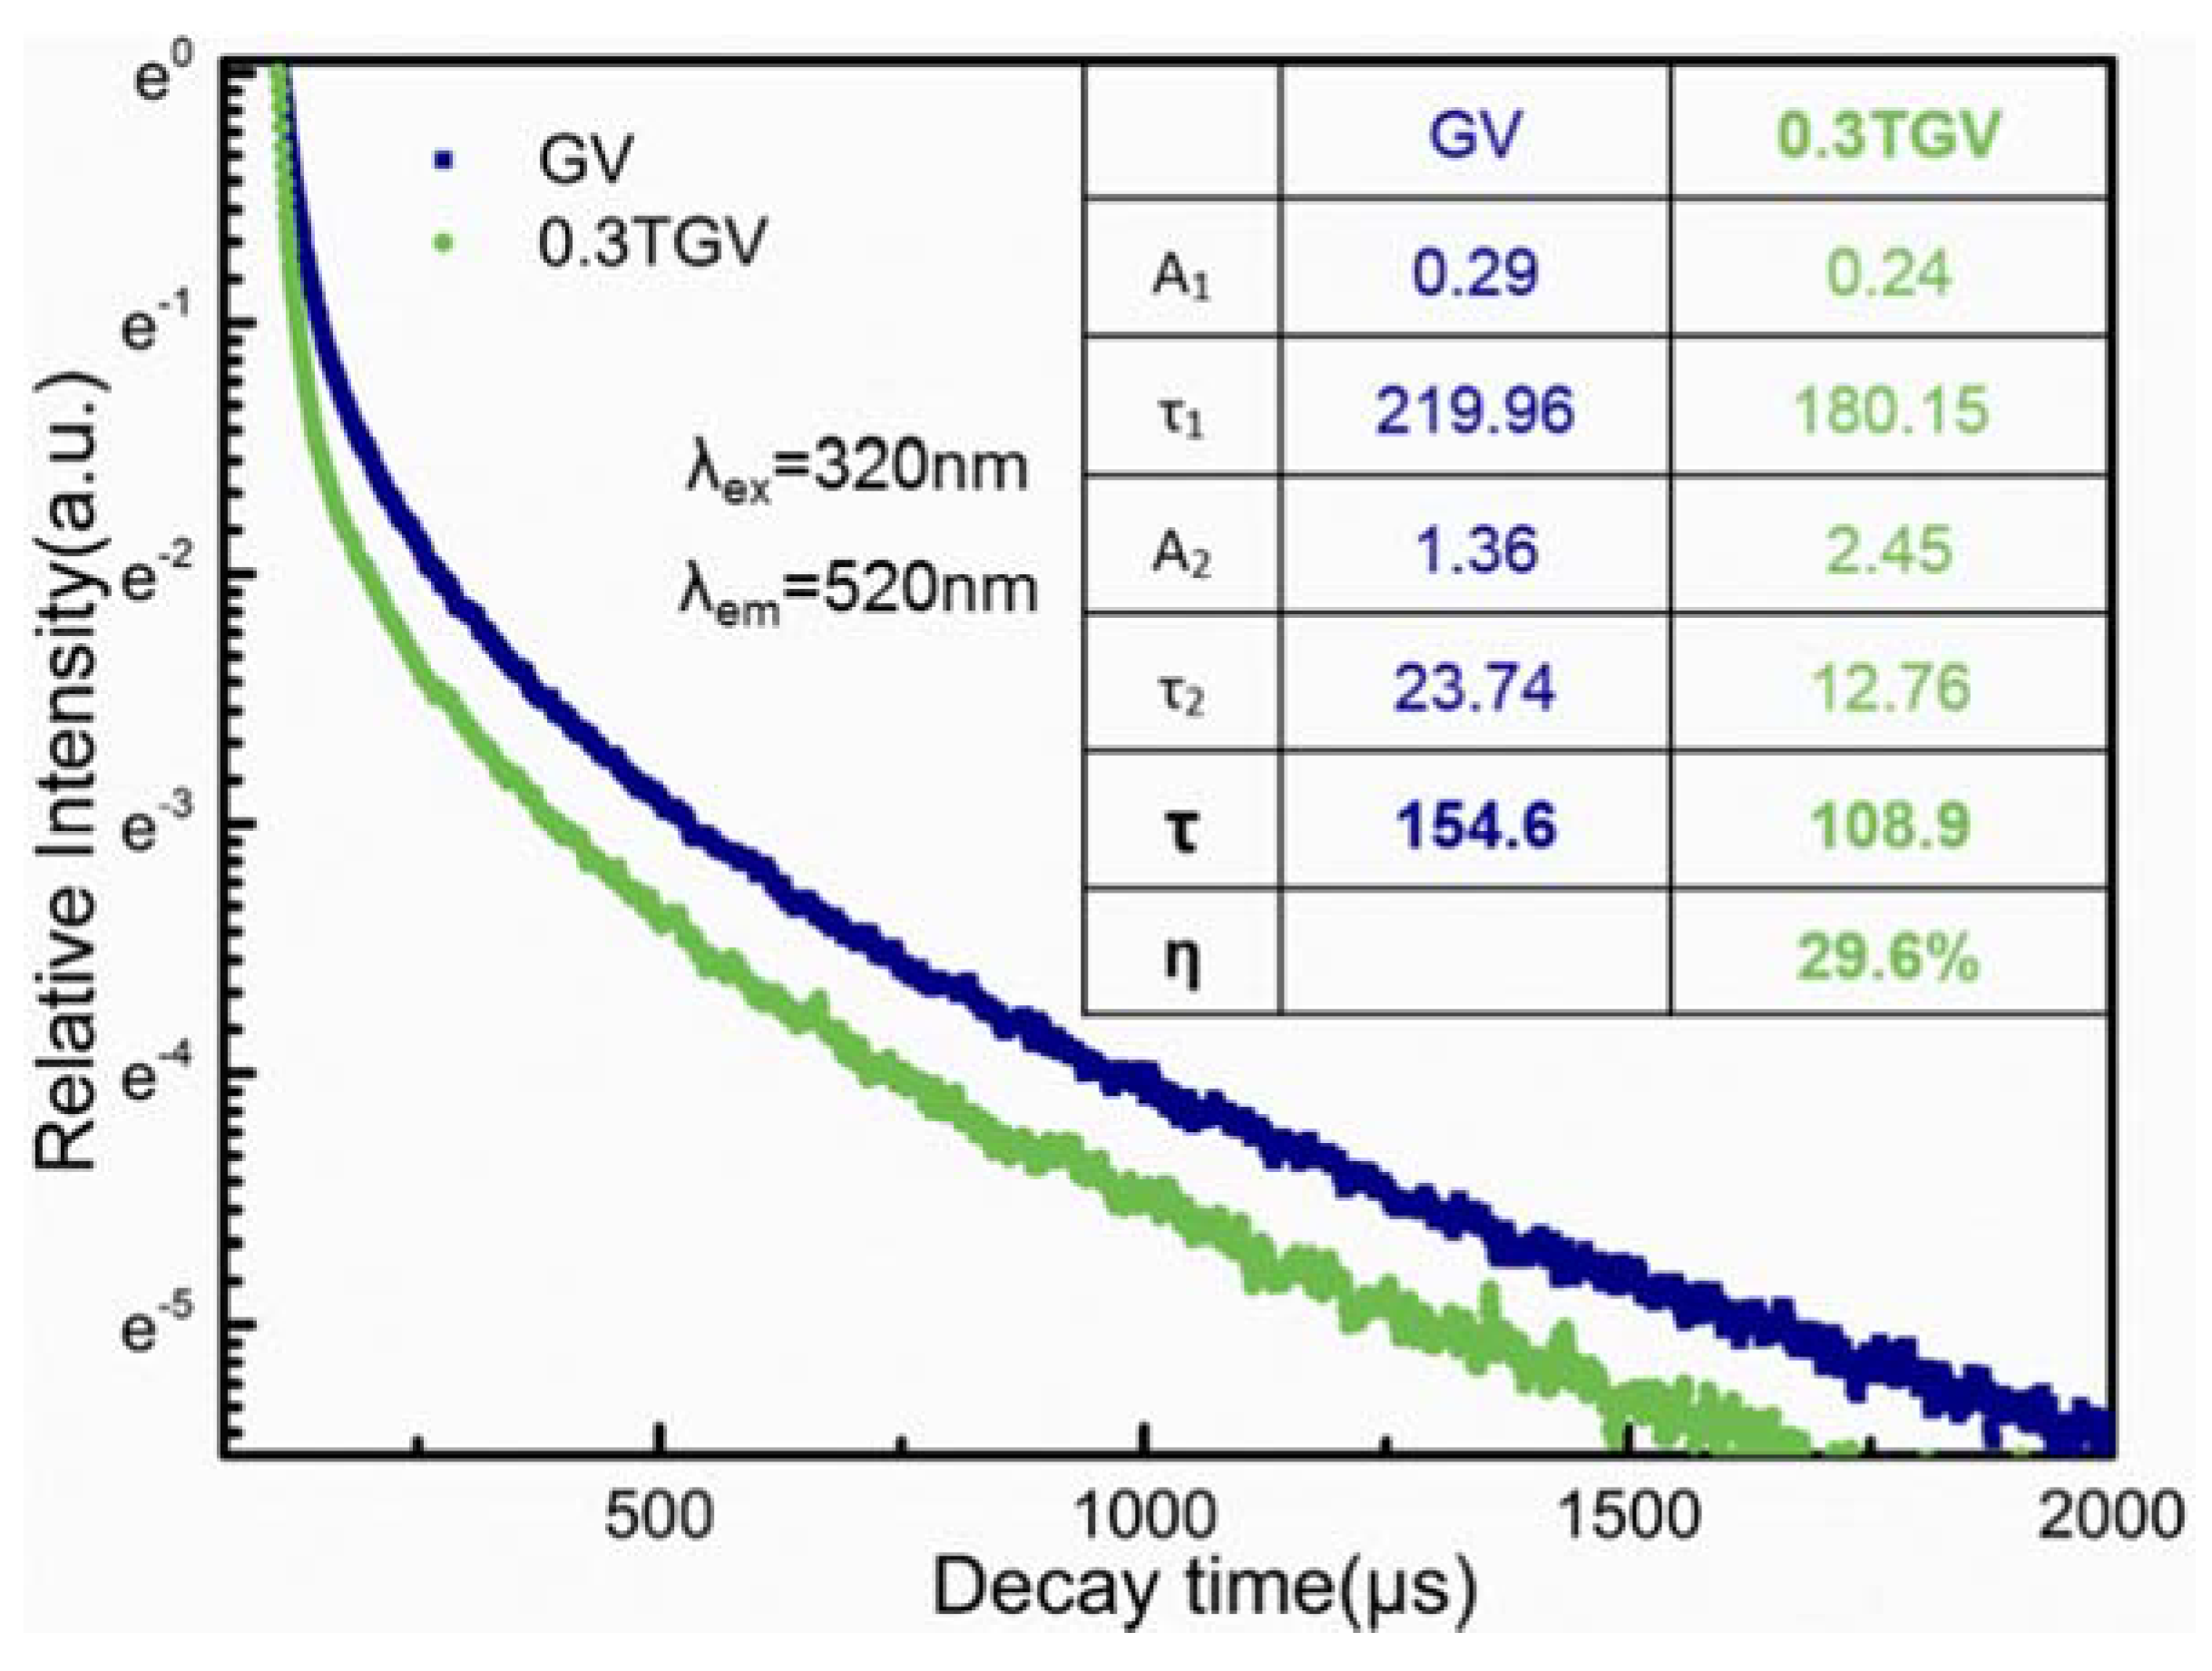
In the above analysis and discussion, the ET processes of VO43− → Tb3+, Gd3+ → VO43−, Gd3+ → VO43− → Tb3+ and Gd3+ → Tb3+ have been proven, and VO43− → Tb3+ was still the main process. The decay time (τ) of Gd3+ in samples GV and (0.1–0.4) TGV were measured, they are basically the same, about 600 μs. The decay time of Tb3+ in samples (0.1–0.4) TGV were also measured, they are basically the same, about 290 μs. Therefore, only the decay time of VO43− and transfer efficiency (η) of VO43− → Tb3+ were measured and discussed. Figure 9 depicts the decay curves of the 3T1,2 → 1A1 transition of VO43− in GV and 0.3TGV.
Both of the decay curves followed a double-exponential decay. The equation , can be used to calculated the average decay times, where τ1 is the short decay component and τ2 is the long-decay component, respectively, while parameters A1 and A2 are the fitting constants [33]. The equation can be used to estimate the efficiency η of the ET, where τ0 is the fluorescence lifetime before doping and τ is the fluorescence lifetime after doping. As can be seen, the average lifetime of the VO43− → Tb3+ transition decreases from 154.6 μs to 108.9 μs with the addition of Tb3+, which indicates that energy of the 3T1,2 → 1A1 transitions transfers from VO43− to Tb3+ ions, and the transfer efficiency was 29.6%. The transfer efficiency was not high, and it was consistent with the results in Figure 4b and Figure 5b.
4. Conclusions
The glass-ceramics with GdVO4: Tb nanocrystals embedded in the highly transparent silica glass were prepared by the porous glass and sintering process. The existence of nanocrystals was confirmed by XRD, Raman spectrum, and TEM. The fluorescence performance of Tb3+ in the transparent SGCs with different concentrations Tb3+ were studied by PLE and PL spectra, and the best performance of 0.3TGV was obtained. In order to clarify the energy transfer mechanism, various samples with single, double, and triple active ions in SGCs were prepared and their spectra were analyzed. The results showed that there was an ET process of VO43− → Tb3+ in the SGC after the formation of nanocrystals by the comparison of the spectra of GV, T, and 0.3TGV. Namely, partial energy of the 3T1,2 → 1A1 transition of VO43− transferred to the Tb3+ ion and generated the emission of 5D3→ 7F6,5,4,3,2 and 5D4→ 7F5. Besides the VO43− → Tb3+, processes of Gd3+ → VO43−, Gd3+ → VO43− →Tb3+, and Gd3+ → Tb3+ have been confirmed in the SGC through spectral comparison of samples, but the main process is VO43− → Tb3+. Finally, the transfer efficiency of the ET of VO43− → Tb3+ was obtained by measuring and calculating the decay time of 3T1,2 → 1A1 transition of VO43− ion before and after Tb3+ doping in the SGC, which was 29.6%.
To sum up, these ET processes in GdVO4: Tb nanocrystals enhanced the luminescence intensity of Tb3+ in the SGCs and shifted the FWHM range of excitation wavelength of Tb3+ from 230–260 nm to 280–365 nm, which is conducive to the application of Tb3+ ions excited by LED light sources. Consequently, this new SGC can be used in the fields of LED excitation luminescence, displays, and lasers fiber that require high transparency, high power, and high chemical stability.
Author Contributions
Conceptualization: S.H. and D.C.; Methodology: all authors; Software: S.H., Y.T. and Y.D.; Investigation: S.H., Y.T. and S.Y.; writing—original draft preparation: S.H. and D.C.; writing—review and editing: all authors; visualization: S.H., Y.T. and S.Y.; project administration: S.H. and D.C.; funding acquisition: Y.C. and D.C. All authors have read and agreed to the published version of the manuscript.
Funding
This research was supported by the National Natural Science Foundation of China (No. 51872308) and the Sichuan Province Science and Technology Support Program (2018GZ0537).
Conflicts of Interest
The authors declare no conflict of interest.
References
- Shen, Y.; Zhang, Q.; Cheng, J.; Sheng, Q.; Liu, S.; Li, W.; Chewpraditkul, W.; Chen, D. Spectroscopic properties and energy transfer of Eu2+/Tb3+ co-doped high silica glass. Mater. Lett. 2013, 97, 151–153. [Google Scholar] [CrossRef]
- Guo, Q.; Zhao, C.; Liao, L.; Liu, H.; Mei, L. KLaSr3(PO4)3F (Re = Tb3+/Eu3+/Eu2+): Promising Multi-Color Luminescence Phosphors for n-UV/UV White LEDs. ChemistrySelect 2016, 1, 2883–2888. [Google Scholar] [CrossRef]
- Chen, S.-W.H.; Shen, C.-C.; Wu, T.; Liao, Z.-Y.; Chen, L.-F.; Zhou, J.-R.; Lee, C.-F.; Lin, C.-H.; Lin, C.-C.; Sher, C.-W.; et al. Full-color monolithic hybrid quantum dot nanoring micro light-emitting diodes with improved efficiency using atomic layer deposition and nonradiative resonant energy transfer. Photonics Res. 2019, 7, 416. [Google Scholar] [CrossRef]
- Behrendt, M.; Mahlik, S.; Szczodrowski, K.; Kuklinski, B.; Grinberg, M. Spectroscopic properties and location of the Tb(3+) and Eu(3+) energy levels in Y2O2S under high hydrostatic pressure. Phys. Chem. Chem. Phys. 2016, 18, 22266–22275. [Google Scholar] [CrossRef]
- Sahu, N.K.; Singh, N.S.; Ningthoujam, R.S.; Bahadur, D. Ce3+-Sensitized GdPO4:Tb3+ Nanorods: An Investigation on Energy Transfer, Luminescence Switching, and Quantum Yield. ACS Photonics 2014, 1, 337–346. [Google Scholar] [CrossRef]
- Yanes, A.C.; del-Castillo, J.; Ortiz, E. Energy transfer and tunable emission in BaGdF5: RE3+ (RE = Ce, Tb, Eu) nano-glass-ceramics. J. Alloy. Compd. 2019, 773, 1099–1107. [Google Scholar] [CrossRef]
- Yan, Y.L.; Wang, J.; Hojamberdiev, M.; Lu, Z.X.; Ren, B.; Xu, Y.H. Effect of SDS on morphology tailoring of GdVO4:Eu3+ powders under hydrothermal conditions in a wide pH range. J. Alloy. Compd. 2014, 597, 282–290. [Google Scholar] [CrossRef]
- Guo, J.; Wang, W.; Lin, H.; Liang, X. High-repetition-rate and high-power picosecond regenerative amplifier based on a single bulk Nd: GdVO4 crystal. High. Power Laser Sci. Eng. 2019, 7, e35. [Google Scholar] [CrossRef] [Green Version]
- Krumpel, A.H.; van der Kolk, E.; Cavalli, E.; Boutinaud, P.; Bettinelli, M.; Dorenbos, P. Lanthanide 4f-level location in AVO4:Ln3+(A = La, Gd, Lu) crystals. J. Phys. Condens. Matter 2009, 21, 115503. [Google Scholar] [CrossRef] [Green Version]
- Cho, S. Luminescence Properties of GdVO4 Blue Phosphors Doped with Tb3+ Ions. J. Nanosci. Nanotechnol. 2013, 13, 7165–7168. [Google Scholar] [CrossRef]
- Han, S.; Du, Y.; Yuan, J.; Tao, Y.; Wang, Y.; Yan, S.; Chen, D. Luminescence behavior of Eu3+ in silica glass containing GdVO4: Eu nanocrystals. J. Non-Cryst. Solids 2020, 532, 119894. [Google Scholar] [CrossRef]
- Han, S.; Yan, S.; Wang, Y.; Zou, Y.; Du, Y.; Li, Y.; Chen, D. High emission cross-section YVO4: Nd nanocrystalline glass prepared by high-silica porous glass. Mater. Lett. 2019, 253, 388–391. [Google Scholar] [CrossRef]
- Quandt, A.; Ferrari, M.; Righini, G.C. Advancement of Glass-Ceramic Materials for Photonic Applications. In Sol-gel Based Nanoceramic Materials: Preparation, Properties and Applications; Mishra, A.K., Ed.; Springer International Publishing: Cham, Switzerland, 2017; pp. 133–155. [Google Scholar]
- Dymshits, O.; Shepilov, M.; Zhilin, A. Transparent glass-ceramics for optical applications. MRS Bull. 2017, 42, 200–205. [Google Scholar] [CrossRef]
- Zur, L.; Tran, L.T.N.; Meneghetti, M.; Varas, S.; Armellini, C.; Ristic, D.; Chiasera, A.; Scotognella, F.; Pelli, S.; Conti, G.N.; et al. Glass and glass-ceramic photonic systems. In Proceedings of the Society of Photo-Optical Instrumentation Engineers, San Francisco, CA, USA, 22 February 2017. [Google Scholar]
- Liu, X.; Zhou, J.; Zhou, S.; Yue, Y.; Qiu, J. Transparent glass-ceramics functionalized by dispersed crystals. Prog. Mater. Sci. 2018, 97, 38–96. [Google Scholar] [CrossRef]
- Zhou, S.; Jiang, N.; Zhu, B.; Yang, H.; Ye, S.; Lakshminarayana, G.; Hao, J.; Qiu, J. Multifunctional bismuth-doped nanoporous silica glass: From blue-green, orange, red, and white light sources to ultra-broadband infrared amplifiers. Adv. Funct. Mater. 2008, 18, 1407–1413. [Google Scholar] [CrossRef]
- Han, Y.; Sun, J.; Ye, S.; Zhang, Q. A stimuli responsive material of perovskite quantum dots composited nano-porous glass. J. Mater. Chem. C 2018, 6, 11184–11192. [Google Scholar] [CrossRef]
- Qiao, Y.; Wen, L.; Wu, B.; Ren, J.; Chen, D.; Qiu, J. Preparation and spectroscopic properties of Yb-doped and Yb–Al-codoped high silica glasses. Mater. Chem. Phys. 2008, 107, 488–491. [Google Scholar] [CrossRef]
- Chu, Y.; Yang, Y.; Liao, L.; Liu, Y.; Ma, Y.; Hu, X.; Wang, Y.; Xing, Y.; Peng, J.; Li, H.; et al. 3D Nanoporous Silica Rods for Extra-Large-Core High-Power Fiber Lasers. ACS Photonics 2018, 5, 4014–4021. [Google Scholar] [CrossRef]
- Liu, S.; Wang, M.; Zhou, Q.; Feng, S.; Yu, C.; Wang, L.; Hu, L.; Chen, D. Ytterbium-doped silica photonic crystal fiber laser fabricated by the nanoporous glass sintering technique. Laser Phys. 2014, 24, 065801. [Google Scholar] [CrossRef]
- Wang, Y.; Chen, G.; Li, J. Development and prospect of high-power doped fibers. High. Power Laser Sci. Eng. 2018, 6, e40. [Google Scholar] [CrossRef] [Green Version]
- Qiao, Y.; Da, N.; Chen, D.; Zhou, Q.; Qiu, J.; Akai, T. Spectroscopic properties of neodymium doped high silica glass and aluminum codoping effects on the enhancement of fluorescence emission. Appl. Phys. B 2007, 87, 717–722. [Google Scholar] [CrossRef]
- Galeener, F.L. Raman and ESR studies of the thermal history of amorphous SiO2. J. Non-Cryst. Solids 1985, 71, 373–386. [Google Scholar] [CrossRef]
- Hehlen, B. Inter-tetrahedra bond angle of permanently densified silicas extracted from their Raman spectra. J. Phys. Condens Matter 2010, 22, 025401. [Google Scholar] [CrossRef] [PubMed]
- Chemtob, S.M.; Rossman, G.R.; Stebbins, J.F. Natural hydrous amorphous silica: Quantitation of network speciation and hydroxyl content by 29Si MAS NMR and vibrational spectroscopy. Am. Mineral. 2012, 97, 203–211. [Google Scholar] [CrossRef]
- Nasikas, N.K.; Retsinas, A.; Papatheodorou, G.N. Y3Al5O12–SiO2 Glasses: Structure and Polyamorphism. J. Am. Ceram. Soc. 2014, 97, 2054–2060. [Google Scholar] [CrossRef]
- Zheng, S.; Li, J.; Yu, C.; Zhou, Q.; Chen, D. Preparation and characterizations of Nd:YAG ceramic derived silica fibers drawn by post-feeding molten core approach. Opt. Express 2016, 24, 24248–24254. [Google Scholar] [CrossRef]
- Jin, B.M.; Erdei, S.; Bhalla, A.S.; Ainger, F.W. Raman study of oxygen deficient YVO4 single crystals. Mater. Res. Bull. 1995, 30, 1293–1300. [Google Scholar] [CrossRef]
- Grandhe, B.K.; Bandi, V.R.; Jang, K.; Ramaprabhu, S.; Yi, S.-S.; Jeong, J.-H. Enhanced red emission from YVO4:Eu3+ nano phosphors prepared by simple Co-Precipitation Method. Electron. Mater. Lett. 2011, 7, 161–165. [Google Scholar] [CrossRef]
- Thakur, S.; Gathania, A.K. Synthesis and Characterization of YVO4-Based Phosphor Doped with Eu3+ Ions for Display Devices. J. Electron. Mater. 2015, 44, 3444–3449. [Google Scholar] [CrossRef]
- Sevic, D.; Rabasovic, M.S.; Krizan, J.; Savic-Sevic, S.; Mitric, M.; Gilic, M.; Hadzic, B.; Romcevic, N. Characterization and luminescence kinetics of Eu3+ doped YVO4 nanopowders. Mater. Res. Bull. 2017, 88, 121–126. [Google Scholar] [CrossRef]
- Wang, Z.; Li, Y.; Zhu, Q.; Wang, X.; Liao, M. Hydrothermal crystallization of VO43− stabilized t-Gd(P,V)O4:Eu3+ nanocrystals for remarkably improved and color tailorable luminescence. Chem. Eng. J. 2019, 357, 84–93. [Google Scholar] [CrossRef]
- Blasse, G.; Grabmaier, B.C. How Does a Luminescent Material Absorb Its Excitation Energy? In Luminescent Materials; Springer: Berlin/Heidelberg, Germany, 1994; pp. 10–32. [Google Scholar]
- Reisfeld, R.; Boehm, L. The determination of the nephelauxetic effect in oxide glasses by Sn2+, Sb3+, Tl+, Pb2+ and Bi3+ ions. J. Non-Cryst. Solids 1975, 17, 209–214. [Google Scholar] [CrossRef]
- Nakajima, T.; Isobe, M.; Tsuchiya, T.; Ueda, Y.; Manabe, T. Correlation between Luminescence Quantum Efficiency and Structural Properties of Vanadate Phosphors with Chained, Dimerized, and Isolated VO4 Tetrahedra. J. Phys. Chem. C 2010, 114, 5160–5167. [Google Scholar] [CrossRef]
- Kang, F.; Li, L.; Han, J.; Lei, D.Y.; Peng, M. Emission color tuning through manipulating the energy transfer from VO43− to Eu3+ in single-phased LuVO4:Eu3+ phosphors. J. Mater. Chem. C 2017, 5, 390–398. [Google Scholar] [CrossRef]
- Zhu, M.; Hu, C.; Li, J.H.; Feng, Y.Q.; Kong, H.L.; Ullah, S.; Li, M.F.; You, F.; Teng, B.; Zhong, D.G.; et al. Synthesis and annealing effects on the optical spectroscopy properties of red-emitting Gd(P0.5V0.5)O4: X at.% Eu3+. J. Mater. Sci. Mater. Electron. 2018, 29, 20607–20614. [Google Scholar] [CrossRef]
- Li, Y.-C.; Chang, Y.-H.; Chang, Y.-S.; Lin, Y.-J.; Laing, C.-H. Luminescence and Energy Transfer Properties of Gd3+ and Tb3+ in LaAlGe2O7. J. Phys. Chem. C 2007, 111, 10682–10688. [Google Scholar] [CrossRef]
- Tang, G.; Qian, G.; Shi, Z.; Liu, Y.; Huang, B.; He, Y.; Jiang, L.; Sun, M.; Qian, Q.; Yang, Z. Heavily Tb3+ doped multi-component phosphate glass fibers for green fiber lasers. Opt. Mater. Express 2019, 9, 362. [Google Scholar] [CrossRef]
- Zhu, C.; Chaussedent, S.; Liu, S.; Zhang, Y.; Monteil, A.; Gaumer, N.; Yue, Y. Composition dependence of luminescence of Eu and Eu/Tb doped silicate glasses for LED applications. J. Alloy. Compd. 2013, 555, 232–236. [Google Scholar] [CrossRef]
- Liu, C.; Hou, D.; Yan, J.; Zhou, L.; Kuang, X.; Liang, H.; Huang, Y.; Zhang, B.; Tao, Y. Energy Transfer and Tunable Luminescence of NaLa(PO3)4:Tb3+/Eu3+ under VUV and Low-Voltage Electron Beam Excitation. J. Phys. Chem. C 2014, 118, 3220–3229. [Google Scholar] [CrossRef]
- Shim, K.S.; Yang, H.K.; Moon, B.K.; Jeong, J.H.; Yi, S.S.; Kim, K.H. Improved photoluminescence of pulsed-laser-ablated Y1−xGdxVO4:Eu3+ thin film phosphors by Gd substitution. Appl. Phys. A 2007, 88, 623–626. [Google Scholar] [CrossRef]
Figure 1.
(a) XRD patterns of samples (inset: the data of tetragonal GdVO4); (b) micro-Raman spectra of samples (inset: the data of GdVO4 crystal).
Figure 1.
(a) XRD patterns of samples (inset: the data of tetragonal GdVO4); (b) micro-Raman spectra of samples (inset: the data of GdVO4 crystal).

Figure 2.
(a) TEM morphology and (b), (c) HR-TEM morphology of sample 0.3TGV.

Figure 3.
Transmittance spectra of sample xTGV (x = 0.1–0.4) and 0.3TV.

Figure 4.
(a) PLE spectra and (b) PL spectra of xTGV (x = 0.1–0.4).

Figure 5.
(a) PLE spectra and (b) PL spectra of GV, T, and 0.3TGV.

Figure 6.
Schematic diagram of the energy transfer process in samples.

Figure 7.
(a) PLE spectra of GV, 0.3TV, and 0.3TGV and (b) PL spectra of T, GV, 0.3TV, and 0.3TGV.

Figure 8.
(a) PLE spectra of T and 0.3TGV and (b) PL spectra of G, GV, and 0.3TGV.

Figure 9.
Decay curves for 520 nm emission of VO43− in samples GV and 0.3TGV.


Table 1.
Name and ion concentration and crystallization status of various samples.
| Sample | Tb3+ (×1020 ion/cm3) | Gd3+ (×1020 ion/cm3) | V5+(VO43−) (×1020 ion/cm3) | Crystallization or Not |
|---|---|---|---|---|
| T | 0.3 | 0 | 0 | Uncrystallized |
| G | 0 | 1 | 0 | Uncrystallized |
| GV | 0 | 1 | 1 | Crystallized |
| 0.3TV | 0.3 | 0 | 1 | Crystallized |
| 0.1TGV | 0.1 | 1 | 1 | Crystallized |
| 0.2TGV | 0.2 | 1 | 1 | Crystallized |
| 0.3TGV | 0.3 | 1 | 1 | Crystallized |
| 0.4TGV | 0.4 | 1 | 1 | Crystallized |
© 2020 by the authors. Licensee MDPI, Basel, Switzerland. This article is an open access article distributed under the terms and conditions of the Creative Commons Attribution (CC BY) license (http://creativecommons.org/licenses/by/4.0/).
Share and Cite
MDPI and ACS Style
Han, S.; Tao, Y.; Du, Y.; Yan, S.; Chen, Y.; Chen, D. Luminescence Behavior of GdVO4: Tb Nanocrystals in Silica Glass-Ceramics. Crystals 2020, 10, 396. https://doi.org/10.3390/cryst10050396
AMA Style
Han S, Tao Y, Du Y, Yan S, Chen Y, Chen D. Luminescence Behavior of GdVO4: Tb Nanocrystals in Silica Glass-Ceramics. Crystals. 2020; 10(5):396. https://doi.org/10.3390/cryst10050396
Chicago/Turabian StyleHan, Shuai, Yiting Tao, Ying Du, Sasa Yan, Yanping Chen, and Danping Chen. 2020. "Luminescence Behavior of GdVO4: Tb Nanocrystals in Silica Glass-Ceramics" Crystals 10, no. 5: 396. https://doi.org/10.3390/cryst10050396
Note that from the first issue of 2016, this journal uses article numbers instead of page numbers. See further details here.