


Abstract
A near infrared spectrometer based on the self-scanning Tm-doped fiber laser is developed. The spectrometer is applied to measurements of the water nuclear spin isomer abundances using water absorption lines in the vibrational band  near 1.91 µm. The ortho/para ratio of water nuclear spin isomers is measured to be equal to 3.06 ± 0.02, which is close to the theoretical prediction of 3 at room temperature.
Export citation and abstract BibTeX RIS
1. Introduction
Water molecules (H2O) are very important for many areas of science and technology. This fact has stimulated numerous experimental and theoretical investigations that have made water molecules well studied and understood. However, knowledge of some important properties of water molecules is still missing, e.g. the properties of water nuclear spin isomers. Quantum statistics of molecules having identical nuclei correlates the nuclear spin states with particular spatial states in the molecule in such a way that the total wave function is symmetrical under permutation of two identical bosons and antisymmetrical under permutation of two identical fermions in the molecule [1]. This gives rise to the so-called nuclear spin isomers of molecules. The nuclear spin isomers of polyatomic molecules were studied recently in a number of works [2–7].
Water molecules have ortho and para nuclear spin isomers, which differ from each other by the total spin, I, of the hydrogen nuclei (fermions) in the molecule [1, 8]. Ortho water has I = 1, symmetrical spin state and antisymmetrical rotational states with odd ( ) values. Para water has I = 0, antisymmetrical spin state and symmetrical rotational states with even (
 ) values. Here Ka and Kc are standard quantum numbers of water rotational states, where a and c are the axes of coordinate system fixed in the molecule [8, 9]. We assume here and further that water molecules are in the ground electronic and vibrational states that are symmetrical under permutation of hydrogen nuclei in H2O. At room temperature when many rotational states of water are populated, the water ortho/para ratio (OPR) is determined by the nuclear statistical weights of hydrogen nuclei and is equal to 3 with high accuracy (see, for example, [10]).
Water spin isomers are important because their existence is determined by fundamental physical law, i.e. quantum statistics. We can illustrate also the importance of water spin isomers by two examples. In nuclear magnetic resonance (NMR) spectroscopy, only ortho water produces a NMR signal. Para water is silent in NMR because of zero total spin of hydrogen nuclei. In astrophysics the measurements of water OPR allow us to understand physical conditions in outer space [10–14].
Investigations of water isomer properties as well as their applications rely on methods of isomer enrichment. This, in turn, requires the methods of the water isomer detection. The nuclear spin state of water cannot be detected directly at ambient temperature when many rotational states are populated. At these physical conditions we can measure abundances of ortho and para water isomers through their rotational level populations. This is the method used so far in all works on water spin isomers. For this purpose, absorption measurements on pure rotational water transitions were performed with CW microwave sources (see reference [3] and references therein) and with terahertz time-domain spectrometer [15]. Detection methods based on the ortho and para water absorption in near infrared with diode lasers were reviewed in [16]. Each of these methods is suitable for the water spin isomer measurements at particular physical conditions.
Recently a new type of fiber laser with frequency self-scanning in near infrared was developed [17]. The laser of similar type but based on Tm-doped fiber [18] produces narrow-band radiation tunable near 1.91 µm where water molecules have strong absorption in combinational band  . In this paper we present a laser spectrometer based on the self-scanning Tm-doped fiber laser suitable for detection of water nuclear spin isomers.
2. Spectrometer
To help the reader, we start with a brief description of the physics of self-scanning fiber lasers [17–19]. The laser is using continuous and spatially homogeneous optical excitation (pumping). Active medium of the laser has homogeneously broadened gain profile. On the one hand, this fact strongly reduces the number of simultaneously generated longitudinal modes (down to single mode in some cases). On the other hand, these modes in a standing wave laser cavity initiate longitudinally non-uniform gain saturation leading to spatial hole burning (SHB) along the gain medium. Interplay of the gain saturation and SHB effects leads to self-sustained relaxation oscillation generation regimes, which are accompanied by optical frequency jumps. In self-scanning lasers these frequency jumps are relatively regular. Recently a new type of self-scanning lasers (so-called single-frequency self-scanning lasers) has been developed. Every pulse of such a laser contains only single longitudinal mode radiation and optical frequency jump between adjacent pulses is strictly fixed and corresponds to one intermode frequency interval, Δν. This parameter of the self-scanning fiber lasers appears to be very stable. On the other hand, the appearance of each laser pulse in time is not very precise because it is influenced by some stochastic process inside the laser. Consequently, the train of radiation pulses has very good correlation between pulse number and radiation frequency, but relatively poor correlation between radiation frequency and radiation pulse appearance in time. These unusual features of the self-scanning fiber lasers should be accounted for in the laser application for precision spectroscopy.
The scheme of a laser spectrometer is presented in figure 1. The spectrometer is based on the Tm-doped fiber laser [18] adopted to the present goal. Polarization maintaining Tm-doped fiber (Nufern, PM TSF 9/125) with a length of la = 5 m is used as the laser gain medium. The active fiber is wound on a temperature stabilized metal spool. A linearly polarized Er-doped fiber laser with wavelength of 1540 nm and maximum output power of 1.3 W is used for core pumping via 1550/1950 wavelength-division multiplexor (WDM). A fiber loop mirror with reflectivity of R1≃ 95% based on a fiber coupler 60/40 @2000 nm at one cavity side and right-angle cleaved fiber end with Fresnel reflection of R2 ≃ 3.5% at the other cavity side are used as broadband cavity mirrors. Single polarization state is selected by a polarization beam splitter (PBS). The total cavity length is equal to 10.9 meters which corresponds to the intermode interval Δν ≃ 9.2 MHz. In this cavity configuration the laser operates in single longitudinal mode self-scanning regime [18] in the spectral range of 1905–1918 nm. The laser generates regular microsecond pulses consisting of radiation with the linewidth of ~150 kHz [19]. Special care was taken to guarantee that each of the laser pulses in the pulse train has a single longitudinal mode and adjacent pulses are shifted by one intermode interval Δν [17]. An additional isolator was used to prevent undesirable back-reflections. The radiation transmitted through the fiber-loop mirror with a power of ~1 mW is used for spectral measurements. For this purpose, the laser radiation is divided into the probe and reference beams by a fiber coupler 50/50 @2000 nm.

Figure 1. Spectrometer scheme. WDW—wavelength-division multiplexor, PD—photodetector, PBS—polarization beam splitter.
Download figure:
Standard image High-resolution imageThe water vapour under investigation is contained in the sealed off glass cell. The cell has a small appendix with liquid water that was carefully degassed under vacuum before experiment. The water vapour in the cell is saturated at a room temperature of 21 0C that results in water vapour pressure equal to 23 mbar. The optical path lengths for the probe beam inside and outside of the cell are approximately 84 mm and ≃20 mm, respectively.
In order to measure the OPR of water vapour, the collimated probe beam (Thorlabs RC04FC-P01 collimator) passes through the water vapour cell and then is detected with a photodetector. Intensities of the probe and reference beams are detected simultaneously by biased photodetectors (Thorlabs, InGaAs Detector DET10DM) and then the signals are sent to two channels of a digital oscilloscope (LeCroy, WavePro 725Zi-A) having bandwidths of 2.5 GHz per channel. The probe and reference beams intensities are recorded by the digital oscilloscope within 2 seconds with a sampling rate of 5 MHz. The spectral range for the 2 seconds record is estimated as 14 nm taking into account the wavelength scanning rate of the laser, 7 nm sec−1. For reconstruction of transmission spectra from thus measured signals, we should divide the recorded probe signal by the reference one and convert the time scale to the frequency one. Both of these procedures have some specifics with used in our experiments self-scanning single-frequency laser. Firstly, the laser generate pulses. Thus pulse by pulse division should be applied. Secondly, each pulse contains single longitudinal mode radiation and pulse to pulse frequency shift corresponds to one intermode frequency interval, Δν. Thus we can count pulses and then convert these numbers to the optical frequency scale by multiplication with the intermode interval Δν. Information from HITRAN [9] about frequencies of water absorption lines is used for the accurate conversion of radiation pulse number in the pulse train into the radiation frequency. For this purpose only two fitting parameters are used to match positions of absorption lines in the measured spectra and water absorption spectra from HITRAN: the frequency increment between adjacent pulses and starting frequency of the scan. Then the normalized signal is smoothed by Savitzky-Golay filter of second order with 25 window points for noise reduction. The application of this procedure does not lead to noticeable increase of the recorded linewidth of water absorption lines. As a result, we have the raw water transmission spectrum, traw(ν), shown in figure 2 by the red line.

Figure 2. Water transmission spectra,  . Black line—water is frozen in the cell by liquid nitrogen. Red line—water is present in the cell.
Download figure:
Standard image High-resolution imageThe raw transmission spectrum shown in figure 2 has narrow dips originated from the radiation absorption by the water vapour in the cell. The noisy background between the narrow absorption lines has a few contributions. One comes from the interference of the probe beam on the cell windows that could not be completely eliminated by tilting the cell. One more contribution comes from the probe beam absorption by the water vapour in the laboratory air. Finally, there are some small differences in the probe and reference channels in the spectrometer that affect the transmitted spectra  .
.
We took special measures to eliminate spurious background noise in the transmitted spectra  . To do this, we record the
  spectra without water vapour in the cell, which is shown by the black line in figure 2. This is done by freezing the cell appendix by liquid nitrogen. This procedure removes water vapour from the cell leaving unchanged all the other parameters of the spectrometer. We can see in figure 2 (black line) some residual dips having smaller depth and larger width in the transmitted spectra. These dips are produced by the water vapour during the probe beam transmission through laboratory air outside the cell.
The optical density of the water vapour inside the cell can be found as follows,
The optical density τ(ν) is shown in figure 3. This is desired absorption spectrum of the water vapour in the cell that contains the necessary information about abundances of ortho and para water spin isomers in the cell.

Figure 3. Optical density, τ(ν), of the water vapour in the cell. The insert shows two ortho and para lines together with the theoretical modelling.
Download figure:
Standard image High-resolution image3. Data processing
The optical density spectra, τ(ν), presented in figure 3, is determined solely by the water vapour in the cell. It has a much better base line than the raw transmission spectra in figure 2. The position of the narrow absorption lines coincide with high accuracy with the water absorption lines tabulated in HITRAN [9], as can be seen from the insert in figure 3. The widths of the measured absorption lines result from pressure, Doppler and instrumental broadenings. The Doppler width for the water transitions under investigation is ΔνD = 290 MHz (half width at 1/e level). The linewidths of the experimentally detected lines are in the range 320–450 MHz (HWHM).
For processing of water absorption spectra we assume the Voigt line shape, V(ν), for all of the absorption lines,
Here, νi is the center frequency of ith absorption line, n is the total number density of water molecules in the cell,  is the water optical density in the cell at the center of ith line at the unit water density. Parameters
  are deduced from the HITRAN data base. The Voigt profile in equation(2) is a convolution of Lorentz, L(ν), and Doppler, D(ν), profiles. The Lorentz width for each absorption line is taken from HITRAN data base for water vapour pressure equal to 23 mbar.
Optical densities of the lines given by equation(2) allow us to calculate theoretical spectra, which must be compared with experimental one. For determination of ortho and para molecular densities in the cell we must split the theoretical absorption spectra into ortho and para parts,
where n1 and n2 are two adjustable parameters in the fitting of τtheor(ν) to the experimental spectrum τ(ν). Selection of ortho and para absorption lines from HITRAN data base is straightforward. The ortho water has absorption lines with odd ( ) values in the ground electronic and vibrational state, but para water has the lines with even (
 ) values. Here, Ka and Kc are rotational quantum numbers in the ground vibrational state of H2O.
Parameters  used for theoretical absorption spectra τtheor(ν) are tabulated in HITRAN with the assumption that absorbing gas is at thermal equilibrium. At thermal equilibrium the concentrations of water spin isomers are determined by the ortho (
 ) and para (
 ) partition functions. Consequently, the densities of ortho and para water isomers in the cell are determined by the equations,
The ratio of partition functions for water nuclear spin isomers at room temperature is equal to the ratio of nuclear spin degeneracies of water isomers,  with high accuracy [10]. Consequently, we have,

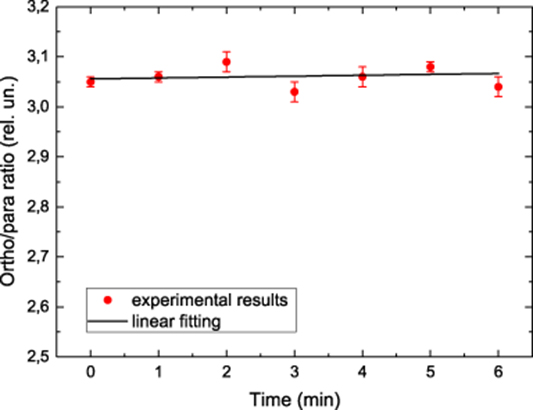
These are relations that allow us to determine the water OPR from the experimental data on the n1 and n2 densities. The water OPR measured in this work is presented in figure 4.
Figure 4. OPR of the water nuclear spin isomers.
Download figure:
Standard image High-resolution image
4. Discussion and conclusions
Water OPR presented in figure 4 was measured at the same physical conditions with the time step of 1 min. The measured OPR appeared to be equal to 3.06 ± 0.02. The error indicated here includes statistical and systematic errors and corresponds to the 90% confidence interval. Stability in time of the spectrometer performance is illustrated by the variation of the water OPR data measured at identical physical conditions, which is estimated from the long-term trend as ≤ 2 · 10−3 min−1.
The measured OPR of water spin isomers appeared to be by 2% larger than the theoretical value, 3, determined by the ratio of the H2O ortho and para nuclear statistical weights. It is interesting to note that the water OPR in another work [15] measured with terahertz spectrometer gave a value 3.03 ± 0.03, which is also somewhat larger than the theoretical water OPR equal to 3. We have also performed a special check of a possible contribution coming from the continuum absorption by water clusters to the registered water optical density [20]. This contribution appeared to be too small to explain the observed anomaly in the water OPR. We will address this anomaly in future work.
In conclusion, we have developed a near infrared spectrometer based on the self-scanning Tm-doped fiber laser. The spectrometer is applied to measurements of the water OPR using water absorption lines in the vibrational band  near 1.91 µm. The measured OPR is found to be equal to 3.06 ± 0.02. The indicated error corresponds to the 90% confidence interval and combines statistical and systematic errors. The developed spectrometer demonstrates high stability in time for the OPR ratio, ≤ 2 · 10−3 min−1. The obtained stability in the OPR measurements is important for the use of the spectrometer in experiments on the water isomer enrichment and conversion.
The developed spectrometer has a few advantages in comparison with the other methods for the detection of water OPR [3, 15, 16]. First of all, the spectrometer has relatively large scanning range that allows one to use many ortho and para absorptions lines of the water. This increases the accuracy of the measurements. Spectrometer allows us to perform rather fast measurements, up to 1 measurement per second. We can also vary the spectrometer frequency scanning range to include, or exclude some absorption lines. Another advantage comes from the features of the self-scanning Tm-doped fiber laser. The laser produces an output beam of good quality and the frequency scanning is originated from specific physical processes in the laser itself without the need of additional frequency selective optical elements.
Acknowledgments
The work of A E Budarnykh, I A Lobach and S I Kablukov is performed within the framework of the State assignment of the IA&E SB RAS ( 0254-2019-0001). The work of P L Chapovsky is supported by the Russian Science Foundation (Project No. 17-12-01418). An employment of facility of the Multiple-Access Centre "High-resolution Spectroscopy of Gases and Condensed Matter" at the IA&E SB RAS, Novosibirsk, Russian Federation is acknowledged.