


Introduction
Distribution and adaptability of all biological organisms in a particular geographic location is defined by bio-physical and environmental factors. Slight changes in bioclimatic variables would have large ramifications on the characteristics of ecosystem functions, diversity and species dynamics. Studies have indicated that the upward trend in the mean temperatures is likely to have significant implications on the survival and distribution of species (IPCC, 2013; Pimm et al., Reference Pimm, Jenkins, Abell, Brooks, Gittleman, Joppa, Raven, Roberts and Sexton2014). The habitats of plants and animals, and their niches, have been irrecoverably altered, or lost to anthropogenic activities (Pimm et al., Reference Pimm, Ayres, Balmford, Branch, Brandon, Brooks, Bustamante, Costanza, Cowling, Curran, Dobson, Farber, da Fonseca, Gascon, Kitching, McNeely, Lovejoy, Mittermeier, Myers, Patz, Raffle, Rapport, Raven, Roberts, Rodriguez, Rylands, Tucker, Safina, Samper, Stiassny, Supriatna, Wall and Wilcove2001; Lewis, Reference Lewis2006; Hof et al., Reference Hof, Levinsky, Araújo and Rahbek2011). One of the most important issues of climate change in the recent years is the reduction of environmental spaces of plants and animals, leading to habitat alteration (Bellard et al., Reference Bellard, Bertelsmeier, Leadley, Thuiller and Courchamp2012). These environmental changes are reported to have led to shifts in the species' geographical range, including extinction across the globe (Pearson et al., Reference Pearson, Stanton, Shoemaker, Aiello-Lammens, Ersts, Horning, Fordham, Raxworthy, Ryu, McNees and Akçakaya2014; Pacifici et al., Reference Pacifici, Foden, Visconti, Watson, Butchart, Kovacs, Scheffers, David, Martin, Akcakaya, Corlett, Huntley, Bickford, Carr, Hoffmann, Midgley, Pearce-Kelly, Pearson, Williams, Willis, Young and Rondinini2015). Under the projected future climate, plants (crops) are reportedly most affected, through changes in their phenotypic plasticity (Nicotra et al., Reference Nicotra, Atkin, Bonser, Davidson, Finnegan, Mathesius, Poot, Purugganan, Richards, Valladares and Kleunen2010; Gray and Brady, Reference Gray and Brady2016), distribution pattern (Wang et al., Reference Wang, Tang, Zhu, Pan, Hu, He and Li2014; Deb et al., Reference Deb, Phinn, Butt and Mcalpine2017) and yield responses (Lobell and Field, Reference Lobell and Field2007; Kim et al., Reference Kim, Ko, Kang and Tenhunen2013; Leng and Huang, Reference Leng and Huang2017; Van Oort and Zwart, Reference Van Oort and Zwart2018). Because farming is intrinsically dependent on environmental conditions and weather factors, agro-ecologies are one of the most vulnerable systems that require utmost attention for long-term sustainability. Among the agro-ecological entities, rice (Oryza sativa L.) is one of the most important crops that is highly vulnerable to the climate change-induced vagaries of weather fluctuations (Mohanty et al., Reference Mohanty, Wassmann, Nelson, Moya and Jagadish2013; Trisurat et al., Reference Trisurat, Aekakkararungroj, Ma and Johnston2018; Ray et al., Reference Ray, West, Clark, Gerber, Prishchepov and Chatterjee2019). Globally, rice is being grown in different regions of the world: South East Asia, South Asia, Mediterranean countries, Middle East, Africa, USA, Brazil and a few other Latin-American countries (Yoshida, Reference Yoshida1981; Grisp, 2013). It has been revealed that rice is the most important crop that feeds more people than any other crop in the world (GRiSP, 2013; Muthayya et al., Reference Muthayya, Sugimoto, Montgomery and Maberly2014; Chauhan et al., Reference Chauhan, Jabran and Mahajan2017). People of Bhutan eat rice three times a day, and this crop constituted a lifeline for many Asians. In recent years, there has been major interventions in rice research and development in the country. However, the crop has been hit hard by increased frequency of drought and erratic precipitation (NBC, 2011; Parker et al., Reference Parker, Guerten, Nguyen, Rinzin, Tashi, Wangchuk, Bajgai, Subedi, Phuntsho, Thinley, Chhogyel, Gyalmo, Katwal, Zangpo, Acharya, Pradhan and Penjor2017; Chhogyel and Kumar, Reference Chhogyel and Kumar2018). Bhutan, by virtue of its location in the Himalayas is reported to have experienced a large impact of climate change (Chhogyel et al., Reference Chhogyel, Kumar and Bajgai2020a).
Technological breakthroughs, such as advances in geo-spatial sciences, and computer soft power have enabled climate impact and spatial-modelling studies. Among many, maximum entropy (MaxEnt) modelling is one of the popular GIS-based software packages used for the development of species distribution models (Phillips et al., Reference Phillips, Anderson and Schapire2006; Abdelaal et al., Reference Abdelaal, Fois, Fenu and Bacchetta2019; Kariyawasam et al., Reference Kariyawasam, Kumar and Ratnayake2019). Studies have reported that MaxEnt is an internationally accepted and widely used model for mapping and analysis of both animals and plant species under different climate scenarios (Qin et al., Reference Qin, Liu, Guo, Bussmann, Ma, Jian, Xu and Pei2017; Esfanjani et al., Reference Esfanjani, Ghorbani and Zare Chahouki2018; Lamsal et al., Reference Lamsal, Kumar, Aryal and Atreya2018; Sharma et al., Reference Sharma, Arunachalam, Bhavsar and Kala2018). There are also reports of species distribution modelling (SDM) being developed for rice and its ecosystem (Heumann et al., Reference Heumann, Walsh and Mcdaniel2011; Ojara et al., Reference Ojara, Ann, Lawrence, Ogwang and Peter2017; Byeon et al., Reference Byeon, Jung and Lee2018). Modelling studied of Kim et al. (Reference Kim, Ko, Kang and Tenhunen2013), Chun et al. (Reference Chun, Li, Wang, Wee, Horstmann, Park, Veasna, Vanndy, Pros and Vang2016) and Zhang and Tao (Reference Zhang and Tao2013) reported marked changes in the rice response to the changes in the projections of future climate. Findings of these studies could be useful for environmental conservation and climate policy perspectives, besides contributing to the scientific knowledge at large. Based on the spatial and climatic heterogeneities of the rice ecosystem, it is important for countries to model its distribution for future climate adaptation and mitigation plans. The models that represent environmental space for crops, such as rice under the projected future ensembles of climate will be highly useful to obtain a clearer picture of its impact in the projected future. Thus, it is imperative that the rice-producing countries, especially in South Asia and South East Asia, must put in best policy support and development strategies to overcome the scourge of climate change impacts for both short and long terms. Moreover, rice paddies are considered as one of the most important areas of scientific research, given that rice systems emit varying levels of greenhouse gases into the atmosphere, particularly CH4 and N2O (Linquist et al., Reference Linquist, Adviento-Borbe, Pittelkow, Van Kessel and Van Groenigen2012). Furthermore, under the impact of climate change, water resources are said to be getting scarce and is projected to decrease further (Schewe et al., Reference Schewe, Heinke, Gerten, Haddeland, Arnell, Clark, Dankers, Eisner, Balazs, Colon-Gonzalez, Gosling, Kim, Liu, Masaki, Portmann, Satoh, Stacke, Tang, Wada, Wisser, Albrecht, Frieler, Pointek, Warszawski and Kabat2014). Considering such a scenario under the impacts of climate change rice, which requires the maximum water than any other crops, is likely to be affected the most (Wassmann et al., Reference Wassmann, Buendia, Lantin, Lubigan, Umali, Nocon, Javellana and Neue2000; Bouman et al., Reference Bouman, Lampayan and Tuong2007; Mohanty et al., Reference Mohanty, Wassmann, Nelson, Moya and Jagadish2013). Therefore, prediction of changes in the geographical distribution of rice using different levels of Intergovernmental Panel on Climate Change's (IPCC) representative concentration pathways (RCPs) would provide some convincing evidence for the impacts of climate change on the crop. In this context, the current research was undertaken to study the impacts of climate change on distribution of Bhutan's most important crop (rice) through MaxEnt modelling with specific objectives: (1) to model the distribution pattern of rice for the current and future climate, (2) to compare the projected rice distribution pattern under the anthropogenic forcing of RCP2.6, RCP4.5 and RCP8.5 and (3) to analyse spatial changes in environmental spaces (suitability) under the future climate as indications for future climate mitigation and adaption strategies in Bhutan. As the country currently lacks published studies, the research output so generated is aimed at providing a major thrust for the future climate studies and policy development, including rural livelihood projects and any other developmental initiatives that the country will undertake for long-term sustainability of rice ecosystems.
Materials and methods
Study site
The study is based on the national rice area of the Himalayan country of Bhutan in Asia, located in the eastern part of the Himalayas, between China and India (NEC, 2011). Bhutan's border stretches between latitudes 26°42′2.36″N and 28°14′51.64″N and longitudes 89°46′5.7″E and 90°32′3.29″E (Fig. 1). It is one of the smallest countries in the world with a geographical area of just 38 394 km2 (NSSC and PPD, 2011) and is a mountainous country with rugged topographic features. However, Bhutan has a highly heterogeneous climate supporting rich biodiversity (NBSAP, 2014), thus making it an important study area for the current research. It stretches from the sub-tropical region in the south to temperate regions in the north with an elevation range of 100–2600 m above mean sea level (Chhogyel et al., Reference Chhogyel, Ghimiray and Subedi2018). Rice in Bhutan is concentrated in the narrow valleys and smaller land parcels across mountain slopes throughout the country (Chhogyel et al., Reference Chhogyel, Ghimiray, Wangdue and Bajgai2015; DoA, 2016). Though rice is the most studied crop, for Bhutan not many studies have been undertaken to fully understand the crop response under the country's changing climate and environmental conditions. This crop has been chosen as the biological entity for SDM, or the environmental niche modelling (ENM) study because it is the most widely cultivated crop species in Bhutan and it is imperative that the distribution pattern of the crop is stratified based on its environmental suitability that potentially indicates distribution.

Fig. 1. Ecological distribution and niche model of rice area in Bhutan under the current climate (1970–2000). Circles represent areas where rice is present.
Bhutan is a carbon negative country and does not contribute to global warming; however, the impacts of climate change have been increasingly felt in recent years. Scientific findings from a small country, such as Bhutan, could potentially capture a wider audience as the issues of climate change impacts reverberate around the world. Thus, the current research on Bhutan could be taken as a case study of a developing country in Asia.
Data use and processing
Two important categories of inputs used for MaxEnt modelling include species occurrence (presence-only) and environmental variables. The occurrence of species in an environmental space is indicated by location points, or the geographic coordinates (longitudes and latitudes in decimal degrees) of that particular place and was assessed in the current work based on the observation of rice-growing areas in the country. Geographic coordinates corresponding to the different locations of rice areas were used as data confirming species presence for running the model. A total of 514 geographic coordinates were derived from the raster file of rice cultivation area, which was obtained from the Ministry of Agriculture and Forests, Royal Government of Bhutan. For maximum coverage of the study area, an additional 993 species location points were collected from the rice cultivation areas using Google Earth Pro (https://www.google.com/earth). Altogether, a sum of 1507 geographic coordinates of species presence-only data (514 from country raster file and 993 from online Google Earth) were collected and pre-processed with spatial rarefication at 2 km resolution to remove highly auto-correlated geographic coordinates that contribute to environmental biases. According to Boria et al. (Reference Boria, Olson, Goodman and Anderson2014), spatial data filter is said to reduce the effects of sampling bias by reducing the degree of overfitting in the model.
In the case of bioclimatic variables, data (WorldClim version 1.2) were acquired from the public domain of the global climate website (https://worldclim.org/data/bioclim.html). The bioclimatic variables were current (1970–2000) and future projected climate data (2041–2060). A total of 19 grid-based bioclimatic variables at 30 arcsec (~1 km2) were downloaded and processed, mainly for removing collinearity of data. The collinearity between the 19 variables was evaluated using the ‘remove collinearity’ function in R. The highly correlated variables were removed and predictors for which pairwise Pearson's correlation coefficient between variables with R ⩾ 0.80 were used (Yang et al., Reference Yang, Kushwaha, Saran, Xu and Roy2013; Qin et al., Reference Qin, Liu, Guo, Bussmann, Ma, Jian, Xu and Pei2017; Jayasinghe and Kumar, Reference Jayasinghe and Kumar2019; Kariyawasam et al., Reference Kariyawasam, Kumar and Ratnayake2019). Additional geo-physical inputs, such as Digital Elevation Model (DEM), having a similar resolution to that of bioclimatic variables, were downloaded from the global multi-resolution terrain elevation data 2010 (http://lta.cr.usgs.gov/GMTED2010) and clipped for the study area. From this, slope and aspect rasters of the study area were derived and used as additional layers for the MaxEnt modelling work. Elevation, slope and aspect are important limiting factors in rice cultivation for a mountainous country, such as Bhutan, where crop-growing terraces are limited to gentle slopes and river valleys. Finally, we had ten sets of input variables (seven bioclimatic and three geo-physical) used for generating rice distribution models (Table 1). The environmental variables were rasterized into the same boundaries and pixel sizes, including the coordinate systems using Geographic Information System (GIS), ArcMap version 10.4.1. Also, all the input environmental variables were re-projected to CGS_WGS_1984 with a spatial resolution of 1 km2, after which the layers were converted to ASCII format for export and subsequent modelling process in MaxEnt software.
Table 1. Bioclimatic variables used for SDM of rice
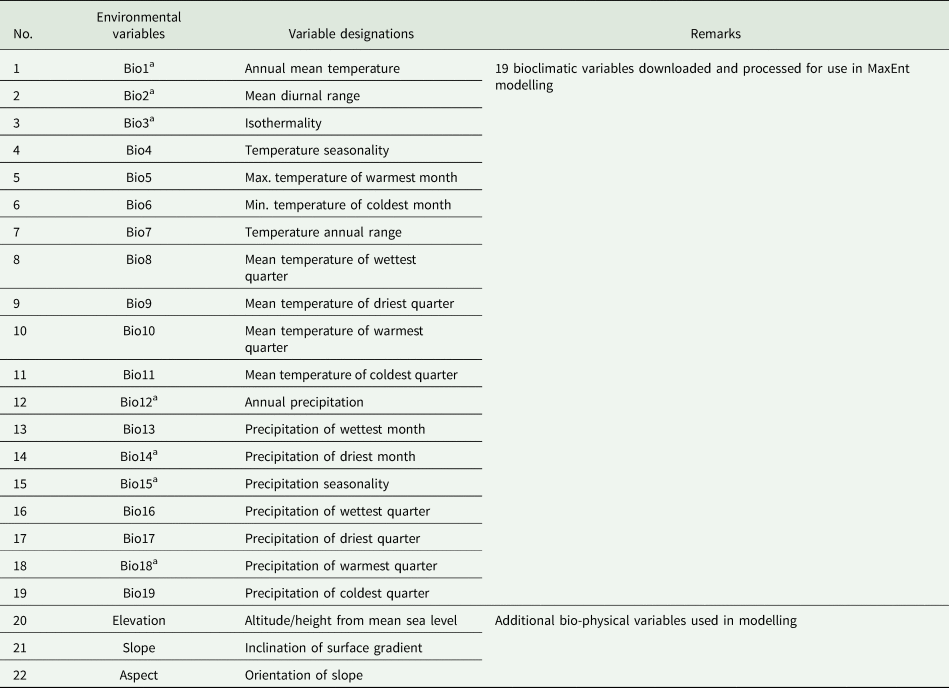
a Indicates selected bioclimatic variables based on collinearity test and rest were discarded.
MaxEnt and its features
MaxEnt is a GIS-based software package that is quite efficient and user friendly for SDM and species niche modelling (SNM) (Phillips et al., Reference Phillips, Anderson and Schapire2006; Elith and Leathwick, Reference Elith and Leathwick2009). It is a powerful programme for modelling species distributions from presence-only records, and is widely used in biogeography, conservation biology, ecology and evolutionary sciences (Moreno-Amat et al., Reference Moreno-Amat, Mateo, Nieto-Lugilde, Morueta-Holme, Svenning and García-Amorena2015; Vale et al., Reference Vale, Campos, Silva, Gonçalves, Sow, Martínez-Freiría and Brito2016; Merow et al., Reference Merow, Wilson and Jetz2017). Though MaxEnt is said to under-estimate climatic tolerance of species (Bocsi et al., Reference Bocsi, Allen, Bellemare, Kartesz, Nishino, Bradley and Thuiller2016), Elith et al. (Reference Elith, Graham, Anderson, Dudı, Ferrier, Guisan and Zimmermann2006) had the view that it's predictive performance is consistently competitive with the highest performing methods and currently finds extensive use in species distribution studies (Duan et al., Reference Duan, Kong, Huang, Fan and Wang2014; Moreno-Amat et al., Reference Moreno-Amat, Mateo, Nieto-Lugilde, Morueta-Holme, Svenning and García-Amorena2015). The use of species presence-only data in MaxEnt modelling means that there is no inclusion of unreliable absence-data that show tendency to preclude modelling of potential distributions due to their strong imprints of biotic interactions, dispersal constraints and other disturbances (Elith et al., Reference Elith, Phillips, Hastie, Dudík, Chee and Yates2011). Thus, in the presence-only data the models are based on probability of the presence of species, conditioned to exist in a set of environmental covariates that represent environmental conditions. This means that the species presence-only data show the probability of species prevalence as the MaxEnt outputs. The core of the MaxEnt model output is the relative suitability of one place over another based on certain environmental covariates and could be mathematically put as a ratio of conditional densities of covariates at presence sites f 1(z) to unconditional densities of covariates across the study area f(z), represented as f 1(z)/f(z). This is referred to as logistic output (log of output) and better represented as below (Phillips et al., Reference Phillips, Anderson and Schapire2006; Elith et al., Reference Elith, Phillips, Hastie, Dudík, Chee and Yates2011):

where n(z) is the logistic output for relative suitability of the species in that particular place, f 1(z) is the covariates of species presence and f(z) is the covariates across the environmental space.
This notation is the logit core that calibrates the intercept (species occurrence point) to denote the implied probability of the presence at the particular site with typical conditions. Simply put, f 1(z) could be expanded as below:

where en(z) = α + β⋅h(z), in which h(z) is the vector of features, β is the vector of coefficients, which are the constraints on the means of covariates to the means of features and α is a normalizing constant that ensures f 1(z) integrates or sums up to 1.
From this relationship, it establishes that the target of MaxEnt model is en(z) which estimates the probability ratio explained in Eqn (1).
The current study gathered species-presence data for rice to model crop suitability. It is also known that rice is a crop that has specific bio-physical requirements, and is considered to be highly sensitive to the impacts of climate change. Thus, there is a need to develop an ENM for rice under projected future climate based on the current data to serve as a model for the changing environmental conditions.
Settings of the model
MaxEnt software, version 3.4.1 (Phillips et al., Reference Phillips, Miroslav and SchapireInternet) was used for developing a species distribution model for rice in Bhutan. For improving the model performance, a convergence threshold of 10−5 was calibrated with a maximum number of iterations at 5000. These settings provide the models adequate time for convergence of input information to build-up the models. It should be noted that a high number of iterations gives the models sufficient time to process the data, thus avoiding over- or under-prediction of the species distribution. Other calibrations for improving the models included setting the maximum number of background points at 50 000, with a regularization multiplier value of 2. These were mainly for making the fitted surface more regular, or smooth, by controlling overfitting in the environmental space. Regularization multiplier value of 2 meant doubling the regularization, or making the surface more regular (smooth/even) with a large number of background points. The run type was a cross-validation method that divides the original samples into a set of training and testing of the models. The MaxEnt output was formatted to logistics with 75% of the occurrence records were used for training and 25% for random testing of the model. This means that 75% of the data inputs were used for suitability mapping of rice in modelling and 25% of the data for random testing of the model generated by MaxEnt. Furthermore, an auto feature option was selected with five replications, and the rest were kept as default. By these, the occurrence data are randomly split into a number of equal-sized groups called ‘folds’, and models are created leaving out each fold in turn. These settings have been undertaken to give a broader and less discriminating prediction (Phillips et al., Reference Phillips, Anderson and Schapire2006). Other settings included fade-by-clamping that take care of inaccuracies in predictions outside the environmental range of training data and the threshold rule was set to maximum training sensitivity plus the specificity logistics for the present and 2060 suitability maps. Such a setting was found to be one of the best methods for species presence, absence or for presence-only data when random points were used (Liu et al., Reference Liu, Berry, Dawson and Pearson2005).
The model output was based on the area under the receiver operating characteristic (ROC) curve, which is also referred to as area under curve (AUC) (Elith et al., Reference Elith, Graham, Anderson, Dudı, Ferrier, Guisan and Zimmermann2006; Phillips et al., Reference Phillips, Anderson and Schapire2006). AUC is a curve that describes relationship between proportion of correctly predicted presences of species and proportion of species absence incorrectly predicted in the model. According to Thuiller et al. (Reference Thuiller, Richardson, Rouget, Proches and Wilson2006), AUC values ranging between 0.9 and 1.0 show excellent model performance, whereas AUC values of 0.8–0.9 means good; 0.7–0.8 is average; 0.6–0.7 is poor and 0.5–0.6 is insufficient. However, the AUC values must be weighted carefully because there are issues of commission and omission errors (Lobo et al., Reference Lobo, Jimenez-Valverde and Real2008). Lobo et al. (Reference Lobo, Jimenez-Valverde and Real2008) argued that the use of AUC in ROC curves has its drawbacks: (1) it is said to ignore the predicted probability values and goodness-of-fit of the model, (2) it presents a summary of the test performance and not the regions of the ROC space, (3) the omission and commission errors are weighted equally, (4) information on the spatial distribution of model errors are never provided and (5) it does not take into account the total extent to which models are carried out, which greatly influences the rate of well-predicted absences and the AUC scores. In the current work, instead of using only the AUC, the model's sensitivity and specificity was reported so that the relative importance of commission and omission errors can be considered in order to assess the method performance. These allow flexibility in assigning weightage to both types of errors (commission and omission) in fixing an appropriate threshold for prediction. Therefore, the values of AUC have to be backed up with information, such as specificity and sensitivity of the models so generated. Nonetheless, AUC has been used extensively and will continue to be used across disciplines, including SDM studies.
For predicting the relative contribution of the different variables in the model, the jackknife procedure was applied. The jackknife procedure also gives us an idea about the usefulness of variables, which might help in trimming the variable size based on their relative contribution to the models. The variables are judged based on the resulting training gains shown by the bioclimatic variables. The most significant variables are those that show highest training gains. It has been stated that in the Jackknife procedure, each variable is omitted and the model gets rebuilt with repeated readjustments (Phillips et al., Reference Phillips, Anderson and Schapire2006; Kalle et al., Reference Kalle, Ramesh, Qureshi and Sankar2013).
Future projection
For MaxEnt models, the projections were based on 2041–2060 future climate scenarios under IPCC's anthropogenic radiative forcing of RCP2.6, RCP4.5 and RCP8.5 (www.worldclim.org). The model for Interdisciplinary Research on Climate version 5 (MIROC5) of the global climate model was used as it has a better simulation of the climatic parameters due to improved anthropogenic radiative forcing than its past versions (Watanabe et al., Reference Watanabe, Suzuki, O'ishi, Komuro, Watanabe, Emori, Takemura, Chikira, Ogura, Sekiguchi, Takata, Yamazaki, Yokohata, Nozawa, Hasumi, Tatebe and Kimoto2010). Other studies, especially in the south Asian and Himalayan regions, have also used MIROC5 due to its improved capabilities in capturing features well (Mishra et al., Reference Mishra, Kumar, Ganguly, Sanjay and Mujumdar2014; Sharmila et al., Reference Sharmila, Joseph, Sahai, Abhilash and Chattopadhyay2015). Future simulations were compared among the different RCPs. RCP8.5 is an extreme carbon emission climate scenario with a radiative forcing of +8.5 W/m2 (~935 ppm CO2 equivalent), whereas RCP4.5 is a medium range emission scenario with radiative forcing of about +4.5 W/m2 (~650 ppm CO2 equivalent) and RCP2.6 represents the lowest emission scenario (IPCC, 2013).
To detect spatial differences in crop suitability under the current and future climate scenarios, a pairwise comparison of the models was undertaken: the current v. RCP2.6, the current v. RCP4.5 and the current v. RCP8.5. Essentially, the suitability maps (models) were overlaid and changes (decrease or increase) in suitability between the current and future RCPs were assessed based on differences or overlaps in grids and number of pixels corresponding to different suitability classes (marginal, low, medium and high). The differences in area were obtained by multiplying the numbers and size of pixel for each of the suitability classes, thus defining future distribution. Projected geographical distribution was undertaken on the basis that ecological niches are dictated by the climatic suitability of the species (De Meyer et al., Reference De Meyer, Robertson, Peterson and Mansell2007; Banag et al., Reference Banag, Thrippleton, Alejandro, Reineking and Liede-Schumann2015). Climatic suitability of rice, indicating projected distribution by 2060, was categorized into marginal, low, medium and high areas. Categorization of suitability classes were defined based on probabilities of occurrences at <25, 25–40, 40–60 and >60% for marginal, low, medium and high suitability, respectively. Other MaxEnt modelling studies have also reported more or less similar thresholds for the analysis of suitability for projecting species distribution (He and Zhou, Reference He and Zhou2011; Yang et al., Reference Yang, Kushwaha, Saran, Xu and Roy2013). The marginal suitability in the current context means unsuitable area for rice with <25% species presence. The changes in area were derived from the pixel shifts in each category of the probabilities of suitability, indicating distribution using ArcGIS.
Results
Model development
The MaxEnt generated crop suitability models for the future climate of 2070 were the projected rice distribution models. The prediction models for rice distribution showed that the largest contributions came from the variables, such as precipitation of the warmest quarter (71.4%), mean diurnal range of temperatures (6.1%) and precipitation seasonality (5.4%) (Table 2). Other variables, viz., aspect, elevation and annual mean temperature contributed 3.9, 3.5 and 3.1%, respectively. The precipitation of the driest month and annual precipitation had the least effect on the rice model with a contribution of about 1% each. However, in terms of permutation importance, which shows all possible combinations of the variables used based on the presence and random selection of background points, elevation, annual precipitation, precipitation seasonality and mean annual range of temperature had the largest contribution as detailed in Table 2. Permutation importance is an auto-generated variable contribution parameter obtained for predicting distribution of the species in question by MaxEnt software. In terms of variable importance, the jackknife test indicated that without the effects of other variables (without variables), the contributions from the aspect, isothermality (Bio3) and slopes (Table 1) were the lowest (Fig. 2). However, individually, annual mean temperature and elevation had the maximum test gain (a MaxEnt output evaluation language denoting contribution) when used in isolation. This was followed by precipitation of the warmest quarter (Bio18), precipitation of the driest month (Bio14) and annual precipitation (Bio1), thus showing that rice distribution model is determined mostly by the temperature, precipitation and altitude gradients. The models depicted that rice suitability across different locations in Bhutan is influenced mainly by temperature gradient and annual precipitation, including precipitation of the driest month as well as the warmest quarter. These climatic variables were, in turn, largely dictated by elevation, which has been considered as one of the most limiting factors in rice production in the country. This is true because altitude has a marked influence on temperature and precipitation regimes due to orographic mass airflow dynamics, especially in the mountainous regions, such as Bhutan. Further analysis of the model through the AUC showed a mean value of 0.888 (Fig. 3). This AUC value confirms that the predicting variables used in the study were effective at projecting distribution of rice based on climatic suitability and terrain information (slope, aspects and elevation). Additionally, the specificity (proportion of species presence which are correctly predicted) and sensitivity (the proportion of species absence which are correctly predicted) of the curve showed a fractional predictive threshold in the range of 0.3–0.4 with higher sensitivity, thus indicating a balanced trade-off between commission and omission errors. Thus, the auto-generated MaxEnt outputs indicate good predictability of the model.

Fig. 2. Jackknife of test gain indicating the best fit rice distribution model as contributions of different bioclimatic and bio-physical variables used in the modelling process. ‘Without variable’ refers to without that particular variable and other variables remaining the same; ‘With only variable’ means considering only that variable and ‘With all variables’ means the average cumulative contributions of all in generating the rice suitability-based distribution model.

Fig. 3. (Colour online) Sensitivity and specificity of different variables in predicting distribution model for O. sativa L.
Table 2. Average values of the five replicate runs contributing to the rice distribution model

The traditional ROC approach is currently considered to be the standard method to assess the accuracy of predictive distribution models. It is simple and not subjective, that allows easy threshold selection, especially for those requiring conversion of continuous probability derived scores to a binary presence–absence variable.
Distribution changes and projections
Based on the species presence-only data, bioclimatic and environmental variables used, MaxEnt generated rice suitability models which could be referred to as the future rice distribution models for Bhutan. The models indicated large changes in the distribution of rice across the rice ecosystems due to changes in its climatic suitability (Fig. 4). A comparison of projected rice distribution changes under three different anthropogenic forcing scenarios showed that rice area is projected to decrease by about 8–30% in moderately and highly suitable regions (Table 3). It was projected that under the current scenario, ecological niche for rice distribution is 11 512.16 km2 which roughly translates to 30% of the total environmentally suitable area. Under the future projected climate of 2060, this ecological space of rice changes to 11 908.96 km2 in RCP2.6, to 8843.32 km2 in RCP4.5 and 8754.52 km2 in RCP8.5. A comparison of different predicted rice distribution models, under the three RCPs of IPCC indicates that there is a large likelihood of maximum changes under RCP8.5 (worst scenario) and less changes under RCP2.6. Under RCP4.5 (medium range), suitability change is about 30%, with the maximum being in the mid- and low-altitude regions of the country. The three future projection models indicate both horizontal and vertical changes in the environmental and climatic suitability of rice in the near future. Generally, the crop suitability changes under the future projections indicate large variability in rice distribution across the country. Under RCP4.5 and RCP8.5, some gain in suitability is indicated in the marginal zone which has been categorized as non-rice-growing area. Among the rice distribution classes, low, medium and high categories will likely see suitability loss in the range of 8.17–43.12%. These changes thus predict spatial distribution changes of rice across the rice-growing zones (Figs 4 and 5).

Fig. 4. Predicted rice distribution model for Bhutan under three different emission scenarios: RCP2.6, RCP4.5 and RCP8.5 for 2041–2060.

Fig. 5. Spatial magnitude of likely distribution changes across the country (Bhutan) under three different RCPs for 2041–2060 future climate scenarios.
Table 3. Ecological niche for the distribution of rice under the current (1970–2000) and future climate (2041–2060)

Discussion
The MaxEnt modelling in the current study, which used species occurrence-only data, with environmental layers as MaxEnt inputs (bioclimatic and bio-physical variables) predicted future distribution of rice in the country. The projected distribution area for the species is basically the probability of habitat suitability niches, or the niche models generated by using MaxEnt software (Phillips et al., Reference Phillips, Anderson and Schapire2006; Elith and Leathwick, Reference Elith and Leathwick2009), which could be potentially used for forecasting distribution pattern of agricultural crops. Similar studies have been reported for invasive species (Lamsal et al., Reference Lamsal, Kumar, Aryal and Atreya2018), rare trees (Deb et al., Reference Deb, Phinn, Butt and Mcalpine2017; Qin et al., Reference Qin, Liu, Guo, Bussmann, Ma, Jian, Xu and Pei2017) and cereal crops (Ojara et al., Reference Ojara, Ann, Lawrence, Ogwang and Peter2017). In the current study, the MaxEnt models indicated large changes in climatic suitability across the agro-ecological zones, which is a crucial factor for the adaptability and distribution of crops. Therefore, monitoring crop habitat suitability dynamics is important in assessing their distribution path for sustainable production and future planning (Ojara et al., Reference Ojara, Ann, Lawrence, Ogwang and Peter2017; Sharma et al., Reference Sharma, Arunachalam, Bhavsar and Kala2018). In the current research, the models under all the three anthropogenic forcing of IPCC showed large variations, in terms of magnitude and space. The models clearly show both gain and loss in area, thus indicating ecological niche shift. This is consistent with the findings of Chhogyel et al. (Reference Chhogyel, Ghimiray and Subedi2018) and Parker et al. (Reference Parker, Guerten, Nguyen, Rinzin, Tashi, Wangchuk, Bajgai, Subedi, Phuntsho, Thinley, Chhogyel, Gyalmo, Katwal, Zangpo, Acharya, Pradhan and Penjor2017) who modelled distribution of rice and other major crops in Bhutan based on eco-crop parameters. With shift in climatic suitability, crop plants will adapt and thrive in new environment. Plants were reported to show remarkable capacity of acclimation under a changing climatic condition (Hamann et al., Reference Hamann, Kesselring and Stöcklin2018). These are some of the evidences that could be correlated with the likely changes in future distribution of rice in Bhutan, due to environmental and climatic factors. Based on the projection of RCP4.5, the 2871.2 km2 decrease in suitable area means increased climatic stress in large parts of rice areas which are mostly located towards the drier and temperate zones where cultivation is limited by topographic features, temperature requirement and altitudinal gradients. Rice in Bhutan is limited mainly by cold stress in the higher elevation (>1800 m above msl), especially during the seedling (spring) and grain-filling stages in late autumn (Ghimiray et al., Reference Ghimiray, Dorji, Katwal, Penjor, Dorji, Pem, Tenzin and Pradhan2008; Chhogyel et al., Reference Chhogyel, Pradhan, Ghimiray and Bajgai2016). In most temperate rice-growing regions of the world, crop yields are reported to be affected largely by cold temperature stress during various stages of the plants (Kim et al., Reference Kim, Ko, Kang and Tenhunen2013; Espe et al., Reference Espe, Hill, Hijmans, Mckenzie, Mutters, Espino, Leinfelder-Miles, Kessel and Linquist2017). Field issues as these will be further exacerbated by large swings in precipitation patterns (Auffhammer et al., Reference Auffhammer, Ramanathan and Vincent2012) and heat stress (Auffhammer et al., Reference Auffhammer, Ramanathan and Vincent2012; Deryng et al., Reference Deryng, Conway, Ramankutty, Price and Warren2014), under the impact of climate change through the 21st century. The lower subtropical zones are mostly rainfed, thus indicating that the erratic precipitation under the impacts of future climate is likely to hit large tracts of rice belts in the country. It has been reported that climate change has farmers in Bhutan had started experiencing erratic pattern of rains and extended drought, thus affecting their crop production (Chhogyel et al., Reference Chhogyel, Kumar, Bajgai and Hasan2020b). Moreover, rice production is likely to bear the brunt of the impacts of climate change as crop production is highly monsoon dependent requiring higher water supply than any other crops (GRriSP, 2013). This is also true in most parts of neighbouring Asian countries where monsoon rains form the main part of the cropping season (Loo et al., Reference Loo, Billa and Singh2015). These only show that the country's rice industry is likely to experience increasing challenges, thus affecting production and food security. Small reduction in its area and production due to climatic suitability will have large consequences on the livelihood of the people. Contraction and gain in suitability of environmental space would have dramatic effect on the future distribution, production and productivity of rice in Bhutan. According to the results of analysis, suitability change of 30–40% was indicated for high and moderately distributed rice-growing areas of Bhutan. This would directly contribute to reduction in yield and production potential of rice in different parts of the country. Even under the very conservative emission scenario of RCP2.6, the models show about 1–7% decrease in crop suitability which will lead to contraction in rice area.
Under sub-optimal conditions of the environment, plants show reduction in yield due to its effects on physiological processes (Condon et al., Reference Condon, Richards, Rebetzke and Farquhar2004; Guilioni et al., Reference Guilioni, Jones, Leinonen and Lhomme2008). This is because crop productivity is a function of environmental conditions during various growth and development phases of the plants (Tardieu, Reference Tardieu2013). Therefore, changing climatic suitability from high to low under future climate should be construed as exposing of crops to various adverse environmental conditions, thereby decreasing yield potential of the crop. In this context, considering 15 year's average of rice area (22 126.98 ha), and assuming it to remain the same until 2070, the yield reduction at 7–30% (due to suitability loss) amounts to a large production decline (from about 64 000 to 34 000 t). An example of modest decrease by a magnitude of 7–30% shows large implications on the future production and yield of rice as highlighted in Table 4. This estimation heralds a bleak future for the rice industry that is striving to enhance production to raise food self-sufficiency. Studies in other countries within the region have already reported empirical evidence of negative impacts of climate change on rice and other crops (Birthal et al., Reference Birthal, Khan, Negi and Agarwal2014; Amin et al., Reference Amin, Zhang and Yang2015). Environmental suitability of crops and plants could be considered as an important indicator of their production potential. It is known that plants responds well to environmental cues. Though there is no such research being conducted in Bhutan, a typical example was reported by Zhang et al. (Reference Zhang, Wang, Ma, Yang and Atkin2015) in China who showed that rice exhibited phenotypic plasticity in the form of yield-related traits when exposed to different environmental conditions. Under unsuitable environmental conditions, rice yield would show drastic reduction. Although gain in suitability is likely to enhance rice distribution area in some places, higher degree of reduction in environmental space across the low elevation rice ecosystems might nullify the gains due to area loss. In fact, the gains were lower than the losses, as higher magnitudes of changes are indicated in major rice-growing districts, such as Wangdue, Punakha, Tsirang, Dagana, Trashigang, Lhuntse, Paro and Samtse. The projected suitability models under 2070 future climate corresponding to RCP2.6, RCP4.5 and RCP8.5 successfully highlight the areas of focus, as major changes were observed in the ecologically important rice-growing hotspots in the lower- and mid-altitude agro-ecological zones (Fig. 1). This means that the impact of climate change on rice is likely to be more severely felt, as the downward trend in the rice area will continue into the foreseeable future with the impacts of climate change. The situation is likely to exacerbate throughout the millennium with more evidence of global warming and climate change being reported by IPCC (2013). This highlights the need for climate smart suitable policies in agriculture development. It has been reported that the rice sector in Bhutan is already experiencing challenges of massive land fallowing due to various reasons, including climate change impacts (DoA, 2016; Chhogyel and Kumar, Reference Chhogyel and Kumar2018).
Table 4. An example of projected production due to suitability loss and changes in distribution pattern

a Rice area assumed to remain same.
Even from the biodiversity point of view, rice ecosystems are one of the most important ecological entities that provide ecological services through nutrient cycling and support to large agro-biodiversity (Settele et al., Reference Settele, Heong, Kühn, Klotz, Spangenberg, Arida, Beaurepaire, Beck, Bergmeier, Burkhard, Brandl, Bustamante, Butler, Cabbigat, Le, Catindig, Ho, Le, Dang, Escalada, Dominik, Franzén, Fried, Görg, Grescho, Grossmann, Gurr, Hadi, Le, Harpke, Hass, Hirneisen, Horgan, Hotes, Isoda, Jahn, Kettle, Klotzbücher, Klotzbücher, Langerwisch, Loke, Lin, Lu, Lum, Magcale–Macandog, Marion, Marquez, Müller, Nguyen, Nguyen, Nguyen, Ott, Penev, Pham, Radermacher, Rodriguez–Labajos, Sann, Sattler, Schädler, Scheu, Schmidt, Schrader, Schweiger, Seppelt, Soitong, Stoev, Stoll–Kleemann, Tekken, Thonicke, Tilliger, Tobias, Trisyono, Dao, Tscharntke, Le, Türke, Václavík, Vetterlein, Villareal, Vu, Vu, Weisser, Westphal, Zhu and Wiemers2018). The probability of large changes in distribution under moderate and worst emission scenarios (RCP4.5 and RCP8.5) indicate the need for both medium- and long-term climate change mitigation and adaptive measures. Based on the findings of the current study, one of the best strategies should be targeted production support and climate resilient infrastructure development in specific locations to mitigate and adapt to the impacts of climate change. Additionally, the models so generated in the current study can also be used to categorize rice areas into high, medium and low climatic risk areas for informed decision and planning. For long-term sustainable rice production, there is definitely a need to make robust investments backed up by continuity in rice research and development to overcome the negative impacts. However, Bocsi et al. (Reference Bocsi, Allen, Bellemare, Kartesz, Nishino, Bradley and Thuiller2016) reported that the use of climate data and SDM are poor predictors of potential distribution of plant species. It has been argued that such models under-estimate climatic tolerance of plant species. Nevertheless, our crop suitability-based models conform to the existing literature and knowledge on the distribution pattern of rice. Thus, the models provide indications of likely changes in species range and could be used as a guide in future development plans. The MaxEnt algorithm compares location of species presence to that of the background locations based on the entropy, thus establishing MaxEnt probability of the distribution (Phillips et al., Reference Phillips, Anderson and Schapire2006). This optimizes the MaxEnt distribution for modelling under differing sets of bioclimatic variables. The gains and losses of crop suitability should be a strong indicator of future distribution areas, thus requiring special attention. Such information could be highly useful not only for projections of future development plans, but also for resource mobilization and effective use of funds.
Limitation of this study
This study brings out comprehensive analysis of the current and projected future distribution of rice based on the climatic suitability and rice presence-only data. However, the study has certain limitations, such as (1) the use of global climate data with coarse pixel size (~1 km2), and (2) the absence of soil data which is a very important factor for any agricultural crops. Given the small geographical size of the country, the 30 arcsec bioclimatic variables downloaded from the globally available website seems to be a bit coarse but, the study also used relevant local data (elevation, aspect and slope). Such bioclimatic data are not available at fin scales for Bhutan. With these parameters, it attempts to forecast the future probability of rice distribution based on the current area and IPCC scenarios. Although most MaxEnt modelling work had used global rice occurrence geographic points, there have also been studies which reported better results with the use of locally available species presence datasets (Yang et al., Reference Yang, Kushwaha, Saran, Xu and Roy2013; Kariyawasam et al., Reference Kariyawasam, Kumar and Ratnayake2019; Li et al., Reference Li, Liu, Wang, Xing and Fu2019). Also, the study could have been much better if soil data were used as an additional input layer for the modelling work. One of the biggest drawbacks of studies in the developing world is the unavailability of baseline data, such as good resolution soil maps.
Furthermore, irrigation data for the study area were not available, but as major rice-growing areas are located in the river valleys with abundant water resource, irrigation parameter may not be an issue for the current modelling exercise. About 60% of the rice area in the country is irrigated and the rest (40%) is rainfed. The rainfed rice areas are higher up in the mountain slope and in most of the cases, the crop totally depends on monsoon rains. The bioclimatic variables used in the study could take care of the irrigation data because climate change-induced monsoonal patterns could have a large influence on the availability of water for the crop. Therefore, even without the use of irrigation as a separate parameter, the current study has a potential to be used as a comprehensive reference document for the country which lacks published data. It is hoped that this paper will be of use for a country that is considered to have one of the highest per capita availability of fresh water in the world (ADB and NEC, 2016).
Conclusion
The rice distribution models under the IPCC's radiative forcing of RCP2.6, RCP4.5 and RCP8.5 projected large spatial variabilities of rice suitability in the study area. A large decrease in environmental niches in the range of 14–43% was projected in the high and moderately distributed rice areas under RCP4.5 and RCP8.5. This indicate that rice productions in all major rice-growing areas of Paro, Wangdue, Punakha, Tsirang, Dagana, Trashigang, Trashi Yangtse and Samtse are likely to shrink in the projected future climate. Therefore, the models generated in the current study portray that crop suitability-based distribution changes are imminent and would require utmost attention and further studies for planning climate change adaptation and mitigation strategies. This is of utmost importance given that projected crop production losses resulting from the changes in distribution were analysed to be 4654.99 to 23 903.95 t, annually.
Acknowledgement
The authors would like to acknowledge the University of New England, NSW, in Australia for the International Postgraduate Research Award (IPRA) to Mr Ngawang Chhogyel who has undertaken this research as part of his PhD programme. Gratitude is also extended to the Department of Agriculture, MoAF, Royal Government of Bhutan for granting him study leave, without which this research would not have been possible.
Financial support
None.
Conflict of interest
None.
Ethical standards
Not applicable.


