


Introduction
Human factors are considered of paramount importance in design practice and research, although their unpredictability represents an obstacle to the creation of models that include individuals in the design process (Papalambros, Reference Papalambros2010). At the same time, design research is increasingly requested to include objective measures that characterize its inherent phenomena, e.g. (Dinar et al., Reference Dinar, Summers, Shah, Park, Cash, Stankovic and Štorga2016) – this is particularly critical when human-related aspects are involved. In addition, scholars long for alleviating the burden of some human-intensive activities in design and design research and making these processes more automated – a case in point is protocol analysis (Jiang and Yen, Reference Jiang and Yen2009).
These considerations might well represent triggers for supporting design research with instruments capable of capturing, measuring, quantifying and interpreting inadvertent, unconscious and involuntary features of human behavior (Lohmeyer and Meboldt, Reference Lohmeyer, Meboldt, Cash, Stankovic and Štorga2016). Those instruments include neurophysiological (Balters and Steinert, Reference Balters and Steinert2017) and neuropsychological (Steinert and Jablokow, Reference Steinert and Jablokow2013) devices, which are mainly oriented to neuroimaging or to measure brain activities. A broader set of instruments is often referred to as biometric devices (Lohmeyer and Meboldt, Reference Lohmeyer, Meboldt, Cash, Stankovic and Štorga2016), whose measures deal with a larger variety of biological indexes beyond those ascribable to the brain. The term “biometric” will be used in the present paper when discussing this class of devices and measures in very general terms. Collections of the specific devices enabling biometric measurements deemed useful in design and engineering are available in Lohmeyer and Meboldt (Reference Lohmeyer, Meboldt, Cash, Stankovic and Štorga2016), Balters and Steinert (Reference Balters and Steinert2017), and Peruzzini et al. (Reference Peruzzini, Grandi and Pellicciari2017).
The present contribution is concerned with the understanding of how, to which extent and in which specific domains, biometric instruments have shaped design research. The previous literature has collected illustrative examples of design-oriented applications of biometric instruments to introduce readers to the field (Lohmeyer and Meboldt, Reference Lohmeyer, Meboldt, Cash, Stankovic and Štorga2016; Balters and Steinert, Reference Balters and Steinert2017). Other articles have broadly discussed the potential of biometric devices in design, presented research methods, laboratories and infrastructure to use biometric instruments effectively, or pinpointed the scope of their employment. Overall, the emerged potential objectives of their exploitation in design and motivations for their diffusion can be summarized as in the followings.
• The study of designers' cognition, cognitive states (Mougenot et al., Reference Mougenot, Watanabe, Bouchard and Aoussat2009) and emotions (Zhao et al., Reference Zhao, Yang, Liu and Zeng2017).
• The inclusion of concepts from affective engineering (Balters and Steinert, Reference Balters and Steinert2017), emotional and Kansei engineering (Hsu et al., Reference Hsu, Fann and Chuang2017; Zhao et al., Reference Zhao, Yang, Liu and Zeng2017), so as to foster emotional design (Triberti et al., Reference Triberti, Chirico, La Rocca and Riva2017) or beauty through design (Khalighy et al., Reference Khalighy, Green, Scheepers and Whittet2015).
• The support of traditional methods by opening up new avenues in the understanding of usability (Hill and Bohil, Reference Hill and Bohil2016), user-product interaction (Jenkins et al., Reference Jenkins, Brown and Rutterford2009; Balters and Steinert, Reference Balters and Steinert2017; Mussgnug et al., Reference Mussgnug, Singer, Lohmeyer and Meboldt2017), user experience (Mussgnug et al., Reference Mussgnug, Lohmeyer and Meboldt2014; Jiao et al., Reference Jiao, Zhou and Chu2017), and user intent (Yang et al., Reference Yang, He, Wu, Tang, Chen and Liang2016). These are supposed to play an increasing role in design, for instance due to the growing emphasis attributed to human-centered design.
• The evaluation and benchmark of new products and designs by means of unconscious feedback (Abdipour et al., Reference Abdipour, Lorentzen, Olin, Di Bucchianico and Kercher2016), the individuation of points and determinants of attraction (Zhang et al., Reference Zhang, Du, Xie and Zou2014; Georgiev et al., Reference Georgiev, Yamada and Taura2017), or the understanding of the psychology of customers (Wang et al., Reference Wang, Liu, Shi and Liu2011).
While objectives and possible benefits of biometric measurements in design have been pinpointed, previous literature has failed to treat the topic in a comprehensive way. This applies particularly to the results and implications of practical experiments, which are systematically reviewed in the present paper. It is also worth noting that the growing number of literature contributions published in the last few years, as the outcomes of the study will elucidate, would have made previous attempts invalid. For instance, the first overview presented in Lohmeyer and Meboldt (Reference Lohmeyer, Meboldt, Cash, Stankovic and Štorga2016) described the work of few pioneering research groups active before 2016. In the authors' view, the topic is mature and relevant enough for a first state-of-the-art analysis; the following reasons support this thought in addition to the recalled relatively large number of recent publications.
• Some scientific events have been organized in the last few years, which demonstrate that the interest in the topic is not restricted to pioneering groups anymore.
• As the treated technologies are now available at generally accessible costs, they have higher chances to become commonplace in design research in the near future.
Accordingly, the present paper intends to gather, benchmark and illustrate experiments and hands-on studies, their results, design implications, alignment with the aforementioned objectives. The paper is organized as follows. The second section presents the steps followed to create a comprehensive sample of relevant experiments. These experiments are first classified into two main groups: experiments involving product evaluation and design processes, whose objectives and main characteristics are illustrated in the third and fourth sections, respectively. The fifth section discusses the outcomes in a qualitative and quantitative way and indicates the limitations of the present study. Conclusions are drawn in the final section.
Sample of reference studies to be analyzed and fundamental classification means
As the goal of the study is to analyze previous research on the use of biometric instruments in design, the first activity was constituted by the collection of reference literature contributions. This took place by collecting the contributions the authors already knew, a snowballing process to individuate additional relevant examples in backward and forward citations, and a final literature search in which the Scopus database was used. This search was carried out by using the field “Title, Abstract and Keywords”, in which terms belonging to both the two groups below should appear.
1. A group of terms ascribable to the design domain, for example “design” or “product development”.
2. A group of terms addressing the ways the instruments in question are referred, for example “biometric” or “physiological”; the name of devices or their common acronyms, for example “eye-tracking”, “electroencephalography”, or “EEG”; or the measures that are extracted, for example “gaze event”, “blood pressure”, or “skin conductance”.
Only those articles describing experiments (claiming to be) relevant to design were further considered. Many contributions were excluded because, despite the matching of search terms in Scopus, were devoted to domains such as “human–machine interaction” or “human–computer interaction”. These domains, beyond not being included within traditional design fields, [see Dykes et al. (Reference Dykes, Rodgers and Smyth2009)], do not mirror the objectives of the use of biometric measures listed in the "Introduction" section. For instance, in human–computer interaction, the use of biometric devices is predominantly oriented to the use of data for allowing computerized systems to work, e.g. for the support of disabled users. In other words, biometric measures do not serve the need of improving design processes or deliverables, which is the fundamental objective for their introduction in engineering and product design, among others. Some articles were excluded because the same experiment with akin measurements was presented in different sources, e.g. a journal extended version of a conference paper – here, the most recent and complete version was considered further.
The final list of analyzed papers is available in Table 1. The table (second column) includes a first classification according to the role played by people participating in the experiment and subjected to biometric measurements, namely evaluators and designers. The former have the task of evaluating products or any deliverables of design processes in order to provide information relevant to design itself; for instance, such information regards understandability of the designs, assessment of quality or attractiveness, and hints useful to form consumer preferences. The latter actively participate in the design process and have to perform tasks that are ascribable to designers, e.g. ideating or making decisions. In light of this distinction, the second group is more oriented to design research than the first one, which is conversely majorly featured by an interest in design deliverables. The same distinction between evaluators and designers, which is made explicit already in Lohmeyer and Meboldt (Reference Lohmeyer, Meboldt, Cash, Stankovic and Štorga2016), is also used to subdivide the following two sections.
Table 1. Sample of analyzed experiments characterized according to employed biometric measurement devices, role of participants in the corresponding experiments (evaluators or designers), and the kind of experiments in terms or relations between biometric and traditionally extracted variables

In the fourth column, Table 1 reports the biometric tools that are used in the experiments described in the corresponding contributions. As inferable from the table, the following biometric and neurophysiological devices have been overall used.
• Eye-tracking (ET) devices meant to acquire one's visual patterns and pupil diameter. The two models, that is remote ET and ET glasses (sometimes referred to as mobile ET), are used when participants interact with computer screens or the physical space, respectively.
• Neuroimaging instruments for the measurement of brain function and activation, such as electroencephalography (EEG) headsets and helmets, functional Magnetic Resonance Imaging (fMRI) scanners, and functional Near-Infrared Spectroscopy (fNIRS) sensors and systems.
• Other instruments and sensors that capture biofeedback from the human body include the measure of Galvanic Skin Response (GSR), Heart Rate Variability (HRV), which is traditionally assessed by means of Electrocardiography (ECG), and muscles' contraction by means of Electromyography (EMG).
The present paper takes for granted the functioning of the mentioned devices, the measures that are extracted, the events that are detected, for example fixations and saccades as for ET, and the phenomena that are commonly inferred, e.g. arousal as a result of the sudden increase of people's sweat captured by GSR meters. Such information can be independently extracted by contributions discussed in the paper, such as Liu et al. (Reference Liu, Ritchie, Lim, Kosmadoudi, Sivanathan and Sung2014), Hill and Bohil (Reference Hill and Bohil2016), Lohmeyer and Meboldt (Reference Lohmeyer, Meboldt, Cash, Stankovic and Štorga2016), Balters and Steinert (Reference Balters and Steinert2017), Ergan et al. (Reference Ergan, Radwan, Zou, Tseng and Han2019), and Nguyen et al. (Reference Nguyen, Nguyen and Zeng2019). Anyway, the measures that are benefitted from in each source and the variables and phenomena that are associated to them are also included in Table 1 (fifth to ninth column), but such aspects will be discussed after the illustration of the reviewed contributions.
A further classification, still present in Table 1 (third column), will be used to organize the contributions in the next two sections. This classification concerns the way extracted biometric measures have been exploited for the scope of the experiments. As already clarified, biometric measures are behavioral variables used to describe a certain phenomenon. In general, such a phenomenon can also be explored by means of traditional methods, which leverage subjective reports very diffusedly. The relationship between dependent variables obtained through biometric devices and traditional methods is the criterion that was used by the authors to classify the experiments. In addition, many contributions leverage independent variables included in the design of the experiment (usually referred as stimuli), that are manipulated in order to observe different effects and people's behaviors, but these are not considered for the classification. The four classes in the numbered list below are ordered according to the expectedly growing maturity attributed to the use of biometric devices and to the corresponding capability of interpreting the extracted measures. In the first two classes, a relationship between traditional and biometric measures is found. However, the two reflect the difference between exploratory and confirmatory research, e.g. de Groot (Reference de Groot2014), as two different steps included in empirical research to generate knowledge and formulate theories. Once this new knowledge has been gained, the phenomena of interest can be investigated reliably with biometric instruments, whose measures can be considered as empirically validated. Therefore, new integrated cycles of empiricism, as termed by Cash et al. (Reference Cash, Stanković, Štorga, Cash, Stankovic and Štorga2016), can start. Accordingly, biometric measures disentangle from traditional measures in the last two classes. In class 3, the former and latter are meant to explore different nuances of the studied phenomenon. In class 4, the latter are absent and the studies rely solely on the former, likely thanks to previously generated knowledge inside or outside the design domain, for instance by the reverse inference process (Hutzler, Reference Hutzler2014), where a consensus on the relation between physiological measures and cognitive variables has been found.
1) Exploration of links. These experiments are fundamentally exploratory studies in which the existence of correlations between biometric and traditionally extracted variables is investigated. Therefore, the potential and usability of biometric measures for specific scopes of design research is scrutinized by e.g. identifying the (combination of) measures that best describe a phenomenon, which has been contextually analyzed also with traditional methodologies requiring subjective assessments.
2) Confirmation of hypotheses. Based on previous findings (from design or other scientific domains) and/or logical deductions, some hypotheses are formulated that link, among others, biometric and traditionally extracted variables. Thus, these experiments verify whether biometric measures are capable of describing a given phenomenon in an expected way and, in positive cases, the verification of the hypotheses support their usability for extracting design-related information in a reliable way.
3) Additional data. In these experiments, the description of the studied phenomenon benefits from both biometric and traditionally extracted variables, whose relationship is not investigated or questioned. The validity of the former is, therefore, taken for granted along with the way to interpret biometric measures in the specific design context. Anyway, here, biometric measures are not considered appropriate for a full-spectrum investigation of the analyzed phenomena.
4) Alternative. These experiments do not include traditionally extracted variables. In some cases, the analyzed phenomena are studied for the first time with biometric devices, which represent an enabling technology for the treated research areas. In other cases, traditionally extracted measures taken in the past in the same domain are considered unreliable and substituted by biometric ones. Diffusedly, the variation of biometric variables is observed as a result of the manipulation of stimuli. In all these circumstances, the validity of biometric measures is not questioned, and their interpretation considered sufficiently straightforward to use them as a substitute of participants' conscious answers. This consideration allows for reckoning this class of experiments the one featured by the highest maturity attributed to biometric measures.
In light of the above definitions, the classification of the surveyed experiments follows the rationale underpinned by the flowchart depicted in Figure 1. As some experiments included more analyses and could refer to more than one class, the authors included these contributions in the category ascribable to the main objectives and findings of the corresponding manuscripts.
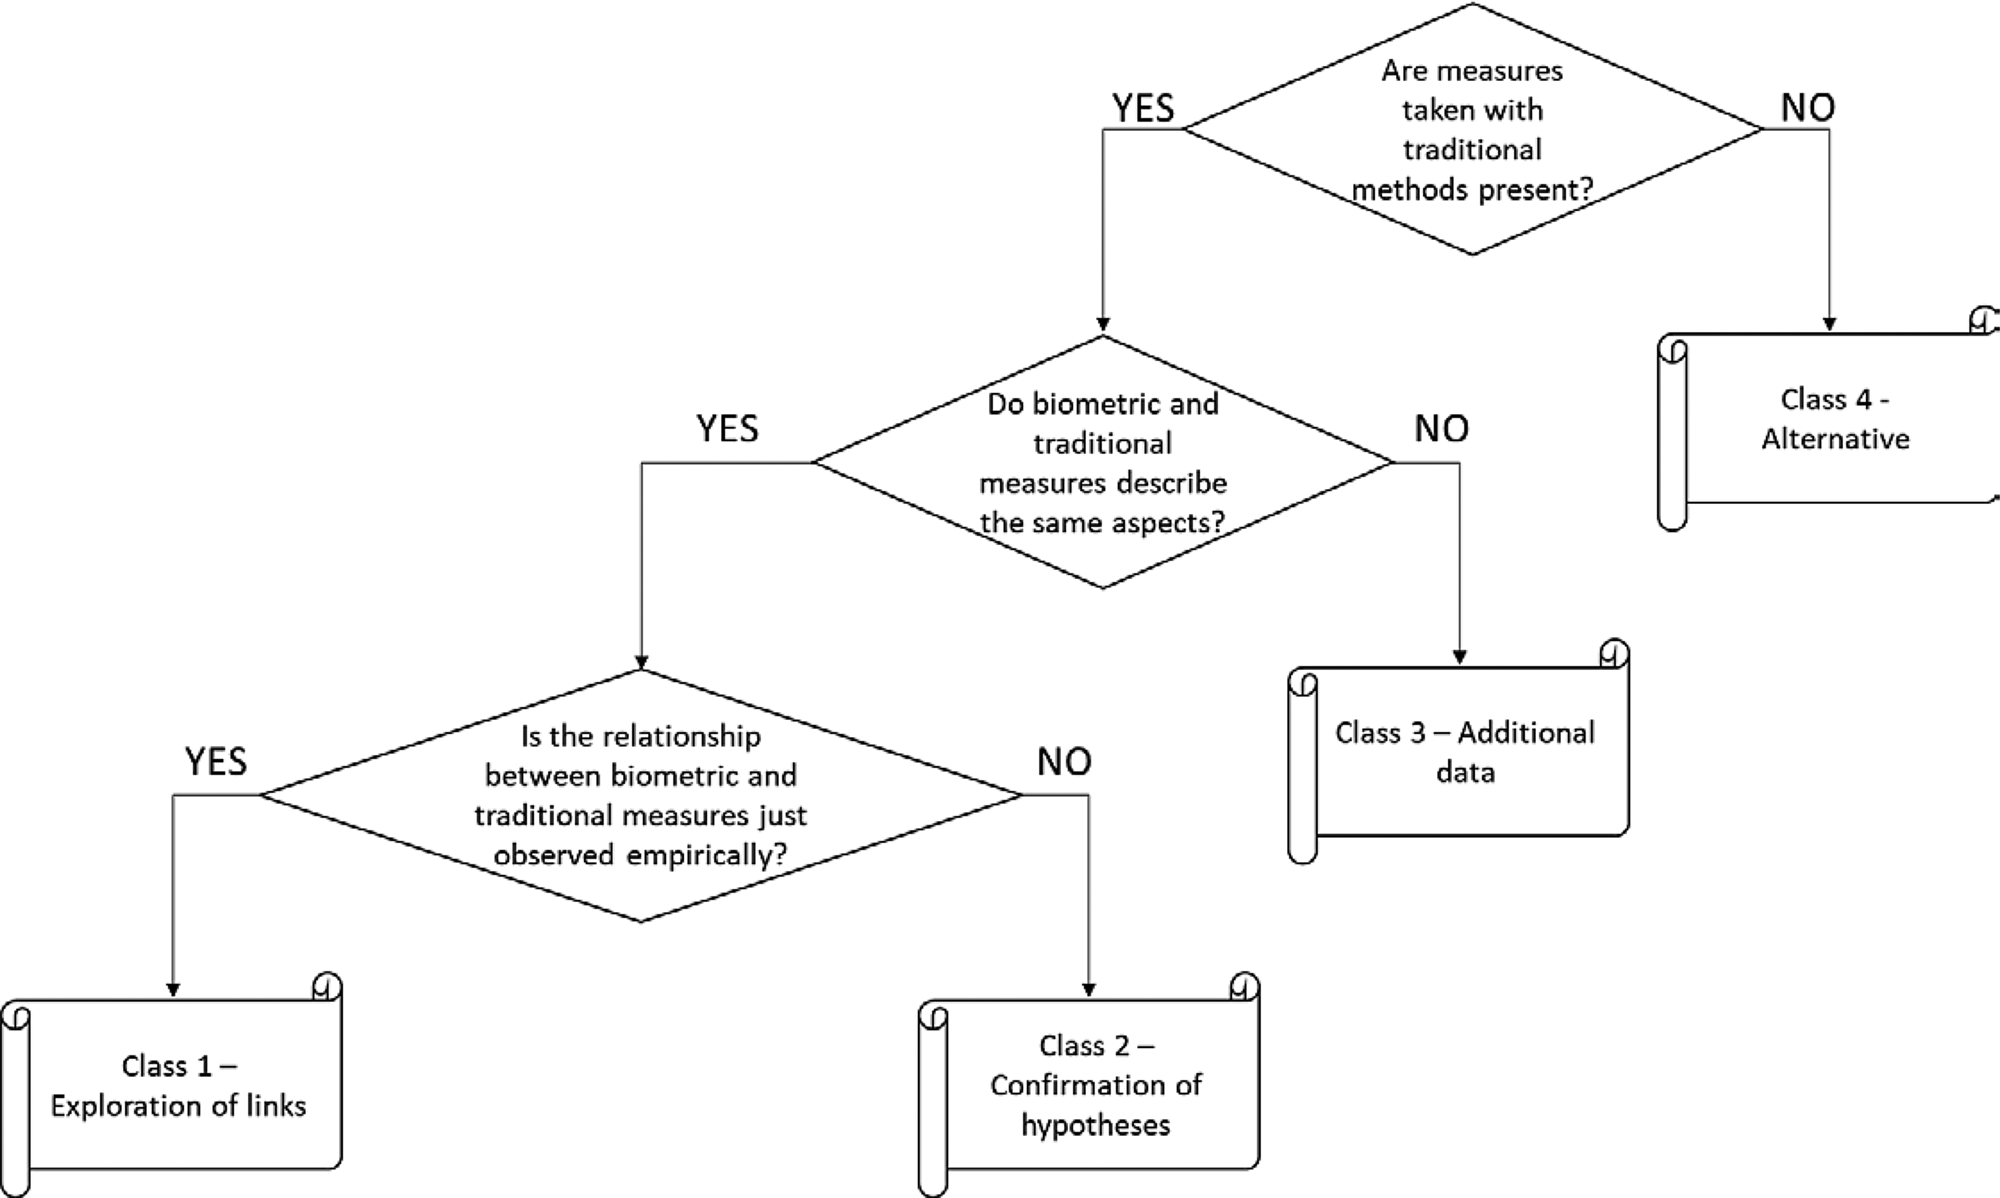
Fig. 1. Criteria to classify the contributions that describe design-related experiments benefitting from biometric measures.
Additional characterizations of the experiments will be introduced in the followings: as this additional classification slightly differs for product evaluation and designer-related contributions, it will be presented in the next two corresponding sections.
Design evaluations using biometric devices
The contributions that are described in detail in the present section include studies that, to different extents, inform designers about the desirable characteristics of products and how representation and supplementary information affects human perception.
Beyond the “kind of experiment” achievable from Table 1, the authors have characterized these contributions further (see Tables 2–5) in order to point out peculiarities that might well imply the complexity, the outreach, and the reliability of the contributions. The “additional dimensions” (as they will be indicated hereinafter) for a more comprehensive characterization of the contributions are listed below.
• Field. It clarifies the design field that is focused on in the experiment, when clarified or inferable from the typologies of illustrated products. The standard categories are Engineering Design, Architecture and Civil Engineering, Packaging Design, Graphics and Fashion Design, Consumer Goods, and Automotive. Although the latter could be included in other classes, it has been separated due to the numerous examples available.
• Number of participants. Undoubtedly, the number of subjects involved in the experiment is a proxy of relevance and reliability, as suggested by Robinson (Reference Robinson, Cash, Stankovic and Štorga2016), among others.
• Stimuli. It stands for the form of presentation of the products, which can clearly affect the experimental results. The standard classes are Physical Products, Photorealistic Pictures or Photos, Text, Virtual Prototypes (including CAD representations), and Drawings and Sketches.
• Illustration. It addresses the logic used for showing the sample of products manipulated in the experiment. The standard categories are single (just a product is shown in the whole experiment), All together (all the products of the sample at the same time), sequence (a series of one product each), and Groups (a sequence in which each step includes more than one product).
• Different elicitation methods. It concerns the traditional methodologies or processes employed for extracting dependent variables, which, in most cases, elicit the conscious answers provided by participants. The standard categories are Questionnaire (multiple questions are present), Preference Indication or choice (actually a much diffused subclass of the former, worth considering independently), Interview, and Think-Aloud method.
• Data Analysis. It indicates the family of statistical techniques used to corroborate the findings. Actually, statistical methods are not used in all the studies, and some of them are qualitative only. In other cases, these are not explicated. The level of sophistication and reliability of employed statistical techniques is plainly a metric of the impact of results (Bettis et al., Reference Bettis, Ethiraj, Gambardella, Helfat and Mitchell2016; Robinson, Reference Robinson, Cash, Stankovic and Štorga2016). The standard categories are Descriptive statistics (e.g., calculations of average values and standard deviations, distributions of data), Correlations, Statistical tests, PCA (Principal Component Analysis), Regression Analysis, ANOVA (Analysis of Variance and the whole family of methods that focus on variability and covariance of data), Neural Networks, and Fuzzy Sets.
Table 2. Characterization of experiments concerning products evaluation and addressing the search for a link between biometric data and variables extracted with traditional methods

Table 3. Characterization of experiments concerning products evaluation in which hypotheses are formulated as for the relationship between biometric data and variables extracted with traditional methods

Table 4. Characterization of experiments concerning products evaluation in which biometric data and variables extracted with traditional methods are extracted to provide a comprehensive description of the studied phenomenon
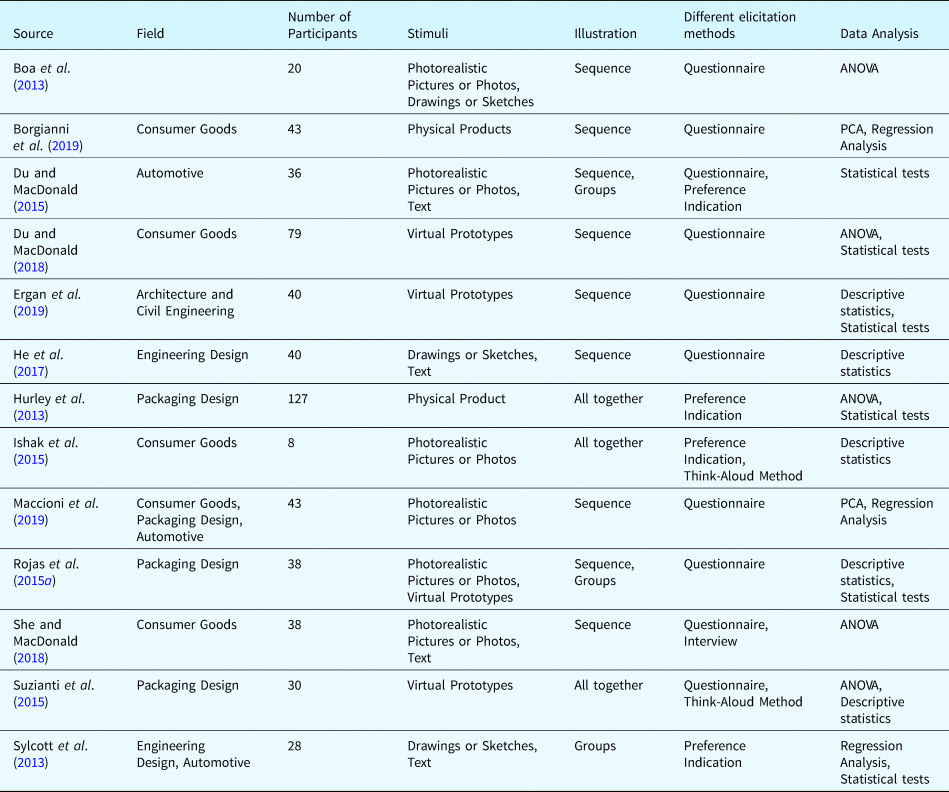
Table 5. Characterization of experiments concerning products evaluation in which biometric data are used, and the outputs of subjective assessments are absent or neglected

Experiments classified as “Exploration of links”
The main objectives of the studies presented in this subsection are specifically ascribable to user experience, emotions, and the effects of different product features and representations, including preferences. Therefore, affective design and emotional engineering and the previous knowledge of products are particularly addressed by the presented contributions, whose characterization in terms of additional dimensions is to be found in Table 1.
Attractiveness and preferences
Within the whole set of explorative studies, a seminal work in the design domain can be considered the one described in Carbon et al. (Reference Carbon, Hutzler and Minge2006). Here, with particular reference to the automotive industry, remote ET is used to study the capability of rated design innovativeness to predict attractiveness and the effects of complexity. In particular, the results show significant differences in the way fixations take place in highly innovative designs, characterized by a balanced exploration of the different areas of the pictures. Innovative features within the shown pictures have a high probability of receiving the first fixation, while complexity presents a significant correlation with pupil dilations. Attractiveness is also a core topic in Laohakangvalvit and Ohkura (Reference Laohakangvalvit and Ohkura2017), which links ET data to kawaiiness, a far-East concept standing for cuteness and charm. The findings show that objects (spoons in this specific case) featured by higher attractiveness rates tend to display larger numbers of fixations with particular reference to those Areas of Interest (AOIs) critical for evaluations and preference formation. The research presented by Li et al. (Reference Li, Wang, Wang and Jing2018) specifically focuses on appearance. The evaluation of this dimension on a number of aircraft seats is correlated with a variety of ET measures. A best-fit mathematical model linking subjective and biometric measures is then created with the support of Neural Networks, that is a computer-supported method that simulates neural responses. Guo et al. (Reference Guo, Li, Hu, Li and Lin2019), who base their study on a series of desk lamps, find links between aesthetic evaluations and measures taken with ET and EEG. The former enable the definition of three sets of lamps grouped according to visual aesthetic levels, which are then compared in terms of the latter. Fixation time ratios, dwell times, and alpha power have a significant direct relationship with high levels of visual aesthetics, while an inverse relationship characterizes gamma power. By using the extracted biometric data, some machine learning classifiers outperform the accuracy of previous studies on products' aesthetics.
The interpretation and possible prediction of preferences is the thrust of several other contributions. In Kukkonen (Reference Kukkonen2005), the number of fixations on individual products emerges as a good predictor for the indication of the preferred mobile telephone, although the same variable failed to explain the rank among different variants. The experiment presented in Nagai et al. (Reference Nagai, Fukami, Kadomatsu and Tera2017) includes ET, questionnaires, and interviews on preferences. It captures the relevance of factors for a buying decision on tea bottles, which are represented in a fashion similar to a supermarket shelf. Through the support of heat maps based on the total length of fixations, the results show that, beyond quality factors, the product display is a very influencing parameter when consumers purchase products.
The use of EEG is also common for studies on product preferences and choice decisions. Some EEG data are found to have high explanatory power for preferences, namely the neural activity measured by a mid-frontal electrode when participants are preliminarily exposed to pictures of products (Telpaz et al., Reference Telpaz, Webb and Levy2015). Similarly, Wang et al. (Reference Wang, Wang, Zhang, Sun, Huang and Zhao2010) observe a significant increase in the EEG power at the alpha and beta frequencies when the participants are looking at the favorite car model among a proposed set. Still with a focus on the frequency of EEG signals, Yilmaz et al. (Reference Yılmaz, Korkmaz, Arslan, Güngör and Asyalı2014) individuate those channels that can be regarded as the most discriminative for like/dislike decisions and consequent elicitation of preferences. Specifically, these include a frontal channel on the left and a temporal channel on the right for low frequencies, as well as a central channel and an occipital channel on the left for high frequencies. With a similar research approach benefitting from the use of EEG, Ueda (Reference Ueda2014) finds increased neural activity in the gamma frequency in the temporal and the prefrontal regions during the illustration of products participants expressed preference for. Khushaba et al. (Reference Khushaba, Wise, Kodagoda, Louviere, Kahn and Townsend2013) highlight a significant modification in the EEG power in the frontal, temporal, and occipital regions during participants' indication of preferences. The study clarifies which frequency bands and electrodes are mostly involved. Interestingly, this experiment uses a remote ET, which, rather than benefitting the study with additional measures, is intended to discriminate what participants were looking at, so that just relevant time intervals are analyzed with the EEG system. Additionally, the design of the experiment includes controlled variations of the products shown (crackers), and the effects of feature changes are assessed with reference to both preference indications and EEG data.
Semantic description and attributes
Product features, attributes, and (semantic) descriptions are focused on in several studies. Adjective-based design is supported by the results provided by Dogan et al. (Reference Dogan, Suzuki and Gunpinar2018), who use vessel hulls in their case study to infer which parts of the product are critical to the designation of specific adjectives. Variations of geometries and characteristics are proposed to participants, who attribute adjectives to each representation. All the presented models are subdivided into AOIs standing for different components, which enables the identification of parts of the hull and the corresponding design parameters to be attributable to the selected adjectives. Lou et al. (Reference Lou, Feng, Tian, Lv, Li and Tan2017) focus on the classification of customer requirements by means of Kano's quality attributes (Kano et al., Reference Kano, Seraku, Takahashi and Tsuji1984) as a means to support conceptual design. These are supposed to give rise to different physio-psychological reactions, which can be, therefore, extrapolated through EEG. After the experiment, a best-fit formula is found that links quality attributes designated with the classical procedure (the Kano evaluation table) with a variety of EEG signals. ET is used in Köhler et al. (Reference Köhler, Falk and Schmitt2015) to identify and rank the AOIs (corresponding to products' components) featured by major observation times, so that they can be linked with overall preferences and intended adherence to product's semantic descriptions. The study elucidates which parts of the studied products (watches in this case) are the most influential in the determination of their appropriateness for a semantic description, thus extending the common outreach of Kansei Engineering (Nagamachi, Reference Nagamachi1995) experiments. Like in other studies, ET also supports the identification of the features deemed as the most critical for the formation of overall preferences.
Emotions
Kansei Engineering is dealt with also in Hsu et al. (Reference Hsu, Fann and Chuang2017). More products are presented as stimuli, observed through a remote ET and characterized with the circumplex model of affect (Russell, Reference Russell1980) articulated on pleasure/arousal and frequently adopted in Kansei Engineering. Variables emerging from the ET are then analyzed to find a relationship with both pleasure and arousal in order to build an alternative method for classification. Among the results, the contribution stresses the link between high levels of pleasure and participants' visual attention, while low levels are characterized by an increased number of fixation points. As aforementioned, emotions are widely studied in the contributions grouped in this subsection, and this takes place beyond paying attention to Kansei Engineering. A sequence of images in the fashion of sketches is the base for the experiment presented in Kim et al. (Reference Kim, Bouchard, Ryu, Omhover and Aoussat2016). Conscious evaluations of the sketches include the self-assessment manikin (Hodes et al., Reference Hodes, Cook and Lang1985), that is an approach to elicit emotions' arousal and valence, the evaluation of images' matching with emotional and semantic terms by means of a Likert scale and a final ranking. The use of a GSR meter during the experiments enables correlations with biometric data, which supports the usability of this device as a substitute for arousal measures. Schmitt et al.’s (Reference Schmitt, Köhler, Durá and Diaz-Pineda2014) goal is to infer rules for emotional product design. Their experiment gathers conscious evaluations about depicted product variants, featured by different components, and corresponding semantic concepts along with data extracted with GSR, EMG, and ET. While ET pursues the objective of individuating what participants look at in specific time intervals, the two biofeedback sensors are meant to recognize emotional states. The statistical analysis reveals the role played by proposed semantic concepts in shifting participants' gaze toward different areas of product representations, which give rise to significant perturbations of GSR and EMG signals attributable to emotional responses. In Ho and Lu (Reference Ho and Lu2014), pictures presenting different products are displayed along with images taken from the International Affective Picture System (IAPS). The latter is leveraged as a standard control. The degree of emotions aroused by products is anyway monitored through subjective assessments too, which, by the way, largely confirmed valence and arousal of IAPS pictures. The whole experiment is supported by a remote ET system, and it reveals that pupil size is effective in identifying products that elicit negative emotions.
User experience
Within studies of user experience, two contributions can be mentioned that aim to assess the degree of user experience, deemed as a dimension of product knowledge and value. The products shown in Guo et al. (Reference Guo, Ding, Liu, Liu and Zhang2016) are first freely observed by participants whose gaze is monitored through ET and then evaluated in terms of perceived experience with the products themselves. The outcomes of the experiment indicate that products marked by a higher degree of experience attract participants' attention faster, and they are looked at longer. Conversely, less familiar products engender larger variations of the pupil diameter. Yang et al. (Reference Yang, An, Chen and Zhu2017) measure product familiarity in different forms (EEG and questionnaires), which are then linked to the effectiveness and speed of recognition of objects shown in two different phases. Variants of consumer goods are shown in the two-stage experiment, which differ in terms of color, material, and shape (these parameters are taken into account too). The link between familiarity and recognition is found, while the pros and cons of the different measuring strategies (brain functions vs. questionnaire) are discussed.
Experiments classified as “Confirmation of hypotheses”
Du and MacDonald (Reference Du and MacDonald2014) formulate eight hypotheses concerning the relationship between product features (rated importance and the effects of size change) and ET variables. Especially with reference to specific ET measures (fixation times and frequency), the results support the positive relationship with the perceived importance of corresponding product features. This is revealed when two different product alternatives are shown simultaneously. In addition, the scholars find that the size of features affects fixations (the larger the size, the more and longer the fixations) and, consequently, attributed importance and preferences. Still, with a focus on product features and representation, Boa et al. (Reference Boa, Ranscombe and Hicks2015) investigate whether the similarity between product couples depends on engagement with product features, which is measured in terms of fixations on the corresponding AOIs. The study, considered as a preliminary attempt in the field of styling decisions, reveals a weak effect between feature engagement and the similarity ratings of product pairs. The experiment described in Aurup and Akgunduz (Reference Aurup and Akgunduz2012) is another example in which product pairs are shown and evaluated. Here, the employed neurophysiological tool is an EEG system, which makes it possible to test the relationship between preference and signal power in the alpha-peak range, namely the 8–12 Hz band. Participants express their preference for products after having been shown standard images from the IAPS, used as a reference as in other papers. The EEG is used throughout the whole experiment. Besides demonstrating the hypothesized above relationship, the scholars individuate, through the EEG and within the studied band, different critical frequencies for right- and left-handed people.
The experiment reported in Burlamaqui and Dong (Reference Burlamaqui and Dong2017) is designed to test the relationship between intended affordances and gaze events also in light of the level of novelty or surprise aroused by products. Despite the formulated hypotheses are discarded, the findings are, however, relevant in the field of user-product interaction, as design elements to be stressed emerge when the design is intended to favor interpretation and usability. The results show that the identification of or the search for the intended affordance of a product leads people to gaze at locations where the function is supposed to take place instead of areas responsible for the interaction with the user (as initially hypothesized).
Table 3 summarizes the contributions included in this subsection and characterizes them in terms of the additional dimensions.
Experiments classified as “Additional data”
Product representation, such as features and attributes, is the main domain of application for the contributions included in this subsection too.
In a number of papers, ET is used to help determine people's reactions to different forms and modalities chosen to illustrate products or designs. He et al. (Reference He, Ji and Gu2017) test the browsing efficiency when parts of assemblies in mechanical drawings are marked by text or digits. By introducing ET in the experiment, the scholars find that the former way of marking drawings is more effective in terms of both enabling the quick individuation of critical parts and enhancing participants' perceived satisfaction. In a very different context, the study presented by Hurley et al. (Reference Hurley, Galvarino, Thackston, Ouzts and Pham2013) deals with the role played by packaging on potential consumers' appreciation for products. In particular, the experiment is concerned with the different degrees to which packaging is transparent or conceals the product that is contained. ET data support evidence offered by traditionally extracted variables in that they confirm preferences toward visible products. Covering packaging gives rise to significantly fewer fixations with a lower total duration. In Boa et al. (Reference Boa, Hicks and Nassehi2013), ET is used to provide additional information related to the link between product representation variants (sketches, renders, and photos) and individuals' preferences, perception and judgement. In the results, significant correlations of the form of representation are found with neither the gazing behavior nor the designation of preferences. The findings from Rojas et al. (Reference Rojas, Contero, Bartomeu and Guixeres2015a) are partially contradicting, as participants' stated perception is affected by renders with medium quality (if compared to photos), while the orientation of the examined products significantly impacts on ET variables. The thrust of the experiment illustrated in Suzianti et al. (Reference Suzianti, Rengkung, Nurtjahyo and Al Rasyid2015) is to study the effect of text, fonts and variations thereof, and color of packaging on product preferences. As for ET results, longer fixations and visitations of areas, assumed to relate to preferences, show the non-negligible role of the examined factors. Text is also dealt with in some experiments conducted by MacDonald and colleagues; however, text is here studied from the content-related point of view and not as graphical characteristic. In Du and MacDonald (Reference Du and MacDonald2015), product descriptions are administered to participants in three different representation forms, namely textual, pictorial, and a combination of the two. Thanks to ET data, it emerges that the model of cancellation-and-focus in comparison processes, namely similarities are initially individuated and quickly ignored, applies just to text-only representations. Non-shared features receive, on average, longer fixation times also when it comes to images, but contextual factors are relevant as well. Text-based sustainability triggers, i.e. descriptions concerning environmental performances, that integrate product pictures are in focus in She and MacDonald (Reference She and MacDonald2018). By means of ET, the experiment reveals that the presence of sustainability triggers significantly increases the number of fixations on sustainable product attributes, while the effect on the percentage of fixations is not significant. Other aspects of the studied phenomenon are analyzed in relation to answers to questionnaires and indication of preferences. The effects of products' sustainability and their perceived value are also studied in Maccioni et al. (Reference Maccioni, Borgianni and Basso2019), who leverage questionnaires, a remote ET and a GSR meter, so as to include conscious and unconscious aspects in the evaluation process. In particular, biometric measures enrich the set of value dimensions attributed to products, which are displayed as pictures. All the measures are combined through a PCA and associated to the existence/lack of eco-design efforts that feature 40 products analyzed by 43 participants. This combination allows revealing that “greener” products give rise to particular interest in light of identifiable creative traits, which is even more remarkable in subjects with a greater sensitivity to environmental issues but can be penalized by conservative approaches that lead to prefer products whose performances are known and taken for granted.
Other contributions regard product features more closely. Tradeoffs between form and function, whose study is supported by fMRI, are the thrust of Sylcott et al. (Reference Sylcott, Cagan and Tabibnia2013). Participants are asked to make choices among product alternatives featuring the variation of form, function, or both. The experiment discloses similarities and differences in the brain networks involved by the mentioned forms of variations. In particular, brain regions linked to emotions are particularly activated when decisions are made in the presence of conflicts between form and function. Ishak et al.’s (Reference Ishak, Sivaji, Tzuaan, Hussein and Bujang2015) contribution complements previous studies on the relevance of culture-related product attributes; to this aim, a traditional Malaysian artifact is here evaluated. Participants in the experiment are people with large experience of said artifact. The use of the ET enables the determination of the parts of the object that are fixated first and for longer times and that are assumed as those mostly contributing to the perception of its effectiveness and usage efficacy. Du and MacDonald (Reference Du and MacDonald2018) study the relationship between specific product features and the perception they provoke. In particular, they manipulate visual cues to change products' geometries completely or for specific parts. The scholars investigate whether these modifications of morphologies affect the perception of products' environmental friendliness, which, purposefully, is not actually measured. The experiment is structured in two parts: an association-building task, where users create their mental association between cues and perceived environmental friendliness, and a testing task. Thanks to a remote ET, the scholars demonstrate how, in the testing task, the participants fixate on critical cues for their evaluations longer than in the association-building task. This contributes to demonstrating the capability of cues and specific morphologies to subliminally change the perception of attributes that cannot be actually assessed by participants, such as environmental friendliness.
Features that are intentionally more visible than in previous cases and new technologies characterize two recent contributions. Borgianni et al. (Reference Borgianni, Maccioni and Basso2019) investigate the effect of substituting commercial products with 3D-printed replicas of mid-low quality. Original and 3D-printed objects are evaluated subjectively through a specific questionnaire by 43 participants, who wear ET glasses. Participants' answers and ET measures are combined with a PCA, which, besides, reveals a weak relationship between the two sources of data. The experiment demonstrates that 3D-printed objects attract more curiosity; their level of attractiveness is unsurprisingly significantly lower than that of original products, but this is not proportional to the perceived gap in terms of fitness to scope. In a very different field, Ergan et al. (Reference Ergan, Radwan, Zou, Tseng and Han2019) use self-reports and multiple biometric measures (EEG, GSR, and HRV) to assess the effects of architectural design changes in built environments reconstructed with Virtual Reality technologies. Tested environments are characterized by the presence of supposedly relaxing and stressful characteristics. The former, according to results, give rise to enhanced oscillations in theta, alpha, and beta bands for many EEG channels, while the latter are featured by increased HRV.
The characterization of the presented contributions in terms of the additional dimensions is available in Table 4.
Experiments classified as “Alternative”
The contributions grouped in this subsection do not include elicitation of subjective assessments, or these are used to urge participants to carry out some tasks and are not considered in the subsequent analysis. In many cases, the effects of different stimuli on biometric measurements are studied to infer conclusions.
The contributions of the group are organized in the following paragraphs, featured by the topic of the investigation. The further characterization of the illustrated contributions by means of additional dimensions is found in Table 5.
Observation patterns and their relationship with aesthetic concepts
Koivunen et al. (Reference Koivunen, Kukkonen, Lahtinen, Rantala and Sharmin2004) illustrate a seminal work in the context of product observation supported by ET. People's observation patterns are indeed analyzed, and three different observation styles are inferred, namely narrow, holistic, and combined strategies. It is suggested that these strategies, to be confirmed with further research, should be taken into account in studies of product design and evaluation. Park et al. (Reference Park, DeLong and Woods2012) use ET to study the visual behavior of participants with different training levels – in general, fashion designers are considered more experienced in product visualization than other individuals are. The scope is to provide a major understanding about ways to train the aesthetic visualization, which, according to results, does not take place with the repetitive illustration of the same image. The outcomes also show that more trained viewers tend to gaze longer and have a higher frequency of fixations over the presented products. As well, they demonstrate to be more sensitive to design changes, as revealed by the time required to scan the image. Still, in the field of fashion design, EEG and ET data are used as proxies for quantifying the evaluation factors related to product appearance (Li et al., Reference Li, Wang and Wang2017). Here, the authors address the need to take biometric measures due to the unreliability of subjective evaluations, in particular with respect to beauty. The concept of beauty is particularly focused on also in Khalighy et al. (Reference Khalighy, Green, Scheepers and Whittet2015). A two-stage experiment is conducted with a different sample of participants. First, based on the results of people's exposition to images with known beauty, a new formula is devised that is capable of assessing beauty as a function of various ET measures, markedly number, duration, and coordinates of eye fixations. Then, the validity of the formula is validated with a test, in which participants express a preference to products while being monitored with ET.
User experience and user-product interaction
Some qualitative studies include the use of ET for studying user-product interaction. In Mussgnug et al. (Reference Mussgnug, Lohmeyer and Meboldt2014), it is shown that mobile ET makes it possible to reveal previously hidden aspects of user experience. Design students learn to analyze ET outputs (videos in particular) to evaluate usability aspects and identify both explicit and implicit user needs. The study of user experience is enhanced in Mussgnug et al. (Reference Mussgnug, Singer, Lohmeyer and Meboldt2017), where recordings of ET glasses, combined with the monitoring of hand gestures, are used to detect cognitively demanding actions and operations. To the scope, the scholars hypothesize that cognitive demanding handling interactions are represented by long periods of constant hand–gaze distance, as, in these phases, the hand and the gaze are involved in the same action. The combination of ET with the monitoring of hand movements is to be found in Yang et al. (Reference Yang, He, Wu, Tang, Chen and Liang2016) too. The work aims to provide a major understanding of user intent when interacting with products or representations thereof. To the scope, gaze data including fixations and visitations of AOIs are here interpreted as proxies of attraction, attention, and popularity.
Product features and semantic priming
In the experiment presented by Rojas et al. (Reference Rojas, Contero, Camba, Castellanos, García-González and Gil-Macián2015b), participants are monitored with EEG and remote ET while they are exposed to adjectives (a set of positive and negative ones is proposed) and pictures of alternative packages for cold cuts. They are subsequently asked about the consistency of adjectives and pictures with a yes/no option. Data extracted from the EEG are elaborated, and the link between the obtained variables and adjectives is investigated. This reveals that the valence (positive vs. negative) of the semantic priming featured by adjectives is statistically correlated with some of these EEG variables (details are to be found in Table 1). ET data are instead focused on during the presentation of the pictures and are meant to study the change in observed AOIs based on the semantic priming. Seshadri et al. (Reference Seshadri, Bi, Bhatia, Simons, Hartley and Reid2016) study how different tasks within the observation of car photos affect ET data. In particular, the numbers of fixations on different perspective representations of the cars (front, side, and rear) are investigated. The results show that different representations attract the most attention according to the tasks, which include, for the car models, general appreciation, identification of the brand, and evaluation of the correspondence to adjectives used as semantic primes. The paper authored by Hyun et al. (Reference Hyun, Lee and Kim2017) uses the duration of fixations on AOIs to infer participants' looking probability of design elements of 119 car models from 23 different brands. The scope is to link this data with the design similarity of car brands, which have been previously estimated based on typical and novel design elements. During the experiment, the car brand familiarity and brand's design recognition are also assessed through questionnaires; these outputs are used as control variables. The results show correlations of looking probabilities of specific car elements ensuing from ET with both design similarities and the recognition of the brand. The contribution is, therefore, able to discern which design elements are the most relevant to recognize car brands and to characterize them according to their market segment. Eventually, a study on warnings displayed on packaging is presented in Kovačević et al. (Reference Kovačević, Brozović and Možina2018). Here, a remote ET measures the time to first fixations on warnings as a metric of their noticeability, revealing significant effects brought about by increasing dimensions of the warnings.
Studies of design processes and designers' cognition with biometric devices
Despite the shared use of biometric measures and the relevance of design, the contributions included in the present section largely differ from those focused on the evaluation of products. The shift of attention from products to design processes and cognition, which accompanies the shift from evaluators to designers, results in a change in conditions and methods that are focused on, and, diffusedly, in approaches to conduct the studies. This is reflected in the additional dimensions considered relevant to the experiments described in the present section. Indeed, some of the additional dimensions to characterize the contributions found in the previous section are invalid, and a new list has been created. The unchanged dimensions and articulations thereof are Number of participants and Data Analysis. New or modified dimensions are added as in the followings.
• Background of designers. It indicates the specific group of designers that are involved in the experiment and if different levels of expertise are critical to the study. Designers are distinguished into Expert Designers, Novice Designers, Engineering Students, Graduate Students from Architecture schools, Graduate Students from Engineering schools. When relevant, other indications are included.
• Task. It indicates which specific tasks the designers have to perform during the experiment. They include ideation (which comprises open-ended and creative tasks), Problem-Solving (well-defined), Problem-Solving (ill-defined), Decision-making, Sketching or manually drawing, Observing (and evaluating) technical drawings, Using CAD (and/or other computer-aided systems relevant to design), Non design-related tasks (e.g., tests to infer designers' cognition in certain circumstances).
• Stimulated task. It indicates (Yes/No) if the task to be performed is perturbed by stimuli or external interventions, at least for a subset of participants. This perturbation is often the focus of the study.
• Different Elicitation Methods. As aforementioned, this field also appears in product evaluation experiments, but the leveraged methods differ substantially here. The categories are Assessing task performances (normally carried out by external judges, for instance with respect to creativity metrics), Questionnaire, Interview (including more non-structured information elicitation methods, such as reports), Video Analysis (also used as a support for segmenting design tasks), Think-Aloud Method.
The characterization of the papers based on these additional dimensions is to be found in Tables 6–9, still distinguished according to the kind of experiment.
Table 6. Characterization of experiments concerning design processes or designers' cognition, and addressing the search for a link between biometric data and variables extracted with traditional methods

Table 7. Characterization of experiments concerning design processes or designers' cognition, in which hypotheses are formulated as for the relationship between biometric data and variables extracted with traditional methods

Table 8. Characterization of experiments concerning design processes or designers' cognition, in which biometric data and variables extracted with traditional methods are extracted to provide a comprehensive description of the studied phenomenon
Table 9. Characterization of experiments concerning design processes or designers' cognition, in which biometric data are used and the outputs of subjective assessments are absent or neglected

Experiments classified as “Exploration of links”
Petkar et al. (Reference Petkar, Dande, Yadav, Zeng and Nguyen2009) present a seminal and preliminary work to evaluate mental workload in designers by means of ET and EEG. The scholars benefit from an established psychological test, the Stroop test (Stroop, Reference Stroop1935), to set baseline levels of mental stress for each designer. The performances in the test and biometric data are then linked. The outcomes show (a) positive and strong correlations between performance and blinking frequency and duration; (b) an opening up (down) parabolic pattern that links the mean pupil diameter (blinking frequency) and the workload of the task; and (c) the signal power revealed by the EEG in the alpha, beta, and theta bands tends to increase for many brain regions with the difficulty of the tasks and their corresponding workload up to a saturation point. Mental stress is also studied in the two experiments that follow. In Nguyen and Zeng (Reference Nguyen and Zeng2017), data from GSR and EEG are compared with designers' subjective evaluations made by means of the NASA Task Load Index (Hart and Staveland, Reference Hart and Staveland1988). GSR and EEG measures are meant as proxies of mental stress and effort, respectively, and taken during a multi-stage design task. The most evident association that emerges is the one between self-rated mental effort and the power of the EEG beta-2 frequency band (20–30 Hz). Distinct formulations of design problems are investigated in Liu et al. (Reference Liu, Li, Xiong, Cao and Yuan2018). Here, EEG is used during participants' approaching open-ended, decision-making, and constrained design statements. The former are found to impact on temporal and occipital brain regions in the alpha frequency band, whereas constrained tasks result in the highest mental workload while heightening the activation of centroparietal and parietooccipital regions. Evaluations of design outcomes, assessed in terms of creativity metrics, reveal that high levels of novelty are significantly associated to the activation of the frontal, frontocentral, and occipital regions while being unsurprisingly found for open-ended tasks.
Conversely, emotions are a core topic in Liu et al. (Reference Liu, Ritchie, Lim, Kosmadoudi, Sivanathan and Sung2014). Here, multiple signals (EEG, GSR, and ECG) are acquired while engineering designers interact with a CAD system. The combination of these signals is interpreted in terms of key emotions, while different CAD tasks are distinguished based on the log of the CAD system. The emotions resulting from the neurophysiological devices are then checked with the designers participating in the experiment who, in a first version of the experimental design, express their agreement or disagreement with the outcomes and, then, rate their emotions with a questionnaire. In both cases, a substantial agreement between measures and subjective evaluations is found. The concept is extended in Sivanathan et al. (Reference Sivanathan, Lim, Ritchie, Sung, Kosmadoudi and Liu2015), in which a ubiquitous system is presented for acquiring metadata during the use of a CAD system. Despite many biometric tools are here included, the focus of the manuscript is neither on designers nor on the design process and, as such, will be not considered in further analyses.
Experiments classified as “Confirmation of hypotheses”
Bi et al. (Reference Bi, Shergadwala, Reid and Panchal2015) present an experiment with designers to infer their weighing of different information stimuli. The participants are asked to solve algebraic problems supported by graphical and analytical information, whose attention toward is monitored through an ET system. The results show that the designers with a stronger graphical orientation have a better solution quality. Differently from the above experiment, Nguyen et al. (Reference Nguyen, Nguyen and Zeng2015) leverage design tasks. The latter are characterized by different length and degrees of hardness, which is subjectively assessed by the participants. The hypothesis, confirmed by the results, concerns the verification of the capability of EEG data to predict the perceived hardness. More specifically, the scholars introduce in design studies a new measure, namely the transient microstate percentage, borrowed from research in neurological diseases. The measure takes into consideration the directional rapid variations of the scalp field from one quasi-stable configuration to the next one.
Experiments classified as “Additional data”
Experience, use of stimuli and leveraging of analogies
A number of contributions belonging to this category regard the evaluation of performances of designers with diverse levels of experience. Sun et al. (Reference Sun, Xiang, Chai, Wang and Liu2013) test the effect of introducing text in stimuli for idea generation among novices and experts, while their EEG was registered. Some participants receive a text as an input, while the others belong to the control groups. Outcomes are evaluated in terms of both the EEG activation and the creativity evaluation of generated ideas. Experts show similar thinking patterns and this result in higher-quality ideas. In terms of activation patterns, novices exhibit greater differences when the text was provided, especially in the right hemisphere of the brain. In Hu and Reid (Reference Hu and Reid2018), the mutual relationships are investigated between distraction, use of working memory, contextual experience and design outcomes assessed in terms of quantity, quality and novelty. The low levels of cortical arousal detected by EEG feature here the taking place of distraction or defocused attention. The EEG headset and the corresponding software application used in the experiments are claimed to be able to assess working memory. The scholars demonstrate that the designers' level of distraction is inversely related to contextual experience, while no significant correlation was found between working memory and contextual experience. The latter is negatively correlated with mental states ascribable to creative endeavors beyond novelty of ideas. A different neurophysiological tool for brain monitoring is used in Shealy et al. (Reference Shealy, Grohs, Hu, Maczka and Panneton2017), namely fNIRS. The contribution studies the mental processes of freshmen and senior engineering students while designing. The findings show that freshmen require a much greater cognitive activation to generate solutions, as revealed by their degree of activation in the dorsolateral prefrontal cortex. Likewise, significant differences are also found in terms of traditional creativity metrics, especially the quantity of solutions.
Cao et al. (Reference Cao, Xiong, Li, Liu and Wang2018) deal with idea generation and analogical distance, i.e. the degree of unrelatedness between two or more concepts. Here, the investigated subjects are beginning and advanced students, who are involved in a design task and are contextually monitored with an ET system. The tasks undergo a subsequent evaluation and retrospective interviews are conducted to find relationships between the analogical distance of stimuli from the context of the design task, expertise, design fixation, and ET measures. The results show beginners' inclination to gaze at far-distant stimuli, although these are not treasured in the proposed solutions, and to have larger numbers of saccades between stimuli characterized by a different analogical distance. The percentage of fixations across stimuli with different analogical distances fails to characterize students' experience. The concept of analogical distance is focused on in Goucher-Lambert et al. (Reference Goucher-Lambert, Moss and Cagan2018) too. This experiment includes the use of an fMRI scanner, in which a series of open-ended design tasks are performed by participants. Three different conditions are explored, namely the absence of stimuli, the provision of near and far stimuli. fMRI activations unveil two dissociable brain networks recruited during stimulated and non-stimulated design tasks, respectively; the former is featured by the activation of several temporal brain regions.
Use, function, and representation of technical systems
The experiments presented in this subsection deal primarily with the development of design and engineering skills for students. In these contributions authored by a research group at the Swiss Federal Institute of Technology in Zurich, the use of ET glasses, in conjunction with other or alternative methodologies, enables the evaluation of tasks and the recognition of human activities beyond the provision of classical measures, such as saccades and fixations.
Lohmeyer and Meboldt (Reference Lohmeyer and Meboldt2015) involve engineers in their experiment and ask them to try to understand a sectional representation of a mechanical assembly. The analysis of ET data, supported by audio and the outcomes of the task, leads to the definition of participants' behaviors in terms of skimming and scrutinizing sequences. The former are featured by short fixations and long saccades aimed to gain an overall grasp of the system. The latter includes long fixations and short saccades targeting the understanding of detail aspects. In Hess et al. (Reference Hess, Lohmeyer and Meboldt2017), mechanical engineering students are asked to disassemble a technical system, describe it, and infer its function. ET allows the scholars to individuate the components resulting critical for the correct explanation of the functioning of the assembly. The results show that low performers followed an observation pattern substantially differing from the flow line of force characterizing the system. The core objective of the study presented by Mussgnug et al. (Reference Mussgnug, Waldern and Meboldt2015) is to assess the usefulness of ET videos for the scope of understanding user-product interaction. The operation of an individual using a new fastening tool for the first time was recorded with both ET glasses and a video camera, which provide a first- and third-person perspective, respectively. Videos are then analyzed by engineering students, who are able to reveal a greater number of usability issues when ET recordings are made available.
Experiments classified as “Alternative”
Designers' cognition, mental states and brain activation in design tasks
In this subsection, a number of works are presented that deal with cognitive activities of designers in distinct tasks and conditions. The latter are identified based on the design of the experiment (distinct tasks or different formulations thereof) or in virtue of the use of specific instruments or methods, mainly videos. As achievable from the text and the references, a predominant number of contributions stem from a research group at the Concordia University, which has authored, by the way, articles described in previous subsections concerning the study of designers and design processes.
The contribution provided by Alexiou et al. (Reference Alexiou, Zamenopoulos, Johnson and Gilbert2009) can be considered as the starting point for the study of design neurological basis. In their experiment, the scholars leverage closed- and open-ended problems assigned to designers, who are monitored by means of an fMRI scanner. Particular differences are found between the initial part of the tasks, in which instructions are given and referred to as study phase, and the actual execution of tasks, performance phases. The study phase shows significantly enhanced activation in brain areas associated with the coordination of the movement, touch, and the integration of sensory perception. In contrast, the performance phase results in heightened activation in brain areas associated with high-level cognitive processing, visualization, and language. Convergent and divergent design phases are focused on also in Steinert and Jablokow (Reference Steinert and Jablokow2013), which presents a proof of concept and a pilot experiment to link design activities, designers' psychological mindsets, and physiological measures from EEG and ECG. The preliminary results support the possibility to discern convergent and divergent activities by means of physiological data. With a similar approach, the capability of distinguishing design activities and their characteristics by means of neurophysiological measures (and markedly EEG) is challenged in order to find alternatives to time-consuming protocol analyses by Nguyen and colleagues. A first attempt is discussed in Nguyen and Zeng (Reference Nguyen and Zeng2010), where distinct activation networks are found for different design segments, namely problem analysis, solution evaluation, solution generation, and solution expression. The attention is shifted to the differences between creative and non-creative tasks in Nguyen and Zeng (Reference Nguyen and Zeng2014a). The experiment reveals that activation in the beta range is higher for creative stages, which are contextually associated with a major commitment of the designer. Liu et al. (Reference Liu, Nguyen, Zeng and Hamza2016) associate EEG bands and design activities benefitting from Principal Component Analysis for data reduction. The findings show a specific band, namely alpha, is highly correlated with the designer's resting in contrast to high-frequency bands associated with more active design segments. This stream of studies has so far reached maturation in Nguyen et al. (Reference Nguyen, Nguyen and Zeng2019), in which EEG-based algorithms are tested against manual segmentation of design activities. The most effective algorithm in terms of predicting design segments, based on microstate transitions already discussed in Nguyen et al. (Reference Nguyen, Nguyen and Zeng2015), is almost indistinguishable than manual segmentation if specific statistical tools are used. However, because of the identification of different cognitive structures, algorithmic segmentation cannot be considered as a replacement for manual segmentation hitherto. Overall, the results support the utility of combining EEG and traditional protocols, which is claimed to provide additional information as for corresponding cognitive states during design segments, beyond reducing the need for time-consuming activities.
A further area of research is concerned with designers' mental states. After having verified that HRV is a good proxy of mental stress by means of a reviewed Stroop test, Nguyen et al. (Reference Nguyen, Xu and Zeng2013) equip with an ECG system a number of participants asked to perform some conceptual design tasks. According to the experiment outcomes, the monitored design activities are not correlated with levels of mental stress. The study is then extended to correlate the ECG-measured mental stress and EEG-measured mental effort in Nguyen and Zeng (Reference Nguyen and Zeng2014b). In light of the outcomes, designers predominantly experience low- or medium-stress levels during the proposed conceptual design activities. The same levels feature higher mental effort if compared to high-stress conditions. Still with reference to conceptual design, Nguyen et al. (Reference Nguyen, Nguyen and Zeng2018) use EEG to assess effort, fatigue, and concentration. Such an assessment is enabled by the results of previous scholars' studies and markedly (Nguyen et al., Reference Nguyen, Nguyen and Zeng2015). Based on the outcomes of the experiment, “high levels of effort occur mostly at the beginning and at the end of the design process”, while some nuances of fatigue have a negative correlation with this pattern. High levels of concentration, specifically featured by the Beta power in channel FP1, are particularly observed when designers delete their previously created designs to propose new ones.
Focus on methods relevant to design
In Ruckpaul et al. (Reference Ruckpaul, Fürstenhöfer and Matthiesen2014), two different think-aloud methods, that is concurrent and retrospective, are analyzed for the evaluation of a drawing of a technical system – actually, participants are asked to judge if the system works correctly. The findings show that the two methods, while performing differently in terms of the extracted content of the verbalization, do not show significant variations in terms of ET measures.
Alternative ideation methods are dealt with by Shealy et al. (Reference Shealy, Hu and Gero2018), whose experiment is supported by the use of an fNIRS helmet, which measures blood oxygenation in the prefrontal cortex. Participants face a design task without methodological support (individual brainstorming), using morphological analysis and TRIZ; the three conditions are clearly featured by different levels of methods' structuredness. Particular differences among the three are found in terms of cortical activation and markedly in the regions associated with spatial working memory, cognitive flexibility, and abstract reasoning. More in detail, a high level of oxygenation in said areas is observed in brainstorming activities at the beginning of the design task, but this process is not sustained; this aspect represents a clear difference with respect to morphological analysis and TRIZ. These two methods, and more remarkably TRIZ, are also featured by a higher density of coordination among brain regions, which the scholars tend to associate with a more considerable cognitive effort. The difference between morphological analysis and TRIZ is identified in the fact that the former gives rise to substantial activation in the left hemisphere and the latter in both the left and middle hemispheres.
Effects of stimuli and information
Peculiar aspects of the design process are under the lens in this subsection. With the support of an ET system, Boa and Hicks (Reference Boa and Hicks2016) monitor the variation of the ratio between saccades' amplitudes and fixations' length when engineers are administered with iconic or symbolic information. Low and high ratios are interpreted as focal and ambient styles, respectively. For instance, it is found that the prevailing style differs according to the kind of information when participants are in the process of finding such information. In contrast, the phase of familiarizing with information is featured by an ambient style in all the circumstances. Overall, the preliminary results suggest that the proposed ratio proves to be a good candidate to discriminate the different phases experienced by designers dealing with information. Pictorial representations are treated in Liang et al. (Reference Liang, Lin, Yao, Chang, Liu and Chen2017) too. Here, the provided stimuli are in the form of different artists' works, featured by specific styles. Participants are asked to indicate a design project after exposure while being monitored by EEG. While the diverse works and styles are not discriminant for brain activation, different phases of the experiment are responsible for significant differences. In particular, designers' engagement in visual attention (association) is linked to the activation of the frontoparietal (prefrontal, frontocentral, and parietooccipital) region(s). In a subsequent study (Liang et al., Reference Liang, Chang and Liu2018), the procedure is somehow reversed, as, first, an ongoing project is described by the designer and, then, a matching of that project with an artwork (to be selected) is carried out – the employment of an EEG headset stays unchanged. The objective is the study of conceptual imagination, which leads to unveil how, for designers involved in web-supported activities, this phenomenon leads to notable brain activations in the prefrontal and temporal brain regions. Differences are particularly evident in the theta and alpha bands in the prefrontal regions between novice and expert designers, where the latter show overall higher spectral power. The comparison between different groups of individuals is at the core of the experiments presented in the next paragraph too.
Comparison of designers with different backgrounds and experience
With reference to the analysis of technical drawings and verbalization processes, Ruckpaul et al. (Reference Ruckpaul, Nelius and Matthiesen2015) highlight the differences between novice and expert engineering designers with the support of a remote ET. Here, it is assumed that short fixations feature the identification of mechanical components, while they are analyzed when long fixations take place. The results show that expert engineers carry out more in-depth analyses of technical systems with greater attention on the context and the system embodiment, while novices exhibit problems in describing the way parts interact and contribute to the whole system, although these parts are correctly characterized. A different kind of drawings, that is architectural drawings, is analyzed in Colaço and Acartürk (Reference Colaço, Acartürk and Gero2018). Architects and people with a different background, monitored by a remote ET, are asked to interpret and evaluate couples of projects, which are shown by means of multiple representations. A particular difference between the two groups is found as non-architects exhibit longer fixations, longer total gaze times and more shifts between AOIs, which is interpreted as an inordinate behavior.
Eventually, the scope of the experiment presented in Majdic et al. (Reference Majdic, Cowan, Girdner, Opoku, Pierrakos and Barrella2017) is to map the cognitive load in design processes and identify the main traits that distinguish novice and advanced engineering students. The study, conducted by means of EEG, reveals that differences between the two groups of participants do not hold statistical significance, although, on average, less experienced students unsurprisingly display higher cognitive load.
Elaboration of gathered information and discussions
Intensity of research
The construction of the sample makes it possible to infer the intensity of the research conducted so far and some trends. In particular, all the contributions have been characterized by their publication year to obtain the diagrams that follow. It is worth noting that the data about the last few years (especially 2018) might be incomplete, while 2019 was not considered at all. Figure 2 shows the number of analyzed contributions per year and distinguishes experiments focused on evaluators and designers (lines featuring the stacked areas in the background), along with the four main classes in which experiments have been classified (histograms, see the legend). As mentioned, recent years are characterized by a growing number of presented design experiments with biometric measurements with the sole exception of the year 2016. In particular, it is possible to infer qualitatively that the number of experiments that make reference to subjective evaluations (red and orange columns in Fig. 2) is being overtaken by those (yellow and green columns) for which the confidence in the use of biometric devices is supposedly higher, that is “Additional data” and “Alternative”.
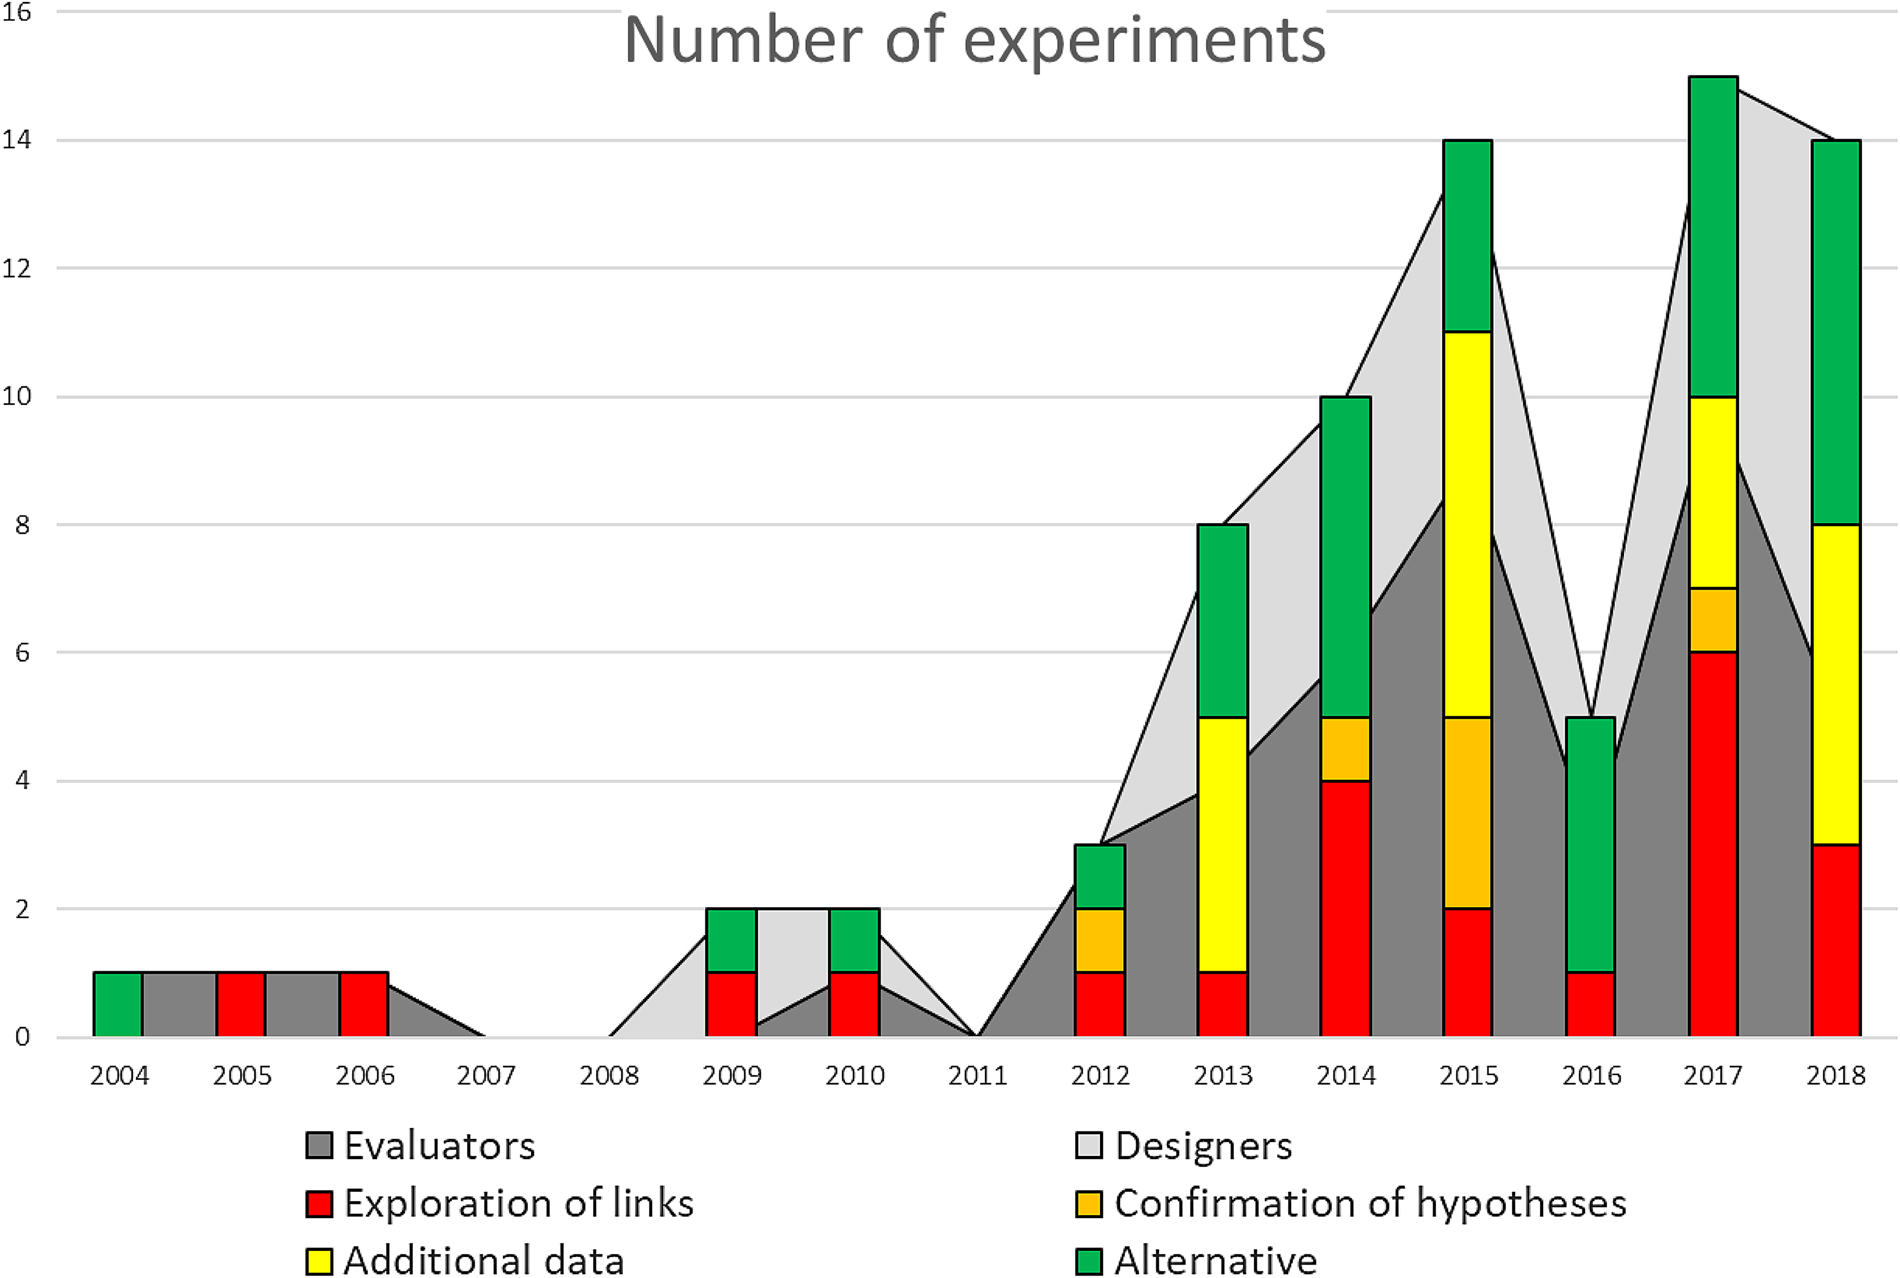
Fig. 2. Number of analyzed design experiments with biometric measurements, distinguished by year, subjects involved (evaluators or designers) and class (main four classes, as of the reported legend).
Subsequently, cumulative numbers of contributions have been used to build logistic curves through the online application Loglet Lab 4. Like in other studies, e.g. Borgianni et al. (Reference Borgianni, Cascini and Rotini2018), the S-shaped pattern of growth can be considered indicative of the future intensity of research. Figure 3 shows the curves corresponding to evaluators and designers – it is interesting to notice that the latter will be expectedly investigated more intensively in the coming years as opposed to the last few years. Based on trajectories, studies on designers are currently in the middle of a consistent growth phase, while experiments with evaluators might undergo a reduced research intensity in the near future.

Fig. 3. Cumulative number of design experiments with biometric measurements and corresponding best-fit logistic curves for evaluators and designers.
Comparative use of biometric data
As aforementioned, Table 1 includes the specific measures, variables, or outcomes that are leveraged in the reviewed experiments. These are presented in a synthesized form and the explanation of the experiments' context (to be found in the previous two sections) is necessary for interpreting them correctly.
In particular, with regard to Table 1:
• The fifth column indicates the measure or measures associated with the biometric device (fourth column) that are benefitted from in the corresponding experiment. In some cases, the extracted measures are not directly used, and these are substituted by procedures, algorithms, methods, software elaborations, graphs, or qualitative observations. It is worth noting that a common name has been attributed to these measures when clearly identical or very similar (e.g., “number of fixations” and “fixation count”) and, therefore, the reported terms might not be found in the text of the corresponding source.
• The sixth column reports, where relevant and available, excerpts from the sources that document how variables have been calculated or specific measurement conditions. In a few cases, the authors have added some words (in italics) for clarification purposes. It is worth noting that acronyms presented in the fifth and sixth columns apply to the corresponding sources only and are not generalizable.
• The seventh column indicates the variables relevant to the design domain that are more closely matched with the biometric data. Those include both stimuli and terms extracted with non-biometric measurements, markedly subjective evaluations. Remarks in brackets briefly recall the contextual conditions for these variables. In the cases these variables are categorical, e.g. designers' background, these have been expressed in terms of biometric data's capability of distinguishing, predicting, featuring, or interpreting different categories. Some variables have been excluded from the list because of being considered too specific for the source's domain of investigation and, therefore, poorly exploitable in future studies and comparable with other research experiments.
• The eighth column indicates, for continuous and discrete variables present in the seventh column, whether the relationship between biometric and design-related variables is inverse. These cases are checked with the letter X.
• The ninth column expresses the kind of relationship that takes place between biometric data and design-related variables. This can be “Observed”, if it results from a broad and non-focused investigation; “Proven” (“Not Proven”), when the relationship is hypothesized and (not) demonstrated; “Assumed”, if the relationship is taken for granted and the experiment's results are discussed based on this assumption.
Table 1 shows that research is very fragmented in terms of the specific use of biometric measures and their corresponding interpretation or search for interpretations. Despite the attempt of making the names of extracted variables as uniform as possible, a large variety of different parameters is still present. The way those measures are used and manipulated substantially depends on the object of studies and experimental conditions. It is possible, however, to find some commonalities in the origin of variables and in the rationale behind their use.
• In EEG, fMRI, fNIRS, the activation of different channels or brain areas diffusedly features phenomena ascribable to stress, workload, effort, difficulty, and fatigue. In some experiments, aesthetics and preferences are juxtaposed to EEG signals; as for the latter, conflicts emerge in terms of the EEG variables describing the phenomenon in the best way. Other EEG indexes are put into relationship with attention, although this phenomenon is predominantly studied by means of ET in the design domain. Still, especially by means of EEG, it is possible to capture and distinguish peculiar behaviors that characterize people with different design experience. Specific signals recorded in different channels are also referable to distinct design activities, analysis tasks, or the use of peculiar design methods. Some indexes extracted from the analysis of spectral power have been associated with different emotions. The transformation of neurologic measures through specific algorithms has been conducted to study cognitive processes and psychological states more in details, beyond phenomena ascribable to preferences and choices.
• As for ET tools, variables associated with fixations (e.g., duration, number, frequency, percentage) are the most diffused. Fixations are often ascribed to people's attention and engagement, and design features' importance, attractiveness, impression, and novelty. As a result, fixations are proxies of preferences and/or efforts to extract relevant information for evaluation purposes. Attention, interest and cognitive activities are often investigated by analyzing variations in the pupil diameter, while saccades are linked to explorative behaviors. Exploration strategies are often supported by quantitative or qualitative analyses of AOIs and ET graphs; those strategies can lead to distinguish people's experience and background. The analysis of eye blinks is not diffused.
• When it comes to bio-feedback sensors, GSR and HRV meters are the most diffused. As for the former, direct and transformed measures are not only linked to participants' arousal and degree of emotions (as expected) but also to stress and mental effort. As for the latter, focused phenomena similarly include arousal, excitement, and stress; specifically, these phenomena are diffusedly linked with HR variations or inter-beat intervals. The use of other devices, such as ECG, is seldom found in design research.
Main outcomes of the review and comments
Tables 1–9 are meant to provide information about many aspects of the sample of analyzed experiments. Each of these aspects can lead to different considerations and any reader can scrutinize specific data independently. In the authors' view, the following considerations can be drawn with particular reference to the contents and objectives of the experiments.
• The foci of the experiments are substantially aligned with the objectives emerging from theoretical research (see the first bullet list of the "Introduction" section). This is favored by some authorship overlaps between theoretical and experimental studies.
• With reference to the design fields in which biometric measures are used, it emerges that the use of biometric tools has failed so far to open up many new research directions. In most circumstances, when positive outcomes have been achieved, biometric tools have served the role of studying established design fields more insightfully and with more objective assessment methods. Probably, their (perceived) level of maturity is still considered insufficient to stimulate new research directions.
• Evaluators- and designers-based experiments differ considerably in terms of not only methods (as aforementioned) but also objectives. As such, it makes sense for future reviews to consider these two domains separately. Common areas of research regard the understanding of technical systems, the role of information in design, and the display of emotions.
• The research in the field is highly fragmented, which can contribute to engender the perception that the actual impact of biometric measurements in design research is still modest. In a few cases, it results evident that scholars have built upon previously generated knowledge; in these few circumstances, they predominantly capitalize on their own research. This process can be partially motivated by the numerous areas of research the present review has elucidated (hence non-overlapping scholars' interests), and the presumable difficulty in repeating experiments in the same conditions.
• Despite this fragmentation, there is convergence of outcomes for some specific research objectives. Different experiments lead to the conclusion that preferences can be predicted by means of biometric devices; notably, a variety of ET and EEG measurements are good proxies of preferences and attractiveness. Supported objectives are likewise the determination of the mental workload. Another shared objective is to replace time-consuming human activities, and markedly design protocols, with neurophysiological measures; here, however, conclusions cannot be drawn yet, although outcomes are promising.
• As mentioned, a plurality of biometric devices and measures (included those achievable by means of the same tool) have been used to extrapolate and characterize some phenomena or variables relevant to design, e.g. preferences, attention, stress. On the one hand, this represents an advantage in terms of the multiple options available to study such phenomena. On the other hand, this might have contributed to the current absence of best practices in the use of biometric devices.
• The samples of participants are commonly limited to few tens. On the one hand, this underlies a relative difficulty in conducting experiments with very large samples, which makes the supposed problems in repeating others' experiments more severe. On the other hand, this represents a limit to the validity and generalizability of the findings, including those supported by multiple experiments. In any case, this situation, along with the recalled fragmentation of studies, urges to create research communities or interest groups that share practices and objectives to enhance the reliability and repeatability of findings enabled by biometric measures.
• A few research groups have carried out a large share of the described experiments, as already mentioned in the review sections. They show a constant research commitment in light of the time interval in which they have published research results. Some groups have been active just in the past. The motivations behind failing to carry out and/or publish new experiments are worth investigating in order to avoid past errors and to understand what might prevent biometric measurements from becoming commonplace in design research. However, to this respect, the relative proximity of S-curves' asymptotes and the foreseen total number of experiments (see Fig. 3) tend to reject the hypothesis of a widespread penetration in design research.
• Research is still at the laboratory level, as the number of industrial case studies or collaborations with industrial partners are negligible. This might be motivated by insufficient reliability and repeatability of results emerging from the use of biometric devices in design. Moreover, the intense research on designers' cognition, which represents a fundamental area for the use of biometric measures, poorly lends itself to technological transfer.
• With respect to journals, no favorite outlet has been individuated for the analyzed experiments.
Limitations
The present study is inherently affected by some limitations – the most remarkable ones follow. First, the creation of the sample, despite the structured procedure to build it, has introduced subjectivity in the inclusion or exclusion of contributions. Much of the analyzed research is multidisciplinary, and the influence of computer science, consumer behavior and psychology is evident. In some cases, the experiments' contribution to the design field is marginal with respect to other disciplines, although the corresponding papers are published in prestigious design journals or conferences. The extent of the impact on the design was not considered by the authors when dealing with the description of the experiments and the analysis of the research intensity. The characterization and classification of the contributions are likewise biased by a certain degree of subjectivity.
Second, the authors considered the devices mentioned in previous studies as biometric and neurophysiological. However, the categorization of these instruments is not completely acknowledged. The literature tends to distinguish them from tools and techniques that are to be considered behavioral, see example Katicic et al. (Reference Katicic, Häfner and Ovtcharova2015) and Desmet et al. (Reference Desmet, Vastenburg and Romero2016). These include, among others, the analysis of hand gestures, which complements biometric measurements in some of the described experiments, and Facial Expression Recognition, whose use is surfacing in design research as well, e.g. Bezawada et al. (Reference Bezawada, Hu, Gray, Brick and Tucker2017). If the whole set of technologies capable of extracting inadvertent people's reactions had to be considered, behavioral tools should be included in addition to biometric devices.
Eventually, the present state-of-the-art has failed to collect and illustrate experimental problems (poorly discussed in the reviewed contributions), which represents another candidate area for future work. Few preliminary indications are nevertheless given. Through a first reading of the analyzed papers, participants' discomfort problems are not reported diffusedly despite the widespread concerns about the invasiveness of (some) biometric devices. Conversely, many manuscripts report the compliance with institutional ethical guidelines and regulations, as well as the resorting to participants' written agreements. Undoubtedly, the analysis of measures is often carried out with sophisticated techniques and data elaboration software, which represents an additional hindrance to the repeatability of the studies.
Outlook and final remarks
The present paper intends to represent a baseline for acquiring knowledge about the use of biometric and neurophysiological measures in design research. According to what can be inferred from the study, the discussed tools and measures are acquiring growing importance in the design domain, but they are likely to keep representing a niche in design research in the foreseeable future.
The paper has illustrated the pertinent contributions gathered so far and described objectives, methods, tools, and results of the corresponding manuscripts. The authors are aware that the presented situation might evolve quickly and that the sample of collected experiments might require updates soon. This is based not only on the trajectories of S-curves illustrated in Figure 3 but also on the authors' knowledge of research groups that are finalizing their experiments and analyses. The increasing relevance of the topic is emphasized by the ongoing call for papers in the Thematic Collection “Design Neurocognition: Understanding of Design through Studies of the Brain” for the journal Design Science. Moreover, a large number of relevant contributions have been published during the review process of the present paper. These are not fully analyzed and described here, but they are summarized in Table 10, where role of participants, kind of experiment, and employed biometric instruments are indicated as well. Other recent publications aim to analyze with different methods already presented experimental results, e.g. Goucher-Lambert and McComb (Reference Goucher-Lambert and McComb2019) and Shealy and Gero (Reference Shealy and Gero2019).
Table 10. Summary of recent experiments including the use of biometric tools in design, which are not fully analyzed in the present paper
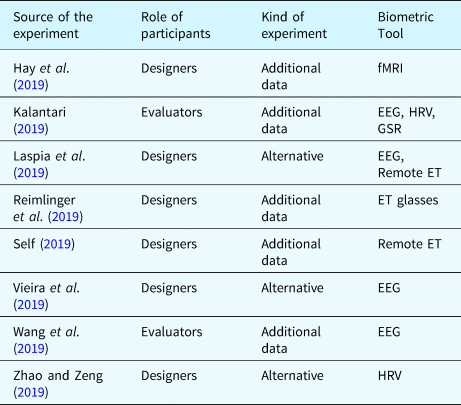
As a further contribution of the paper, a variety of classification criteria has been proposed for the analyzed experiments, which are deemed largely repeatable also in other reviews targeting experimental work in design. Due to space reasons, the authors have avoided explaining why each experiment has been classified in a certain way; readers can contact the corresponding author for details. Likewise, comments on the outcomes of the classifications are not reported for all the analyzed factors, but they are limited to the ones judged as the most interesting. To this respect, readers can easily form their own opinion by analyzing available tables. Still, for the sake of brevity, the paper has omitted basic knowledge about the functioning of specific biometric devices and their selection based on research objectives to be pursued. For a better comprehension of what is described in the paper, readers with little experience in the field might benefit from knowledge easily achievable from indicated references in the design field, specialized literature (especially in the medical field), but also the web at large. As mentioned above, the authors chose to privilege a wider description of the experiments over pieces of information easier to individuate.
Open research issues and angles that have not been dealt with in sufficient detail are presented in the "Discussion" section, which, along with the remarked limitations of the present study, represent triggers for future work. In brief, it emerges that the use of biometric tools and measures have demonstrated their utility and versatility in terms of involved design fields. The distinction into classes of experiments and their number over the years suggests that an increasing number of research groups is confident in the interpretability of biometric measures. The number of phenomena that can be investigated without the need to gather subjective indications is increasing and meaningful. However, the reliability and significance of design-related variables interpretable or measurable through biometric devices are uneven across design domains. In a few cases, the knowledge generated by means of biometric measurements can be considered established. The rejection of hypotheses that relate biometric measures and other variables has taken place in a considerable number of cases. In addition, the different approaches and the different biometric data used to assess similar phenomena have so far contributed to prevent the definition of best practices. Therefore, the remarkable variety of research objectives pursued in the reviewed experiments brings about a perception of fragmentation in the field. To this respect, the creation of design research communities interested in the use of biometric tools is fundamental to increase their maturity and popularity and, consequently, to contribute to reducing the reliance on subjective data in design research. In line with Cross’ (Reference Cross2018) viewpoint on experimental design research, sharing experiments and repeating them in different research groups might be the key to prove the effectiveness of biometric measurements and the reliability of the corresponding interpretations. Undoubtedly, this is hindered by the fact that, in many cases, research groups have planned experiments based on specific interests and included biometric tools to support the achievement of relevant results, whereas biometric measurements were not the objective of the studies per se.
Acknowledgements
The study is conducted in the frame of the project EYE-TRACK funded by the Free University of Bozen-Bolzano with the call CRC2017. This work was supported by the Open Access Publishing Fund of the Free University of Bozen-Bolzano.
Yuri Borgianni has obtained a Master Degree in Mechanical Engineering (2005) and a PhD in Industrial Engineering (2014) at the University of Florence, Italy. He is currently an Assistant Professor at the Free University of Bozen|Bolzano, Italy, where he teaches “Technical Drawing and Industrial Engineering Methods”, “Reverse Engineering and Rapid Prototyping”, and “CAD Fundamentals.” His research interests include design creativity, ideation techniques, human behavior in design, user-centered design, design for additive manufacturing, methods for conceptual design such as TRIZ, and eco-design. He is author of more than 60 articles published in scientific journals and international conferences.
Lorenzo Maccioni has obtained a Master Degree in Mechanical Engineering (2016) at the University of Florence, Italy. He is currently a PhD student in the program “Sustainable Energies and Technologies” at the Free University of Bozen|Bolzano, Italy. His research interests include eco-design, value-oriented product development, methods for conceptual design such as TRIZ, machine design, and additive manufacturing. He is author of more than 15 articles published in scientific journals and international conferences.


 Open access