


Introduction
Protected areas are set aside to conserve species and their habitats, and they are cornerstones of biodiversity conservation worldwide (Ewers & Rodrigues, Reference Ewers and Rodrigues2008). Biodiversity is typically higher and deforestation lower inside protected areas compared to the surrounding landscape, highlighting the effectiveness of area-based conservation (Joppa & Pfaff, Reference Joppa and Pfaff2010; Geldman et al., Reference Geldmann, Barnes, Coad, Craigie, Hockings and Burgess2013; Gray et al., Reference Gray, Hill, Newbold, Hudson, Börger and Contu2016). However, protected areas do not work in isolation because they are embedded within wider landscapes and are connected with surrounding unprotected lands through fluxes of organisms, energy and nutrients (Hansen & DeFries, Reference Hansen and DeFries2007). Protected areas may act as refugia that sustain wildlife populations in the surrounding landscapes, especially for large mammals. Wildlife conservation across landscapes thus requires a clear understanding of the interactions between protected areas and the surrounding unprotected lands (McNeely, Reference McNeely1994; DeFries et al., Reference DeFries, Hansen, Turner, Reid and Liu2007).
Private lands have long been recognized as essential for large mammal conservation (Simonetti, Reference Simonetti1999; Hilty & Merenlender, Reference Hilty and Merenlender2003; Soares-Filho et al., Reference Soares-Filho, Nepstad, Curran, Cerqueira, Garcia and Ramos2006) because limitations in area and representation of habitats in protected areas can impede long-term conservation of populations and species. However, land use around protected areas is considered a major threat to biodiversity (Joppa et al., Reference Joppa, Loarie and Pimm2008; Radeloff et al., Reference Radeloff, Stewart, Hawbaker, Gimmi, Pidgeon and Flather2010). Increasing human populations, agricultural expansion and infrastructure development around protected areas reduce wildlife habitat, limit species movements, affect population source–sink dynamics and expose wildlife to anthropogenic threats such as hunting, poaching, invasive exotic species and diseases. These factors potentially limit the conservation value of protected areas (Hansen & DeFries, Reference Hansen and DeFries2007). Researchers commonly compare habitats and wildlife populations inside vs outside protected areas to assess the effectiveness of protected areas (DeFries et al., Reference DeFries, Hansen, Newton and Hansen2005; Blake et al., Reference Blake, Deem, Strindberg, Maisels, Momont and Isia2008; Geldmann et al., Reference Geldmann, Barnes, Coad, Craigie, Hockings and Burgess2013). However, most studies assessing the interaction between protected areas and surrounding lands have focused on the effects of land use and anthropogenic pressures in the surrounding landscape on wildlife populations within protected areas (Woodroffe & Ginsberg, Reference Woodroffe and Ginsberg1998; Setsaas et al., Reference Setsaas, Holmern, Mwakalebe, Stokke and Røskaft2007; Balme et al., Reference Balme, Slotow and Hunter2010; Harrison, Reference Harrison2011; Häkkilä et al., Reference Häkkilä, Le Tortorec, Brotons, Rajasärkkä, Tornberg and Mönkkönen2017). High levels of anthropogenic disturbance in areas surrounding protected lands usually have a negative effect on species within protected areas (Metzger et al., Reference Metzger, Sinclair, Hilborn, Hopcraft and Mduma2010; Laurance et al., Reference Laurance, Useche, Rendeiro, Kalka, Bradshaw, Sloan and Arroyo-Rodriguez2012; Häkkilä et al., Reference Häkkilä, Le Tortorec, Brotons, Rajasärkkä, Tornberg and Mönkkönen2017).
In contrast, the effects of protected areas on wildlife populations inhabiting adjacent private lands have rarely been analysed, especially not in a spatially explicit manner. Typically, the presence of charismatic mammals such as the jaguar Panthera onca, Baird's tapir Tapirus bairdii, primates and ungulates declines with distance from protected areas, but factors such as land-cover type, distance from human settlements and prey richness also influence habitat use (Licona et al., Reference Licona, McCleery, Collier, Brightsmith and Lopez2011; Carretero-Pinzón et al., Reference Carretero-Pinzón, Defler, McAlpine and Rhodes2017; Schank et al., Reference Schank, Cove, Kelly, Mendoza, O'Farrill and Reyna-Hurtado2017; Petracca et al., Reference Petracca, Frair, Cohen, Calderón, Carazo-Salazar and Castañeda2018). Nonetheless, habitats outside protected areas can have a high probability of wildlife occupancy, as has been reported for the jaguar in Nicaragua (Zeller et al., Reference Zeller, Nijhawan, Salom-Pérez, Potosme and Hines2011). Understanding the distribution patterns of charismatic species in landscapes that contain a mosaic of patches with different ownership is useful for understanding the extent of influence of protected areas and the role of adjacent private lands, and for informing conservation decisions. This is particularly applicable in regions with high levels of biodiversity, and where large mammals can serve as indicators of the status of more cryptic species. Such information is also vital in places such as South America, which support high biodiversity and where land is mostly privately owned but that often lack the spatially explicit species-level information required for effective conservation and management.
The lowland tapir Tapirus terrestris is the largest Neotropical land mammal, occurring in forests from northern South America to northern Argentina (Emmons, Reference Emmons1999; Eisenberg & Redford, Reference Eisenberg and Redford2000). Lowland tapirs can weigh up to 250 kg, with one young produced at most every 18 months, are herbivorous and, although typically occurring at low densities, can be locally abundant around water sources and salt licks (Padilla & Dowler, Reference Padilla and Dowler1994; Naveda et al., Reference Naveda, de Thoisy, Richard-Hansen, Torres, Salas and Wallance2008). The species has an important role as a disperser of tree seeds, thereby engineering the structure and diversity of forests (Bodmer, Reference Bodmer1991; Fragoso, Reference Fragoso1997; Chalukian et al., Reference Chalukian, de Bustos, Lizárraga, Quse, Paviolo and Varela2009), and is categorized as Vulnerable on the IUCN Red List, with a declining population (Naveda et al., Reference Naveda, de Thoisy, Richard-Hansen, Torres, Salas and Wallance2008). Lowland tapirs use riparian forests and avoid open areas such as grasslands and crops (Tobler, Reference Tobler2008; Medici, Reference Medici2010). They keep away from infrastructure, including roads and oil and gas developments, and are unlikely to persist in areas with human densities > 1/km2 (Naveda et al., Reference Naveda, de Thoisy, Richard-Hansen, Torres, Salas and Wallance2008; Taber et al., Reference Taber, Chalukian, Altrichter, Minkowski, Lizárraga and Sanderson2008). Well-protected areas such as national parks are probably strongholds for the species (Novaro et al., Reference Novaro, Redford and Bodmer2000; Chalukian et al., Reference Chalukian, de Bustos, Lizárraga, Quse, Paviolo and Varela2009). In north-west Argentina the lowland tapir inhabits both dry Chaco and Southern Yungas forests, at 100–2,100 m altitude (Taber et al., Reference Taber, Chalukian, Altrichter, Minkowski, Lizárraga and Sanderson2008; Chalukian et al., Reference Chalukian, de Bustos, Lizárraga, Quse, Paviolo and Varela2009). Forest loss and fragmentation, illegal hunting, and competition with livestock are the main factors responsible for population declines of lowland tapirs, and they are also chased and killed by dogs (Naveda et al., Reference Naveda, de Thoisy, Richard-Hansen, Torres, Salas and Wallance2008; Chalukian et al., Reference Chalukian, de Bustos, Di Bitetti, De Angelo, Paviolo, Ojeda, Chillo and Díaz Isenrath2012). In Argentina, the species' range has declined by 46% in the 20th century, remaining populations are small and highly fragmented (Chalukian et al., Reference Chalukian, de Bustos, Lizárraga, Quse, Paviolo and Varela2009), and the species is categorized as Endangered nationally (Ojeda et al., Reference Ojeda, Chillo and Díaz Isenrath2012). Fifty-one Tapir Conservation Units, areas with important or critical habitat for the conservation of the species, have been identified globally based on expert opinion (Taber et al., Reference Taber, Chalukian, Altrichter, Minkowski, Lizárraga and Sanderson2008).
The mountainous, forested region of north-west Argentina known as the Southern Yungas contains four Tapir Conservation Units and three national parks, but most of the land is privately owned. Here, we sought to determine how much potential habitat remains for the lowland tapir in both the Tapir Conservation Units and in the Southern Yungas of Argentina. We also assessed the influence of small human settlements, roads and rivers, and whether properties were categorized as private reserves, on tapir habitat use in private properties adjacent to national parks. We expected a higher degree of human influence at the landscape scale, expressed as shorter distances from human settlements and roads, to be associated with lower habitat use by lowland tapirs. Conversely, proximity to national parks and to water, and categorization as private reserves, were expected to be associated with higher values of habitat use by lowland tapirs.
Study area
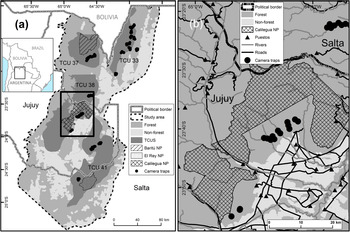
The Southern Yungas in north-west Argentina is the southernmost Neotropical montane forest (Cabrera, Reference Cabrera1976). It occurs along the eastern Andean slopes between the Chaco dry forests to the east and the Puna highlands to the west. The area is considered a biodiversity hotspot with high species richness and endemism (Myers et al., Reference Myers, Mittermeier, Mittermeier, da Fonseca and Kent2000). Human activities in the lowlands have transformed 75% of the Southern Yungas forest into agriculture (Brown & Malizia, Reference Brown and Malizia2004). We carried out our study in the provinces of Salta and Jujuy, in forests that cannot be transformed to other land use according to the current land-use planning scheme (Martinuzzi et al., Reference Martinuzzi, Rivera, Politi, Bateman, de los Llanos and Lizárraga2018) and that contain the four Tapir Conservation Units of the Southern Yungas ecoregion (Fig. 1). The study area comprises 43,000 km2 of forests and 6,870 km2 of transformed land (mostly agriculture and urban development). Land tenure in the Southern Yungas is characterized by large private properties, some > 1,000 km2 in size, within which local people occupy small households (so-called puestos), where they grow crops for subsistence and practice extensive cattle ranching (Reboratti, Reference Reboratti1998). There are three national parks in the study area (Calilegua, Baritu and El Rey National Parks) that have implemented enforcement against human activities, except research and tourism (Burkart, Reference Burkart, Brown, Martinez Ortiz, Acerbi and Corcuera2005).

Fig. 1 (a) Study area in the Southern Yungas of Argentina, showing national parks (NP), camera-trap sites, non-forested areas, and Tapir Conservation Units (TCU). (b) Detail of (a) showing camera-trap sites in relation to roads, rivers and puestos.
Methods
Camera-trap data
Camera traps are effective for detecting tapir presence and have been used extensively throughout the Neotropics (Trolle et al., Reference Trolle, Noss, Cordeiro and Oliveira2007; Cove et al., Reference Cove, Pardo Vargas, de la Cruz, Spínola, Jackson, Saenz and Chassot2014; Cruz et al., Reference Cruz, Paviolo, Bó, Thompson and Di Bitetti2014). We selected 125 camera-trap sites within a matrix of Southern Yungas forests, and surveyed them sequentially in groups of 5–10 sites. Camera-trap sites were located in private properties, within a 3° latitudinal range, and represented different land management objectives (i.e. protection for wildlife vs human use of forest). We did not set up any camera traps within the national parks. Three of the sampled properties are designated as private reserves, where the only permitted human activities are tourism and scientific research. However, there is no enforcement against hunting, poaching or cattle grazing, all of which commonly occur, so private reserves are less protected than national parks. We set up one camera trap (Bushnell Trophy Cam Aggressor, Bushnell, Overland Park, USA) at each site to record lowland tapir presence. Each camera trap was active continuously for 30 days during May–November 2016 and was attached to a tree c. 30 cm above the ground. We positioned camera traps to maximize detection of lowland tapirs, by placing them along forest trails used by large mammals. Camera traps were separated by at least 1 km (there is no information available on home range sizes of lowland tapirs in the Southern Yungas).
Our approach was similar to a hierarchical framework (Pearson et al., Reference Pearson, Dawson and Liu2004), and consisted of fitting a model with bioclimatic variables at a larger scale and with low resolution in Maxent 3.4.0 (Phillips et al., Reference Phillips, Anderson and Schapire2006), followed by occupancy modelling at a more local scale and with a higher resolution (MacKenzie et al., Reference Mackenzie, Nichols, Royle, Pollock, Bailey and Hines2006). Occupancy modelling has recently been proposed as a tool for estimating probability of occupancy, habitat use, or as a surrogate of abundance, using co-variables that can influence those parameters at a more local scale, allowing the inference about conservation potential (MacKenzie et al., Reference Mackenzie, Nichols, Royle, Pollock, Bailey and Hines2006).
Species distribution model
We used Maxent (Phillips et al., Reference Phillips, Anderson and Schapire2006) to map the lowland tapir's potential distribution. We obtained occurrence data from camera traps used in this study, and also used occurrence data from previous studies (Taber et al., Reference Taber, Chalukian, Altrichter, Minkowski, Lizárraga and Sanderson2008; Fundación CEBio, 2018). To minimize sample bias caused by double counting of individual tapirs, we used only records that were ≥ 2 km apart. We used eight 1-km resolution bioclimatic variables as predictors, following the precedent of other distribution models for species in the Southern Yungas: annual precipitation (BIO12), annual mean temperature (BIO1), seasonality of precipitation (BIO15) and temperature (BIO4), extreme data for precipitation of wettest quarter (BIO16), precipitation of driest quarter (BIO17), maximum temperature of warmest month (BIO5) and minimum temperature of coldest month (BIO6; Pidgeon et al., Reference Pidgeon, Rivera, Martinuzzi, Politi and Bateman2015, Martinuzzi et al., Reference Martinuzzi, Rivera, Politi, Bateman, de los Llanos and Lizárraga2018). These variables represented conditions in the area during 1950–2000 (Hijmans et al., Reference Hijmans, Cameron, Parra, Jones and Jarvis2005). After testing different buffer sizes, we selected a 100 km buffer and generated 10,000 pseudo-absences within the selected buffer for model training in Maxent (VanDerWal et al., Reference VanDerWal, Shoo, Graham and Williams2009). When running Maxent, we set all other options to default (Phillips, Reference Phillips2017) and assessed model performance with a 10-fold cross-validation (Bateman et al., Reference Bateman, VanDerWal and Johnson2012) and the area under the receiver operating curve (AUC). To create a map of the species' potential distribution, we transformed predictions from Maxent into a binary map of suitable vs unsuitable habitat, using the 10th percentile presence logistic threshold. Because in the Southern Yungas lowland tapirs occur only in forests, we deleted non-forested areas from the species' potential distribution map by intersecting the potential distribution with a land-cover map (Martinuzzi et al., Reference Martinuzzi, Rivera, Politi, Bateman, de los Llanos and Lizárraga2018). We did not include topographic variables in our modelling because climate and elevation are often highly correlated (Martinuzzi et al., Reference Martinuzzi, Rivera, Politi, Bateman, de los Llanos and Lizárraga2018). Finally, we calculated the total area of potential habitat for the species in the study area and in each Tapir Conservation Unit, and the area of transformed land inside each Unit, by intersecting the potential distribution with the land-cover map.
Occupancy modelling
We used occupancy modelling (MacKenzie et al., Reference Mackenzie, Nichols, Royle, Pollock, Bailey and Hines2006) to estimate the probability of the species occurring at a site (ψ, probability of habitat use), and the probability of the species being detected if present (p, detection probability), using records in a detection history matrix. We identified biologically meaningful variables known to influence the detection of the species and included these variables in the occupancy models (Long et al., Reference Long, Donovan, MacKa, Zielinski and Buzas2011).
We partitioned the detection history of each 30-day camera-trap period into 5-day blocks for a maximum of six repeated lowland tapir surveys of each site. Camera detections of lowland tapirs were defined as independent when they occurred at intervals > 1 hour (Cove et al., Reference Cove, Pardo Vargas, de la Cruz, Spínola, Jackson, Saenz and Chassot2014; Cruz et al., Reference Cruz, Paviolo, Bó, Thompson and Di Bitetti2014).
We selected covariates based on previous studies (Norris, Reference Norris2014; Ferreguetti et al., Reference Ferreguetti, Tomas and de Bergallos2017) that identified relevant anthropogenic and environmental variables influencing presence and occupancy of lowland tapirs. Variables used were distances to settlements, agricultural lands, roads, water courses and national park boundaries. We did not consider forest cover as a variable, given that all camera traps were placed within forests. We calculated Euclidian distances (in km) from camera traps to settlements, agricultural lands, roads, water courses and national park boundaries in ArcGIS 10.3 (Esri, Redlands, USA). We obtained spatial datasets of settlements, roads, water courses and national park boundaries from governmental datasets (IGN, 2016), and of agricultural lands from the available land-cover map (Martinuzzi et al., Reference Martinuzzi, Rivera, Politi, Bateman, de los Llanos and Lizárraga2018). Settlements were differentiated into two types: (1) puestos, which are isolated small households inhabited by one or few people, in some instances inhabited only seasonally, and (2) urban centres, defined as settlements with > 2,000 people (IGN, 2016). To avoid collinearity between covariates we calculated the Pearson correlation coefficient of variable pairs (Supplementary Table 1), and removed one of each pair when correlation was > 0.6 (McDonald et al., Reference McDonald, Griffiths, Nano, Dickman, Ward and Luck2015; Steenweg et al., Reference Steenweg, Whittington, Hebblewhite, Forshner, Johnston and Petersen2016). We retained distance from camera traps to nearest roads, puestos, water courses and national park borders. We standardized these variables by converting them to Z scores (to vary between +3 and −3; Donovan & Hines, Reference Donovan and Hines2007). Protection of private properties was included as a binary variable (properties without protection = 0, private reserves = 1).
We developed 30 a priori models, including a constant (null) and global set (Supplementary Table 2), to estimate the influence of the five variables on the probability of lowland tapir habitat use (ψ). We selected the best models based on the Akaike information criterion (AIC; Burnham & Anderson, Reference Burnham and Anderson2002). Rather than choosing the single highest-ranked model, we estimated the mean of the highest-ranked models (i.e. models with ΔAIC < 2 with respect to the top-ranked model; MacKenzie et al., Reference Mackenzie, Nichols, Royle, Pollock, Bailey and Hines2006). We determined co-variable effects on ψ and p using the model averaged parameter estimate. If the 95% confidence intervals for a parameter estimate excluded zero, its effect was considered significant (MacKenzie et al., Reference Mackenzie, Nichols, Royle, Pollock, Bailey and Hines2006).
We fitted detection histories and covariates in a single-season occupancy model implemented in PRESENCE 11.7 (Hines, Reference Hines2006). Lowland tapirs are large-bodied mammals capable of travelling long distances between sites (Fragoso, Reference Fragoso1997), therefore, ψ was considered to represent habitat use instead of occurrence (MacKenzie et al., Reference Mackenzie, Nichols, Royle, Pollock, Bailey and Hines2006). We determined a naïve occupancy estimate for the lowland tapir as the proportion of cameras at which the species was recorded. Finally, we generated a spatially explicit map of estimated habitat use, based on the model averaged variables. For our maps, we established a hexagonal grid of 1 km diameter cells over the study area. We calculated the value of each variable included in the averaged model for each hexagon using the centroid of each hexagon as the reference point for determining the distances to the nearest national parks, roads and puestos. Given the small size of the hexagons we assumed that conditions at the centroids were representative of conditions in the entire hexagon. We constructed the spatially explicit map of estimated habitat use considering only the area within the potential distribution of the lowland tapir determined with Maxent.
Results
Of the 125 camera traps set, 116 were active for 30 days, resulting in 3,480 trap nights. This trapping effort yielded 222 photographic records of lowland tapirs, with 146 independent records. Lowland tapirs were recorded at 69 camera traps in 11 of the 12 private properties. The mean nearest distance from camera traps to puestos was 8.7 ± SE 0.3 km (range 3.3–19.6), to roads 7.0 ± SE 0.3 km (1.7–14.5), to a national park border 33.4 ± SE 2.0 km (1.0–65.2) and to water courses 1.1 ± SE 0.1km (0.1–6.0).
Potential tapir habitat
We obtained a total of 95 tapir locations for species distribution modelling. The AUC value of the species distribution model was 0.93. Current forest area with potential distribution of the lowland tapir in the study area was 14,452 km2, with 8,301 km2 (57%) located within Tapir Conservation Units (Supplementary Table 3), and 6,151 km2 (43%) outside these Units. Privately owned properties represent 85% of the total area of the four Tapir Conservation Units in the Southern Yungas of Argentina (Supplementary Table 3), and 21% (3,844 km2) of potential habitat have been lost because of forest transformation to other land uses.
Tapir habitat use
The naïve occupancy estimate for the lowland tapir was 0.59. Our single season model assuming constant detection probability at all sites produced a habitat use estimate ψ = 0.65 ± SE 0.05 (β = 0.61 ± SE 0.23) with a detection probability p = 0.32 ± SE 0.03 (β = −0.73 ± SE 0.12). The value of ψ of Tapir Conservation Unit 33 was almost half of the value of the other Tapir Conservation Units (Supplementary Table 3). The model-averaged estimate for all sites, based on the five models with ΔAIC < 2, was ψ = 0.68 ± SE 0.24 and p = 0.32 ± SE 0.10. Variables in these well supported models included distances to national parks, roads and puestos, and protection of forests in private reserves. Distance to nearest watercourses was not included in the best models (Table 1). Distance to national park borders and distance to puestos were significantly negatively associated with ψ (Table 2). Detection probability p was significantly positively associated with increasing distance to roads (Table 2).
Table 1 Top-ranked models for the probability of habitat use ψ and detection probability p of the lowland tapir Tapirus terrestris in the Southern Yungas forest of Argentina, based on Akaike's information criterion (AIC) with a ΔAIC < 2 (difference in AIC from the best-ranked model). The table shows the relative model weight (Akaike weight), the likelihood of each model being the best-performing model, the number of model parameters (k) and the −2 log-likelihood output from the occupancy model, implemented in PRESENCE 11.7 (Hines, Reference Hines2006).

1 Variables: NatParks, distance of camera trap to the nearest national park border; Protection, designation as private reserves; Puestos, distance of camera trap to the nearest puestos (small households); Roads, distance of camera trap to the nearest road.
Table 2 Model averaged beta values, standard errors, and 95% confidence intervals for the variables that affected the probability of habitat use (ψ) and the detection probability (p) of lowland tapirs in the Southern Yungas Forest of Argentina.

The spatially explicit map of estimated habitat use showed that the majority (85%) of the area with potential lowland tapir distribution has a high probability (> 0.5) of habitat use (Fig. 2). Areas with the highest probability of habitat use were located near the three national parks (Fig. 2). Conversely, the area of the Southern Yungas with the lowest probability of habitat use was the north-eastern part of the study area, where there are no national parks (Fig. 2).

Fig. 2 (a) Potential habitat for the lowland tapir, and (b) spatially explicit map of probability of habitat use for the lowland tapir in the study area.
Discussion
Habitat use by the lowland tapir on private lands adjacent to national parks was strongly negatively associated with increasing distance to national park borders in the Southern Yungas forests. A clear association between national parks and tapir habitat use is further supported by the low predicted habitat use values in the north-eastern sector of the study area, where there is no strictly protected area. This pattern of association with protected areas corresponds with patterns of lowland tapir habitat use in the Peruvian Amazon (Bodmer, Reference Bodmer, Entwistle and Dunstone2000; Bodmer & Robinson, Reference Bodmer, Robinson, Silvius, Bodmer and Fragoso2004), and with Baird's tapir persistence in Costa Rica (Cove et al., Reference Cove, Pardo Vargas, de la Cruz, Spínola, Jackson, Saenz and Chassot2014). We suggest that national parks act as refugia for tapirs, and as sources of tapir dispersal into unprotected areas (Novaro et al., Reference Novaro, Redford and Bodmer2000), given that the national parks harbour healthy populations of lowland tapirs in the Southern Yungas (Chalukian et al., Reference Chalukian, de Bustos, Lizárraga, Quse, Paviolo and Varela2009). National parks in the Southern Yungas are strictly protected, with surveillance by park rangers and strong law enforcement (Burkart, Reference Burkart, Brown, Martinez Ortiz, Acerbi and Corcuera2005). The continuous matrix of privately owned forests in which national parks are embedded provides habitat connectivity and facilitates tapir dispersal into the unprotected areas near the national parks. In other regions, where areas immediately adjacent to national parks are exposed to high levels of land transformation and human disturbance, mortality of charismatic species is often high and population declines are common in the surrounding landscape, as a result of edge effects, poaching and conflict with humans (Setsaas et al., Reference Setsaas, Holmern, Mwakalebe, Stokke and Røskaft2007; Balme et al., Reference Balme, Slotow and Hunter2010; Häkkilä et al., Reference Häkkilä, Le Tortorec, Brotons, Rajasärkkä, Tornberg and Mönkkönen2017). For example, in Iguaçu National Park in Brazil, there are strong edge effects from adjacent transformed lands inside the protected area, affecting occupancy of several mammals, including lowland tapirs (da Silva et al., Reference da Silva, Paviolo, Tambosi and Pardini2018). In contrast, in the Southern Yungas the unprotected forests in private lands surrounding national parks appear to have low human disturbance levels, allowing tapirs to persist.
The establishment of Tapir Conservation Units aims to ensure the long-term viability of entire tapir populations, by prioritizing habitats for conservation and identifying and managing threats in those key areas. As we collect more information on the tapir's habitat use and distribution we can refine strategies and improve the delineation of the existing Tapir Conservation Units. In three of the four Tapir Conservation Units in our study area higher habitat use values were partly attributable to the presence of national parks (i.e. Tapir Conservation Unit 37 includes Baritú National Park, Unit 38 includes Calilegua National Park, and Unit 41 includes El Rey National Park). The lower values of habitat use in Unit 33, where there is no national park, further highlight the importance of strict protection of forests for the persistence of lowland tapir populations.
The majority (57%) of the potential lowland tapir habitat in the Southern Yungas is included in the Tapir Conservation Units, but 43% remains outside. Therefore, we recommend as a priority to evaluate the conservation status of the potential habitat area located outside Tapir Conservation Units. Only 15% of the forest area in the Tapir Conservation Units is within national parks, whereas 85% is in private properties. The national parks in the Southern Yungas are probably too small to maintain viable populations of lowland tapirs in the long term. It has been estimated that the home range of lowland tapirs in semi-deciduous Atlantic Forest is 4.7 km2 and that 200 tapirs would be required to ensure long-term population viability (Medici, Reference Medici2010). Therefore, in the Southern Yungas the conservation strategy for the lowland tapir should include private forests surrounding national parks in schemes of sustainable management.
We found no evidence that tapir habitat use was higher on protected private reserves than on private lands without protection. This suggests that the protection level afforded by protected private lands, which is lower than that of national parks, is not sufficient to influence habitat use by tapirs. However, these findings must be interpreted cautiously because our sample size was small. Currently, in Argentina the National Forest Law No. 26,331 (Seghezzo et al., Reference Seghezzo, Volante, Paruelo, Somma, Buliubasich and Rodríguez2011) provides a legal framework and financial support for the protection of private land (Rivera et al., Reference Rivera, Politi, Lizárraga, Chalukian, de Bustos and Ruiz de los Llanos2015), assisting private land owners in supporting the populations of tapirs and other wildlife.
Contrary to our expectations, habitat use by the lowland tapir was higher closer to puestos. One possible explanation is that puestos are in relatively inaccessible locations, with no association with distance to roads, cities, or agricultural lands. Inaccessibility of puestos could offset the effect of some human disturbance such as cattle grazing and small-scale crop farming. It is also possible that tapirs benefit from small-scale forest disturbance caused by local people, as tapirs are known to forage in open and secondary forests (Painter, Reference Painter1998). Another possible cause of the positive association is that local people living in puestos persecute large predators to reduce cattle predation (Perovic et al., Reference Perovic, de Bustos, Rivera, Arguedas Mora and Lizárraga2015), which may also reduce predation pressure on the lowland tapir. Local people also appear not to rely on hunting tapirs as a protein source. The only evidence of hunting in the study area is from areas with good accessibility by urban hunters (S.C. Chalukian, 2018, pers. comm.), which is why roads affected lowland tapir detectability, as in other regions where roads have provided access for hunters (Licona et al., Reference Licona, McCleery, Collier, Brightsmith and Lopez2011; Cruz et al., Reference Cruz, Paviolo, Bó, Thompson and Di Bitetti2014; Schank et al., Reference Schank, Mendoza, Vettorazzi, Cove, Jordan, O'Farrill and Leonardo2015). Care is thus necessary when planning and building new transport infrastructure in the Southern Yungas, to avoid increasing access to unprotected forested areas (Martinuzzi et al., Reference Martinuzzi, Rivera, Politi, Bateman, de los Llanos and Lizárraga2018).
Given the key role of national parks for the conservation of lowland tapir populations in the Southern Yungas, the management effectiveness and implementation of protection actions in these conservation areas must be maintained or improved, with adequate funding and personnel. Tapir Conservation Unit 33 is under increasing anthropogenic pressure, with oil and gas prospecting, extensive cattle ranching, illegal forest logging and wildlife poaching (Salta Government, 2013). We suggest that the lowland tapir and other wildlife species would benefit from the creation of a strictly protected area in Tapir Conservation Unit 33. Otherwise, if the creation of a strictly protected area is not possible, efforts should be made to limit the extent of cattle ranching and strengthen the enforcement of laws against poaching and illegal logging. Given that most of the land within the Tapir Conservation Units is privately owned, collaboration with the private sector is required to protect the lowland tapir and its habitat. This should happen within the framework of the National Forest Law, which aims to support land planning and forest management, including conservation and restoration of ecologically important elements. Connectivity between Tapir Conservation Units is threatened by land-use change, and thus strategies to maintain the remaining structural connectivity are needed urgently, for the benefit of the lowland tapir and other species.
More broadly, our study highlights the importance of protected areas for large mammals, not only by protecting populations inside the protected areas themselves, but also by potentially supporting populations outside, on adjacent private lands. In addition, surrounding areas can increase the total area of available habitat, and hence support larger subpopulations with better chances for long-term survival. However, we caution that studies based on camera traps, such as ours, cannot identify sink habitat, and we were not able to examine demographics and age structure of tapirs inside and outside protected areas. Nevertheless, we suggest that our findings highlight the broader importance of national parks, and the need to carefully examine their value for surrounding areas, especially if those areas are not heavily influenced by humans. In the oceans, marine protected areas have been shown to increase fisheries in the surrounding areas in some cases (McClanahan & Mangi, Reference McClanahan and Mangi2000; Roberts et al., Reference Roberts, Bohnsack, Gell, Hawkins and Goodridge2001; Lester et al., Reference Lester, Halpern, Grorud-Colvert, Lubchenco, Ruttenberg and Gaines2009), and in terrestrial systems, theory and empirical data suggest that spatial controls on hunting, such as those provided by protected or sacred areas, can allow wild populations to persist (McCullough, Reference McCullough1996; Brandt et al., Reference Brandt, Wood, Pidgeon, Han, Fang and Radeloff2013). It may be a missed opportunity that the benefits of protected areas for wildlife populations in unprotected landscapes are not typically considered in conservation planning (Margules & Pressey, Reference Margules and Pressey2000; Naidoo et al., Reference Naidoo, Balmford, Ferraro, Polasky, Ricketts and Rouget2006; Keppel et al., Reference Keppel, Mokany, Wardell-Johnson, Phillips, Welbergen and Reside2015).
Acknowledgements
We thank the land owners who allowed us to conduct fieldwork on their properties; Francisco Molina and Mariano Odetti for help with fieldwork; Fundación CEBio for logistical support; and the Whitley Fund for Nature for financial support. A Fulbright-CONICET (Consejo Nacional de Investigaciones Científicas y Técnicas) scholarship and CONICET supported the visit of NP and LR to Silvis Lab at University of Wisconsin, Madison.
Author contributions
Study concept and design: all authors; data collection: LR, NP, SB, SdB, SCH, LL; data analysis: LR, SM, NP, VR, AP; creation of habitat use maps: LR, SM, NP, VR, AP; writing: LR, SM, NP, VR, AP; revisions: all authors.
Conflict of interest
None.
Ethical standards
This research abided by the Oryx guidelines on ethical standards.


 Open access