


Abstract
Laser paint removal has many advantages compared to traditional paint removal methods and has been widely used in the industry. A closed-loop control based on real-time monitoring of the laser paint removal process is essential to achieve a good clean effect without damaging the substrate. The acoustic signals generated in various stages have been studied experimentally. The results show that the property of the acoustic signal is closely correlated with the status of laser paint removal. The amplitude and the local standard deviation of the acoustic signal in the frequency range of 7–10 kHz gradually decreases to a steady value with the removal of the paint. The change of these two factors can reflect the status of laser paint removal more realistically than the signal amplitude in the time domain. Compared with the laser induced breakdown spectroscopy method, we found that monitoring based on acoustic signal works on a wider laser fluence range. We proved that this method can be used to evaluate whether the paint is cleaned or not when laser works in a scanning model. Our work can benefit the real-time monitoring and close-loop control of laser paint removal.
Export citation and abstract BibTeX RIS
1. Introduction
Mechanical and chemical cleaning methods have been widely used in paint removal. However, they have many limitations: low work efficiency, high environmental pollution, easy damaging of the surface of the workpiece, and unhealthy to the operators etc. Laser paint removal is an environmentally-friendly cleaning method with high efficiency and does not damage the substrate if the laser parameters are properly chosen. It has the potential to replace the traditional cleaning methods to satisfy people's environmental awareness [1]. Benefitting from the development of the high-power fiber laser, laser paint removal has attracted people's attention recently. In laser paint removal, a continuous or pulsed laser is shaped by optical focusing to form a laser beam with a specific spot shape and energy distribution to irradiate the position where cleaning is required. After absorbing the laser energy, the paint can undergo a series of complicated processes and eventually detach from the surface of the substrate. Irradiated with a continuous or pulsed laser with a long pulse duraion; color changing, thermal expansion, swelling, melting, thermal ablation, buring and vaporization of the paint can be observed as the fluence of the laser increasing. Besides the processes mentioned above, the paint can also be removed by photomechanical ablation when it is irradiated by a nanosecond laser pulse. The paint thermally expanded after absorbing the pulsed laser energy and leaves the surface when the expansion force is sufficient to break away from the substrate [2–4]. These mechanisms are also affected by the repetition rate and the wavelength of the laser. A decrease of the ablation threshold occurs with the high repetition rate laser because of the thermal accumulation effect. Lasers with different wavelengths are suitable for various laser clean applications because of the difference of the absorption coefficients [5, 6]. Our work focus on a 1064 nm pulsed laser because of its great potential in laser paint removal in the industry.
In order to clean the paint without damaging the substrate by the excessive irradiation of the laser, a real-time monitoring method for laser paint removal is particularly important. several laser paint removal monitoring methods have been proposed previously. Image analyzing based on a color photo taken by a CCD has been devloped [7]. Laser induced breakdown spectroscopy (LIBS) spectral detection, which is based on laser induced plasma formation during the paint removal, has also been proved as an effective monitoring method [8, 9]. Many processes in laser paint removal, such as laser induced ablation and material ejection, can generate acoustic signal [10]. It is closely related to the status of laser paint removal and can be used for real-time monitoring [11]. In 1994, Duley et al studied the acoustic signals emission in Al welding by using a CO2 laser in the frequency range of 3–9 kHz. They proved that acoustic emission in the specific frequency range can be used as a tool for diagnostic laser processing statuses [12]. Lu et al studied audible sound waves during the interaction of excimer lasers with materials and used sonic monitoring to observe surface cleanliness and ablation. They found that the amplitude of the sound waves depends on the laser energy density, the number of pulses, and the material properties of the substrate and proved that it can be used to study the interaction between the laser and materials. The ablation threshold has been idendified by using this method [13, 14]. Bregar studied dry and vapor laser cleaning techniques based on excimer and Q-switched Nd:YAG lasers. Through the analysis of the acoustic signal, they found that the amplitude of the acoustic signal and the decrease of the flight time reach a constant value when the cleaning process ends [15]. Lee has developed a monitoring technique based on acoustics, color and intelligence methods for laser cleaning, enabling automatic control of the paint removal [16]. Santiago Palanco proved that the spectral analysis of the acoustic signal is a simple and low-cost diagnostic method for the plasma phenomenon [17]. Based on a theoretical investigation of the heat balance process, Sansan Ao used the two-dimensional model to study the characteristics of acoustic signals generated in laser welding and established a model to obtain the spatial distribution of acoustic radiation [18]. Recently, Giannis Zacharakis et al have evaluated the cleaning effectiveness and detected the potential damage to the substrate in laser cleaning on stone by analyzing the amplitude of the acoustic signal [19]. By combining an optical monitoring system with a photoacoustic system, a hybrid system was developed and achieved a good performance [20].
Compared with other monitoring methods, acoustic monitoring has the advantages of a wide application range, high efficiency, and low operating cost. It has high application prospects in the implementing of paint feedback and dynamic monitoring in laser paint removal especially with a high repetition rate and a high average power nanosecond fiber laser. However, acomprehensive study on the frequency distribution and amplitude characteristics of the acoustic signals is still lacking. The question of how to use these characteristics as feedback signals and their relationship with the paint removal status still need to be addressed [21].
In this paper, the overall amplitude of the acoustic sound, amplitude at specific frequency, local standard deviation (LSD) and other characteristics with the progress of the paint removal were studied. LIBS and, microscopic observation are also used in the analyzing. The results show that the characteristics of the acoustic signal generated by laser paint removal at specific frequency and LSD are closely related to the status of laser paint removal. This study can help the realtime monitoring of laser paint removal and to achieve close loop control at a low cost.
2. Experimental setup
The Q-switched Nd:YAG pulsed laser used in the experiments has a wavelength of 1064 nm, a pulse duration of 10 ns, a single pulse energy of up to 100 mJ, and a repetition rate of 1 Hz. The laser energy irradiated to the sample is adjusted by a half-wave plate and a polarization beam splitting prism. The focal length of the lens is 10 cm. The distance between the lens and the sample is 8 cm. The beam diameter of the laser on the paint is around 1.6 mm for the Nd:YAG laser. It gives a fluence at the center of the beam around 2.98 J cm−2 and 4.47 J cm−2 respectively when the energy is 30 mJ and 45 mJ. The wavelength of the fiber laser (IPG)is 1064 nm with a pulse duration of about 100 ns. The repetition rate is 100 kHz while the power can be up to 100 W. The beam diameter for the fiber laser is around 600 μm, which gives a fluence of 2.83 J cm−2 at the center of the beam. The laser fluence is high when the beam is focused tightly, which leads to a high-density laser induced plasma formation. The high density plasma will absorb and reflect laser light, which causes the decrease of the laser energy deposited into the paint. The beam size we chose is to ensure the efficiency of laser paint removal
The microphone that collects the acoustic signal (Apex220, Sensitivity: −63 dB ± 3 dB@1 kHz, S/N Ratio: >67 dB) is 4 cm away from the sample and can linearly respond to acoustic signals in the frequency range of 20–20 kHz. The audio card (Roland's Rubix22, maximum acquisition frequency is 192 kHz) converts the analog signal from the microphone into a digital signal and sends it to the PC for signal analysis. The aluminum plates with a thickness of 2 mm are used as the substrate. Botny automatic spray white paint was coated uniformly on the substrate surface. The surface morphology of the paint after laser irradiation is observed by a VHX-600 microscope (KEYENCE, 150×). The LIBS spectra are detected by using an AvaSpec-ULS2048CL-EVO fiber spectrometer.
3. Results and discussion
The absorbed laser energy on the paint is released in the form of heat, light, and sound. Due to the expansion of the shock wave and the plasma waves, a broadband acoustic signal is produced [10, 22]. During paint removal, a change of the intensity and tone of the sound can even be distinguished by ear, which indicates that the property of the acoustic signal changes as the thickness of the paint decreases. Figure 1(a) shows the surface morphology of a 70 μm thick white paint sample irradiated by laser pulses with a pulse energy of 30 mJ. The paint is mostly cleaned after the seventh pulse. The morphology does not change much after the seventh pulse. The amplitude of the acoustic signals generated in laser paint removal varies with the number of applied pulses, as shown in figure 1(b). The intensities of the acoustic signals generated by the first nine pulses are high and are almost consistent. The amplitude of the tenth pulse begins to decrease. Eventually, only a very weak signal exists after more laser pulses are applied. The amplitude of the acoustic signal is directly related to the absorption of laser energy. The amplitude of the acoustic signal is high when the laser light interacts with the paint because of the higher absorption coefficient of the paint compared with the metal substrate. The surface morphology of the paint changes when it is irradiated with the laser pulse, which leads to a different energy deposition in the paint. After the paint is cleaned, the amplitude of the generated acoustic signal is low since the laser light interacts with the high reflectance and low absorptive metal substrate. The amplitude of the acoustic signal does not change immediately but continues to act after several laser pulses when the paint is substantially cleaned, as shown in figures 1(a) and (b). We notice that the cleaned area increases slightly with more laser pulses after seven pulses. This indicates that the delay of the amplitude change of the acoustic signal may originate from the Gaussian distribution of the laser beam, in which the efficiency of the paint removal is lower at the outer edge of the spot.

Figure 1. (a) Surface morphology of the white paint after irradiated by fourth, sixth, seventh, and tenth laser pulses (30 mJ); (b) time domain acoustic signals of 1–14 laser pulses; (c) frequency domain waveform of the acoustic signal when different laser pulses are applied;(d) the change of the intensity of the signal; (e) the change of LSD at different frequency versus the number of pulses.
Download figure:
Standard image High-resolution imageThe distribution of the intensity in frequency domain between 4 kHz and 20 kHz obtained by FFT transforming the acoustic signal is shown in figure 1(c). Overall, the intensity variation in the frequency domain is consistent with the change in the time domain, and the intensity in the frequency domain is weak when the time domain signal is weak. The acoustic signal spectrum is broad and no characteristic frequency can be identified. The frequency generated over the entire measurable range is more complicated when the laser interacts with the paint (the fourth, fifth, and seventh pulses in the figure 1(c)). The waveform of the spectrum is less undulating and smoother when the laser irradiates a smooth surface (such as 1, 9, 10). The signal always presents in the range of 4–5 kHz and 10–20 kHz, while the intensity decreases as the number of pulses increases. Signals in the range of 7–10 kHz are essentially only present in the first nine pulses.
Figure 1(d) shows the intensity of the acoustic signal at 7 kHz, 8 kHz, 9 kHz, 10 kHz as a function of the number of pulses. The intensity at these frequencies has a similar variation regularity; that is, as the number of laser pulses increases, the intensity first increases and then decreases. The decrease starts from the sixth pulse. The intensity of the acoustic signal at these frequencies gradually decreases to a stable value, corresponding to the case where the laser is completely applied to the aluminum substrate. Part of the paint has been removed in the laser irradiation area after the sixth pulse, as shown in figure 1(a). After the seventh pulse, most of the paint in the laser irradiation area is removed. Compared with the time domain intensities, the acoustic signal in the range of 7–10 kHz is closely related to the status of laser paint removal. We noticed that the intensity at 8 kHz has reached a stable value at the eighth pulse, which truly reflects the paint removal status. It reflects the laser paint removal process more accurately and has the potential for online paint removal monitoring.
In addition, we observed that the local smoothness of the curve of figure 1(c) is related to the number of laser pulses applied. To describe this phenomenon quantitatively, the LSD is defined as follows to calculate the signal intensity fluctuations over a range of frequencies,
N is the selected spectral range in which the standard deviation needs to be calculated,  is the arithmetic mean of the intensities in this range. The LSD (N = 400 Hz) at 7 kHz, 8 kHz, 9 kHz, and 10 kHz is shown in figure 1(e). The variation regularities of LSDs at these four frequencies are generally similar to figure 1(d). The LSD at 8 kHz becomes stabilized at seventh pulse, consistent with the situation shown in figure 1(a). The results show that the LSD in the range of 7–10 kHz can be used as a method for estimating the laser paint removal status.
Figure 2 shows the change of the surface morphology of paint and acoustic signals when the laser energy is 45 mJ and the paint thickness is 70 μm. The paint is substantially cleaned after the sixth pulse, as shown in figure 2(a). The change of the amplitude of the acoustic signal vs the number of pulses is shown in figure 2(b). The intensities of the acoustic signals generated by the first eight pulses are high and keep almost consistent. The amplitude of the acoustic signal generated by the ninth pulse begins to gradually weaken. Eventually only a very weak signal exists. The intensity distribution of the frequency component at 4–20 kHz is shown in figure 2(c). The overall intensity variation in the frequency domain is consistent with the variation of the time domain intensity, which becomes weak when the time domain signal is weak. The signal always exists in the range of 4–5 kHz and 10–20 kHz. Figure 2(d) shows the intensity of the acoustic signal at 7 kHz, 8 kHz, 9 kHz, and 10 kHz as a function of the number of pulses. The signal at these frequencies starts to decrease at the sixth pulse and substantially close to zero after the eighth pulse. Compared with the signal in the time domain, the signals at these frequency points in the frequency domain can reflect the status of laser paint removal better.

Figure 2. (a) Surface morphology of the white paint after irradiated by first, fourth,sixth, and eighth laser pulses (45 mJ); (b) time domain acoustic signals of 1–14 laser pulses;(c) frequency domain waveform of the acoustic signal when different laser pulses are applied; (d) the change of the intensity of the signal; (e) the change of LSD at different frequency vs the number of pulses.
Download figure:
Standard image High-resolution imageThe signal in the frequency domain has less fluctuations and lower intensity when the laser irradiates on a smooth surface (first pulse on smooth paint, eighth and ninth pulse on the substrate where the paint has been removed). The frequency components in the frequency curve significantly increase and many peaks with high intensities show up when the laser interacts with the paint (fourth, fifth, and sixth pulses in figure 2(c)). The LSD versus the number of the pulses at 7 kHz, 8 kHz, 9 kHz, and 10 kHz are similar to the intensities of these frequencies, as shown in figure 2(e). The frequency intensities in figure 2(d) and LSD in figure 2(e) drops significantly from the fifth pulse at 8 kHz, indicating that the intensity and LSD at proper frequency range can reflect whether the paint has been cleaned more timely than the time amplitude.
As LIBS is also an important method to monitor the laser paint removal process, we measured the LIBS spectra when we conducted the experiments shown in figures 1 and 2. In the case of figure 1, the laser energy density is too low to create any detectable LIBS signal, indicating the LIBS spectra cannot be used to monitor the laser paint removal process here. The LIBS spectrum can be obtained when the laser energy density reaches the threshold at which plasma can be generated (corresponding to figure 2). Figure 3(a) shows the LIBS spectra detected at 45 mJ. The spectra generated by the first few pulses mainly consist of characteristic peaks of titanium (such as 430.5 nm and 453.3 nm), which is specific in the paint. For the sixth pulse (which removes the last part of paint), the characteristic peak corresponding to Ti and the Al (substrate) can be simultaneously observed. Most of the paint peeling off after the sixth pulse and the laser begins to irradiate completely on the Al substrate. The characteristic peak of Ti gradually disappears, and the characteristic peak of Al is obviously enhanced. Figure 5(b) shows the ratio of the spectral intensity of the Ti at 430.5 nm, 453.3 nm, and the Al at 394.4 nm and 396.1 nm as a function of the number of pulses. The ratio generally shows a downward trend since the increasing of the intensity of the spectra peak of Al and the decreasing of the intensity of the spectra peak of Ti. According to the spectrum, the spectral intensity of the Ti at the eighth pulse is greatly reduced, indicating that the paint is basically cleaned at this time, which is consistent with the conclusion drawn from the acoustic signal.
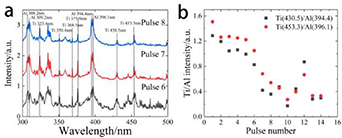
Figure 3. (a) LIBS spectra of the sixth, seventh, and eighth laser pulses; (b) the ratio of the intensity of the elemental peaks of Ti (430.5 nm and 453.3 nm) to the intensity of the elemental peaks of Al (394.4 nm and 396.1 nm) varies with the number of pulses. The energy of the laser pulse is 45 mJ.
Download figure:
Standard image High-resolution imageLaser paint removal can be achieved by ablation and the extrusion force generated by vibration. The ablation process is accompanied by the generation of plasma in which the LIBS spectrum can be detected while the vibration cannot generate plasma. In our experiments, only acoustic signal can be detected when the laser energy is low, indicating that the vibration dominants. The LIBS spectrum and the acoustic signal can both be detected when the laser energy is high indicating that the vibration and the ablation coexists. The LIBS spectrum cannot be used for estimating the paint removal status when the energy density is low where plasma is not generated. Compared with LIBS, monitoring based on acoustic signals does not have this limitation and has a wider range of applicability.
The laser scans the paint surface during the actual paint removal operation; that is, it moves in a certain direction at a certain speed on the paint. In order to evaluate the performance of the acoustic monitoring method during laser scanning, we first use the laser (40 mJ) to completely remove the paint (50 μm thick) in the working area (the diameter is 2068 μm), and then move the beam to irradiate another spot, which is 660 μm away. The surface topography of the laser-worked region is shown in figure 4(a). The paint is almost completely removed after the ninth pulse. Figure 4(b) shows the amplitude of the acoustic signal versus the number of the laser pulses applied. The signal amplitude starts to decrease from the 12th pulse. Meanwhile, the amplitude of the thirteenth and fourteenth pulse shows a significant difference, and stabilizes after the fourteenth pulse. This shows that, in this case, the time domain amplitude of the acoustic signal still does not fully reflect the status of the laser paint removal.

Figure 4. (a) Surface morphologies of the paint after irradiated by the first, fourth, sixth and ninth pulse; (b) time domain signals of 1–20 pulses; (c) frequency domain waveform of the acoustic signal; (d) the change of the intensity of the signal at different frequency as a function of the number of pulses; (e) the change of LSD versus the number of pulses.
Download figure:
Standard image High-resolution imageThe intensities of the signals in frequency domain (4–20 kHz) are shown in figure 4(c). The overall intensities begin to decrease after the seventh pulse. The intensities and distribution of the acoustic signal generated by the ninth and tenth pulses are changed significantly. The intensity of the ninth pulse is greatly reduced compared with the previous one while signals in 10–12 kHz and 14–18 kHz can still be observed. The intensity of the tenth pulse is further weakened. Figure 4(d) shows the intensity in 7–10 kHz versus pulse numbers. The intensities at these frequencies decrease significantly after the seventh pulse and reach a stable value shortly after. Meanwhile, the waveform has less fluctuations and a lower intensity when the laser irradiates on a smooth surface (such as ninth, tenth pulse). Many frequency peaks with high intensities occur when the laser interacts with the paint's rough surface (first, fourth, sixth, and seventh pulses). The waveform of the tenth pulse is basically very smooth indicating that the fluctuation in the frequency domain is greatly reduced. The LSD in 7–10 kHz are shown in figure 4(e). They start to decrease at the sixth pulse and tends to be stable after the eighth pulse. These results are consistent with the single spot experiments shown above, in which the intensity and the LSD in 7–10 kHz can accurately reflect the status of paint removal. This indicates that the acoustic signal can also be used as a tool for effectively observing the paint removal status in the case of laser scanning.
The acoustic signal monitoring of laser paint (150 μm thick) removal based on a high repetition rate fiber laser (100 kHz, 40 W, 100 ns) scanning was studied experimentally. The acoustic signal within 0.5 s after the laser was emitted was recorded by the microphone. The intensities of the signal of the acoustic signal at each time period are shown in figure 5(a). The overall intensities at different frequencies tend to decrease with time until they approach zero. Figure 5(b) shows the intensities in the frequency range of 7–10 kHz at different times. The intensities of these frequencies all show a downward trend within 0–0.5 s, and finally decrease to zero. Figure 5(c) shows that the LSD also decrease versus time in the frequency range of 7–10 kHz. These results are consistent with the results of the stationary experiments shown above, indicating that the intensity and LSD of 7–10 kHz can reflect the paint removal status and can accurately determine whether the paint is cleaned. We should point out that the sampling rate of our sound card is 192 kHz, which can not resolve the laser paint removal status pulse by pulse. The signal we detected is an integration of the acoustic signal for several pulses, which causes the difference between figures 5(b), 2(d) and 4(d).

Figure 5. (a) The intensity of the acoustic signal in the frequency domain; (b) the changes of the intensities and (c) LSD versus time.
Download figure:
Standard image High-resolution image
Experiments with different spot sizes were also carried out. The results show that with a 30 mJ laser pulse our method works well when the diameter of the beam is bigger than around 500 μm. It becomes invalid gradually (the cleaning efficiency decreases as well) when the spot size become smaller than 500 μm. We think the high density of plasma induced by the high fluence absorbs and reflects the laser light, which causes the energy deposited in the paint decrease and lowers the clean efficiency. On the other hand, our method works well for laser paint removal work at a high clean efficiency (which is required).
From the result shown above, the LSD can be closely connected with the status of laser paint. We proved that LSD can be used to monitor the status of laser paint removal. However, its origin is still unclear and needs further study. We analyzed the whole spectrum range of the acoustic signal and found that the signal in the range of 7–10 kHz has a better performance in the sense of monitoring of laser paint removal process. The amplitude of the frequency component in the range of 7–10 kHz can be combined with LSD to get more reliable results.
We should notice that audible frequencies could also carry lots of noise, which may limit the accuracy in the industry environment. Laser paint removal also generates an acoustic signal in the ultrasound frequency range, which has been proved by other researchers previously [19, 20]. A higher sampling rate is required to resolve the ultrasound frequency. On the other hand, a shorter sampling time is required to get adequate data for FFT, which can increase the repetition rate of detection. In this paper, we proved that the audible signal can be used to monitor the status of laser paint removal with low cost (a microphone and a sound card). Further work will be done to investigate the correlation between the status of laser paint removal, frequency distribution and LSD in the ultrasound range.
4. Conclusion
In summary, we studied the acoustic signals generated in various stages of laser paint removal experimentally. We found that the intensity and the LSD of the acoustic signal in the frequency range of 7–10 kHz gradually decrease to a steady value with the removal of the paint. The change of these two factors can reflect the status of laser paint removal more realistically than the signal amplitude in time domain. Compared with the LIBS method, monitoring based on acoustic signal can work in the low fluence region. We proved that this method can be used to evaluate whether the paint is cleaned or not when the laser works in a scanning model. Our work can benefit the real-time monitoring and close-loop control of laser paint removal.
Acknowledgments
This work was supported by the National Natural Science Foundation of China (Grant No. 61705149).