


Abstract
In this paper, the sensing characteristics of a photonic crystal fiber (PCF) Sagnac interferometer based on flat-phase birefringence, zero-group birefringence and the Vernier effect have been studied. The temperature-sensitive liquid is filled into the air holes of the PCF. We realize flat-phase birefringence, by which the sensitivity can reach 4.9 nm/°C and 3.5 nm/°C. We find a new phenomenon in that there are more interference fringes appearing near the zero-group-birefringence wavelength with the environment changing. Highly sensitive sensors with −19.9 nm/°C and 28.6 nm/°C are obtained. We also demonstrate that two cascaded Sagnac interferometers based on PCF can realize the Vernier effect. The sensitivities are 1 nm/°C (single Sagnac interferometer) and 10.4 nm/°C (cascaded Sagnac interferometers), and the sensitivity is improved by more than 10 times. The sensitivity is inversely proportional to the difference between free spectral range (FSR)1 and FSR2, and the highest sensitivity reaches 23.2 nm/°C (−58 500 nm/RIU, resolution: 3.419× 10⁻⁷ RIU) by optimizing the PCF length in Sagnac interferometer 2. The average sensitivity based on two cascaded PCF Sagnac interferometers is up to −309 957 nm/RIU and the resolution is 6.453× 10⁻⁸ RIU as the refractive index of the analyte varies from 1.33 to 1.331, which is very competitive in the field of chemical sensing.
Export citation and abstract BibTeX RIS
1. Introduction
The function of photonic crystal fibers (PCFs) can be extended through post-processing technology: A. Spiral twisted optical fibers can be fabricated by rotating one end and fixing the other end of the PCFs under heating; these can be used in optical tweezers, mode filtering and electromagnetic sensing [1,2]; B. Tapered PCFs are more sensitive to environmental parameters and have high non-linearity [3,4]; C. The porous properties of PCFs provide a new opportunity for the integration of photoelectric materials, which can greatly expand the performance and application of the PCFs [5–7]. PCFs filled with new photoelectric materials have attracted the attention of many scholars.
The development and cross-application of micro-nano and material technology provide broad research space for realizing the integration of fibers and photoelectric materials [8–10]. By filling photoelectric materials in micron-sized pores, the guided beam of PCFs can interact strongly with materials of micro-nano size, and then the optical signal can be modulated and used to sense the changes of environmental parameters. The combination of PCFs and photoelectric materials has many unique properties: fewer consumables; increasing the length of optical fibers can further increase the intensity of photophysical interaction; easy integration of the optical fibers with other devices; large-scale production; and fast response. Rifat et al [11] proposed a refractive index (RI) sensor based on PCF coated with gold, and the maximum sensitivity could reach 11 000 nm/RIU (refractive index units). Yin et al [12] studied a vector magnetometer based on a Mach–Zehnder interferometer by utilizing a magnetic fluid-filled PCF and the sensitivity was up to 114.5 pm/mT. A temperature sensor based on oil-filled PCF was demonstrated by four-wave mixing and a temperature sensitivity of 0.207 nm/°C was achieved [13]. A voltage sensor based on liquid crystal selectively filled PCF was obtained with a sensitivity of 5.594 nm/V [14]; the coupling resonance occurs between the fiber mode and liquid-crystal mode as the the two modes satisfy the phase-matching condition.
Two beams of light propagating in opposite directions have phase difference by utilizing the polarization-maintaining fiber in the Sagnac interferometer, thereby they produce interference fringes. According to the variation of interference fringes, the external environment can be detected. This type of fiber sensor has many advantages, such as high sensitivity, good stability, compact structure, easy preparation and fine self-balance characteristics. Wu et al [15] proposed an in-line PCF microfluidic refractometer based on the Sagnac interferometer; a C-shaped fiber connects with a single-mode fiber and PCF which allows analyte flow and in-line optical signal delivery. Li et al [16] demonstrated an RI sensor based on an exposed-core PCF within a Sagnac interferometer; the exposed-core fiber possesses an asymmetric structure and reveals birefringence characteristics which can be used to detect the environment. In our previous work [17,18], we studied a Sagnac interferometer-based PCF sensor, found zero-point group birefringence, and meanwhile demonstrated the relation between zero-group-birefringence wavelength and fiber structural parameters. Wu et al [19] realized a hydrogen sensor based on a Sagnac interferometer and obtained the Vernier effect by angle shift splicing two polarization-maintaining fibers. Shao et al [20] constructed two cascaded fiber Sagnac interferometers to realize the Vernier effect and two conventional polarization-maintaining fibers with different lengths were inserted into the two Sagnac loops.
In this paper, we have demonstrated the sensing characteristics of a PCF Sagnac interferometer based on novel birefringence and the Vernier effect. One innovation point of this paper is that we realizeflat-phase birefringence and find zero-group birefringence. The interference fringes keep popping up as the temperature decreases, by which the highly sensitive fiber sensor is obtained. The other innovation point is that we construct the configuration of two cascaded PCF Sagnac interferometers, and the sensitivity is increased by 10.4 times compared with a single PCF Sagnac interferometer. We also demonstrate the relation between the sensitivity and the difference between free spectral range (FSR)1 and FSR2. The sensitivity reaches 23.2 nm/°C (−58 500 nm/RIU, resolution: 3.419× 10⁻⁷ RIU) by decreasing the PCF length in Sagnac interferometer 2. The fiber chemical sensor is also realized near the RI of 1.33 of analyte with an average sensitivity of −309 957 nm/RIU, and the resolution could reach 6.453× 10⁻⁸ RIU.
2. Geometry and mode field
Figure 1 shows the cross-section of our proposed PCF and the orthogonal mode fields. The air holes on the cross-section are distributed by a triangular lattice and the lattice pitch is Λ = 3.0 µm. The PCF can be drawn from preform with large size. In the process of preparation, the diameter of the preform shrinks and the distribution of air holes is easy to change for a PCF with square lattice holes. Therefore, this type of fiber is much easier to fabricate compared with the square lattice fiber. The diameters of the larger air holes are d1 = 3.2 µm and those of the other air holes are d2 = 2.0 µm. The two air holes in the x direction are enlarged to obtain high birefringence, thereby a high phase difference between the orthogonal fiber modes can be realized at a certain fiber length. The substrate material of the PCF is fused silica, which has very low sensitivity to temperature, and its dispersion relation can be obtained by the Sellmeier equation [21]:
where λ represents the operable wavelength in units of microns and T denotes temperature in units of Celsius. We assume to fill the temperature-sensitive liquid into the air holes of the PCF the RI of the liquid is 1.37 as the temperature is 25 °C and the thermo-optic coefficient is −4 × 10⁻⁴ °C−1. In this paper, all the air holes are filled with liquid. The easiest filling method is putting one end of the special fiber into liquid while the other end remains in air, so that the liquid will flow into the air holes by capillary force. If we want to quicken the filling process, one end of the fiber can be put into a syringe and the pressure difference between the two fiber ends can push the liquid to flow into the air holes quickly.
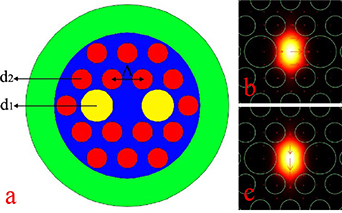
Figure 1. (a) The cross-section of the PCF structure. The structural parameters are Λ = 3.0 µm, d1 = 3.2 µm and d2 = 2.0 µm. The substrate material of the fiber is fused silica. Mode field distributions of (b) x-polarized mode and (c) y-polarized mode at the wavelength of 1500 nm and at the temperature of 25 °C.
Download figure:
Standard image High-resolution imageThe finite element method is utilized to analyze the fiber mode. The effective refractive indices of fiber modes are achieved at a certain wavelength by COMSOL, and then the birefringence can be obtained. We calculate the refractive indices of fiber modes under continuous wavelength by MATLAB scanning method. The orthogonal fiber modes shown in figures 1(b) and (c) are calculated at a wavelength of 1500 nm and at a temperature of 25 °C (the RI of the filled liquid is 1.37). The refractive indices of the two modes are (b) 1.426657 for the x-polarized mode and (c) 1.426 986 for the y-polarized mode, respectively.
3. Sensing characteristics by novel birefringence
In this section, we study the sensing characteristics of a single fiber Sagnac interferometer within PCF based on novel birefringence. Figure 2 shows the schematic of the single PCF Sagnacagnac interferometer which mainly consists of a broadband light source, an isolator, a 3 dB optical coupler, a polarization controller (PC), a temperature-controlled cabinet (TCC) and an optical spectrum analyzer. A high-birefringence PCF filled with temperature-sensitive liquid is connected with the two branches of the 3 dB optical coupler. An isolator is utilized to prevent reflected light from harming the light source. The polarization state of transmitting light can be optimized by the polarization controller to realize a higher visibility of interference spectrum. A beam of light is split into two beams of light equally by the optical coupler, and then one beam of light transmits in a clockwise direction alone the fiber loop, while the other beam of light transmits in an anti-clockwise direction. The two beams of light recombine by the optical coupler, and they have phase difference due to the existence of birefringence of the PCF, thereby an interference spectrum is produced. As the temperature varies, the RI of the filled liquid changes, which leads to the variation of PCF birefringence, then the interference spectrum shifts, which can be recorded by the optical spectrum analyzer. A temperature-controlled cabinet is used to control the environmental temperature of the PCF. The liquid-filled PCF is spliced with two single-mode fibers. In the process of fusion, it is necessary to control the discharge time and current of the fusion machine as well as the placement position of the PCF. If the discharge time and current are too long or too large, the PCF quickly collapses. The discharge position should be inclined to the side of the single-mode fiber to prevent the collapse of the special fiber. A small amount of liquid will volatilize in the welding process, but it has little effect on the sensing characteristics. The other ends of the single-mode fibers are connected with the broadband light source and optical spectrum analyzer.
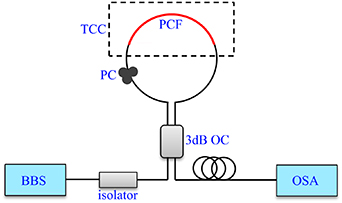
Figure 2. The schematic of the singl fiber Sagnac interferometer-based sensing system which mainly consists of a broadband light source (BBS), isolator, 3 dB optical coupler (OC), polarization controller (PC), temperature-controlled cabinet (TCC) and optical spectrum analyzer (OSA). The PCF is filled with temperature-sensitive liquid.
Download figure:
Standard image High-resolution imageThe transmittance spectrum of the single fiber Sagnac interferometer can be calculated by the following equation [15]:
where λ is the operable wavelength, L signifies the length and B represents the phase birefringence of the PCF filled with temperature-sensitive liquid. The phase birefringence B is related to the operable wavelength and RI of the filled liquid, and it is defined by:

where nx, ny represent the effective refractive indices of the x- and y-polarized modes of the PCF. From equation (2), we can see that the transmission dips will appear, as the phase difference satisfies:
where m denotes an integer. The environmental temperature or the RI of the filled liquid can be detected by the wavelength position of transmission the dip.
3.1. Flat-phase birefringence
Next, we introduce the sensing characteristics of the PCF based on flat-phase birefringence. One innovation is that we realize the flat-phase birefringence by our designed PCF structure. Figure 3 shows (a) the phase birefringence B and (b) phase difference Δϕ dependence on the operable wavelength, as the temperature changes from 20 °C to 45 °C in temperature intervals of 5 °C. The wavelength changes from 1500 nm to 2400 nm to observe the flat-phase birefringence B and phase difference Δϕ. The phase birefringence B is calculated by equation (3). The effective RI of y-polarized mode is larger than that of x-polarized mode, because the two air holes in the x direction are larger than the other air holes and the RI of the filled liquid is lower than that of the fused silica. Figure 3(a) shows that the phase birefringence B is flat in a certain wavelength range, which is different from previous studies in which B is almost linear with the wavelength [16,18]. We intend to realize a highly sensitive sensor based on the flat-phase birefringence B. B increases firstly and then decreases at a certain temperature as the wavelength increases. It increases as the temperature increases at a certain wavelength. Because the RI of the filled liquid decreases with the increasing temperature, the refractive indices of the fiber modes decrease, while the RI of the x-polarized mode goes down much faster than that of y-polarized mode, and therefore the RI difference between the two modes increases. The phase difference is calculated by Δϕ = 2πBL/λ, where the fiber length of the PCF is 0.8 m. The phase birefringence B is proportional to the phase difference Δϕ, thereby Δϕ increases with the increasing temperature. However, the flat region blueshifts compared with the phase birefringence B, because the phase difference Δϕ is inversely proportional to the wavelength λ.

Figure 3. (a) Phase birefringence B and (b) phase difference Δϕ dependence on operable wavelength; the temperature varies from 20 °C to 45 °C. It shows that the phase birefringence B and phase difference Δϕ first increase and then decrease with wavelength increasing.
Download figure:
Standard image High-resolution imageFigure 4 shows the transmittance spectra of the PCF based on flat-phase birefringence which is calculated by equation (2). The considerable wavelength varies from 1500 nm to 2000 nm. In a certain wavelength region, there is no interference fringe which means that the phase-matching condition is not satisfied. The wavelength region is consistent with that of the flat-phase difference. We track transmission dip A and B to study the sensing characteristics of the PCF, and the corresponding two wavelengths are on the two sides of the wavelength region of the flat-phase difference. We find an interesting phenomenon in that the transmission dips C and D appear as the temperature is 20 °C, which means that the phase-matching conditions are satisfied, which we will discuss in detail in the next part. The transmission dips A and B blueshift as the temperature decreases. The dependence of resonance wavelengths A and B on temperature is shown in figure 5. The fitting lines are made, and the fitting equation is  and R-square is 0.977 84 for transmission dip A, and the fitting equation is
  and R-square is 0.9662 for transmission dip B. The average sensitivities can reach 4.9 nm/°C and 3.5 nm/°C, respectively. The temperature detecting width reaches 25 °C.
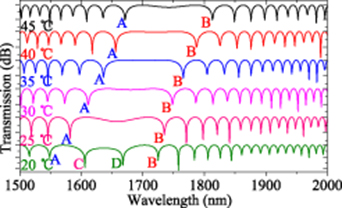
Figure 4. The transmittance spectra based on flat-phase birefringence. The transmission dip A and B blueshift with temperature decreasing and the temperature varies from 20 °C to 45 °C.
Download figure:
Standard image High-resolution image
Figure 5. The dependence of resonance wavelength A and B on temperature. The sensitivities reach 4.9 nm/°C and 3.5 nm/°C, and the linearities are 0.9662 and 0.977 84, respectively.
Download figure:
Standard image High-resolution image3.2. Zero-group birefringence
The sensitivity is proportional to the group birefringence Bg which has been demonstrated inprevious studies [17,18]. Group birefringence Bg can be obtained by the following equation:

Figure 6 shows Bg dependence on the operable wavelength based on our designed PCF structure at a temperature of 20 °C. Similarly, we achieve zero-group birefringence in this part and the corresponding wavelength is 1632 nm. As the wavelength increases, the group birefringence Bg increases from a negative value to positive value. Meanwhile, the sensitivity is negative when Bg is positive and the sensitivity is positive when Bg is negative. The sensitivity will be very high near the wavelength of zero-group birefringence.

Figure 6. Group birefringence Bg dependence on operable wavelength. The wavelength of zero-group birefringence Bg is 1632 nm and it increases from negative value to positive value with wavelength increasing.
Download figure:
Standard image High-resolution imageNot only have we realized zero-group birefringence, we also find there will be more interference fringes appearing as the temperature decreases. It is a new phenomenon which we did not find in previous studies. Figure 7 shows the transmittance spectra of the PCF, where the temperature varies from 15 °C to 20 °C, the temperature interval is 1 °C, and the fiber length is 0.8 m. The considerable wavelength varies from 1400 nm to 1900 nm. We find the transmission dip C blueshifts and the transmission dip D redshifts as the temperature decreases. The sensitivity is positive for dip C and negative for dip D which is consistent with the analysis in the last paragraph. There are new interference fringes appearing as the temperatures are 15 °C, 17 °C and 18 °C. We think this is because the fiber length is very long, and the phase difference changes quickly with the environment changing, therefore it is easy to produce new interference fringes as the temperature changes. Similarly, the new interference fringes move away from the wavelength of zero group birefringence as the temperature decreases. It can also be found that the fringe spacing increases for transmission dip C or D as the temperature increases, which means that the sensitivity increases, which is also consistent with the analysis in the last paragraph. Figure 8 shows the resonance wavelength C and D dependence on temperature based on zero group birefringence. The sensitivity could be obtained by tracking the wavelength shift with temperature. Two fitting lines are also made, which indicate average sensitivities of 28.6 nm/°C for transmission dip C and −19.9 nm/°C for transmission dip D, and the linearities reach 0.93605 and 0.96787, respectively. Because the thermo-optic coefficient of the filled liquid is −4 × 10⁻⁴ °C−1 and the fused silica has very low sensitivity to temperature compared to the temperature-sensitive liquid, we can obtain corresponding sensitivities of −71 500 nm/RIU and 49 750 nm/RIU, respectively, for the analyte RI. The advantage of this sensor is that the sensitivity is very high; however, the detecting range is narrow. For some environments which require measurements with high precision, we can utilize one sensor with a wide detecting range confirming the environment parameters roughly, and then further detect the parameters accurately by our designed sensor based on zero-group birefringence.
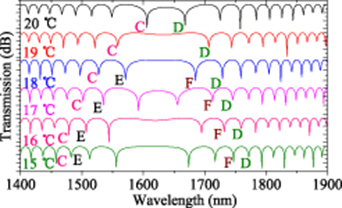
Figure 7. The transmittance spectra of the PCF based on zero-group birefringence, and there are new interference fringes appearing with temperature decreasing which is found for the first time.
Download figure:
Standard image High-resolution image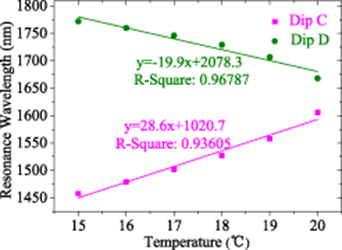
Figure 8. The resonance wavelength C and D dependence on temperature. The average sensitivities reach 28.6 nm/°C and -19.9 nm/°C, and the linearities are 0.96787 and 0.93605, respectively.
Download figure:
Standard image High-resolution image4. Sensing characteristics by Vernier effect
Measurement accuracy can be improved by the Vernier effect which has been widely applied in calipers and barometers. In recent years, the Vernier effect has been used in fiber sensing systems which usually consist of two interferometers, such as two cascaded Fabry–Perot interferometers [22], two cascaded Mach–Zehnder interferometers [23], or two cascaded fiber loops [24]. One interferometer is equivalent to a main scale and the other is equivalent to a reference scale. A configuration consisting of two cascaded Sagnac interferometers based on PCFs is proposed, and the schematic of the sensing system is shown in figure 9. The lengths of the two PCFs are different to realize the Vernier effect. The length of the left PCF is 0.8 m and that of the right PCF is 0.865 m. All the PCFs are filled with temperature-sensitive liquid. The left and right fiber Sagnac interferometer are termed Sagnac interferometer 1 and Sagnac interferometer 2. The PCF in Sagnac interferometer 1 is put into a temperature-controlled cabinet (TCC). The Sagnac interferometer 2 with PCF is put in room temperature at 25 °C. The output light of the fiber Sagnac interferometer 1 is the input light of the fiber Sagnac interferometer 2, and the total output spectrum can be considered as a superimposed spectrum of the two fiber Sagnac interferometers. The highest peak appears as the peaks of the two fiber Sagnac interferometers are at the same wavelength, and similarly the lowest dip appears as the dips of the two fiber Sagnac interferometers are at the same wavelength. The total output spectrum can display multiple envelopes, and every envelope has a highest peak. The envelope and the peak shift with the environment changing, which can be used to detect environmental parameters. The other interferometer is also affected by temperature even if it is placed outside of the TCC, because the corresponding PCF is also filled with temperature-sensitive liquid to obtain great envelopes, while the environmental temperature has little effect on it.
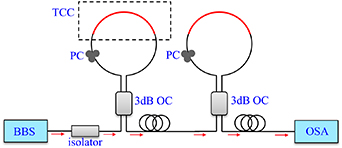
Figure 9. The schematic of the two cascaded fiber Sagnac interferometer-based sensing system. The lengths of the two PCFs are different to realize the Vernier effect, and the output light of fiber Sagnac interferometer 1 is the input light of interferometer 2.
Download figure:
Standard image High-resolution imageThe FSR of the envelope can be calculated by the following equation [20]:
where FSR1 and FSR2 represent the free spectral ranges of the fiber Sagnac interferometer 1 and Sagnac interferometer 2. If the difference of FSR1 and FSR2 is small, the Vernier effect will be great. The transmittance spectra of fiber Sagnac interferometers 1 and 2 and the two cascaded fiber Sagnac interferometers are shown in figure 10, at a temperature is 25 °C. FSR1 and FSR2 are 11 nm and 10 nm, respectively. According to equation (6), we can achieve FSRenvelope of 110 nm, which is calculated by 11× 10/ . Figure 10 shows that FSRenvelope of the envelopes of the total output spectrum is 120 nm, which is very close to the result of mathematical calculation. There is a slight difference between the two values, because the smallest wavelength interval is just 1 nm by the software for calculation.

Figure 10. Transmittance spectra of fiber Sagnac interferometer 1 and 2, and two cascaded fiber Sagnac interferometers. The FSRs are 11 nm, 10 nm and 120 nm for fiber Sagnac interferometer 1, Sagnac interferometer 2 and the cascaded Sagnac interferometers. The temperature is 25 °C.
Download figure:
Standard image High-resolution imageIn the two cascaded fiber Sagnac interferometer-based sensing system, we assume fiber Sagnac interferometer 1 to be the sensing probe. The sensitivity can be amplified, and the magnification factor can be obtained by:
From the data of the last paragraph, we know the magnification factor could reach 10 based on the two cascaded fiber Sagnac interferometers. Figure 11 shows the transmittance spectra of single fiber Sagnac interferometer 1 and two cascaded fiber Sagnac interferometers, as the temperatures are 25 °C and 30 °C. The transmittance spectrum of single fiber Sagnac interferometer 1 blueshifts as the temperature changes from 25 °C to 30 °C. The wavelength shifts by 5 nm, and the corresponding sensitivity is 1 nm/°C. The transmittance spectrum of two cascaded fiber Sagnac interferometers also redshifts with increasing temperature. The highest peak of one envelope is at 2156 nm when the temperature is 25 °C and at 2208 nm when the temperature is 30 °C. The wavelength shifts by 52 nm, the corresponding sensitivity is up to 10.4 nm/°C, and the magnification factor is 10.4, which is basically consistent with the theoretical result. The RI sensitivity is increased from −2500 nm/RIU to −26 000 nm/RIU. The resolution by Vernier effect is 7.692× 10⁻⁷ RIU as the resolution of the optical spectrum analyzer is 0.02 nm. In this part, the long wavelength region 1900–2300 nm is considered. The flat-phase birefringence and zero-group birefringence are not in the wavelength region, and will not interfere with the spectrum.
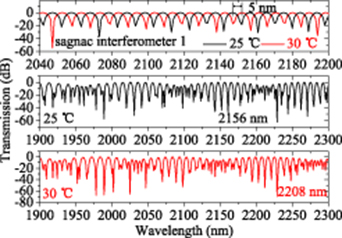
Figure 11. Transmittance spectra of single fiber Sagnac interferometer 1 and two cascaded fiber Sagnac interferometers. The temperatures are 25 °C and 30 °C. The wavelengths shift 5 nm and 52 nm for fiber Sagnac interferometer 1 and cascaded Sagnac interferometers.
Download figure:
Standard image High-resolution imageFigure 12 shows the transmittance spectra of the two cascaded fiber Sagnac interferometers based on PCF. The temperature changes from 20 °C to 40 °C at intervals of 5 °C. The transmittance spectrum redshifts as the temperature increases. The envelope A is tracked to study the sensing characteristics and the highest peak of every envelope is recorded, respectively. Each envelope contains about 10 peaks, among which the largest one is chosen. It is easy to choose the maximum, but the value is not the most optimized result. Figure 13 shows the peak wavelength dependence on temperature. Similarly, the fitting line is made The fitting equation is  , the sensitivity is up to 13.66 nm/°C, and R-square is 0.98855. The average resolution can reach 0.0015 °C. The sensitivity is not the optimized result and it could be further improved by optimizing the length of the PCF. The magnification factor is related to FSR1 and FSR2. In the next paragraph, we will discuss the sensing characteristics by modulating the length of the PCF in Sagnac interferometer 2.

Figure 12. Transmittance spectra of the two cascaded fiber Sagnac interferometers. The peak wavelength A redshifts with temperature increasing from 20 °C to 40 °C.
Download figure:
Standard image High-resolution image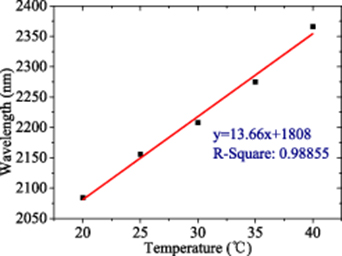
Figure 13. The peak wavelength dependence on temperature. The average sensitivity reaches 13.66 nm/°C and R-square is 0.9885.
Download figure:
Standard image High-resolution imageFrom equation (7), we know the sensitivity is inversely proportional to the difference between FSR1 and FSR2, thereby we can improve sensitivity by decreasing the difference. The FSR is related to the fiber length of the PCF, and becomes narrow as the fiber length increases. Therefore, we can change the fiber length of the PCF to modulate the difference of FSRs to further improve sensitivity. Figure 14 shows the transmittance spectra of the two cascaded fiber Sagnac interferometers by changing the PCF length in Sagnac interferometer 2. The temperatures are 25 °C and 30 °C, the PCF length in Sagnac interferometer 1 is fixed to 0.8 m, and the PCF lengths in Sagnac interferometer 2 are 0.83 m, 0.84 m and 0.85 m, respectively. We find the envelope number increases with the increasing PCF length whether it is 25 °C or 30 °C. The envelope numbers are 2 and 4 at the temperature of 30 °C as the PCF lengths in Sagnac interferometer 2 are 0.83 m and 0.85 m. This is because the number ofinterference fringes in the fiber Sagnac interferometer 2 increases, and the peaks in the two fiber Sagnac interferometers become easy to stack. This can also be explained by equation (6); as the length of the second PCF increases, the difference between the FSRs of both Sagnac interferometers is also increasing, and therefore the FSR of the Vernier envelope becomes smaller. The highest peaks of envelopes A, B and C are tracked to analyze the sensing characteristics with different PCF lengths. As the temperature increases, the envelope redshifts in the same way. The highest peaks of envelopes A, B and C are all at 2036 nm at a temperature of 25 °C as the PCF lengths are 0.83 m, 0.84 m and 0.85 m. The highest peaks of envelopes A, B and C are at 2152 nm, 2114 nm and 2104 nm, respectively, at the temperature of 30 °C. The sensitivities are up to 23.2 nm/°C, 15.6 nm/°C and 13.6 nm/°C for envelopes A, B and C. The corresponding RI sensitivities reach −58 500 nm/RIU, −39 000 nm/RIU and −34 000 nm/RIU, respectively, and the resolutions are 3.419 × 10⁻⁷ RIU, 5.128 × 10⁻⁷ RIU and 5.882 × 10⁻⁷ RIU. The sensitivity can be further improved by decreasing the PCF length in fiber Sagnac interferometer 2 or increasing the PCF length in fiber Sagnac interferometer 1; however, the detecting range would be narrow in the considerable wavelength range. In short, the Vernier effect is an effective method to improve measurement accuracy.
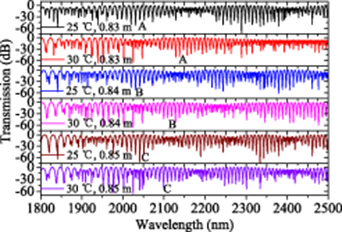
Figure 14. Transmittance spectra of the two cascaded fiber Sagnac interferometers with different PCF lengths in fiber Sagnac interferometer 2. The temperatures are 25 °C and 30 °C. The peak wavelengths are tracked to analyze the sensing characteristics. It shows the sensitivity increases as the PCF length decreases.
Download figure:
Standard image High-resolution imageLastly, we will discuss the RI sensing characteristics based on two cascaded fiber sagnac interferometers. The diameters of the large air holes and small air holes are 3.2 µm and 2.6 µm, and the lattice size is 3 µm. The RIs of the analyte are 1.33, 1.3302, 1.3304, 1.3306, 1.3308 and 1.331, respectively. The lengths of the PCFs in Sagnac interferometer 1 and 2 are 0.8 m and 0.86 m. Interferometer 1 is a sensing probe with the PCF filled with analyte and the interferometer is a stable reference with the PCF filled with liquid of RI 1.33. The transmittance spectra of the two cascaded fiber Sagnac interferometers are shown in figure 15, as the wavelength changes from 1600 nm to 2050 nm. The envelope blueshifts as the RI of the analyte increases. The envelope becomes much steeper as the wavelength decreases, while the sensitivity is much lower compared with that in the long wavelength range. The wavelengths of the highest peaks are 1 948.3 nm, 1 853.0 nm, 1 780.3 nm, 1 723.3 nm, 1 675.1 nm and 1 632.5 nm, respectively. The relation between the peak wavelength and RI of the analyte can be expressed by the fitting equation  , and the linearity is 0.970 63. It can be seen that the average sensitivity is up to −309 957 nm/RIU. The detection limit of the proposed sensor can reach 6.453 × 10⁻⁸ RIU. The sensitivity increases as the RI of the analyte decreases.

Figure 15. Transmittance spectra of the two cascaded fiber Sagnac interferometers with different refractive indices of analyte. The average sensitivity is up to −309 957 nm/RIU as the RI of analyte varies from 1.33 to 1.331. The peak wavelength is also recorded in this section.
Download figure:
Standard image High-resolution image
5. Conclusion
We have studied the sensing characteristics of the PCF Sagnac interferometer based on flat-phase birefringence, zero-group birefringence and the Vernier effect. The flat-phase birefringence is realized by the designed PCF structure, by which a high sensitivity is obtained. Meanwhile, we find the zero-group birefringence at the wavelength of 1632 nm and there are more interference fringes appearing near the zero-group birefringence wavelength as the temperature decreases. The average sensitivity is up to −19.9 nm/°C and 28.6 nm/°C as the temperature varies from 15 °C to 20 °C. The configuration of two cascaded PCF Sagnac interferometers is proposed to realize a highly sensitive sensor by the Vernier effect. The results show that the sensitivity is improved from 1 nm/°C (single Sagnac interferometer) to 10.4 nm/°C (cascaded Sagnac interferometers) as the temperature varies from 20 °C to 40 °C, and the magnification factor is 10.4. By optimizing the PCF length in Sagnac interferometer 2, the sensitivity can be as high as 23.2 nm/°C (−58 500 nm/RIU, resolution: 3.419× 10⁻⁷ RIU). We have also discussed the RI sensing characteristics near an RI of 1.33 of the analyte based on two cascaded PCF Sagnac interferometers. The average sensitivity is as high as −309 957 nm/RIU and the resolution can reach 6.453× 10⁻⁸ RIU. The sensing method proposed in this paper can also be applied to detect other environmental parameters, such as humidity, gas and magnetic field.
Acknowledgments
This research was funded by the National Natural Science Foundation of China (Grant No. 51907017), the Key Science and Technology Research Projects of Higher Education Institutions in Hebei Province of China (Grant No. ZD2019304), the Fundamental Research Funds for the Central Universities of China (Grant No. N182304011), and the China National Fund for Studying Abroad.