
Abstract
Purpose
The comfort of lift passengers has a significant effect on their general health condition as well as stress levels during travel. This study reports the results of vibration measurements taken during travel in a passenger lift.
Methods
Vibration signals were analyzed by the empirical mode decomposition method and the Hilbert transform.
Results
Selected modes from the Hilbert spectral analysis were compared with the resonance frequencies of human body organs (range 20–90 Hz) as well as with the resonance frequencies of lift components.
Conclusion
The use of Hilbert spectral analysis enables the isolation of individual signal components and the determination of the dominant frequency in the signal. This, in turn, allows for the isolation of raw vibration frequencies from the signal that are particularly significant for passenger comfort assessment (resonance frequencies of human body organs) and analysis of their occurrence.
Introduction
Lifts are vertical transport devices that are widely used in almost all new multifamily residential and downtown office buildings. In recent years, the number of high-rise buildings provided with high-speed lifts has greatly increased.
Despite a wide variety of lifting devices, they can be classified according to several criteria. Depending on the drive system, we can distinguish lifts with the following drive types [1]:
electric (work is done by the machine),
hydraulic (hydraulic pump and actuator work),
other (screw).
In electric drive lifts, the drive system can be installed in a special technical room (engine or machine room) or designed directly in the shaft so that the operation of the drive does not affect the acoustic and vibration comfort of passengers and/or residents of the building. A typical passenger lift is shown in Fig. 1. The drive system consists of gears installed in the machine room and in the cabin.
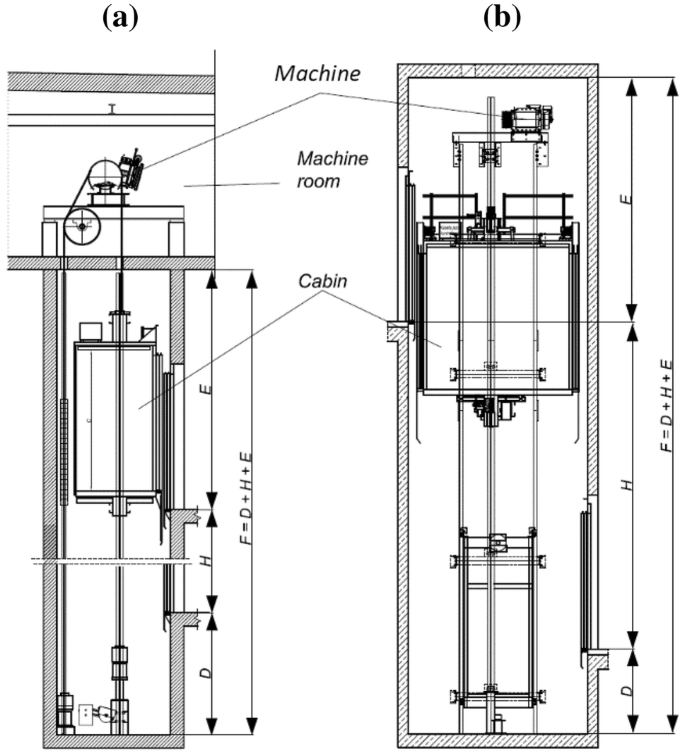
Simplified cross-section of a passenger lift shaft: a layout with engine (machine) room, b layout without machine room, where D shaft bottom depth, H lifting height, E shaft top height, F total height of lift shaft
The passenger cabin is installed in the cabin frame equipped with guides along which the guiding system moves (guide elements). The frame-cabin system is connected by ropes with a balancing mass (counterweight) which also moves along the guides using its own guide system equipped with counterweight guides. The driving system is a machine with a traction sheave and a diverter pulley enabling appropriate descent of the ropes. The main structural elements of a passenger lift significantly affecting the level of generated vibration and noise include:
tie rods (ropes, belts) and rope pulleys which, depending on the construction, emit sounds during cooperation with the machine and the output wheel, and additionally may be a carrier of vibrations from the spring suspension system of the counterweight,
counterweight slide guides—depending on the material used, the inserts can emit sound during contact with the counterweight guide (this phenomenon is particularly intensified in the case of improper lubrication of guides),
machine—the main reason for intensified sounds of the machine is its improper isolation from the ground, which leads to the creation of vibrations that are transferred to other elements of the structure,
roller guides (cabins)—their wear caused by wiped polymeric material or rolling bearing damage is one of the most common reasons for excessive noise.
Regardless of the solution type, every lifting device should be designed such that travel comfort, defined as physiological and psychophysical states in which a traveling person feels good and safe [2], is as high as possible. Acceptable sound levels in the passenger cabin and in the lift machine room as well as general requirements regarding noise and vibration prevention are normalized [3,4,5]. Additionally, the available standards [6] contain a methodology for measuring vibrations in X, Y, Z directions. Selected aspects of vibroacoustic phenomena occurring in lifting devices were discussed in the literature of the subject. These studies focused on:
vibration and noise generated by various lift components such as slide rollers [7,8,9,10,11,12];
vibration isolation methods for the lift door power drive and the selection of vibration isolation materials [13, 14];
measuring methods and reduction of acoustic emission in the passenger lift cabin [15,16,17].
A survey of the literature reveals a lack of publications regarding methods that would use vibroacoustic phenomena to evaluate the technical condition of lifting devices. In this study, the technical condition is recognized as a set of parameters of the lift structure that affect passenger comfort.
The primary objective of tests undertaken in this study was to determine vibroacoustic phenomena occurring in lifting devices. Moreover, the tests aimed to investigate the above phenomena in terms of decreasing the structure’s noise levels as well as of using them in a diagnostic process focused on monitoring passenger comfort [12, 18].
In this paper, we follow previous studies on passenger comfort assessment in terms of lift acceleration [18,19,20]. We take advantage of the Hilbert–Huang transform that was designed specifically for analyzing data from nonstationary signals.
Research Object
The research object is a passenger lift for nine people with a driving system installed in a reinforced concrete shaft. The detail specification is as follows: installation year—2014; capacity Q = 750 kg; speed V = 1 m/s; engine speed on the drive shaft 168 rpm; length of guides 6 × 5000 mm; lifting height H = 25,000 mm; number of stops N = 9; depth and width of the cab A = 1400 mm and B = 1300 mm; balance of the system—48% (Mk. 771, M.pw). The lift is equipped with a one-speed machine adjustable with an encoder and sliding guides. The engine is located in the shaft. The walls of the cabin are made of steel panels covered with HPL laminate (thermoset laminate) with a thickness of 1 mm. While in operation, the drive system generates vibration which—via the foundation and guideways—passes through the guides and the cabin frame to the inside of the cabin. The location of the drive in the shaft causes higher-level vibration and noise in the panels compared to other types of lifting devices. As a consequence, higher levels of vibration and noise also occur inside the cabin.
Measuring Equipment and Test Methodology
The sound level measurements were carried out using the Center 390 device in accordance with the IEC 61672-1 class 2, ANSI S1.4 type 2 standard, equipped with a capacitive electret microphone. This class of device is recommended by ISO 18738-1: 2012 [6]. The measuring range of the device is from 30 to 130 dB, with the frequency of the measured signal in the band ranging from 20 Hz to 8 kHz. The accuracy of the measurement is ± 1.4 dB at reference conditions, i.e., when the sound power level is 94 dB, and the frequency of this signal is equal to 1 kHz. The recorded signal was pre-processed. The processing consisted of averaging the raw signal in one-second periods. The measurements were made using the weighted A curve, which most accurately reflects specific properties of the human ear. The volume difference between the quietest and loudest sound (dynamic range) was 85 dB at 10 Hz.
Measurements of cabin acceleration (vibration) were made with the Sequoia FastTracer accelerometer. The measuring range of the apparatus was ± 5 g and the maximum impact was 1000 g. The apparatus has a 12-bit converter providing a resolution of 1 mg at 10 Hz and sampling of 18,432 Hz. The lift operation monitoring was carried out during cabin travel from the highest stop to stop 2 and back (Fig. 2). This sequence was repeated three times. During the tests, the lift was made unavailable to residents of the building. Signal was recorded with the help of measuring instruments placed both on the cabin (in the pane) and inside it. The location of the instruments on the cabin floor and in the upper part of the cabin frame is shown in Fig. 3. Parameters such as cabin acceleration in the X, Y, Z axes and sound level inside the cabin and outside the cabin in the shaft were measured. The orientation of the axes as measured relative to the cabin layout is shown in Fig. 4.

Sequence of lift travel during the tests

Location of the accelerometer: a in the middle of the cabin floor in the axis of the guides, b on the upper beam of the cabin frame in the lift shaft

The orientation of the measuring axes in relative to the cabin layout
Results Analysis
Examples of waveforms of acceleration signals in the X, Y, Z directions and sound volume inside and outside the lift cabin during travel are shown in.
The analysis of received signals was performed by the empirical decomposition method of the Hilbert–Huang transform. This method enables the determination of instantaneous values of the frequencies and amplitudes of decomposed signal components. The use of Hilbert spectral analysis allows for the isolation of individual signal components and the determination of the dominant frequency in a signal.
Each of the measured accelerations ai(t) (Fig. 5) can be decoupled into the modal components a1i(t), a2i(t),…, ami(t) [21, 22]:

Waveforms of signals from vibration sensors (accelerations in the X, Y, Z directions, charts in lines 1–3) and volume (charts in row 4) recorded inside the lift cabin (charts in the left column) and outside the cabin (charts in the right column)
In this way, we obtain information about the instantaneous amplitude, A, phase, θ, and frequency, f. Defining the complex function z(t):
where
and
Figures 6 and 7 compare the courses of vibration recorded inside and outside the cabin after the Hilbert–Huang transform. The signals were sampled at 2 kHz. The Hilbert–Huang transform was performed in windows with a width of 1000 samples. Figure 6 shows an example of a 15-s fragment of the accelerations on the outside of the elevator during the start of driving. It can be noticed that the concentration of vibrations around lower frequencies below 100 Hz is unfavorable for human body limbs (period 12:01:35–12:01:36), while in the other fragments of the frequency distribution is wider, and lower frequencies are not so exposed.

Acceleration signals in the X, Y, Z directions recorded outside the lift cabin after the Hilbert–Huang transform (15-s initial period of lift running, 2 kHz sampling, Hilbert window width = 1000 points)

Acceleration signals in the X, Y, Z directions recorded inside the lift cabin after the Hilbert–Huang transform (15-s initial period of lift running, 2 kHz sampling, Hilbert window width = 1000 points)
Vibration amplitudes of the signals recorded inside the cabin are similar to those of the signals recorded outside the cabin in a plane perpendicular to the direction of travel (Figs. 5, 7). In addition, any roughness of the guides and inequivalence of guide elements generates undesired accelerations in the X and Y directions. Therefore, the module of signals registered in the X and Y directions is subjected to further analysis (Figs. 5, 8, 9). During investigating the causes of elevator vibration, which have an impact on the user’s driving comfort, the authors analyze vibrations due to the direction of accelerations (X, Y, Z). The mechanical causes of vibrations, such as the occurrence of obstacles in the cabin guides, cause different signals in the X, Y, Z directions. Because passengers are positioned at different angles in the XY plane, to assess their driving comfort by means of the presented methods the authors decided to use the XY module calculated on the basis of signals from sensors set in the X and Y directions. The analysis of X and Y modules is additionally justified due to structural features of the system, in particular those of the running gear (consisting of guides and guide elements), because they help determine lateral accelerations that affect the cabin frame, the cabin and passengers. The use of perfectly aligned guides with perfect joints invisible to passengers is rare in the case of passenger lifts. In new buildings, the condition of guides often deteriorates as a result of building settlement (causing a different spacing of the guides in different parts of the shaft), while modernized passenger lifts are usually equipped with guides that already show signs of wear, which also leads to vibration during lift operation.

XY module outside the cabin (15-s initial period of lift running, 2 kHz sampling, Hilbert window width = 1000 points)

XY module inside the cabin (15-s initial period of lift running, 2 kHz sampling, Hilbert window width = 1000 points)
Further analysis consisted of specifying representative frequencies of component signals (highlighted in the empirical decomposition method) and interpreting the sources of vibration in a horizontal plane and in a vertical direction. Figure 10 shows the cabin vibrations in the XY plane recorded inside (a) and outside (b) the lift cabin. Raw vibration patterns (XY module) are shown in the charts on the left—¬position 0, items 1 through 6 (Huang modes). The charts on the right show the FFT spectra of raw signal and the Huang modes, respectively.

Cabin vibrations in the XY plane recorded inside (a) and outside (b) the cabin—period: 58 s. Charts on the left—raw waveforms, position 0, items 1 to 6—Huang modes. Charts on the right—FFT spectra of raw signal and Huang modes, respectively (2 kHz sampling, Hilbert window width = 1000 points)
The frequencies of the Huang modes are listed in a table below, and their positions are marked on the spectral charts given in Fig. 10. For the first Huang mode (m#1), a series of six most frequent frequencies was recorded. In the case of the XY module recorded inside the cabin, they range from 600 to 926 Hz (Fig. 12a, Spectrum#1). However, for the XY module recorded outside the cabin, the frequencies are within a narrow range of 779–788 Hz (Fig. 12b, Spectrum#1). The difference in these frequency values may result either from different sources of cabin vibration at the measurement points or from the way in which the vibration is transferred by the cabin and structural elements of the lift. When the measurements were taken outside the cabin, the accelerometer was mounted on a rigid beam of the cabin frame. Here, the recorded vibrations were primarily caused by excitation of the cabin frame by the chassis. The measurements inside the cabin were made by mounting the accelerometer on the cabin floor and connecting it to the frame with four rubber shock absorbers that were 70 mm in diameter and 30 mm in height. The upper part of the cabin was blocked by a rubber-insulated handle with a thickness of 20 mm. The walls of the cabin were made of sheet metal with a thickness of 1.2 mm, and they could generate additional vibration induced by the cabin frame. It can be observed that in subsequent mode modes the periodograms are centered around individual dominant frequencies. Values comprising a range of frequencies listed in Fig. 11 can be observed in the modes (m#4–m#6) (Table 1).

Biomechanical human body model showing the resonance frequencies of individual organs [5]
Given the above analysis for passenger comfort assessment, it is worth drawing attention to the modes m#4, m#5 and m#6. The dominant frequencies in these modes may be particularly undesired for lift passengers due to the fact that they correspond to the resonance frequencies of many human body organs, as shown in Fig. 11.
An organ in the human body which is particularly exposed to the frequencies highlighted in modes m#4, m#5 and m#6 is the human head for which the resonance frequencies range from 20 to 30 Hz (for the eyeball—the frequency is 20–90 Hz). This can significantly affect the passenger’s comfort and health (in the case of a longer exposure). Every individual has a different sensitivity to vibration acting on their body. Therefore, a sense of comfort or discomfort caused by vibration may differ. However, due to the unfavorable influence of low frequencies on the human body, one should strive to eliminate them. The vibrations (accelerations) occurring in the passenger lift cabin and their impact on the human body are additionally intensified by noise (sound intensity level) that often comes from excited thin-walled structural elements (e.g. cabin walls). The average noise in the cabin amounts to 53.5 dB (A) [maximum peak value is 70 dB (A)], which means that the nuisance—according to the scale of the National Institute of Hygiene (PZH)—is average [23]. However, the peak noise, which occurs during cabin excitation or when the counterweight passes through the guide rail connections spaced every 5 m, may become a greater nuisance that—according to the above scale—is of the range 63 ≤ LAeq ≤ 70 dB. The accuracy of combining the cabin guides has a significant impact on driving comfort. The maximum length of 5 m is limited by the possibility of bringing them in and installing them in the elevator shaft. Guide rails with 2.5 m are often used, which further affected the amount of vibrations generated and induced by the cabin. The solution to reduce the amount of generated vibrations is to grind the place where the guides are connected after assembly. However, this process is often neglected in the assembly process due to lower costs and longer assembly time. The frequency of lift excitation at the average cabin speed of 1 m/s is about 0.2 Hz, as demonstrated by the sound signal recorded inside the cabin (Fig. 12b, #3). Figure 12 shows the results of frequency analysis of the components of the sound signals recorded inside (a, b) and outside (c, d) of the cabin. The frequencies of the components obtained with the Huang mode decomposition method differ depending on the place where they were recorded (inside or outside the cabin). As for the signals recorded inside the cabin, one can distinguish components with the frequencies 0.22, 0.55, 4.7 and 12.99 Hz. Since these frequencies describe different components obtained with the empirical mode decomposition method, they have different amplitudes, which may indicate their different origin. In contrast, in the signal recorded outside the cabin only one component was distinguished, and its periodogram is characterized by follows dominant frequencies: 0.5, 0.93, 2.06, 6.39 and 24.54 Hz.

Frequency analysis results of components of volume signals recorded inside (a, b) and outside (c, d) of the cabin
An in-depth analysis of the vibration signal was performed in the low-frequency range. Raw signal was analyzed (8192 Hz sampling). The analysis consisted of determining higher components and comparing them (the distinguished components) with the values calculated on the basis of the geometrical dimensions of the structure. During this analysis, vibrations were observed caused by the elevator elements like: 0.2 Hz (in the acceleration signal recorded outside cabin above mode #17 and in mode #16 recorded inside the cabin) associated with passing guide rail connections located every 5 m and 1.3 Hz (mod #13 in the ACC signal recorded on outside the cabin) probably related to the diameter of the rope guide wheels (wheel diameter 240 mm, diameter of the rope section 6.5 mm, number of ropes 10 pcs). These frequencies have values below the lower thresholds of harmful ranges for parts of the human body (minimum value is 2 Hz in Fig. 11). However, the disclosed relations may be used for changes in the elevator construction and elevator control system. Additional it may also indicate elements requiring additional inspection, such as guide wheels, to detect any irregularities early.
Conclusions
The use of Hilbert spectral analysis enables the isolation of individual signal components and the determination of the dominant frequency in the signal. This, in turn, allows for the isolation of raw vibration frequencies from the signal that are particularly significant for passenger comfort assessment (resonance frequencies of human body organs) and analysis of their occurrence.
The Hilbert–Huang transform can be used to analyze vibration and noise signals to isolate the frequencies that can negatively affect the human body (long-term exposure) and reduce travel comfort (short-term exposure).
The average noise level in the cabin was 53.5 dB (A), with a maximum peak of 70 dB (A). Based on the results of noise in the cabin, the nuisance—according to the scale of the National Institute of Hygiene (PZH)—was found to be medium [24]. However, the peak values of noise can cause a greater nuisance that is included—according to the above scale—in a range of 63 ≤ LAeq ≤ 70 dB. The lift cabin reaches the peak values of noise due to cabin excitation and the passing of the counterweight through the guide rails every 5 m.
References
Escalada A, Abad G (2016) Elevators. In: Abad G (ed) Power electronics and electric drives for traction applications. Wiley, Chichester. https://doi.org/10.1002/9781118954454.ch8
Standard PN-ISO 5805 (2002) Vibrations and mechanical shocks—human exposure. Terminology
Polish Standard PN-91/S-04100 Vibrations. Methods of testing and assessment of mechanical vibrations at workplaces in vehicles
Polish Standard PN-EN 12299 (2009) Railway applications—comfort of passengers—measurements and evaluation (ride comfort for passengers. Measurement and evaluation)
ISO 2631-1 Mechanical vibration and shock. Evaluation of human exposure to whole-body vibration. Part 1: General requirements
ISO 18738-1 (2012) Measurement of ride quality—part 1: lifts (elevators) provides a suitable methodology for the measurement of elevator ride quality
Polish Standard PN EN 81.1+A3 Safety regulations concerning the structure and installation of lifts, part I. Electric lifts
Burov AA, Kosenko II, Troger H (2012) On periodic motions of an orbital dumbbell-shaped body with a cabin-elevator. Mech Solids 47:269–284
Lonkwic P, Szydło K, Molski S (2016) The impact of progressive gear geometry on the braking distance length under changeable operating conditions. Adv Sci Technol Res J 10:161–167. https://doi.org/10.12913/22998624/61948
Szydło K, Maciąg P, Longwic R, Lotko M (2016) Analysis of vibroacoustic signals recorded in the passenger lift cabin. Adv Sci Technol Res J 10:193–201. https://doi.org/10.12913/22998624/62627
Szydło K, Longwic R, Maciąg P (2015) Analysis of sources of noise emission registered in the cabin of a passenger lift. Tech Rail Transp 12:2154–2158
Lonkwic P, Szydło K (2014) Selected parameters of the work of speed limiter line straining system in a frictional lift. Adv Sci Technol 8:73–77
Dziubiński M, Drozd A, Adamiec M, Siemionek E (2016) Electromagnetic interference in electrical systems of motor vehicles. IOP Conf Series Mater Sci Eng 148:012036. https://doi.org/10.1088/1757-899x/148/1/012036
Rijanto E, Muramatsu T, Tagawa Y (1999) Control of elevator having parametric vibration using LPV control method: simulation study in the case of constant vertical velocity. IEEE Conf Control Appl Proc 1:527–532
Shin B, Yoon S, Lee H, Koo YS, Jeong Y, Kang I (2013) Mechanical properties and molecular structure of rubber materials with different hardnesses for vibration isolation of elevator cabins. Korean J Metals Mater 51:713–718
Longwic R, Maciąg P, Szydło K (2014) Methodology of the noise emission measuring in the passenger lift cabins. Logistics Issue 6:6809–6817 (in Polish)
Lonkwic P, Szydło K, Longwic R, Maciąg P (2014) Method to limit the noise emission emitted from thin-walled products. Logistics 6:6818–6827 (in Polish)
Lonkwic P, Szydło K (2016) Reduction of the cabin acoustic emission by the selection of an optimum stiffening method for the cabin panels. J Meas Eng 4:95–102
Lonkwic P, Łygas K, Wolszczak P, Molski S, Litak G (2017) Braking deceleration variability of progressive safety gears using statistical and wavelet analyses. Measurement 110:90–97. https://doi.org/10.1016/j.measurement.2017.06.005
Franco RS, Marranghello GF, Rocha FS (2016) Measuring the acceleration of an elevator. Revista Brasileira de Ensino de Física 38:1308. https://doi.org/10.1590/S1806-11173812097
Zhang Y, Sun X, Zhao Z, Su W (2018) Elevator ride comfort monitoring and evaluation using smartphones. Mech Syst Signal Process 105:377–390
Huang NE, Shen Z, Long SR, Wu MLC, Shih HH, Zheng QN, Yen NC, Tung CC, Liu HH (1998) The empirical mode decomposition and the Hilbert spectrum for nonlinear and non-stationary time series analysis. Proc R Soc Lond A 454:903–993
Koszarny ZW, Szata W (1987) Exposure of the Warsaw population to traffic noise, part I and II. Ann PZH No. 1 and 2.M
Wolszczak P, Łygas K, Litak G (2018) Dynamics identification of a piezoelectric vibrational energy harvester by the image analysis with a high speed camera. Mech Syst Signal Process 107:43–52. https://doi.org/10.1016/j.ymssp.2018.01.024
Author information
Authors and Affiliations
Corresponding author
Additional information
Publisher's Note
Springer Nature remains neutral with regard to jurisdictional claims in published maps and institutional affiliations.
This paper was recommended for publication in revised form by Associate Editor 000 000.
Rights and permissions
Open Access This article is distributed under the terms of the Creative Commons Attribution 4.0 International License (http://creativecommons.org/licenses/by/4.0/), which permits unrestricted use, distribution, and reproduction in any medium, provided you give appropriate credit to the original author(s) and the source, provide a link to the Creative Commons license, and indicate if changes were made.
About this article

Cite this article
Szydło, K., Wolszczak, P., Longwic, R. et al. Assessment of Lift Passenger Comfort by the Hilbert–Huang Transform. J. Vib. Eng. Technol. 8, 373–380 (2020). https://doi.org/10.1007/s42417-019-00184-3
Received:
Revised:
Accepted:
Published:
Issue Date:
DOI: https://doi.org/10.1007/s42417-019-00184-3