Bat Species Richness and Community Composition along a Mega-transect in the Okavango River Basin
by
 , and
, and
Sina M. Weier
1,2,* ,
,
Mark Keith
2,3,
Götz G. Neef
2,
Daniel M. Parker
2,4,5 and
Peter J. Taylor
1,2,6 1
South African Research Chair on Biodiversity Value & Change and Core Team Member of the Centre for Invasion Biology, University of Venda, Thohoyandou 0950, South Africa
2
National Geographic Okavango Wilderness Project, Wild Bird Trust, Parktown 2193, South Africa
3
Mammal Research Institute, University of Pretoria, Private Bag x20, Hatfield, Pretoria 0028, South Africa
4
School of Biology and Environmental Sciences, University of Mpumalanga, Private Bag X11283, Nelspruit 1200, South Africa
5
Wildlife and Reserve Management Research Group, Department of Zoology and Entomology, Rhodes University, Grahamstown 6140, South Africa
6
School of Life Sciences, University of KwaZulu-Natal Private Bag X54001, Durban 4000, South Africa
*
Author to whom correspondence should be addressed.
Diversity 2020, 12(5), 188; https://doi.org/10.3390/d12050188
Submission received: 22 March 2020
/
Revised: 5 May 2020
/
Accepted: 7 May 2020
/
Published: 11 May 2020
(This article belongs to the Section Biodiversity Conservation)
Abstract
:The Okavango River Basin is a hotspot of bat diversity that requires urgent and adequate protection. To advise future conservation strategies, we investigated the relative importance of a range of potential environmental drivers of bat species richness and functional community composition in the Okavango River Basin. During annual canoe transects along the major rivers, originating in the central Angolan highlands, we recorded more than 25,000 bat echolocation calls from 2015 to 2018. We corrected for possible biases in sampling design and effort. Firstly, we conducted rarefaction analyses of each survey year and sampling appeared to be complete, apart from 2016. Secondly, we used total activity as a measure of sample effort in mixed models of species richness. Species richness was highest in the Angola Miombo Woodlands and at lower elevations, with higher minimum temperatures. In total, we identified 31 individual bat species. We show that even when acoustic surveys are conducted in remote areas and over multiple years, it is possible to correct for biases and obtain representative richness estimates. Changes in habitat heterogeneity will have detrimental effects on the high richness reported here and human land-use change, specifically agriculture, must be mediated in a system such as the Angolan Miombo Woodland.
1. Introduction
The Okavango River Basin is hugely important as a ‘water tower’ for the entire southern African region of Angola, Namibia and Botswana, yet the region is virtually unknown biologically and faces threats from human population expansion and habitat degradation [1].
The central, southern and eastern regions of Angola represent a gap in available datasets used in recent macroecological distribution modeling exercises for African bats [2,3,4,5]. Based on extrapolations from niche models, studies of macroecological distribution models [2,3,4,5] have predicted moderate values of species richness (e.g., 0–20 species [2] and about 20 species [4]) for the Angolan highlands. Although, Herkt et al. [4] predicted high point species richness of up to about 40 species in some areas of the central highlands of Angola, which are associated with rivers. elevational patterns of diversity have been previously investigated in African terrestrial volant and non-volant small mammals [6,7,8,9,10]. While hump-shaped elevational patterns of diversity are common in mammals [11], African terrestrial non-volant small mammals typically show monotonic decreases in species richness with elevation [9]. On the other hand, two studies of southern African bats from the Soutpansberg (South Africa, [10]) and Mount Mulanje (Malawi, [7]) mountain ranges conformed to another general hypothesis. The interaction between temperature and precipitation drove elevational patterns in bat species richness [7,10], with hump-shaped patterns predicted for drier slopes and monotonic declines predicted for wetter slopes [12]. As part of a wider project of the National Geographic Okavango Wilderness Project [13] acoustic and capture surveys of bats were carried out between 2015 and 2018 [14]. Based partly on the results of these surveys, combined with available data from the Global Biodiversity Information Facility (GBIF) and Monadjem et al. [15], it was estimated that Angola contains 71 species of bats [14]. Using similar databases, a total of 73 species of bats was independently reported by Beja et al. [16].
Pio et al. [5] identified the importance of Central Angola as a center of highest bat phylogenetic diversity (PD > 30), a measure of species richness combined with evolutionary distinctness. In the face of climate change scenarios of generally diminishing regional PD’s by 2080 it was, furthermore, identified as a refuge of sustained PD [5]. Similarly, Smith et al. [17] identified central Angola as an important conservation priority area for bats in Africa. The relative importance and spatial extent of this Angolan priority area increased under future climate and land-use change scenarios [17].
A recent study looking at vascular plants in the catchment areas of the Okavango River Basin by Goyder et al. [18] confirmed not only the gap in available datasets but also the high floristic diversity and endemism of the upper Okavango Basin.
These studies underline the importance of Central Angola as an under-explored biodiversity hotspot and the need for surveys to quantify and better understand how to conserve this critical diversity and its associated ecosystem services. The longevity and sensitivity of bat species, the high trophic level occupied by insectivorous bats and their taxonomic stability and diversity makes them especially good ecological indicators of changes in land-use, land-cover and climate [19,20], and long-term monitoring of bat communities provides important insights into environmental health [20,21,22]. Furthermore, recent advances in acoustic technology make it possible to cheaply and efficiently sample insectivorous bat communities [23]. Additionally, bats are important keystone species providing many ecosystem services such as insect pest control, flower pollination and seed dispersal [20,23]. Depending on their foraging ecology, however, bat species respond to changes in land use differently [24,25]. Three functional guilds of bats can be defined in southern Africa based on their family composition [15]. Bats feeding in open spaces (usually with low frequency echolocation calls) comprise members of the Molossidae and Emballonuridae. Bats feeding on the edge of the vegetation canopy (clutter-edge feeders) typically comprise the Families Miniopteridae, Cistugidae and Vespertilionidae, with the exception of woolly bats (genus Kerivoula of the Vespertilionidae), which have high-frequency echolocation calls that are typically associated with cluttered habitats under the vegetation canopy. Members of the Rhinolophidae, Nycteridae and Hipposideridae, are also typically classified as clutter-feeders. In intact ecosystems, all feeding guilds should be present (high functional diversity), while anthropogenic impacts such as intensive agriculture may lead to a lower functional diversity due to a loss of canopy habitats for sensitive, clutter-feeding bats [26,27]. Recent studies have shown that the clutter-feeding guild and families belonging to this guild (the Rhinolophidae) are especially sensitive to land use changes such as agricultural expansion and urbanization [26,28]. Shapiro et al. [27] showed that the response of bat activity to anthropogenic pressure in tropical savannas is both season and guild dependent.
The main objective of this study was to test the prediction of high bat species richness (and functional diversity) in the central Angolan highlands by investigating the relative importance of a range of potential environmental drivers for bat species and functional richness in the Okavango River Basin.
Given the strong association between African bat species richness, proximity to water and rugged terrain associated with African highlands [2,3,4], we expected that the Angolan highlands would show high bat species and functional richness but that climatic and ecoregional differences would be more important for bat community structure than elevation per se. These results will offer important information to develop conservation strategies to mitigate the effects of anthropogenic land use and climate change impacts on the Okavango River Basin. Furthermore, this study will provide baseline data to facilitate long-term monitoring of insectivorous bat species in this region.
2. Materials and Methods
This study took place in the Okavango River basin in central Angola. From its highest point in the Okavango River basin, the Cubango River source at 1800 m above sea level (m a.s.l.) drops to the lowest reaches of the Okavango Delta at 900 m a.s.l. This is an elevational change of 900 m across a distance of about 1750 km. Annual precipitation varies from 1350 mm at the Cubango source to 350 mm at the lowest reaches of the Delta. The upper catchment areas of the Okavango Basin in the Central Angolan highlands are represented by the source lakes of the major rivers: the Cuanavale, Cuito and Cubango Rivers.
2.1. Acoustic Data Collection and Study Sites
Acoustic surveys were conducted by starting transects at several localities around the Cuito and Cuanavale source lakes, at Lungwebungu and Cuchi Gorge within the Central Angolan highlands, followed by nightly surveys during annual canoe transects on the Cuanavale, Cuito, Kembo, Cuando, Cubango and Okavango Rivers, transecting Angola, Namibia and Botswana (Figure 1a). During 2015, passive acoustic recordings were obtained with a full-spectrum (FS) Echo Meter 3 bat detector (Wildlife Acoustics, Concorde, CO, USA) for 75 nights (between 23rd May and 18th September 2015). The calls were recorded during a river expedition, which started at the Cuito source and continued along the Cuito River to the Okavango Delta. During March 2016, passive acoustic recordings of bat echolocation call sequences were obtained from the Cuito and Cuanavale source areas, Cuchi Gorge and Samboana Village, using two (FS) SM2BAT+ bat detectors (Wildlife Acoustics) and a frequency division (FD) ANABAT SD2 bat detector (Titley Scientific, Brendale, Australia). Additionally, recordings were collected during a river trip from the source of Cuanavale River to its confluence with the Cuito River with an ANABAT SD2 between 17th February and 4th April 2016, of which 11 nights yielded call sequences. During a second expedition between 28th October and 4th November 2016 (eight nights), recordings were also obtained with an ANABAT SD2 focusing on two areas, the Cuanavale and Saliakwembo source lake areas. During 2017, recordings were taken for a period of 1–2 h nightly for a total of 51 nights with an FD ANABAT SD1 detector during a river trip down the Cubango River. During 2018, passive recordings were obtained in the area of the Lungwebungwe Bridge between the 21st and 25th of April 2018 using a FS SM4BAT+ detector (Wildlife Acoustics). Additionally, passive recordings were also obtained on a Kembo river transect with SM2BAT+ detector from 14th of May to 21st of June 2018 and on a Cuando river transect with an SM4BAT+ detector between 14th of May and 31st of July 2018.
2.2. Acoustic Call Analyses
Using the Kaleidoscope Pro software (Wildlife Acoustics, Maynard, MA, United States), the full spectrum .wav files collected by Wildlife Acoustics detectors were converted to zero-crossing (ANABAT) files, converting the sound files into a time series of frequency dots. Call analysis and identification was first undertaken independently by two of the authors (PJT and SMW) to obtain consensus on the definition of call parameters (e.g., peak frequency (kHz) of an echolocation call) for each species. Based on this, a final species list was derived (Table 1), all calls were then identified manually by SMW using AnalookW software (version 4.1t, Chris Corben, [29]). We decided against the use of automated classifiers because of the high overlap between call parameters of certain species and to avoid missing rare species altogether [30].
Identifications were based on reference calls obtained both from release calls of captured field-identified individuals [14], that were subsequently released, as well as from standard references [14,15,31,32] and unpublished call data. Calls that could not be assigned to a species with confidence were labeled ‘Unknown’ and excluded from further analysis.
At least two species, namely Scotophilus leucogaster (Cretzschmar 1826) and Mimetillus thomasi (Hinton 1920), are not accounted for in the acoustic analyses. While the presence of both species has been confirmed in the Okavango Basin from mist net captures (Table 1, [14]), there are no reference calls available and the echolocation calls produced by these species remain unknown. A total of six species were recognized for a distinct echolocation call, which could not been assigned to any of the putative bat species (Table 1) with certainty, those species were therefore given a temporary label based on parameters (Myotis spp., Long44, Unknown33, Unknown38, Vesper66 and Vesper75). See supplementary files for an exemplar of call characteristics and sonograms of each of our putative species (Table S1 and Figure S2). Furthermore, to analyze community structure we assigned functional groups to each species, according to Monadjem et al. [15], based on broad preferences for foraging habitats. We also calculated pairwise similarities using the Bray–Curtis similarity (presence–absence of species), which corresponds to the percentage of shared species (Figure A1).
2.3. GIS Analysis
We used QGIS (QGIS Development Team [33], Version 2.18.11) with an Albers Equal Area projection for South Africa [34] for all GIS analyses. The zonal statistics tool was applied to add the mean elevation from the 30 arc-second DEM of Africa (U.S. Geological Survey’s Center for Earth Resources Observation and Science) as well as the Bioclimatic variables, minimum temperature of coldest month and annual precipitation (‘BIO6’ and ‘BIO12’; data 1970–2000; [35]) to a quarter degree grid cell polygon layer (QDGC level2). We used the QGIS ‘geoprocessing vector intersection tool’ to intersect the QDGC layer with the species ID points of the identified echolocation calls. We exported the combined attribute table to an Excel file (Microsoft 2013, Redmond, WA, United States) and used the power pivot function to summarize ‘unique counts’ from the species ID field to get species richness for each grid square as well as a count for the total number of bat passes, the mean latitude, longitude and elevation. This Excel file was imported back into QGIS to again use the intersection tool in order to add the terrestrial ecoregions of the world [36] to each grid square. Additionally, we manually added the months in which sampling took place in each grid square to the final Excel CSV file.
2.4. Statistical Analysis
With the R programming Language (R Foundation for Statistical Computing, Vienna, Austria), and RStudio (RStudio Inc., Bosten, MA, USA, Version 1.0.153, [37]) we used the package ‘lme4’ [38] to fit a global linear mixed effects model (GLMM). We tested the relationship between bat species richness in the different grid squares with the terrestrial ecoregion (categorical, six levels), the mean latitude (numerical, decimal), longitude (numerical, decimal), elevation (numerical, m a.s.l), minimum temperature (numerical, °C) of the coldest month and annual precipitation (numerical, mm). We chose a mixed model approach to allow us to use the total count of bat passes and the sampling month as random factors to account for the differences in sampling effort and techniques (Figure 1b). After testing the model for normal distribution and constant errors variance, a GLMM with a Poisson distribution was applied. As the initial model did not converge, we increased the maximum allowed number of function evaluations. The package ‘performance’ [39] was used to check for over-dispersion and multicollinearity (variance inflation factor < 5). Latitude and annual precipitation (VIFs of 90.41 and 89.99) and subsequently longitude (VIF = 11.22) were therefore removed. All numerical predictor variables were scaled. We selected the final model (glmer(species~eco) + scale(elevation) + scale(temperature) + (1|month) + (1|counts)) using the ‘dredge’ function (package ‘MuMIn’, [40]). ‘Dredge’ selection was based on the lowest values of the small-sample size corrected Akaike information criterion (AICc). The packages ‘effects’ [41] and ‘multcomp’ [42] were used to display model outputs.
We used a sampling unit based incidence approach to calculate species richness and diversities per survey year and river transect(s) to see whether estimates of diversity (accounting for sampling differences) varied and if the confidence levels indicate that sampling has been complete. The number of presences per species across each sampling date for the four survey years were used to calculate Hill numbers (or the effective number of species) of species richness and diversity, using the ‘iNext’ [43,44] and ‘ggplot2’ packages (Version 2.2.1, [33]). Rarefaction provides a way to compare species diversity and richness estimates between assemblages that have been unequally sampled [45]. The iNext outcome produces Hill numbers, which are diversity estimates in respect to the sample coverage, namely species richness (q = 0), the exponential of Shannon’s entropy index (q = 1) and the inverse of Simpson’s concentration index for q = 2 [46].
3. Results
From the 25,720 call sequences collected over four years, we identified 31 bat species in the Okavango Basin (Table 1). However, several calls could not be recognized as separate species and remained unknown. Additionally, at least two species known to occur in the Okavango Basin [14] were not accounted for in the acoustic analyses.
3.1. Predictors of Species Richness
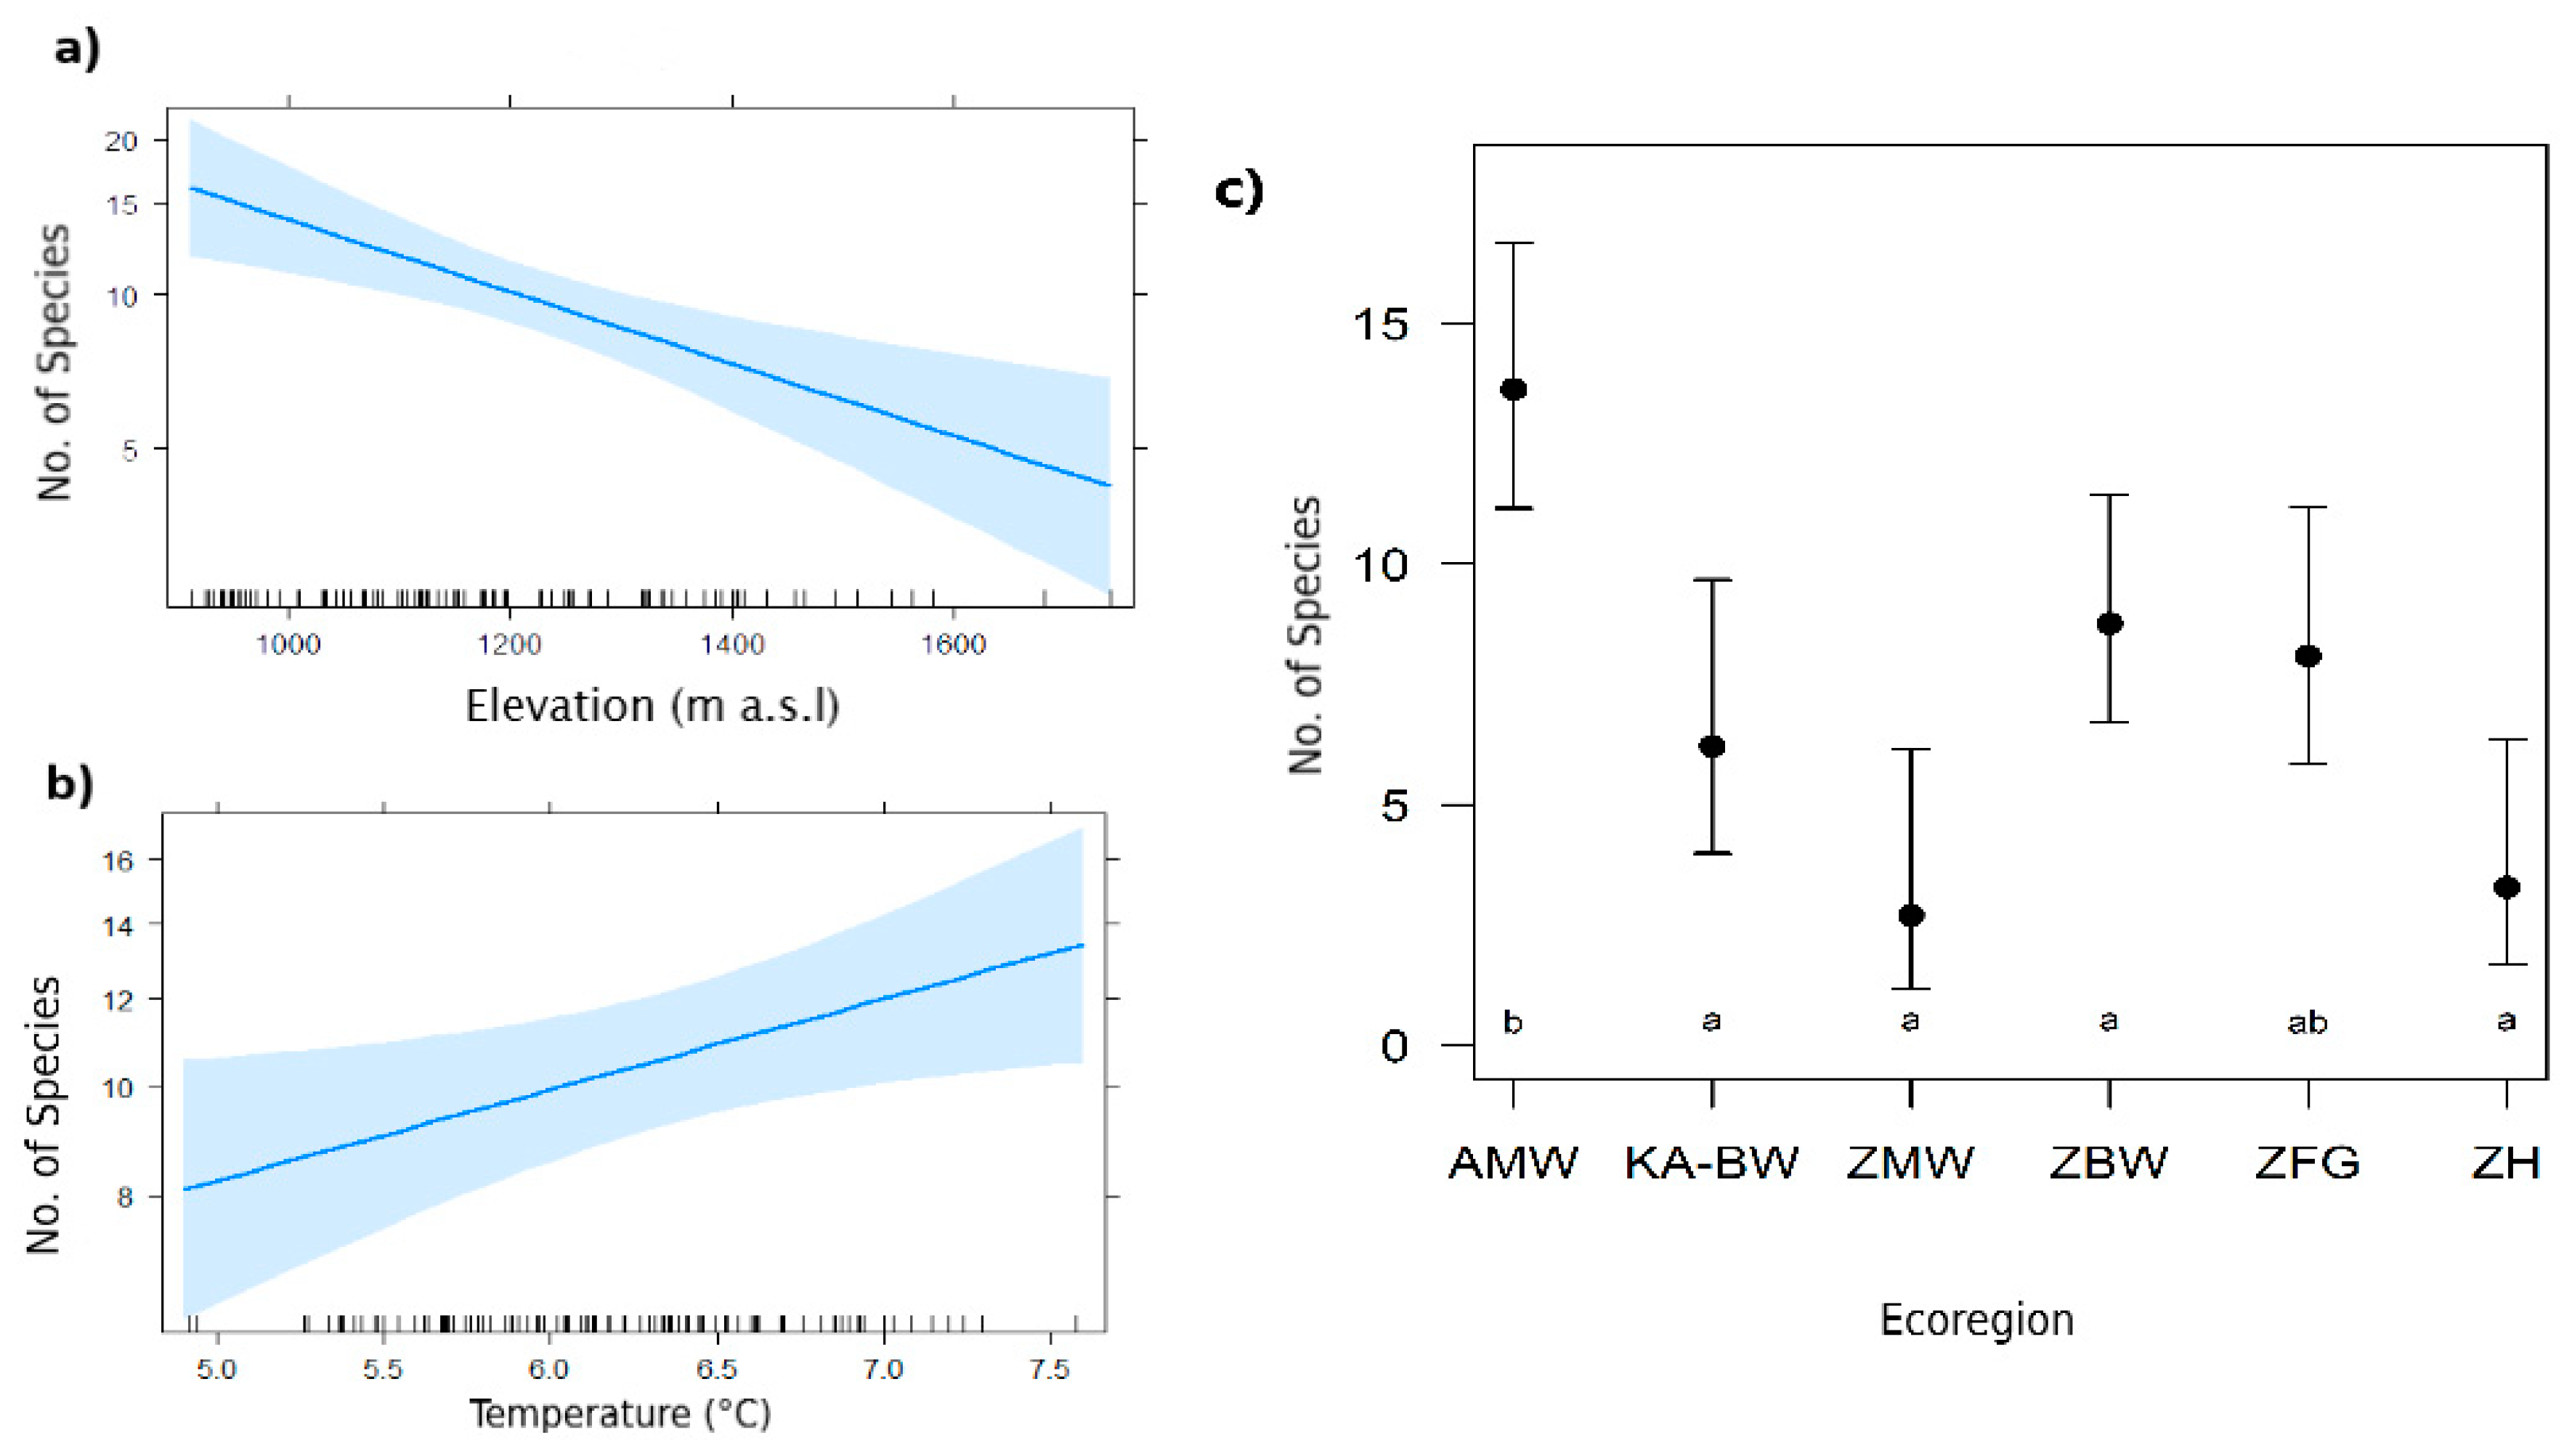
The final model on the species richness in each grid cell retained all the variables of the global model: ecoregion, elevation and minimum temperature of the coldest month (Table 2). Species richness decreased significantly with elevation (β = −0.30, p < 0.001; Figure 2a) and increased with higher minimum temperatures (β = 0.10, p = 0.021; Figure 2b). Compared to the intercept ‘Angolan Miombo Woodlands´ the remaining five terrestrial Ecoregions (Kalahari Acacia-Baikiaea woodlands; Zambezian and Mopane woodlands; Zambezian Baikiaea woodlands; Zambezian flooded grasslands and Zambezian halophytics) had significantly lower species richness (β = 2.61, p < 0.001; Figure 2c; Table 2).
3.2. Richness, Diversity and Rarefaction
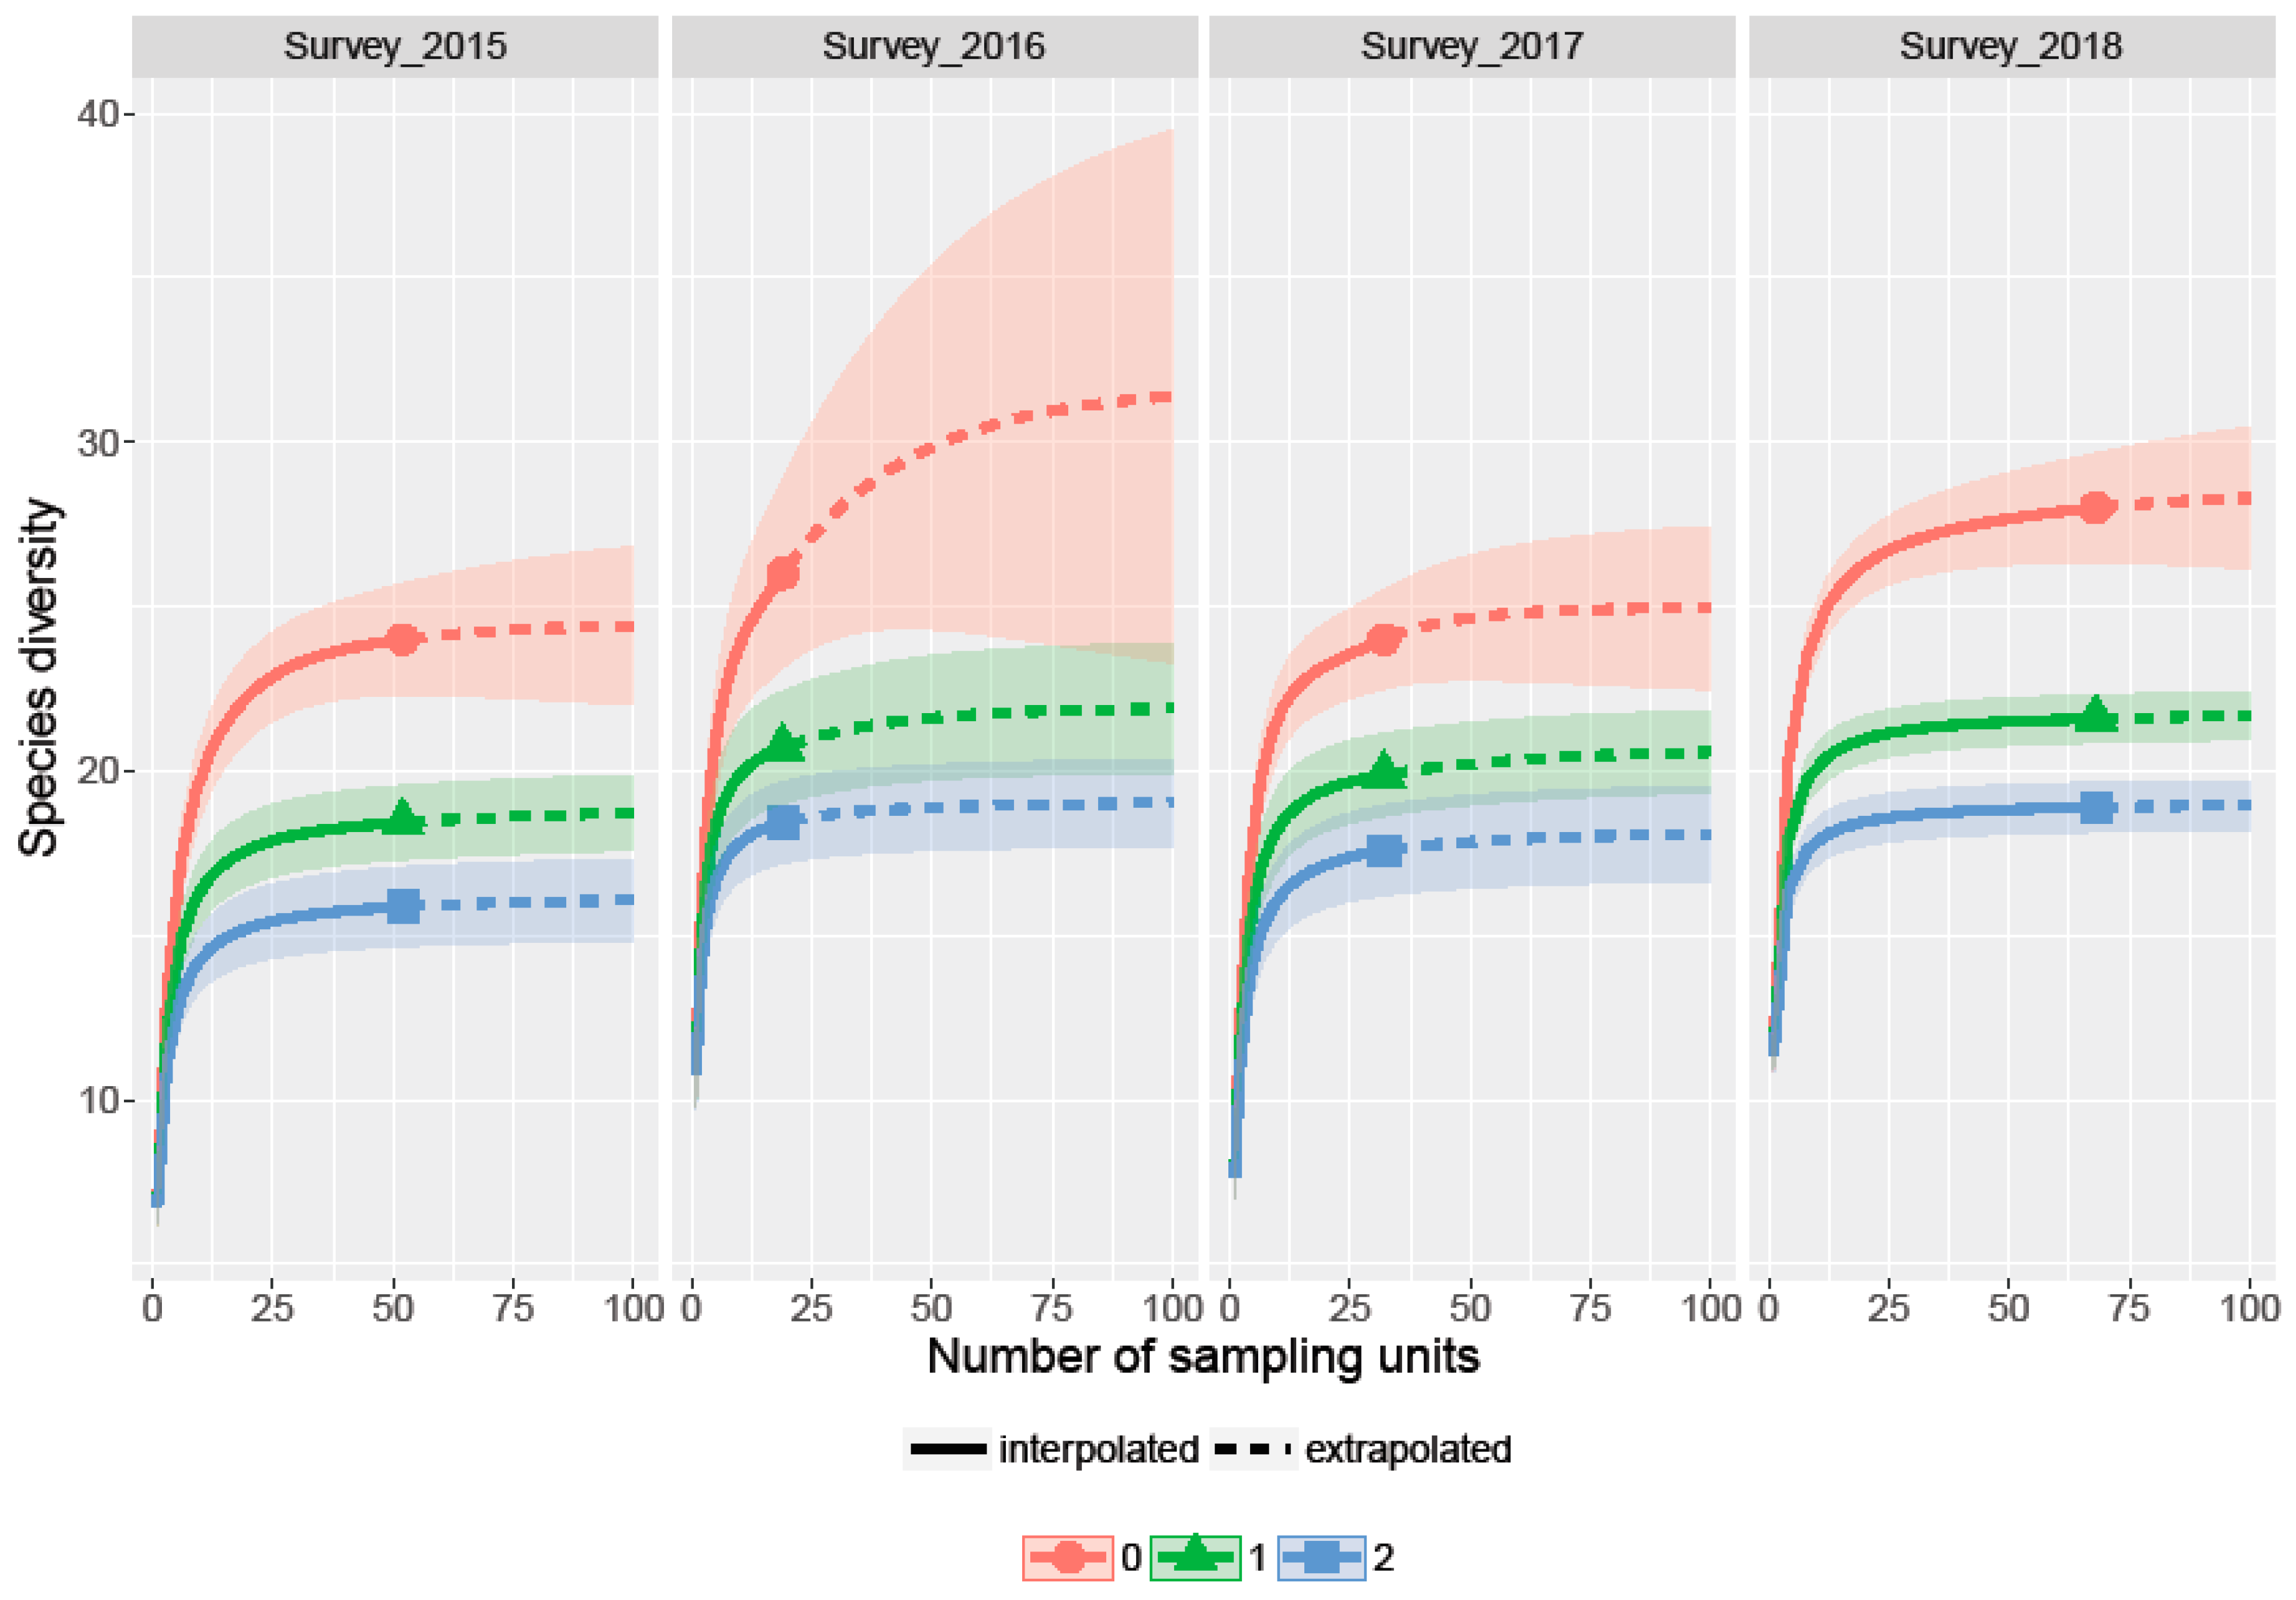
The incidence-based species richness (SR) analysis showed an estimated SR of 24 for the 2015 and 2017 surveys, which are the Cuito river and Cubango river to Delta transects. The SR for the 2016 survey was 26 (Cuanavale river transect) and the SR for the 2017 survey was the highest with 27 species along the Kembo and Cuando river transects (Figure 3).
The Cuanavale river was the shortest transect and the only survey where rarefaction showed very broad confidence intervals indicating that sampling might not have been complete. Likewise, Shannon and Simpson diversity indices were highest for the 2016 and 2018 surveys, while Simpson’s concentration index generally showed slightly lower species diversity than Shannon’s entropy index (Figure 3).
3.3. Community Structure
In the Okavango Basin, the overall bat functional guild was dominated by 16 clutter-edge species of the Families Vespertilionidae and Miniopteridae, followed by 10 open-air foraging species of the Families Molossidae and Emballanuridae, and only three ‘clutter’ feedings bats; Kerivoula argentata, Macronycteris vittatus and Rhinolophus fumigatus (Table 1). While K. argentata was recorded quite commonly in all four years, M. vittatus was only recorded during four nights, and R. fumigatus only once.
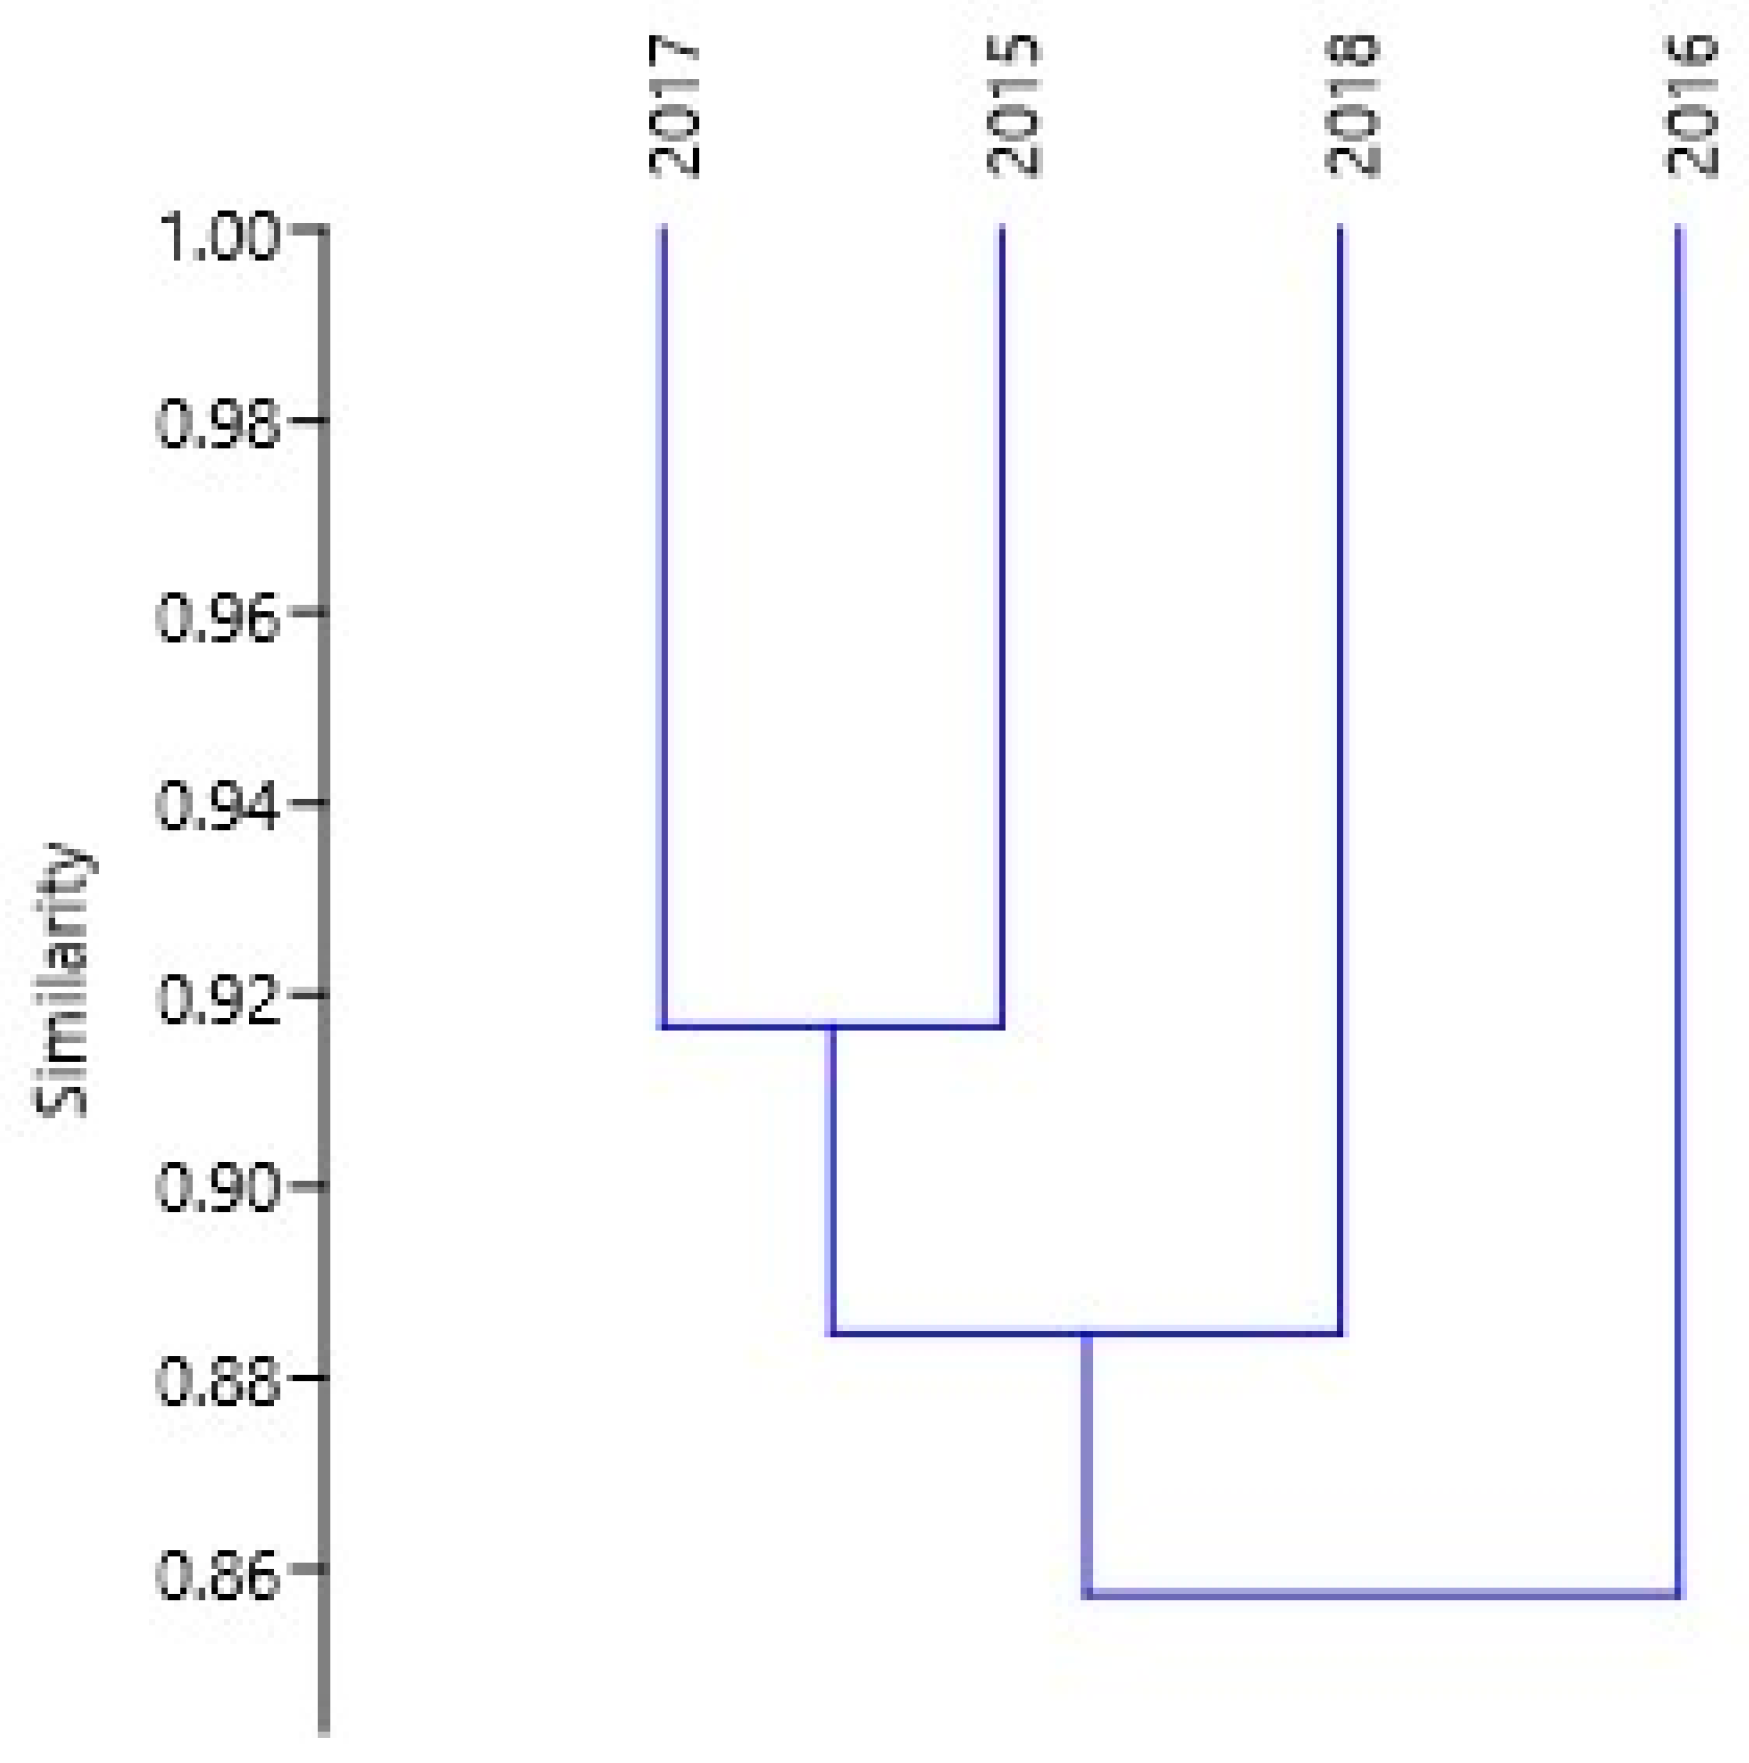
Species composition did not vary much across the Okavango Basin region, as reflected by the different surveys, which corresponded broadly with major river systems. The major river systems are: the Cubango River in the west (surveyed in 2017), the Cuito-Okavango Rivers (surveyed in 2015) and the Cuanavale River (surveyed in 2016) originating in the central Angolan highlands, and the Kembo-Cuando Rivers in south-eastern Angola (surveyed in 2018). Based on Bray–Curtis similarities from species presences/absences in the different surveys (Figure A1), the most similar communities (from 2015 and 2017, representing the western-most Cubango and Cuito-Okavango Rivers) shared 92% of species, while the most distinct (Cuanavale from 2016) shared 86% of species with the other surveys/rivers. Although the incidence of species varied between years (with more nights recorded in 2018), the relative order of species incidences was similar between years, with the same 10–15 species being co-dominant throughout and a relative gradual decline in incidence from more common to less common species (no species were highly dominant). The top most abundant 19 species were present in all surveys; after that, less common species tended to occur only in three or fewer surveys.
4. Discussion
4.1. Effect of Elevation, Climate and Terrestrial Ecoregion
Our results show a monotonic decline in the number of bat species recorded, correlated with decreasing minimum temperatures and increasing elevation, with highest richness recorded at elevations below 1000 m a.s.l. and minimum temperatures of over 7 °C. This is in line with the prediction of McCain [12] suggesting a monotonic decline in species richness at elevational gradients in tropical regions linked to high water availability and temperatures, while mid-elevational richness peaks are more common in temperate regions. However, in contrast to previous studies looking at elevational gradients of bats in Africa [7,8,10], water was available consistently on our transects, extending from the source lakes in the Angolan highlands to the Okavango Delta in Namibia.
Annual precipitation had to be excluded from the global model because of its multicollinearity with other variables but it is strongly reflected in the terrestrial ecoregions (Table 3), to which bat richness responded significantly. Angolan Miombo Woodlands, which have the highest mean annual precipitation (also see [1]), also showed significantly higher species richness than the five other ecoregions of the study area (Figure 2). We believe that Angolan Miombo Woodlands may provide a wider range of habitat features. Roosting availability in large old trees in the Miombo (gallery) forest patches are especially suitable for clutter and clutter-edge feeding guilds [15] and provided more roosting habitat than in the other ecoregions along the transects to the Okavango Delta. Our results are consistent with previous studies that found elevational patterns in bat species distribution to be correlated to vegetation type and/or measures of habitat structure [7,8,10,47,48]. As suggested by McCain [12], temperature affects bat species and their distribution patterns in two ways, directly (physiological) and indirectly (resources). We, therefore, suggest that the increase in the number of bat species recorded with higher minimum temperatures might have been influenced by lower insect abundance but also higher thermoregulatory constraints in colder areas. These variables should be taken into account in future studies.
4.2. Biogeographical Aspects
The community of bats from the Okavango River Basin was noticeably depauperate in clutter-feeding bats of the families Rhinolophidae and Hipposideridae, with only one species of each family, R. fumigatus and M. vittatus uncommonly recorded during the surveys. These two species are relatively large-sized, representing the second-largest and largest members of the genera in southern Africa, respectively. Although both families have much lower detection distances than other families such as the Vespertilionidae [49], they are typically still recorded in much higher abundances and richness than it was the case in our study [10,31,50]. The reason for the low abundance and the absence of smaller species of these two families is unclear. The Angola Miombo Woodlands, which are the dominant vegetation type surveyed, contain large stretches of woodlands. These intact canopies could have favored foraging by these clutter-feeding species. However, from Monadjem et al. [15], based on collecting records, no additional species of Rhinolopidae, Hipposideridae or Rhinoncyteridae, are expected to occur in the central Angolan highlands (see also Taylor et al. [14]). The range of members of these obligate cave-roosting genera are more typically associated with south-eastern Africa and particularly in the vicinity of rugged and mountainous areas (e.g., associated with the African Rift Valley and Great Escarpment), providing suitable caves and crevices for roosting [2,51]. The absence of mountains and caves in the central Angolan highlands could, therefore, explain their relative absence and low abundance [15].
The absence of high-frequency echolocating rhinolophid and hipposiderid bats in our study may provide a vacant dietary niche, which could be occupied by the high-frequency echolocating members of the vespertilionid genus Kerivoula (woolly bats) that were recorded with relatively high incidence (recorded on 65 nights) during our surveys. A similar situation was reported by Foord et al. [52], where the absence of Rhinolophus and Hipposideros bats in villages in northern Limpopo, South Africa due to anthropogenic disturbance, seemed to be associated with an increase in activity of bats of the genus Kerivoula. Species of Kerivoula have been observed roosting in both sociable (Philetairus socius, Ploceidae) and spectacled weaver (Ploceus ocularis, Ploceidae) bird nests and the ubiquitous presence of the latter and their nests probably provide numerous roosting opportunities. Other ‘exploiter species’ (e.g., Neoromicia capensis) that can occupy anthropogenic environments typically belonging to open and edge space foraging guilds, with flexible roosting preferences [53] will also likely increase in abundance and distribution range as the presence and impact of humans expands throughout the Angolan Miombo woodland.
In contrast to the rarity of rhinolophid and hipposiderid bats in Miombo Woodlands, the clutter-edge guild, small-sized vespertilionid bats, such as Pipistrellus cf. hesperidus, P. rusticus, Hypsugo anchietae, N. capensis and Neoromicia zuluensis, were extremely common in these surveys, both based on captures by Taylor et al. [14] and our acoustic data. Their abundance reflects on their flexible roosting preferences; roosting in trees, in hollows and under loose bark [15], exploiting a wider range of novel habitats. Similarly, Laephotis angolensis was recorded quite frequently in all surveys (between seven and 16 nights per survey) except for the 2017 Cubango River transect where it was recorded in only one night.
Although typically associated with rocky crevices, some molossids, such as Chaerephon nigeriae, C. pumilus and Mops condylurus are also known to roost under the loose bark of trees, which may explain their relatively high incidence in our study [15]. Two molossid species, Otomops martiensseni and Mops midas were quite frequently recorded in the 2017 Cubango River survey (9 and 13 nights respectively) but only very rarely recorded elsewhere (one night only for both species during the Cuanavale 2016 survey), suggesting their distribution may be more westerly centered in Central Angola. The apparent higher abundances of molossids might also be due to their increased maximum detection distances [49]. The Molossidae are, however, easily under sampled by capture techniques because they forage high above the vegetation [54]. The current study, therefore, supports other studies in Southern Africa (e.g., [55,56]) that advocate the use of bat detectors combined with captures to significantly increase inventory completeness [49].
4.3. Bat Activity as a Control Variable
Due to sampling limitations of this long-term and large scale study, the data collected were likely biased in sampling effort (e.g., the number of hours of recordings per night varied from 1–2 h to complete nights) and sampling techniques (different bat detectors). Although rarefaction curves leveled off, the confidence levels for 2016 were very wide (±7 species; Figure 3), suggesting additional sampling effort should focus on the Cuanavale river transect. As all recordings of echolocation calls have been converted to zero-crossing files, the main differences in sampling techniques is related to bat detector design. In comparison, the AnabatSD2 detector was used with the ‘AnaBat stainless steel microphone’ recording directional signals up to 200 kHz, while the SM4BAT+ detector with the ‘SMM-U1’ microphone records omni-directional up to 500 kHz [57,58]. We, therefore, decided to take a cautious approach in using the number of passes (bat activity) as a random factor in our analysis to control for a bias in sampling effort instead of ´true activity levels´ [59].
5. Conclusions
The acoustic data presented in this study, supported by specimen records (Table 1), extend the distribution of several bat species not previously recorded from the Angolan highlands, e.g., P. cf hesperidus, C. pumilus and M. condylurus. The multiple scales at which environmental predictors act on bat communities allowed us insight into the ‘hierarchical spatio-temporal distribution [51]´ of echolocating bats in the Okavango River Basin. Elevation and temperature seemed to have an effect across all scales, in this heterogeneous landscape. As suggested for Southern African savannahs generally [51], the high richness reported here across the various terrestrial savannah ecoregions reflects the prominent role that warm and stable climates and intact areas with high habitat heterogeneity play in the support of taxonomic and phylogenetic diversity. Compared to the 71 species estimated to occur in Angola as a whole [14], we confirmed 44% of this richness to occur in the Okavango River Basin. We assume future studies will increase this number. Changes in habitat heterogeneity, through human associated land-use changes will have detrimental effects on species richness of bats (and other species) and weaken the relationship between biotic and abiotic elements [51,60]. The well-established homogenization of landscape features (plant and animal communities) associated with human land-use and specifically agriculture [52,60] must be mediated in a system such as the Angolan Miombo woodland. The paucity of one feeding guild (clutter feeding, slow-flying rhinolophid and hipposiderid bats) in the Okavango Basin in our study, however, seems unrelated to any anthropogenic effects but rather to broader scale factors related to geology and the absence of roosting opportunities for these species.
Supplementary Materials
The following are available online at https://www.mdpi.com/1424-2818/12/5/188/s1, Table S1. Summary of call parameters for all bat species recorded in the Okavango River Basin, obtained from Analook W3.8. Whereas, (N) refers to the number of total calls used for these statistics and (n) to the number of individuals or recording sequences. Figure S1: Examples of sonograms obtained in AnalookW for each species defined from acoustic surveys of the Okavango basin using files obtained directly from Titley ANABAT SD1 and SD2 detectors or converted from wav or wac files obtained from Wildlife Acoustic Echo Meter 3 or Song Meter 2+ bat detectors.
Author Contributions
Methodology, S.M.W. and P.J.T.; data curation, G.G.N. and P.J.T.; writing—original draft preparation, S.M.W.; writing—review and editing, All Authors; project administration, G.G.N.; funding acquisition, G.G.N. All authors have read and agreed to the published version of the manuscript.
Funding
This study was fully supported and funded by the National Geographic Society through the Okavango Wilderness Project, under the logistical support of the Wild Bird Trust.
Acknowledgments
We thank the Angolan National Institute for Biodiversity and Conservation Areas (INBAC) for permission to conduct research and collect mammals in Angola (Permit Numbers 34/INBAC.MINAMB/ 2016 and 35/INBAC.MINAMB/2016). P.J.T. and S.M.W. acknowledge the support of the National Research Foundation and Department of Science and Technology through the South African Research Chair on Biodiversity Value and Change, hosted by University of Venda and cohosted by the Centre for Invasion Biology at Stellenbosch University (Grant No. 87311). M.K. acknowledge the support provided by the Eugène Marias Chair for Wildlife Management, University of Pretoria. We would also like to thank the three anonymous Reviewers, who provided detailed and constructive input, which substantially improved our work.
Conflicts of Interest
The authors declare no conflict of interest.
Appendix A
Figure A1.
UPGMA (unweighted pair group method with arithmetic mean) dendrogram showing Bray–Curtis similarity of bat communities from each survey/year based on presence/absence of 31 bat species.
Figure A1.
UPGMA (unweighted pair group method with arithmetic mean) dendrogram showing Bray–Curtis similarity of bat communities from each survey/year based on presence/absence of 31 bat species.

References
- Huntley, B.J.; Russo, V.; Lages, F.; Ferrand, N. Biodiversity of Angola: Science & Conservation: A Modern Synthesis; Springer: Cham, Switzerland, 2019; p. 552. ISBN 978-3-030-03083-4. [Google Scholar] [CrossRef] [Green Version]
- Cooper-Bohannon, R.; Rebelo, H.; Jones, G.; Cotterill, F.P.D.; Monadjem, A.; Schoeman, M.C.; Taylor, P.J.; Park, K.J. Predicting bat distributions and diversity hotspots in Southern Africa. Hystrix 2016, 27, 1. [Google Scholar] [CrossRef]
- Schoeman, M.C.; Cotterill, F.; Taylor, P.J.; Monadjem, A. Using potential distributions to explore environmental correlates of bat species richness in southern Africa: Effects of model selection and taxonomy. Curr. Zool. 2013, 59, 279–293. [Google Scholar] [CrossRef] [Green Version]
- Herkt, K.M.B.; Barnikel, G.; Skidmore, A.K.; Fahr, J. A high-resolution model of bat diversity and endemism for continental Africa. Ecol. Modell. 2016, 320, 9–28. [Google Scholar] [CrossRef]
- Pio, D.V.; Engler, R.; Linder, H.P.; Monadjem, A.; Cotterill, F.P.; Taylor, P.J.; Schoeman, M.C.; Price, B.W.; Villet, M.H.; Eick, G. Climate change effects on animal and plant phylogenetic diversity in southern Africa. Glob. Chang. Biol. 2014, 20, 1538–1549. [Google Scholar] [CrossRef]
- Clausnitzer, V.; Kityo, R. Altitudinal distribution of rodents (Muridae and Gliridae) on Mt Elgon, Uganda. Trop. Zool. 2001, 14, 95–118. [Google Scholar] [CrossRef]
- Curran, M.; Kopp, M.; Beck, J.; Fahr, J. Species diversity of bats along an altitudinal gradient on Mount Mulanje, southern Malawi. J. Trop. Ecol. 2012, 28, 243–253. [Google Scholar] [CrossRef] [Green Version]
- Linden, V.M.; Weier, S.M.; Gaigher, I.; Kuipers, H.J.; Weterings, M.J.; Taylor, P.J. Changes of bat activity, species richness, diversity and community composition over an altitudinal gradient in the Soutpansberg range, South Africa. Acta Chiropt. 2014, 16, 27–40. [Google Scholar] [CrossRef]
- Taylor, P.; Munyai, A.; Gaigher, I.; Baxter, R. Afromontane small mammals do not follow the hump-shaped rule: Elevational variation in a tropical biodiversity hotspot (Soutpansberg Mountains, South Africa). J. Trop. Ecol. 2015, 31, 37–48. [Google Scholar] [CrossRef]
- Weier, S.M.; Linden, V.M.; Gaigher, I.; White, P.J.; Taylor, P.J. Changes of bat species composition over altitudinal gradients on northern and southern aspects of the Soutpansberg mountain range, South Africa. Mammalia 2017, 81, 49–60. [Google Scholar] [CrossRef] [Green Version]
- McCain, C.M. Elevational gradients in diversity of small mammals. Ecology 2005, 86, 366–372. [Google Scholar] [CrossRef]
- McCain, C.M. Could temperature and water availability drive elevational species richness patterns? A global case study for bats. Glob. Ecol. Biogeogr. 2007, 16, 1–13. [Google Scholar] [CrossRef]
- Okavango Wilderness Project. Available online: https://www.nationalgeographic.org/projects/okavango/ (accessed on 20 March 2020).
- Taylor, P.J.; Neef, G.; Keith, M.; Weier, S.; Monadjem, A.; Parker, D.M. Tapping into technology and the biodiversity informatics revolution: updated terrestrial mammal list of Angola, with new records from the Okavango Basin. Zookeys 2018, 10, 51–88. [Google Scholar] [CrossRef]
- Monadjem, A.; Taylor, P.J.; Cotterill, F.D.P.; Schoeman, M.C. Bats of Southern and Central Africa: A Biographic and Taxonomic Synthesis; Wits University Press: Johannesburg, South Africa, 2010; p. 596. ISBN 978-1-86814-508-9. [Google Scholar]
- Beja, P.; Vaz Pinto, P.; Verissimo, L.; Bersacola, E.; Fabiano, E.; Palmeirim, J.M.; Monadjem, A.; Monterroso, P.; Svensson, M.; Taylor, P.J. The Mammals of Angola. In Biodiversity of Angola; Huntley, B.J., Russo, V., Lages, F., Ferrand, N., Eds.; Springer: Cham, Switzerland, 2019; pp. 357–444. ISBN 978-3-030-03083-4. [Google Scholar] [CrossRef] [Green Version]
- Smith, A.; Schoeman, M.C.; Keith, M.; Erasmus, B.F.; Monadjem, A.; Moilanen, A.; Di Minin, E. Synergistic effects of climate and land-use change on representation of African bats in priority conservation areas. Ecol. Indic. 2016, 69, 276–283. [Google Scholar] [CrossRef] [Green Version]
- Goyder, D.J.; Barker, N.; Bester, S.P.; Frisby, A.; Janks, M.; Gonçalves, F.M. The Cuito catchment of the Okavango system: A vascular plant checklist for the Angolan headwaters. PhytoKeys 2018, 113, 1–31. [Google Scholar] [CrossRef] [PubMed] [Green Version]
- Jones, G.; Jacobs, D.S.; Kunz, T.H.; Willig, M.R.; Racey, P.A. Carpe noctem: the importance of bats as bioindicators. Endanger. Species Res. 2009, 8, 93–115. [Google Scholar] [CrossRef] [Green Version]
- Russo, D.; Jones, G. Bats as bioindicators: an introduction. Mamm. Biol. 2015, 80, 157–158. [Google Scholar] [CrossRef] [Green Version]
- Russo, D.; Voigt, C.C. The use of automated identification of bat echolocation calls in acoustic monitoring: A cautionary note for a sound analysis. Ecol. Indic. 2016, 66, 598–602. [Google Scholar] [CrossRef]
- Mickleburgh, S.P.; Hutson, A.M.; Racey, P.A. A review of the global conservation status of bats. Oryx 2002, 36, 18–34. [Google Scholar] [CrossRef] [Green Version]
- Jones, K.; Russ, J.; Bashta, A.; Bilhari, Z.; Catto, C.; Csosz, I.; Gorbachev, A.; Gyorfi, P.; Hughes, A.; Ivashkiv, I.; et al. Indicator bats program: A system for the global acoustic monitoring of bats. In Biodiversity Monitoring and Conservation: Bridging the Gap between Global Commitment and Local Action; Collen, B., Durant, S.M., Baillie, J.E.M., Pettorelli, N., Eds.; John Wiley and Sons, Ltd: Chichester West Sussex, UK, 2013; pp. 211–247. ISBN 978-1-4443-3291-9. [Google Scholar]
- Russo, D.; Ancillotto, L. Sensitivity of bats to urbanization: a review. Mamm. Biol. 2015, 80, 205–212. [Google Scholar] [CrossRef]
- Luck, G.W.; Smallbone, L.; Threlfall, C.; Law, B. Patterns in bat functional guilds across multiple urban centres in south-eastern Australia. Landsc. Ecol. 2013, 28, 455–469. [Google Scholar] [CrossRef]
- Linden, V.M.; Grass, I.; Tscharntke, T.; Weier, S.M.; Taylor, P.J. Bat guilds and their pest control in macadamia landscapes exhibit contrasting responses to natural habitat. Biol. Conserv. under review.
- Shapiro, J.T.; Monadjem, A.; Röder, T.; McCleery, R.A. Response of bat activity to land cover and land use in savannas is scale-, season-, and guild-specific. Biol. Conserv. 2020, 241, 108245. [Google Scholar] [CrossRef]
- Jung, K.; Threlfall, C.G. Urbanisation and Its Effects on Bats—A Global Meta-Analysis. In Bats in the Anthropocene: Conservation of Bats in a Changing World; Voigt, C.C., Kingston, T., Eds.; Springer: Cham, Switzerland, 2016; pp. 13–33. [Google Scholar] [CrossRef]
- ANABAT. Available online: http://users.lmi.net/corben/ (accessed on 19 December 2018).
- Rydell, J.; Nyman, S.; Eklöf, J.; Jones, G.; Russo, D. Testing the performances of automated identification of bat echolocation calls: A request for prudence. Ecol. Indic. 2017, 78, 416–420. [Google Scholar] [CrossRef] [Green Version]
- Taylor, P.J.; Sowler, S.; Schoeman, M.C.; Monadjem, A. Diversity of bats in the Soutpansberg and Blouberg Mountains of northern South Africa: complementarity of acoustic and non-acoustic survey methods. Afr. J. Wildl. Res. 2013, 43, 12–26. [Google Scholar] [CrossRef] [Green Version]
- Happold, M.; Happold, D.C. Hedgehogs, Shrews and Bats. In Mammals of Africa Volume IV; Bloomsbury Publishing: London, UK, 2013; p. 800. ISBN 978-1-4081-2254-9. [Google Scholar]
- QGIS Geographic Information System. Available online: http://qgis.osgeo.org (accessed on 17 January 2018).
- Fleming, G. SACRS.md. Available online: https://gist.github.com/gubuntu/6403425 (accessed on 3 January 2018).
- WorldClim. Available online: https://www.worldclim.org/ (accessed on 17 December 2019).
- Olson, D.M.; Dinerstein, E.; Wikramanayake, E.D.; Burgess, N.D.; Powell, G.V.; Underwood, E.C.; D’amico, J.A.; Itoua, I.; Strand, H.E.; Morrison, J.C. Terrestrial Ecoregions of the World: A New Map of Life on EarthA new global map of terrestrial ecoregions provides an innovative tool for conserving biodiversity. BioScience 2001, 51, 933–938. [Google Scholar] [CrossRef]
- The R Project for Statistical Computing. Available online: https://www.R-project.org/ (accessed on 3 July 2017).
- Fitting linear mixed-effects models using lme4. Available online: https://arxiv.org/pdf/1406.5823.pdf (accessed on 13 January 2020).
- Performance: Assessment of Regression Models Performance. Available online: https://rdrr.io/cran/performance/ (accessed on 2 January 2019).
- Multi-Model Inference. Available online: https://CRAN.Rproject.org/package=MuMIn (accessed on 13 October 2018).
- Fox, J.; Hong, J. Effect displays in R for multinomial and proportional-odds logit models: Extensions to the effects package. J. Stat. Softw. 2009, 32, 1–24. [Google Scholar] [CrossRef] [Green Version]
- Hothorn, T.; Bretz, F.; Westfall, P. Simultaneous inference in general parametric models. J. Math Meth. Biosci. 2008, 50, 346–363. [Google Scholar] [CrossRef] [Green Version]
- Chao, A.; Gotelli, N.J.; Hsieh, T.C.; Sander, E.L.; Ma, K.H.; Colwell, R.K.; Ellison, A.M. Rarefaction and extrapolation with Hill numbers: a framework for sampling and estimation in species diversity studies. Ecol. Monogr. 2014, 84, 45–67. [Google Scholar] [CrossRef] [Green Version]
- Hsieh, T.; Ma, K.; Chao, A. iNEXT: an R package for rarefaction and extrapolation of species diversity (H ill numbers). Meth. Ecol. Evol. 2016, 7, 1451–1456. [Google Scholar] [CrossRef]
- Colwell, R.K.; Chao, A.; Gotelli, N.J.; Lin, S.-Y.; Mao, C.X.; Chazdon, R.L.; Longino, J.T. Models and estimators linking individual-based and sample-based rarefaction, extrapolation and comparison of assemblages. Plant Ecol. 2012, 5, 3–21. [Google Scholar] [CrossRef] [Green Version]
- Hsieh, T.; Ma, K.; Chao, A. iNEXT: iNterpolation and EXTrapolation for species diversity. R package version 2016, 2, 1–18. [Google Scholar]
- López-González, C.; Presley, S.J.; Lozano, A.; Stevens, R.D.; Higgins, C.L. Metacommunity analysis of Mexican bats: environmentally mediated structure in an area of high geographic and environmental complexity. J. Biogeogr. 2012, 39, 177–192. [Google Scholar] [CrossRef]
- Jaberg, C.; Guisan, A. Modelling the distribution of bats in relation to landscape structure in a temperate mountain environment. J. Appl. Ecol. 2001, 38, 1169–1181. [Google Scholar] [CrossRef]
- Monadjem, A.; Shapiro, J.T.; Mtsetfwa, F.; Reside, A.E.; McCleery, R.A. Acoustic Call Library and Detection Distances for Bats of Swaziland. Acta Chiropt. 2017, 19, 175–187. [Google Scholar] [CrossRef]
- Linden, V.M.G.; Grass, I.; Joubert, E.; Tscharntke, T.; Weier, S.M.; Taylor, P.J.; Struebig, M. Ecosystem services and disservices by birds, bats and monkeys change with macadamia landscape heterogeneity. J. Appl. Ecol. 2019, 56, 2069–2078. [Google Scholar] [CrossRef]
- Schoeman, M.C.; Monadjem, A. Community structure of bats in the savannas of southern Africa: Influence of scale and human land use. Hystrix 2018, 29, 3–10. [Google Scholar]
- Foord, S.H.; Swanepoel, L.H.; Evans, S.W.; Schoeman, C.S.; Erasmus, B.F.N.; Schoeman, M.C.; Keith, M.; Smith, A.; Mauda, E.V.; Maree, N.; et al. Animal taxa contrast in their scale-dependent responses to land use change in rural Africa. PLoS ONE 2018, 13, 5. [Google Scholar] [CrossRef] [PubMed] [Green Version]
- Jung, K.; Threlfall, C.G. Trait-dependent tolerance of bats to urbanization: a global meta-analysis. Proc. R Soc. B 2018, 285, 20181222. [Google Scholar] [CrossRef] [Green Version]
- MacSwiney G, M.C.; Clarke, F.M.; Racey, P.A. What you see is not what you get: the role of ultrasonic detectors in increasing inventory completeness in Neotropical bat assemblages. J. Appl. Ecol. 2008, 45, 1364–1371. [Google Scholar] [CrossRef]
- Adams, R.; Kwiecinski, G. Sonar Surveys for Bat Species Richness and Activity in the Southern Kalahari Desert, Kgalagadi Transfrontier Park, South Africa. Diversity 2018, 10, 103. [Google Scholar] [CrossRef] [Green Version]
- Parker, D.M.; Bernard, R.T.F. The use of acoustic detectors for assessing bat species richness and functional activity in a South African National Park. Mammalia 2018, 83, 53–63. [Google Scholar] [CrossRef]
- Adams, A.M.; Jantzen, M.K.; Hamilton, R.M.; Fenton, M.B. Do you hear what I hear? Implications of detector selection for acoustic monitoring of bats. Meth. Ecol. Evol. 2012, 3, 992–998. [Google Scholar] [CrossRef]
- Wildlife Acoustics. Available online: https://www.wildlifeacoustics.com/images/documentation/SM4-BAT-ZC-USER-GUIDE.pdf (accessed on 24 February 2020).
- Harrison, X.A.; Donaldson, L.; Correa-Cano, M.E.; Evans, J.; Fisher, D.N.; Goodwin, C.E.; Robinson, B.S.; Hodgson, D.J.; Inger, R. A brief introduction to mixed effects modelling and multi-model inference in ecology. PeerJ 2018, 6, e4794. [Google Scholar] [CrossRef] [PubMed] [Green Version]
- Vellend, M.; Verheyen, K.; Flinn, K.M.; Jacquemyn, H.; Kolb, A.; Van Calster, H.; Peterken, G.; Graae, B.J.; Bellemare, J.; Honnay, O. Homogenization of forest plant communities and weakening of species–environment relationships via agricultural land use. J. Ecol. 2007, 95, 565–573. [Google Scholar] [CrossRef]
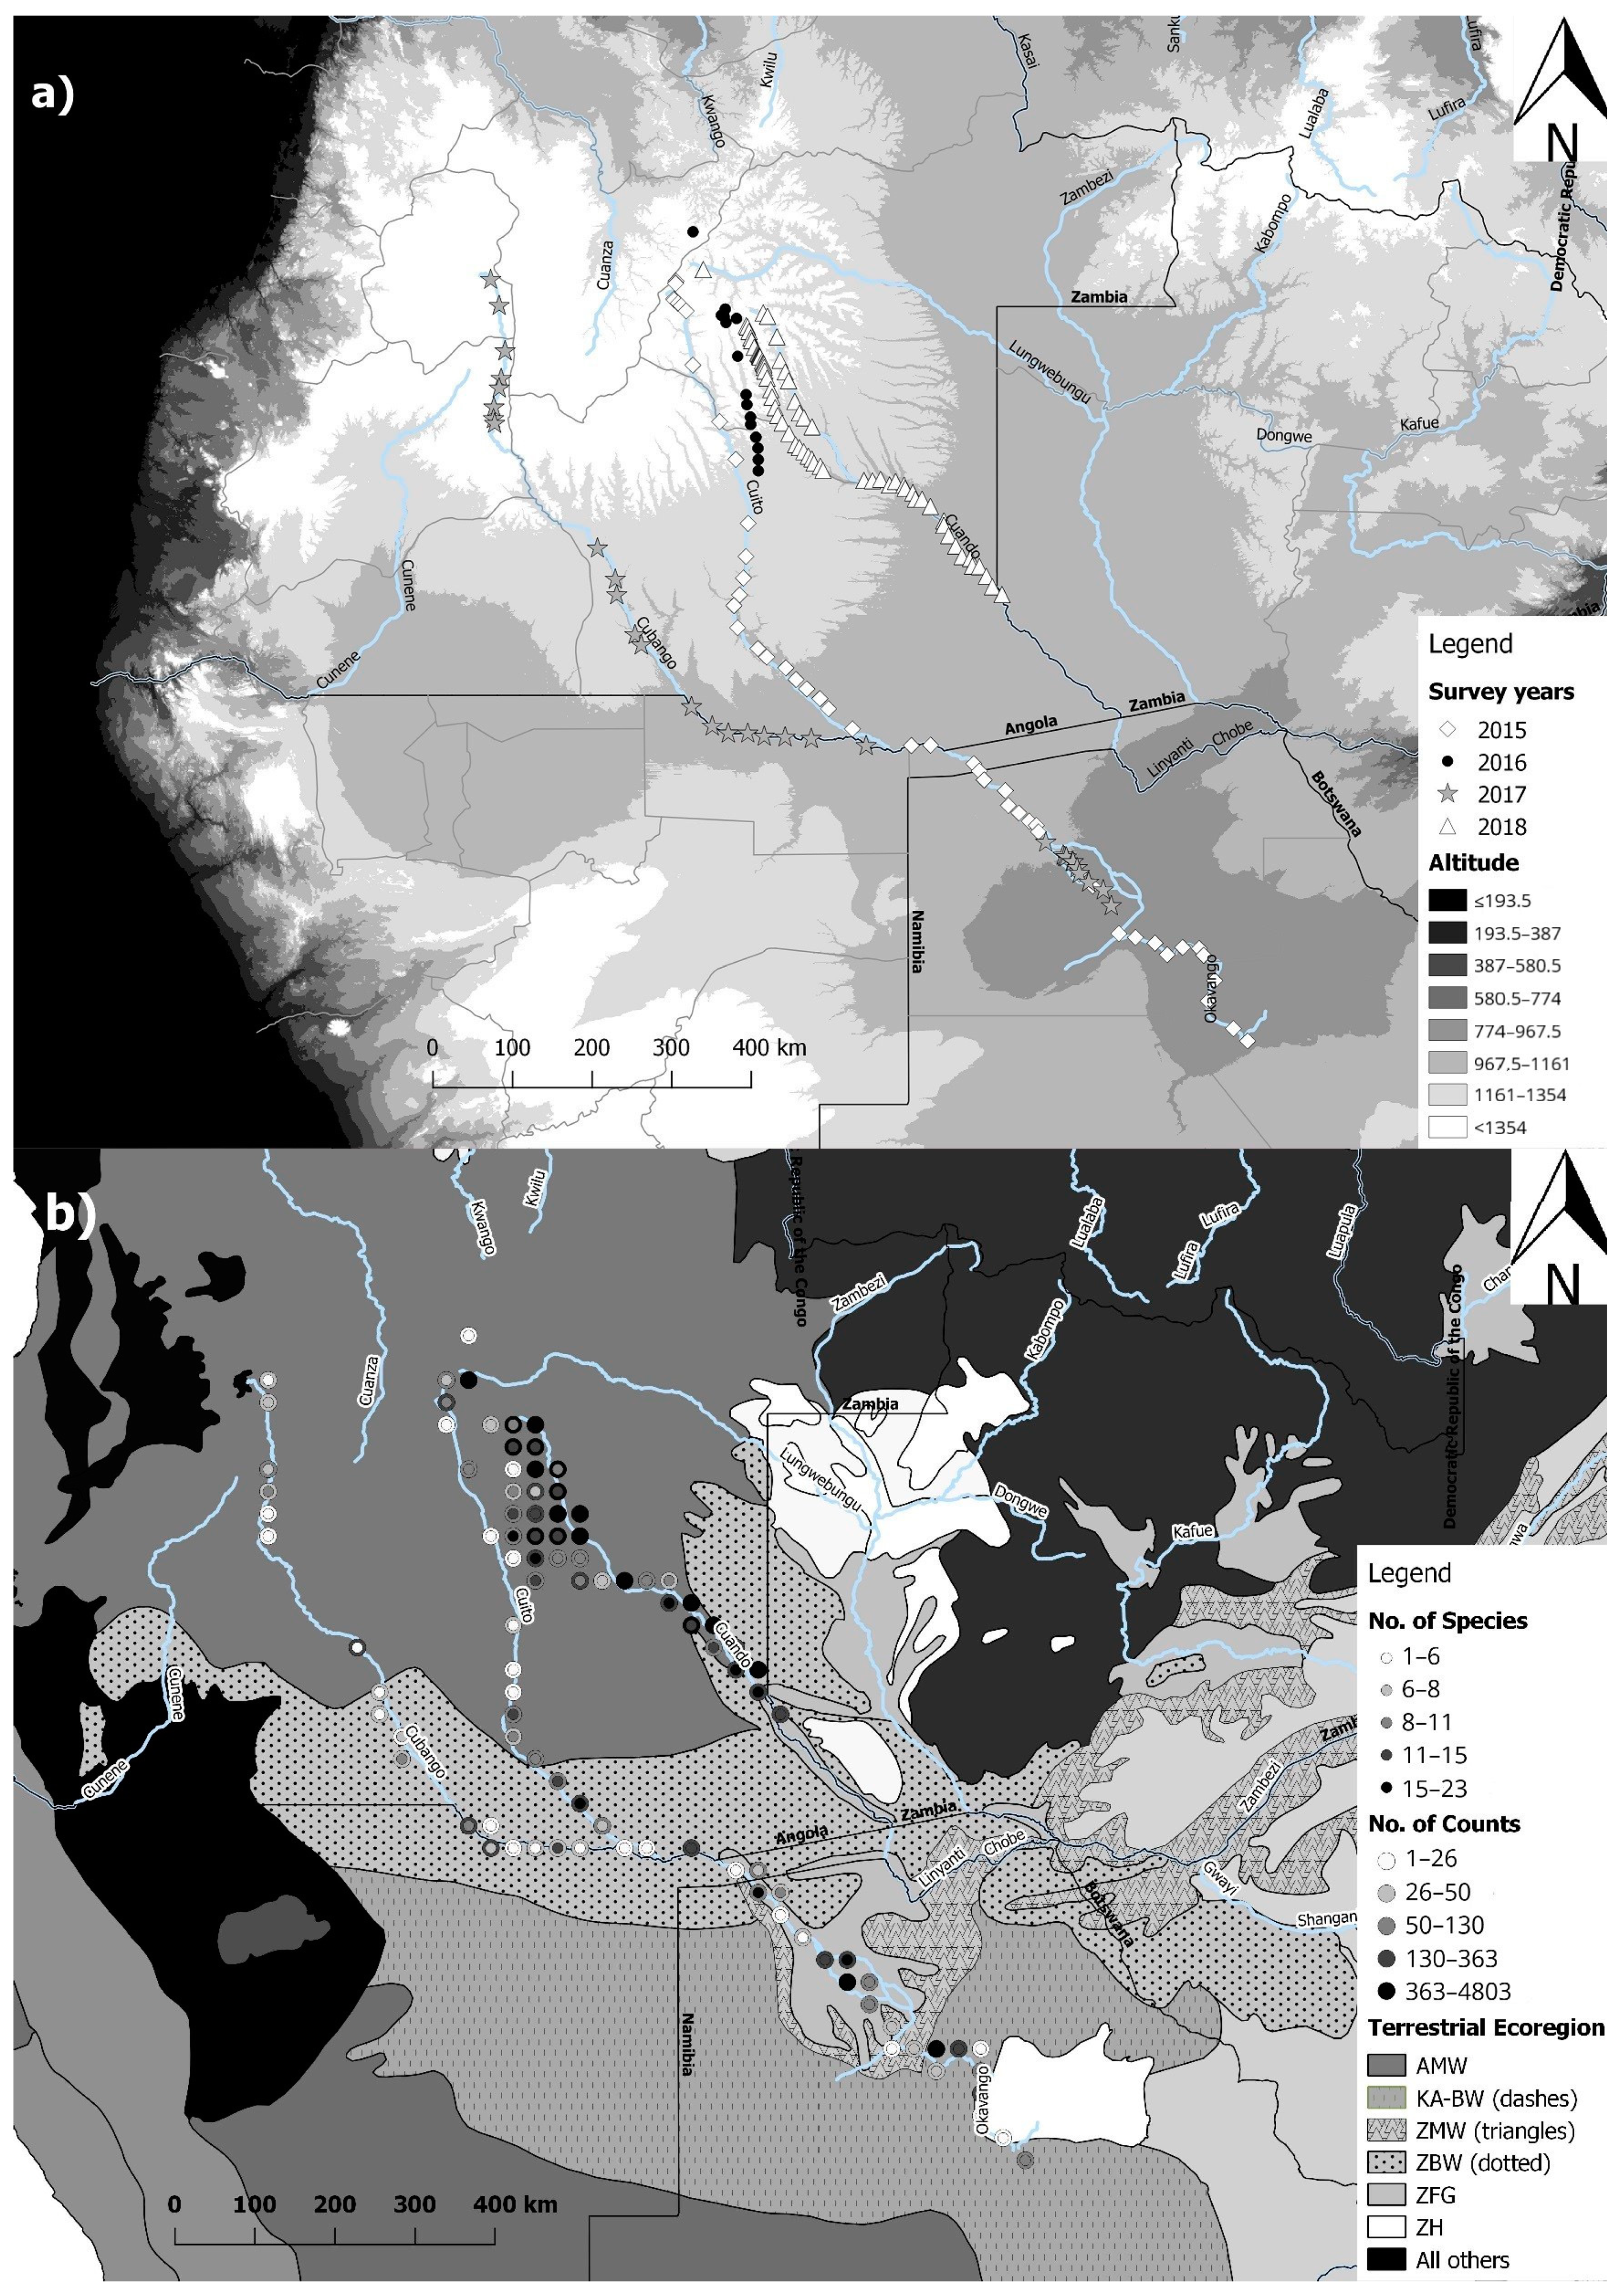
Figure 1.
Map showing (a) the four different survey years and transect over elevation and (b) the differences in number of bats species and number of passes recorded with bat detectors in the different ecoregions in the Okavango Basin of Angola, Namibia and Botswana (AMW = Angolan Miombo woodland; KA-BW = Kalahari Acacia-Baikiaea woodlands; ZMW = Zambezian and Mopane woodlands; ZBW = Zambezian Baikiaea woodlands; ZFG = Zambezian flooded grasslands; ZH = Zambezian halophytics).

Figure 2.
Recorded number of bat species in response to (a) elevation, (b) minimum temperature and (c) terrestrial ecoregion (different annotated letters showing a significant difference in species richness). AMW = Angolan Miombo woodland; KA-BW = Kalahari Acacia-Baikiaea woodlands; ZMW = Zambezian and Mopane woodlands; ZBW = Zambezian Baikiaea woodlands; ZFG = Zambezian flooded grasslands; ZH = Zambezian halophytics.

Figure 3.
Incidence based diversity estimates with respect to sample coverage (Hill numbers) in the four survey years showing: Upper line (0) Species richness, middle line (1) the exponential of Shannon’s entropy index and lower line (2) the inverse of Simpson’s concentration index.
Figure 3.
Incidence based diversity estimates with respect to sample coverage (Hill numbers) in the four survey years showing: Upper line (0) Species richness, middle line (1) the exponential of Shannon’s entropy index and lower line (2) the inverse of Simpson’s concentration index.


Table 1.
Updated putative bat species definitions based on analysis of bat calls from surveys in the Okavango catchment of Angola between 2015 and 2018. Matching of calls with species was based on release calls from bats captured [8] and released in Angola (for Laephotis angolensis, Neoromicia capensis, Pipistrellus rusticus and N. zuluensis) as well as [15,31,32] and unpublished data from PJT and Ara Monadjem. Species were assigned functional groups according to Monadjem et al. [15] based on their broad preferences for foraging habitats. The ‘overlap species’ refers to species that overlap in their call characteristics. Occurrence of species in Angola is shown based on evidence from specimens (based on the current survey, Global Biodiversity Information Facility (GBIF) records or listed as such by [14,15]) or only from the literature. The occurrence of a species is shown as ‘predicted’ where records are known from adjacent countries and high probabilities of occurrence were indicated for any part of Angola in maximum entropy modeling (MaxEnt for short) species models depicted in [15].
| Family | Species (Species Code) | Functional Group | Overlap Species | Occurrence in Angola | Caught during 2015–2018 | No. Recorded Calls/No. Recording Nights |
|---|---|---|---|---|---|---|
| Emballanuridae | Taphozous mauritianus (Tmaurit) | Open-air | C. pumilus, T. aegyptiaca | Specimen | No | 199/33 |
| Hipposideridae | Macronycteris vitattus (Hvit) | Clutter | None | Specimen | No | 5/4 |
| Rhinolophidae | Rhinolophus fumigatus (Rfum) | Clutter | None | Specimen | No | 1/1 |
| Miniopteridae | Miniopterus cf. fraterculus (Mfrat) | Clutter-edge | M. fraterculus, H. anchietae | No | No | 514/93 |
| Miniopterus natalensis (Mnatal) | Clutter-edge | P. rusticus, H. anchietae | Specimen | No | 56/24 | |
| Molossidae | Chaerephon ansorgei (Cansor) | Open-air | T. ventralis, C. nigeriae, T. fulminans | Specimen | No | 1265/75 |
| Chaerephon nigeriae (Cnig) | Open-air | T. ventralis, C. ansorgei, T. fulminans | Literature | Yes | 738/60 | |
| Chaerephon pumilus (Cpum) | Open-air | T. aegyptiaca, M. condylurus, T. mauritianus | Specimen | No | 991/79 | |
| Mops condylurus (Mcond) | Open-air | C. pumilus, T. aegyptiaca | Specimen | No | 293/61 | |
| Mops midas (Mmidas) | Open-air | C. nigeriae, O. martiensseni | Predicted | No | 49/15 | |
| Otomops martiensseni (Omops) | Open-air | Mop. midas | Specimen | No | 105/14 | |
| Tadarida aegyptiaca (Taegypt) | Open-air | T. mauritianus, C. pumilus | Specimen | No | 2367/94 | |
| Vespertilionidae | Eptesicus hottentotus (Ehott) | Clutter-edge | S. dingani, M. welwitschii | Specimen | No | 83/28 |
| Neoromicia anchietae (Hanch) | Clutter-edge | M. natalensis | Specimen | Yes | 273/58 | |
| Kerivoula argentata (Karg) | Clutter | Unknown Vesper75 | Predicted | No | 1069/72 | |
| Laephotis angolensis (Lang) | Clutter-edge | P. hesperidus | Specimen | Yes | 155/33 | |
| Myotis welwitschii (Mwel) | Clutter-edge | M. bocagii | Specimen | Yes | 12/7 | |
| Mimetillus thomasi | Clutter-edge | Not applicable | Specimen | Yes | No reference calls available | |
| Neoromica zuluensis (Nzulu) | Clutter-edge | P. hesperidus | Specimen | Yes | 2186/106 | |
| Neoromicia capensis (Ncap) | Clutter-edge | S. viridis, S. hindei/albigula, N. schlieffeni, Vansonia rueppellii | Specimen | Yes | 656/114 | |
| Neoromicia nana (Nnana) | Clutter-edge | Not applicable | Specimen | No | 224/46 | |
| Nycticeinops schlieffeni (Nschlief) | Clutter-edge | S. viridis, S. hindei/albigula, N. capensis | Specimen | No | 3909/157 | |
| Pipistrellus cf hesperidus (Phesp) | Clutter-edge | N. zuluensis, L. angolensis | Predicted | Yes | 9418/144 | |
| Pipistrellus rusticus (Prust) | Clutter-edge | M. natalensis | Predicted | Yes | 826/64 | |
| Scotophilus dinganii (Sding) | Clutter-edge | E. hottentotus, L. botswanae | Specimen | No | 146/70 | |
| Scotophilus leucogaster | Clutter-edge | Possibly N. schlieffeni, S. viridis, N. capensis | Specimen | Yes | No reference calls available |
Table 2.
Final (and global) generalized linear mixed model testing the relationship between the bat species richness in each grid cell and the terrestrial ecoregions, elevation and temperature in the Okavango Basin of Angola, Namibia and Botswana (significance level of bold p < 0.05).
Table 2.
Final (and global) generalized linear mixed model testing the relationship between the bat species richness in each grid cell and the terrestrial ecoregions, elevation and temperature in the Okavango Basin of Angola, Namibia and Botswana (significance level of bold p < 0.05).
| Title | Estimate | SE | Z | p-Value |
|---|---|---|---|---|
| Intercept (Angolan Miombo Woodlands) | 2.61 | 0.10 | 25.54 | 0.000 |
| Kalahari Acacia-Baikiaea woodlands | −0.78 | 0.27 | −2.82 | 0.004 |
| Zambezian and Mopane woodlands | −1.61 | 0.44 | −3.60 | 0.000 |
| Zambezian Baikiaea woodlands | −0.44 | 0.13 | −3.21 | 0.001 |
| Zambezian flooded grasslands | −0.52 | 0.21 | −2.43 | 0.014 |
| Zambezian halophytics | −1.42 | 0.37 | −3.79 | 0.000 |
| Elevation | −0.30 | 0.08 | −3.54 | 0.000 |
| Minimum Temperature | 0.10 | 0.04 | 2.30 | 0.021 |
Table 3.
Terrestrial ecoregions within the study area in the Okavango Basin of Angola, Namibia and Botswana, their conservation status and mean annual precipitation [36].
Table 3.
Terrestrial ecoregions within the study area in the Okavango Basin of Angola, Namibia and Botswana, their conservation status and mean annual precipitation [36].
| Terrestrial Ecoregion | Status | Precipitation |
|---|---|---|
| Angolan Miombo Woodlands | Vulnerable | 800 to 1400 mm |
| Kalahari Acacia-Baikiaea woodlands | Vulnerable | Up to 800 |
| Zambezian and Mopane woodlands | Vulnerable | Up to 800 |
| Zambezian Baikiaea woodlands | Vulnerable | Up to 800 |
| Zambezian flooded grasslands | Relatively Stable/Intact | 800 to 1000 mm |
| Zambezian halophytics | Vulnerable | 450 and 500 mm |
© 2020 by the authors. Licensee MDPI, Basel, Switzerland. This article is an open access article distributed under the terms and conditions of the Creative Commons Attribution (CC BY) license (http://creativecommons.org/licenses/by/4.0/).
Share and Cite
MDPI and ACS Style
Weier, S.M.; Keith, M.; Neef, G.G.; Parker, D.M.; Taylor, P.J. Bat Species Richness and Community Composition along a Mega-transect in the Okavango River Basin. Diversity 2020, 12, 188. https://doi.org/10.3390/d12050188
AMA Style
Weier SM, Keith M, Neef GG, Parker DM, Taylor PJ. Bat Species Richness and Community Composition along a Mega-transect in the Okavango River Basin. Diversity. 2020; 12(5):188. https://doi.org/10.3390/d12050188
Chicago/Turabian StyleWeier, Sina M., Mark Keith, Götz G. Neef, Daniel M. Parker, and Peter J. Taylor. 2020. "Bat Species Richness and Community Composition along a Mega-transect in the Okavango River Basin" Diversity 12, no. 5: 188. https://doi.org/10.3390/d12050188
Note that from the first issue of 2016, this journal uses article numbers instead of page numbers. See further details here.