Formation of Nanoclusters in Gold Nucleation


Physical Chemistry, University of Konstanz, Universitätsstrasse 10, D-78457 Konstanz, Germany
*
Author to whom correspondence should be addressed.
Crystals 2020, 10(5), 382; https://doi.org/10.3390/cryst10050382
Submission received: 19 April 2020
/
Revised: 4 May 2020
/
Accepted: 5 May 2020
/
Published: 8 May 2020
(This article belongs to the Special Issue A 10 Years Journey: Chemical, Physical, and Biological Properties and Applications of Crystals)
Abstract
:Gold nanoclusters consisting of a specific atom number have gained popularity in research in recent years due to their outstanding properties. Due to their molecule-like behavior, their properties depend strongly on their size. Although they represent the link species between atoms and nanoparticles and are the subject of current research, a high-resolution characterization is still missing. Here, we used the band forming experiment in analytical ultracentrifugation (AUC) to characterize the gold nanoclusters in the moment of their generation using thioglycerol as a stabilizer. The concentration variation of the gold precursor, reducing agent, and stabilizer was investigated. The formation of different cluster species from the smallest Au4 up to Au911 could be observed. Very stable clusters of Au55 appear in every experiment and other cluster sizes more rarely. The extracted UV/Vis spectra could additionally be correlated to every cluster. The variation in the concentration of sodium borohydride and the stabilizer did not lead to a clear trend, but the gold ion concentration directed the size of the formed clusters. A decrease seemed to promote the generation of a higher abundance of smaller clusters accompanied by less big clusters, and vice versa. These results present the characterization of the different nanocluster generations directly in the formation process of nanoparticles and therefore are a contribution to the understanding of their formation.
1. Introduction
Gold nanoparticles belong to the most investigated nanoparticles in research. This is mainly due to their remarkable size dependent properties, which lead to various applications in catalysis, sensing, optoelectronics, and in the biomedical field [1]. Among these, the link species between atoms and nanoparticles are gold nanoclusters, consisting of several up to few hundreds of atoms. Here, the size and number of atoms have a very strong effect on the resulting properties as the electrons are confined within molecular dimensions. Therefore, they stand out due to their extraordinary photoluminescence and high catalytic activities [2]. It is also known that the nanoclusters represent the primary nucleation species in the formation of gold nanoparticles [3] and the subsequent aggregation leads to the formation of nanoparticles [4].
Within these precise nanoclusters, magic number clusters play an important role. It was observed that clusters containing a specific number of atoms exist in higher abundance due to exceptional stability. This stability is explained by a complete closed shell of a symmetric polyhedron, which is structurally preferable for bare clusters. For the subsequent cluster, a complete shell of atoms is added, and therefore a discrete number of atoms. Thus, gold clusters composed of 13, 55, 147, and 309 atoms exhibit structural stability as they represent closed shell icosahedra. This phenomenon is observed especially for platinum group metals as well as for other geometric forms [3]. The structural stability of the clusters can be influenced by surfactants, as they also take part in the electronic stabilization. This way, many other cluster sizes can also be synthesized and stabilized. Surfactants containing thiols are especially preferable as they strongly interact with the surface gold atoms.
Modeling and theoretical calculations also contribute to the understanding of the stability of different gold nanoclusters and the predictions of clusters as they can be correlated to experimental results [5,6,7]. Li et al., for example, could calculate the relative stability of different symmetries of different magic-number clusters and also correlate the catalytic activity [8].
A standard procedure for the synthesis of gold nanoclusters using thiols as the stabilizer was developed using the Brust–Schiffrin method [9]. Here, a two-phase system containing water and toluene was used to synthesize monolayer passivated nanoclusters. The metal cluster present in aqueous solution is phase-transferred by tetraoctylammonium bromide. Then, organic protecting ligands and reducing agents are added to form the clusters [2]. This method paved the way for the easy, direct, and effective synthesis of specific metal nanoclusters and through different variations, a family of specific clusters was documented [6,10].
These gold nanoclusters are most often characterized by mass spectrometry. One study by Olivares et al. used a flow reactor with coupled electrospray ionization mass spectrometry (ESI-MS) to investigate the synthesis of gold clusters [11]. They investigated the temperature dependence on the abundance of different cluster species and found that higher temperatures promoted the formation of singly charged complexes and doubly charged gold cations, whereas lower temperature led to the formation of triply charged clusters. The effect of higher temperature was also observed when using longer reaction times. Another study indicated that the variations in the concentrations of reducing agent and of the ligand 1-4-bis(diphenylphosphino)butane (L4) influenced the formation process of the clusters [12]. This ligand forms organometallic complexes with the gold ion precursor. The presence of these complexes lowers the gold reduction rate, allowing the observation of the formation of gold clusters by ESI-MS. The pathway of the formation of cationic Au8(L4)42+, Au9(L4)4H2+, and Au10(L4)52+ clusters is kinetically controlled through the variation of the reducing agent and ligand concentration [12]. Additionally, liquid-cell transmission electron microscopy (TEM) was used to investigate the formation of gold nanoparticles [13]. The electron beam was used to reduce HAuCl4 and observe the particle formation in situ. For high dose rates of the electron beam and for low gold concentrations, the diffusion limited growth dominated whereas for low dose rates, the reaction limited mechanism was preferred. The latter leads to the formation of 2D plates while diffusion limited growth favors the formation of dendrite-shaped particles.
The nucleation of gold was also studied using small angle x-ray scattering (SAXS) by Polte et al. [14,15,16]. By using a continuous flow mixing device, where HAuCl4 was mixed with NaBH4, coupled with a SAXS setup, the growth of gold particles could be investigated for sizes of the gold species ranging from 0.8 nm to 2 nm. The time resolved studies show a two-step mechanism, where the first step constitutes the formation of gold nuclei by the fast reduction of gold ionic precursors and the second step is growth through the coalescence of these species [14,17]. Due to limitations in time and size resolution, the species below 0.8 nm generated directly after reduction cannot be characterized in solution by SAXS. Tracking the nucleation species is also especially difficult when using NaBH4, the standard reducing agent to synthesize gold particles, as it is a very strong reductant and therefore directs a fast reaction. In particular, catching the primary species, which are formed directly after nucleation in solution, poses a challenge to analytics.
A relatively unknown technique to address this issue is the band forming experiment in analytical ultracentrifugation (AUC) [18]. AUC is an absolute technique, which uses the centrifugal force to separate a dissolved or dispersed sample according to the size/mass, density, and frictional properties in solution. Analysis of the received raw data yields a sedimentation coefficient distribution, which can be used to characterize even polydisperse samples. A band forming experiment, also known as a synthetic boundary experiment, offers the possibility of bringing two solutions into contact. This can be applied to perform a chemical reaction and observe the reaction/nucleation product in situ [19,20]. The cells used for this special experiment provide a reservoir for a second reactant, which is connected to the main sample sector via thin capillaries. Upon speeding up the rotor, the reactant from the reservoir is overlaid onto the main solution in the sector and the reaction takes place at the interface between the two solutions, corresponding to the formation of particles. At the same time, these reaction products are subjected to the centrifugal force and can either sediment or diffuse out of the reaction zone, thus the reaction is quenched, and further growth of the species is stopped [20]. The dwelling time in the reaction zone determines the size of the final particle. This method has already been used for the investigation of nucleation species of cadmium sulfide particles and for testing the efficiencies of different stabilizers [19,20]. Here, different mean diameters of the particle size distribution of the first formed species were found for different stabilizers. Applying the band forming experiment on silver nucleation revealed the formation of eight different nucleation species starting with a single atom [21], and more detailed analysis revealed seven clusters with sizes <10 atoms together with their UV/Vis spectra [22]. The high resolution power of the AUC was also shown by analysis of gold nanorods, which could extract two dimensional size distributions by extinction and sedimentation, enabled by the use of a multiwavelength detector [23]. This already shows the great potential AUC offers to investigate nucleation processes. In particular, the high size resolution down to the Ångström range [24,25,26] and the ability to detect very small species below 1 nm [24] are promising. Therefore, this technique is predestined for the characterization of nucleation clusters formed in gold nucleation.
2. Materials and Methods
2.1. Materials
HAuCl4 and D2O were purchased from Aldrich and NaBH4 was obtained from Roth. Thioglycerol was purchased from Sigma. All chemicals were used as received. For all solutions and measurements, water of Milli-Q quality was used, sourced from a Milli-Q Synthesis A10 system equipped with a Quantum EX Ultrapure Organex cartridge (Millipore, Schwalbach, Germany).
2.2. Instruments and Experiment
For all experiments on gold clusters, an UV/Vis multiwavelength (MWL) AUC was used. The general setup has been described in the literature [27,28,29,30]. Different AUC band forming experiments were performed (experiments A–G, see Table 1) with varying reaction conditions. The experiments were performed at 25 °C and the rotor speed was 50,000 rpm for one repetition of experiment D, all other experiments and repetitions were conducted at 60,000 rpm. For these band forming experiments, a 12 mm charcoal filled Epon band forming centerpiece was used (Beckman-Coulter). This provides a small (15 μL) reservoir, which is connected to the sample sector via two thin capillaries. The centrifugal force is used to overlay the solution from the reservoir onto the solution in the sample sector. By ensuring a small density difference between the solutions, a sharp boundary is formed. Different solutions can be put into the reservoir and the sample sector, allowing for a chemical reaction between the solutions at the boundary. For the synthesis of the gold clusters in the centrifuge, (a) µL of chloroauric acid with a concentration of (b) was placed into the reservoir. A sample of 290 µL of a solution containing sodium borohydride with a concentration of (c) and the stabilizer with the concentration of (d) were placed into the sample sector. The exact values for each experiment are listed in Table 1. The values in brackets are the molar equivalents of each experiment correlating to experiment A. Thioglycerol was used as the stabilizer. The reference sector was filled with 330 µL H2O. The solutions were prepared as follows (for example): 250 µL of thioglycerol (2.89 mmol) was mixed with 500 µL H2O to give a 3.852 M solution. For the sodium borohydride solution, 3.8 mg sodium borohydride (0.1 mmol) was dissolved in 2.5 mL H2O to give a 40 mM solution. A total of 100 µL of this solution was mixed with 298 µL D2O and 2 µL 3.852 M thioglycerol solution, which is the solution finally placed into the sample sector. For the chloroauric acid solution, 78.8 mg of AuCl3 x 3H2O was dissolved in 2 mL H2O to give a 0.1 M stock solution. This was used to prepare the desired solutions by corresponding dilution. To ensure a sharp boundary, a density difference was provided using a mixture of H2O and D2O as the solvent for the solution. For experiments A, B, D, E, and F, a mixture of 51:149 by volume of H2O:D2O was used. For experiment C, a volume ratio of 52:348 of H2O:D2O was used, and for experiment G, a volume ratio of 103:297. An overview of all the performed experiments and their conditions and the concentrations is shown in Table 1.
2.3. Data Analysis
The obtained AUC raw data from the band forming experiment of the gold clusters were analyzed using ULTRASCAN [31] and SEDFIT [32]. SEDANAL [33] also offers the possibility for the analysis of band forming experiments [34], but unfortunately, only for single species and not unknown distributions, therefore this software could not be used in this case. The values used for the density and viscosity of the solvent in the analysis depended on the ratio of H2O and D2O and varied for the experiments (Table 2). As of the analyte, 0.10581 mL/g was used. This was calculated as the reciprocal value of the density of gold clusters ρ = 9.45 g/mL. This was assumed to be a reasonable value as the basis for the analysis, as the density of the gold clusters was composed of the density of the gold core (19.32 g/mL) and the thioglycerol shell (1.25 g/mL), as also explained in the Supplementary Materials.
In SEDFIT, the “Analytical Zone Centrifugation c(s)” tool [35] with the values above-mentioned was used. In ULTRASCAN, the method PCSA (parametrically constrained spectrum analysis) [36] was applied with the constraint horizontal line (PCSA-HL), which corresponds to the c(s) analysis of SEDFIT and to experiments A1, A3, and C. Of all the different constraints, this gave the best fit. The grid limits were set up as follows: sedimentation coefficient: 0.2–100 S, : 0.05–0.3 mL/g. The fixed value was f/f0 = 1.0. Analysis was performed for every third wavelength between 300 nm and 700 nm. The UV/Vis spectra, according to the different species, could be extracted by the tool “view multiwavelength s spectra”, which is implemented in the program. To measure the length of a thioglycerol molecule, MATERIALS STUDIO v5.5.0.0 was used.
3. Results and Discussion
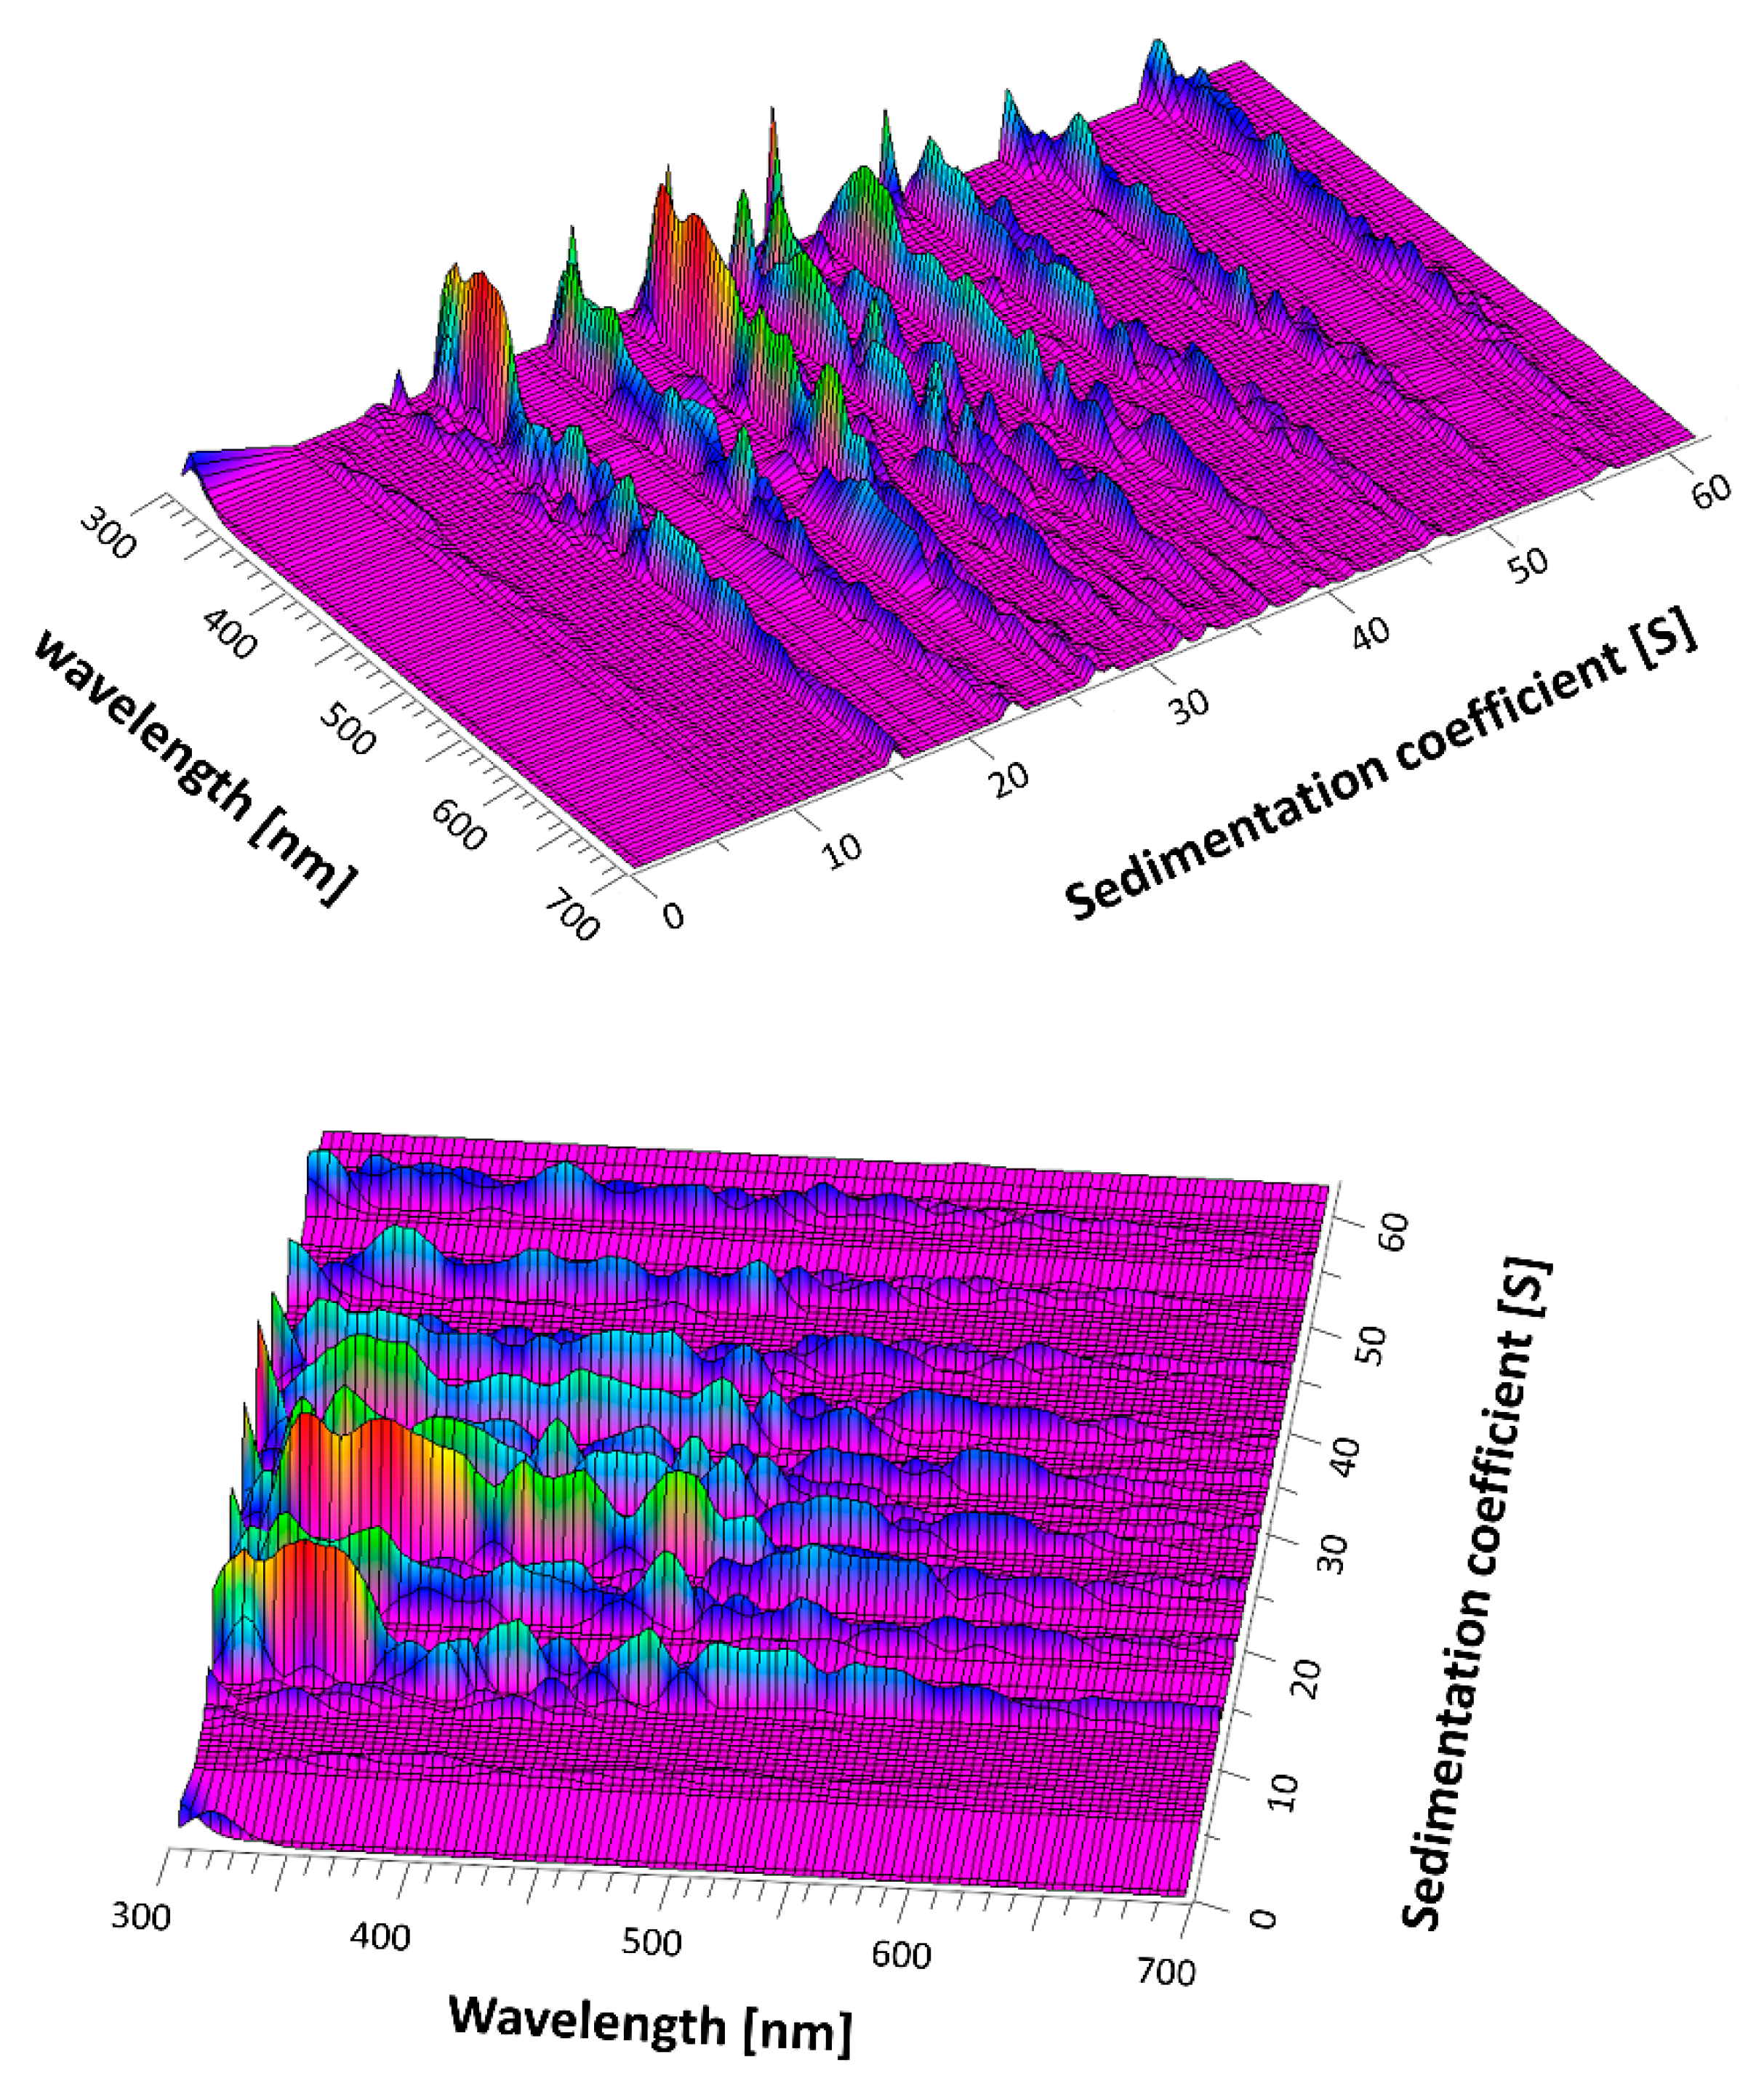
By overlaying the HAuCl4 solution from the reservoir onto NaBH4 in the sample sector during the acceleration of the rotor, the reduction of the gold ions occurs directly at the interface between the two solutions. Thereby, the first clusters in gold nucleation are generated. As they are subject to the centrifugal force at the same time, they can sediment (or also diffuse) out of the reaction zone and hence any further growth of the clusters is quenched. Depending on their dwelling time in the boundary, different generations of clusters are formed. The reaction is very fast and therefore the gold ions are used up within seconds and the clusters have reached their final size. At the beginning of the optical recording, all the particles are still present at the meniscus, as can be seen in the MWL AUC raw data at the left top of Figure 1 and also in the video in the Supplementary Materials. This boundary, consisting of different gold clusters, sediments down toward the bottom of the cell. At the same time, the boundary broadens due to the diffusion of the particles. After sedimentation of the species, an absorbance below 300 nm at the boundary remains.
This may be related to the free thioglycerol in solution, which will not sediment notably due to its small size. The raw data at one wavelength (510 nm) can also be seen in Figure S1 in the Supplementary Materials. Different experiments with varied conditions were performed, as seen in Table 1.
Concentrations of the different components were varied as well as the volume in the reservoir to investigate the influence of different parameters on the nucleation and the formed species of gold clusters. In Experiment B, only the volume in the reservoir was varied while the molar ratio stayed the same. In Experiment C, the variation of the NaBH4 concentration was applied, although it was still in excess compared to HAuCl4. In Experiments D, E, and F, the HAuCl4 concentration was varied and in G, the thioglycerol concentration was varied.
3.1. Analysis Using SEDFIT
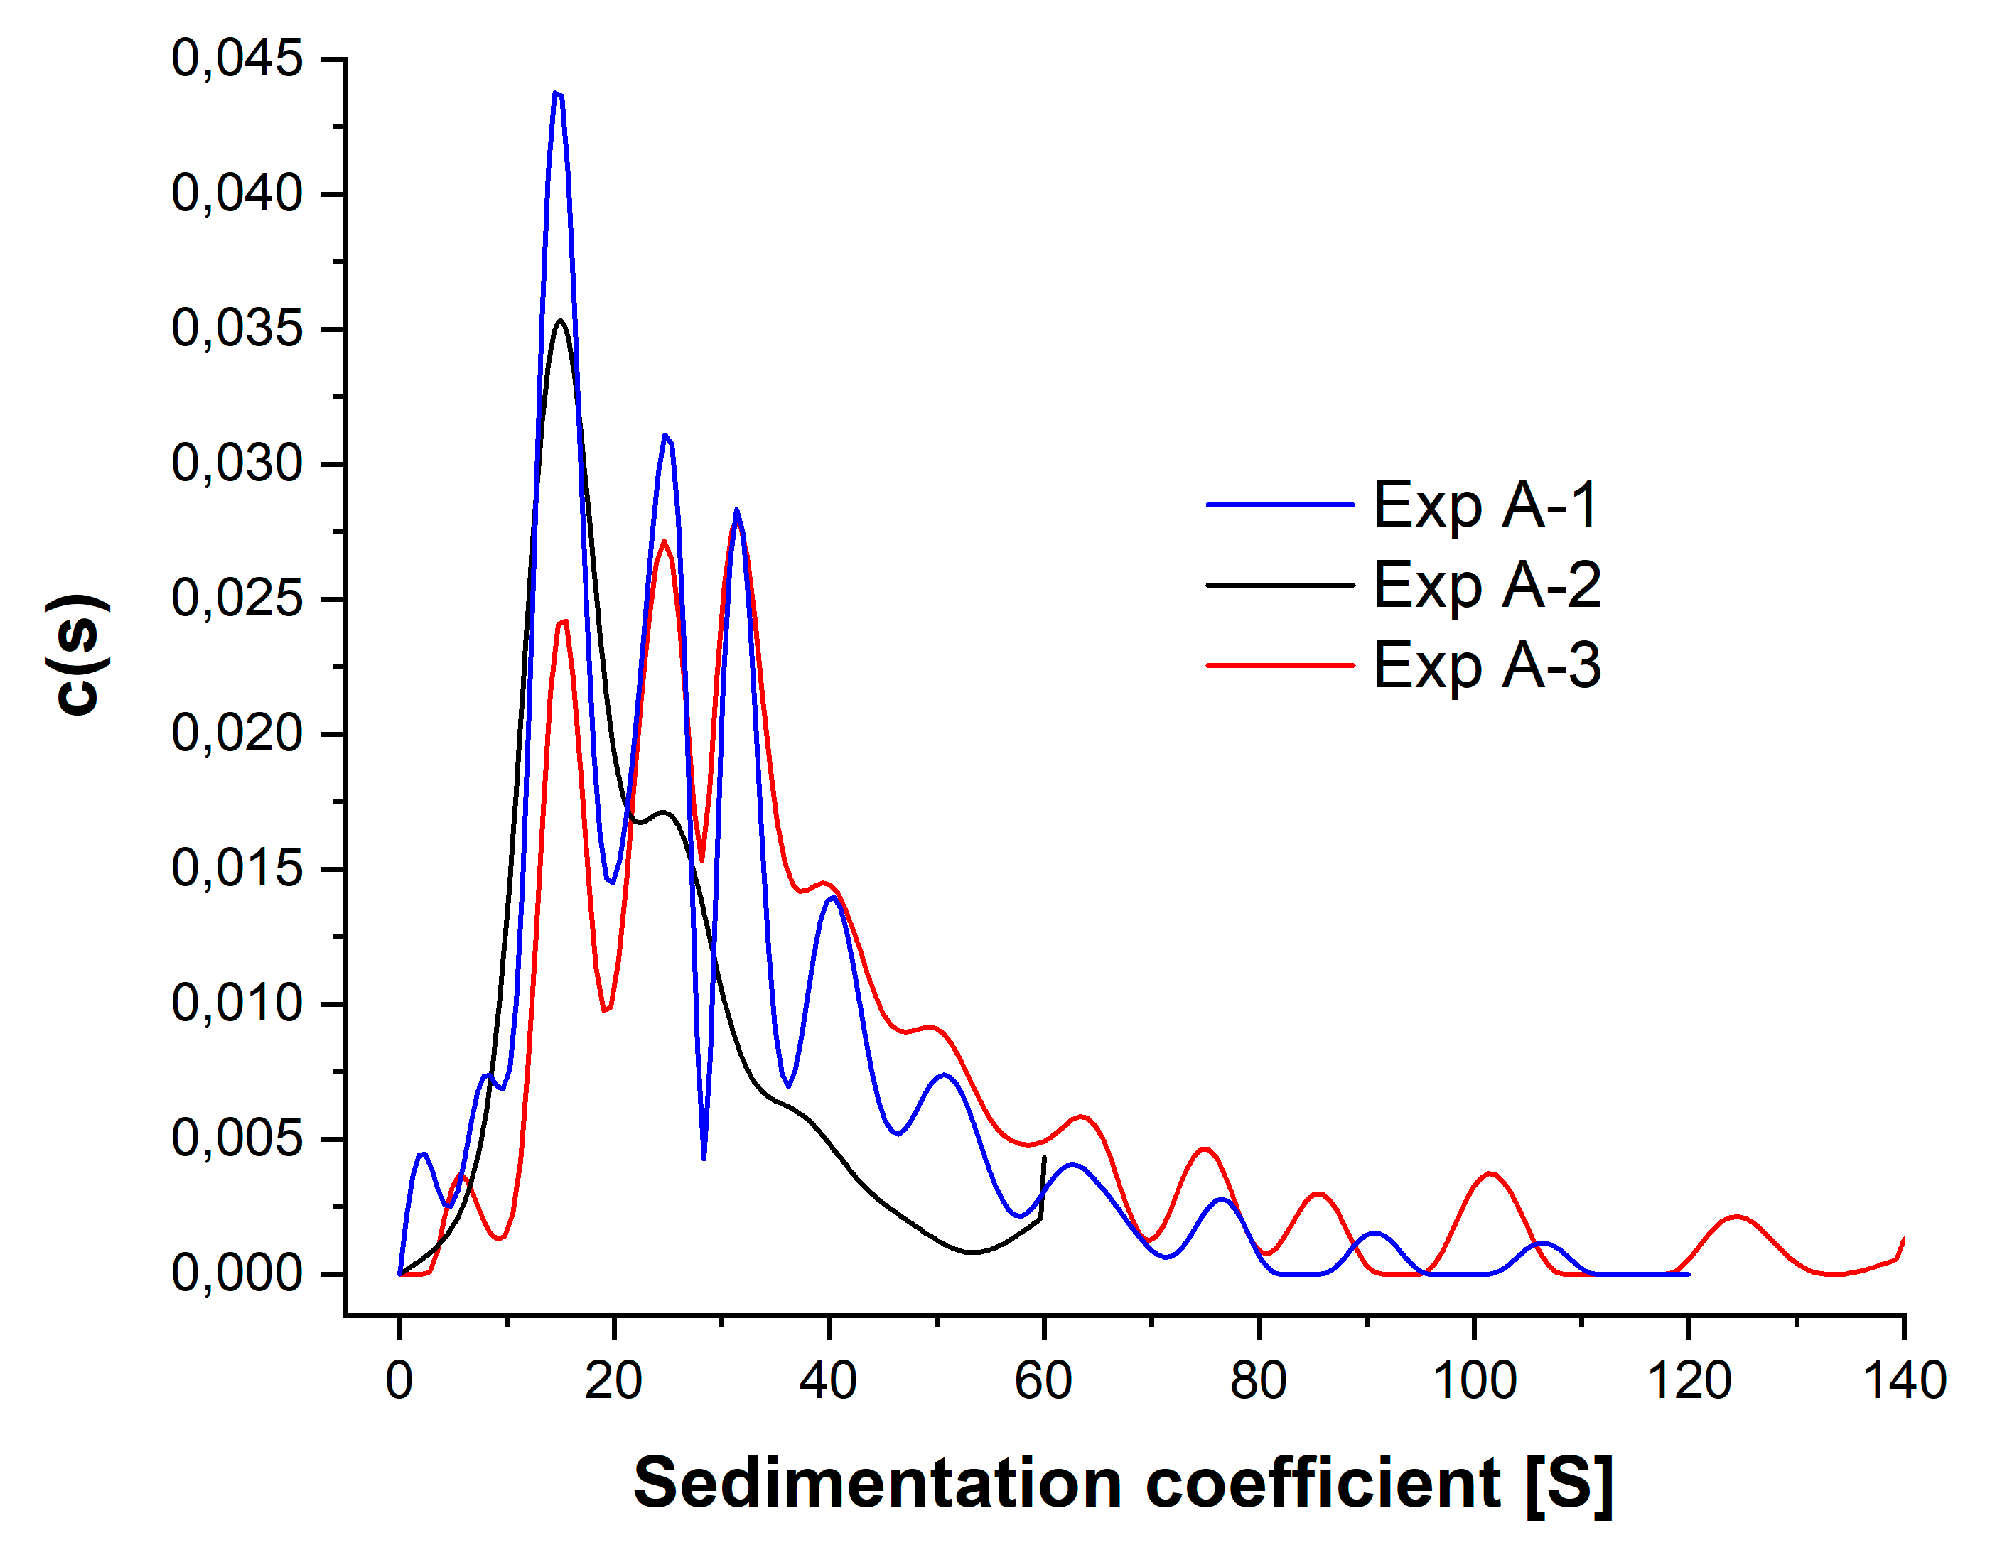
Analysis of these experiments was performed with SEDFIT at a wavelength of 510 nm, as SEDFIT does not offer the possibility for multiwavelength analysis. The tool available for band forming experiments assumes ideal initial conditions and is not optimized in the same way as the tools for the sedimentation velocity (SV) experiments. Accordingly, the deviation between model fit and experimental data (RMSD) is always higher compared to SV datasets. The results for analysis of experiment A and two repetitions (A-1, A-2, A-3) are shown in Figure 2, the corresponding fits are shown in Supplementary Materials Figure S2.
Several species of gold clusters were found in the analysis, starting from the smallest species at 2.4 S to the largest at 124.5 S. The fact that no continuous distribution was observed but several distinct species, leads to the evidence that specific clusters with different sizes were formed during nucleation. Comparison between the different repetitions of the experiment shows, that in principle, the same cluster sizes are formed in the repetitions of the experiment, but in different concentrations. For big clusters, the cluster sizes between the repetitions were in less agreement. Analyses of the other experiments and their corresponding fits are shown in the Supplementary Materials: corresponding fits are in Figures S2–S4 and analyses in Figures S5–S7. They already show some tendencies toward the formation of a higher abundance of big or small clusters for different experiment variations. A decrease in the chloroauric acid concentration (exp D) led to a less specific distribution compared to the other experiments. Only two clear species could be found in every distribution, a species at around 15 S and the other at around 26 S. Tailing of the distributions implies that bigger species were also present, but not clearly distinguishable. A more detailed overall discussion of the obtained values will follow together with the MWL analysis in the subsequent part.
3.2. Analysis Using ULTRASCAN
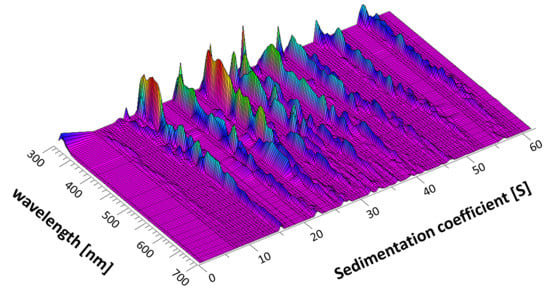
ULTRASCAN was used to perform a multiwavelength analysis of the band forming data. The analysis was performed with three datasets: experiments A-1, A-3, and C, which seemed promising from the SEDFIT analysis as MWL analysis is time and resource (computer calculation time) intensive. For analysis, the tool PCSA-HL was used, which corresponds to the c(s) analysis of SEDFIT. The model was designed to fit for the sedimentation coefficient and , the reciprocal sample density. This is a value that is normally not known for nanoparticles coated with a stabilizer as they exhibit a density distribution lying between the bulk density of the particle and the stabilizer. Only when determining the sedimentation and diffusion coefficient distributions simultaneously can be calculated for each species in a mixture [37]. Using the MWL analysis, the s-distribution can be obtained dependent on each wavelength and thus a correlation can be established, which is particularly interesting for particles with size dependent optical properties. The result of the MWL analysis of Exp A-3 is plotted in Figure 3.
The PCSA models of representative wavelengths, which also show the plots for , are shown in Figure S8 in the Supplementary Materials for experiment A-3. The value for covers a broad range between 0.065 mL/g for small wavelengths (301 nm) and is continuously increasing to 0.3 mL/g for larger wavelengths (697 nm). This is somewhat unexpected, as the density should be dependent on the size of the particles because they exhibit a different core-shell ratio, but not specifically on the wavelength. As several species are found in every wavelength, it is reasonable to anticipate a mean value for of the different species. It seems like the fit tries to compensate for another issue by adjusting , which is yet unknown to us. It could be related to the formation of the dynamic density gradient due to the overlaying of H2O onto D2O [18,38], which is not considered in the analysis [39]. This impact increases with the decreasing density of the species and therefore could influence the basis for the determination, although the smaller particles are more impacted by shorter wavelengths. This could be a possible explanation for this phenomenon. Generally, the same species are found for different wavelengths, just the absorption intensity at different wavelengths differs (as can also be seen in Figure 3). This complicates a distinct spectrum correlation to each species. Nevertheless, the UV/Vis spectra for each individual species of experiment A-3 extracted from the AUC-MWL analysis were plotted in Figure S9 in the Supplementary Materials. It shows that the spectra of very few species were in agreement, but in general, for the species 0.2 S, only one absorption peak at 310 nm was observed. The other species exhibited rather broad absorption bands with some distinct peaks. The 14.7 S species showed a peak at 390 and 460 nm, and the 26.3 S species had a broad absorption from 310–390 nm, accompanied by a specific peak at 480 nm. For the 31.3 S species, the peaks at 310 nm, 360 nm, and 430 nm were specific. Larger species than that do not really show absorption above 600 nm. The species 37.3 S exhibited a rather broad absorption over the range from 310 nm to 500 nm, with a high peak at 330 nm. The UV/Vis spectrum of the 49.4 S species was rather similar, only the 44.3 S species showed a single peak at 520 nm. Therefore, every species has its own characteristic UV/Vis absorption spectrum. This points toward the fact, that generally, it is possible to use the AUC band forming experiment to investigate the optical properties of small clusters. However, as mentioned before, the spectra correlation might be affected by the not yet optimized analysis regarding the formation of the dynamic density gradient [39], and therefore might be defective.
In the MWL analysis, it is clearly visible that only specific clusters of distinct sizes were formed during the nucleation process. In experiment A-3, up to nine different specific clusters could be observed in distinct intervals (Figure 3). This is in general agreement with the results from the SEDFIT analysis. The 3D plots of the MWL analysis conducted for experiments A1 and C are depicted in Figures S10 and S11. They generally show the same characteristics as experiment A-3, but exhibited less cluster species in the analysis. An overview of the species found in the ULTRASCAN analysis of experiments A-1, A-3, and C, and the SEDFIT analysis of the same experiments is shown in Table 3.
If the values received from the analyses of different analysis programs (SEDFIT and ULTRASCAN) are compared, they are in quite good agreement. The comparison of the values from the same experiment, but different programs shows that the same values were received from the analysis and hence the same cluster sizes. In summary, similar clusters were found in the different experiments, but some clusters only showed up in specific experiments. This also supports that very distinct clusters are formed during nucleation and there is no continuous distribution of sizes. The species shown at 0.2 S in the ULTRASCAN analysis of experiment A-1 probably correlates to free thioglycerol in solution, which absorbs in the UV. To compare all the experiments and draw conclusions, all analysis results are listed in Table S1.
One cluster species requires special attention: The 15 S cluster was present in every experiment, which indicates a correlation to a very stable species. Additionally, the subsequent cluster size at 24 S was existent in almost every experiment. Very small clusters like the 1 S, 2 S, and 5 S cluster only showed up in very few experiments, and big clusters above 76 S were also present in only some experiments. It has to be noted that repetition of an experiment does not always lead to highly reproducible results. Experiment A shows, for example, good agreement between A1 and A3 (see Figure 2), but A2 differed largely in the results, which is also reflected in Table S1. Additionally, not all the analyses of the same experiment with ULTRASCAN and SEDFIT were in good agreement, some clusters differed between the analyses, but generally they conformed. In exp B, the same number of gold ions was overlaid as in A, but the higher volume seemed to prevent the formation of big clusters during nucleation, as the concentration of ions, which are present directly at the interface, is lower. The largest species could be found at 43 S. A decrease in NaBH4 concentration (exp C) only showed medium sized clusters between 8.5 and 60 S. A decrease in gold concentration (exp D) also seemed to prevent the formation of big clusters, and the main clusters at 15 S, 24 S and 27 S seem to dominate. Further decrease of the gold concentration (exp F) seems to promote the formation of small clusters, which is indicated by the presence of a 2 S species and the largest species at 34.6 S. An increase in gold concentration (exp E) led to more large clusters up to 132 S. This confirms the conclusion that the number of gold ions present in the solution determines the size of the formed clusters. The more gold ions exist, the larger the clusters get. Increasing thioglycerol concentration (exp G) did not reveal a clear tendency for an influence on the cluster size. In particular, the distribution of small clusters agreed throughout different experiments.
If one summarizes all of the nucleation experiments of gold species (as was done in the left column of Table S1), 20 different species were identified in the analysis from 1 S to 132 S. Shown also is the frequency of occurrence and the deviation. To correlate these clusters to atom numbers, as common for gold clusters, one needs to determine the size of the gold core. For the calculation of the particle radius r based on the sedimentation coefficient s, the following formula is used:
where η is the viscosity and ρ is the density with the index p for particle and s for solvent.
As mentioned earlier, the density of gold clusters is difficult to determine as they normally exhibit a density distribution dependent on their size [37]. Furthermore, the fit in ULTRASCAN for did not yield a reasonable value, but more or less different values depending on the wavelength that was used in the analysis. The missing density hinders particle size evaluation, but this issue can be addressed by assuming a core-shell model. This assumption, which is explained in more detail in Supplementary Materials, uses the bulk density of the core and the shell and the shell thickness for the size determination of the core [26]. The length of the thioglycerol molecule was determined by creating a 3D model using the software MATERIALS STUDIO and measuring a length of 0.47 nm. The model is also shown in Figure S12. As reported in the literature for thiol stabilizers on semiconductors [26], the stabilizer is not necessarily extended on the nanoparticle surface, but is likely to be tilted [40,41]. The stabilizer attached on the nanoparticle surface follows the crystalline structure of the core [41]. For a gold core, this corresponds to face cubic centered packing and therefore an angle of 45°. A more realistic value for the shell thickness is hence 0.47 nm·sin(45°) = 0.33 nm. This value, and that of 19.32 g/mL for the bulk density of gold and 1.25 g/mL for the bulk density of thioglycerol, were used for the size determination of the gold core. The density for the gold cluster, which represents a composition of these two bulk values, is listed in the second column in Table 4. The calculated core diameter including the standard deviation, which is based on the (not rounded) mean s-values of the cluster species from all experiments (from the overview in Table S1) is listed in the third column in Table 4.
The size of the gold core of the different cluster species lay between 0.46 and 3.84 nm. To correlate the sizes to atom numbers, literature values were used [42]. The atom number depends strongly on the geometry of the cluster and clusters even provide different heights and widths, which hampers a direct relation to the calculated diameter in Table 4. The circumscribed diameter Dc appeared as the most reasonable to represent the calculated core size [42]. Hence, the correlation to atom numbers was based upon the Dc, which was in best agreement with the experimentally determined diameter. The deviation between the calculated size and the size of the corresponding cluster is given in the fourth column and is within the standard deviation of d (Au core) for almost all values. The smallest cluster size could not be correlated, and was estimated based on the gold atom radius (0.135 nm). For the correlation to the decahedra, where the Dc values are not given [42], the volume of the corresponding ellipsoid was calculated. From this, a radius of an equivalent sphere was calculated for the correlation. The different species found in the analysis corresponded to cluster sizes starting from small Au4 clusters over several different cluster species up to the largest species, which constitutes a Au911 cluster. The values are not continuous, as the geometry of the cluster has an impact on the atom number, which consequently may lead to a smaller atom number in a cluster of larger radius. One assumption for obtaining these values was that the gold core and the stabilizer exhibited their respective bulk densities, which may not be true if a considerable amount of solvent gets immobilized in the stabilizer shell, thus changing its density. Still, the results are very impressive. It turns out that the cluster with 15 S stated earlier as very stable, as it is present in all experiments, can be identified as the Au55 cluster, a gold cluster well known for its extraordinary stability [43]. A scheme of the Au55 cluster is shown in Figure 4. The detection of all these species in gold nucleation and the high size resolution shown here is remarkable.
4. Conclusions
In situ gold nucleation was investigated by means of band forming AUC experiments. The results revealed reproducibly 20 distinct gold nanoclusters, which were generated during the formation of gold nanoparticles and are therefore involved in the nucleation process. For the first time, the clusters could be identified, resolved, and characterized in a distribution directly upon formation in aqueous media. Additionally, their UV/Vis spectra could also be correlated. This indicates the high potential of band forming AUC experiments as they represent higher resolution due to better separation of the species and the possibility of analyzing nucleation species in situ. Most techniques are not able to study the first smallest clusters right after nucleation and simultaneously resolve these as well as the subsequently formed species. Nevertheless, the analysis of this method is still not optimized regarding the experimental conditions because the formation of a dynamic density gradient upon solution overlay is not yet considered in the currently available evaluation programs for band forming experiments, as also mentioned in [39,44]. Improving analysis in this important aspect could overcome the uncertainty related to the final values received herein and could further improve the resolution.
These findings help in further understanding the nucleation process of gold nanoparticles and the role of nanoclusters in this process. They illuminate the growth mechanism of the particles, which is based on the formation of stable cluster species instead of atom-per-atom growth. The evolution of the clusters in the nucleation process was clarified by these findings and the specific clusters formed were identified, although only by their sedimentation coefficient, but not yet all of them due to their size and shape and therefore their atom number. It seems that both the magic size clusters, which are marked as grey in Table 4, as well as fewer stable clusters are formed and involved in the nucleation process. As gold particle diameters up to four nanometers were detected, the differentiation between cluster and particle is difficult here. The literature tends to define particles of specific atom numbers as clusters [43]. Still, the size of the clusters allows the conclusion that the growth species also favor specific sizes. The findings already available for gold particles are complemented by this study, helping in a deeper understanding of the important nucleation process.
Supplementary Materials
The following are available online at https://www.mdpi.com/2073-4352/10/5/382/s1, PDF containing the chapters: 1. AUC raw data, Figure S1: AUC raw data at 510 nm of a band forming experiment, where gold clusters were formed; 2. SEDFIT Analysis of experiment B–G, Figure S2: Corresponding fits to the c(s) analysis in SEDFIT of experiment A-C. The RMSD values are between 0.0065 and 0.0091, Figure S3: Corresponding fits to the c(s) analysis in SEDFIT of experiment D-F. The RMSD values are between 0.0063 and 0.0105, Figure S4: Corresponding fits to the c(s) analysis in SEDFIT of experiment G. The RMSD value is 0.0083, Figure S5: Analysis of experiments B (with one repetition) and C. Shown is the c(s) distribution which exhibits different cluster species. In experiment B the same equivalents as in experiment A were used, in experiment C the concentration of NaBH4 was varied, Figure S6: Analysis of the experiment D (with three repetitions). Two different cluster species seem to appear in every distribution. The gold concentration was varied compared to experiment A. Figure S7: Analysis of the experiment E,F and G. In experiment E and F also the gold concentration was varied, in experiment G the concentration of the stabilizer thioglycerol was varied; 3. ULTRASCAN Analysis of experiment A and C, Figure S8: Analysis of a band forming experiment, where gold clusters where formed, with ULTRASCAN. Shown are the fits for the sedimentation coefficient and for representative wavelengths of experiment A-3, Figure S9: Individual UV/Vis spectra extracted from the PCSA MWL analysis for each species. For better overview they were separated in two different graphs, Figure S10: 3D plot of the multiwavelength analysis of experiment A-1 of a band forming experiment of gold clusters. The species are plotted versus the wavelength, Figure S11: 3D plot of the multiwavelength analysis of exp C of a band forming experiment of gold clusters. The species are plotted versus the wavelength; 4. Overview of the species from analysis, Table S1: Overview of all the species found in analysis of band forming experiments of gold clusters in AUC. Shown are all the species found for SEDFIT analysis at 510 nm of each experiment and the species found in MWL analysis in ULTRASCAN of exp A-1, A-3 and C; 5. Thioglycerol, Figure S12: A 3D model of thioglycerol drawn with MATERIALS STUDIO; 6. Core-shell model for size evaluation, Video S1: Video of the AUC raw data of a band forming experiment for the in-situ nucleation of gold clusters obtained from the multiwavelength AUC over the time of the experiment.
Author Contributions
C.M.S. Data curation, investigation, Validation, Visualization, Writing-original draft, H.C. Project Administration, Supervision, Writing-review & editing; All authors have read and agreed to the published version of the manuscript.
Funding
This research was funded by Deutsche Forschungsgemeinschaft within a NSF-DFG Materials World Network (GE 2278/6-1; CO 194/12-1).
Acknowledgments
We thank Philipp Bruttel for the preliminary work on the gold clusters. The authors gratefully acknowledge the Gauss Center for Supercomputing e.V. (www.gauss-centre.eu) for supporting this project by providing computing time through the John von Neumann Institute for Computing (NIC) on the GCS Supercomputer JUWELS at the Jülich Supercomputing Center (JSC). This computing time was used to receive the models in ULRASCAN.
Conflicts of Interest
The authors declare no conflict of interest.
References
- Goswami, N.; Yao, Q.; Chen, T.; Xie, J. Mechanistic exploration and controlled synthesis of precise thiolate-gold nanoclusters. Coord. Chem. Rev. 2016, 329, 1–15. [Google Scholar] [CrossRef]
- Lu, Y.; Chen, W. Sub-nanometre sized metal clusters: From synthetic challenges to the unique property discoveries. Chem. Soc. Rev. 2012, 41, 3594–3623. [Google Scholar] [CrossRef]
- Lee, J.; Yang, J.; Kwon, S.G.; Hyeon, T. Nonclassical nucleation and growth of inorganic nanoparticles. Nat. Rev. Mater. 2016, 1, 16034. [Google Scholar] [CrossRef]
- Shields, S.P.; Richards, V.N.; Buhro, W.E. Nucleation control of size and dispersity in aggregative nanoparticle growth. A study of the coarsening kinetics of thiolate-capped gold nanocrystals. Chem. Mater. 2010, 22, 3212–3225. [Google Scholar] [CrossRef]
- Li, X.-B.; Wang, H.-Y.; Yang, X.-D.; Zhu, Z.-H.; Tang, Y.-J. Size dependence of the structures and energetic and electronic properties of gold clusters. J. Chem. Phys. 2007, 126, 084505. [Google Scholar] [CrossRef] [PubMed]
- Qian, H.; Zhu, Y.; Jin, R. Atomically precise gold nanocrystal molecules with surface plasmon resonance. Proc. Natl. Acad. Sci. USA 2012, 109, 696–700. [Google Scholar] [CrossRef] [Green Version]
- Barnard, A.S. Modelling of nanoparticles: Approaches to morphology and evolution. Rep. Prog. Phys. 2010, 73, 086502. [Google Scholar] [CrossRef]
- Li, H.; Li, L.; Pedersen, A.; Gao, Y.; Khetrapal, N.; Jónsson, H.; Zeng, X.C. Magic-number gold nanoclusters with diameters from 1 to 3.5 nm: Relative stability and catalytic activity for co oxidation. Nano Lett. 2015, 15, 682–688. [Google Scholar] [CrossRef] [PubMed]
- Brust, M.; Walker, M.; Bethell, D.; Schiffrin, D.J.; Whyman, R. Synthesis of thiol-derivatised gold nanoparticles in a two-phase liquid–liquid system. J. Chem. Soc. Chem. Commun. 1994, 7, 801–802. [Google Scholar] [CrossRef]
- Sakthivel, N.A.; Dass, A. Aromatic thiolate-protected series of gold nanomolecules and a contrary structural trend in size evolution. Acc. Chem. Res. 2018, 51, 1774–1783. [Google Scholar] [CrossRef]
- Olivares, A.; Laskin, J.; Johnson, G.E. Investigating the synthesis of ligated metal clusters in solution using a flow reactor and electrospray ionization mass spectrometry. J. Phys. Chem. A 2014, 118, 8464–8470. [Google Scholar] [CrossRef] [PubMed]
- Ligare, M.R.; Johnson, G.E.; Laskin, J. Observing the real time formation of phosphine-ligated gold clusters by electrospray ionization mass spectrometry. PCCP 2017, 19, 17187–17198. [Google Scholar] [CrossRef] [PubMed] [Green Version]
- Zhang, Y.; Keller, D.; Rossell, M.D.; Erni, R. Formation of au nanoparticles in liquid cell transmission electron microscopy: From a systematic study to engineered nanostructures. Chem. Mater. 2017, 29, 10518–10525. [Google Scholar] [CrossRef] [PubMed] [Green Version]
- Polte, J.; Erler, R.; Thünemann, A.F.; Sokolov, S.; Ahner, T.T.; Rademann, K.; Emmerling, F.; Kraehnert, R. Nucleation and growth of gold nanoparticles studied via in situ small angle x-ray scattering at millisecond time resolution. ACS Nano 2010, 4, 1076–1082. [Google Scholar] [CrossRef]
- Polte, J.; Ahner, T.T.; Delissen, F.; Sokolov, S.; Emmerling, F.; Thünemann, A.F.; Kraehnert, R. Mechanism of gold nanoparticle formation in the classical citrate synthesis method derived from coupled in situ xanes and saxs evaluation. J. Am. Chem. Soc. 2010, 132, 1296–1301. [Google Scholar] [CrossRef]
- Polte, J.; Herder, M.; Erler, R.; Rolf, S.; Fischer, A.; Würth, C.; Thünemann, A.F.; Kraehnert, R.; Emmerling, F. Mechanistic insights into seeded growth processes of gold nanoparticles. Nanoscale 2010, 2, 2463–2469. [Google Scholar] [CrossRef]
- Polte, J. Fundamental growth principles of colloidal metal nanoparticles—A new perspective. CrystEngComm 2015, 17, 6809–6830. [Google Scholar] [CrossRef] [Green Version]
- Mächtle, W.; Börger, L. Analytical Ultracentrifugation of Polymers and Nanoparticles; Springer: Berlin/Heidelberg, Germany, 2006. [Google Scholar]
- Börger, L.; Cölfen, H. Investigation of the efficiencies of stabilizers for nanoparticles by synthetic boundary crystallization ultracentrifugation. Prog. Colloid Polym. Sci. 1999, 113, 23–28. [Google Scholar]
- Börger, L.; Cölfen, H.; Antonietti, M. Synthetic boundary crystallization ultracentrifugation: A new method for the observation of nucleation and growth of inorganic colloids and the determination of stabilizer efficiencies. Colloids Surf. A 2000, 163, 29–38. [Google Scholar] [CrossRef]
- Völkle, C.M.; Gebauer, D.; Cölfen, H. Fd nucleation: High-resolution insights into the early stages of silver nucleation and growth. Faraday Discuss. 2015, 179, 59–77. [Google Scholar] [CrossRef] [Green Version]
- Schneider, C.M.; Cölfen, H. High-resolution analysis of small silver clusters by analytical ultracentrifugation. J. Phys. Chem. Lett. 2019, 10, 6558–6564. [Google Scholar] [CrossRef] [PubMed]
- Wawra, S.E.; Pflug, L.; Thajudeen, T.; Kryschi, C.; Stingl, M.; Peukert, W. Determination of the two-dimensional distributions of gold nanorods by multiwavelength analytical ultracentrifugation. Nat. Commun. 2018, 9, 4898. [Google Scholar] [CrossRef] [PubMed]
- Cölfen, H.; Pauck, T. Determination of particle size distributions with angström resolution. Colloid. Polym. Sci. 1997, 275, 175–180. [Google Scholar] [CrossRef]
- Cölfen, H.; Schnablegger, H.; Fischer, A.; Jentoft, F.C.; Weinberg, G.; Schlögl, R. Particle growth kinetics in zirconium sulfate aqueous solutions followed by dynamic light scattering and analytical ultracentrifugation: Implications for thin film deposition. Langmuir 2002, 18, 3500–3509. [Google Scholar] [CrossRef]
- Karabudak, E.; Brookes, E.; Lesnyak, V.; Gaponik, N.; Eychmüller, A.; Walter, J.; Segets, D.; Peukert, W.; Wohlleben, W.; Demeler, B.; et al. Simultaneous identification of spectral properties and sizes of multiple particles in solution with subnanometer resolution. Angew. Chem. Int. Ed. 2016, 55, 11770–11774. [Google Scholar] [CrossRef] [PubMed] [Green Version]
- Walter, J.; Löhr, K.; Karabudak, E.; Reis, W.; Mikhael, J.; Peukert, W.; Wohlleben, W.; Cölfen, H. Multidimensional analysis of nanoparticles with highly disperse properties using multiwavelength analytical ultracentrifugation. ACS Nano 2014, 8, 8871–8886. [Google Scholar] [CrossRef]
- Bhattacharyya, S.K.; Maciejewska, P.; Börger, L.; Stadler, M.; Gülsün, A.M.; Cicek, H.B.; Cölfen, H. Development of fast fiber based uv-vis multiwavelength detector for an ultracentrifuge. Prog. Colloid Polym. Sci. 2006, 131, 9–22. [Google Scholar]
- Pearson, J.; Walter, J.; Peukert, W.; Cölfen, H. Advanced multiwavelength detection in analytical ultracentrifugation. Anal. Chem. 2018, 90, 1280–1291. [Google Scholar] [CrossRef]
- Pearson, J.; Hofstetter, M.; Dekorsy, T.; Totzeck, M.; Cölfen, H. Design concepts in absorbance optical systems for analytical ultracentrifugation. Analyst 2018, 143, 4040–4050. [Google Scholar] [CrossRef] [Green Version]
- Demeler, B. Ultrascan—A comprehensive data analysis software package for analytical ultracentrifugation experiments. In Analytical Ultracentrifugation: Techniques and Methods; Scott, D.J., Harding, S.E., Rowe, A.J., Eds.; The Royal Society of Chemistry: London, UK, 2005; pp. 210–230. [Google Scholar]
- Schuck, P. Size-distribution analysis of macromolecules by sedimentation velocity ultracentrifugation and lamm equation modeling. Biophys. J. 2000, 78, 1606–1619. [Google Scholar] [CrossRef] [Green Version]
- Stafford, W.F.; Sherwood, P.J. Analysis of heterologous interacting systems by sedimentation velocity: Curve fitting algorithms for estimation of sedimentation coefficients, equilibrium and kinetic constants. Biophys. Chem. 2004, 108, 231–243. [Google Scholar] [CrossRef] [PubMed]
- Correia, J.J.; Wright, R.T.; Hayes, D.; Sherwood, P.J.; Stafford, W.F. Auc measurements of diffusion coefficients of monoclonal antibodies in the presence of human serum proteins. Biophys. J. 2018, 114, 62a. [Google Scholar] [CrossRef] [Green Version]
- Lebowitz, J.; Teale, M.; Schuck, P.W. Analytical band centrifugation of proteins and protein complexes. Biochem. Soc. Trans. 1998, 26, 745–749. [Google Scholar] [CrossRef] [PubMed] [Green Version]
- Gorbet, G.; Devlin, T.; Uribe, B.I.H.; Demeler, A.K.; Lindsey, Z.L.; Ganji, S.; Demeler, B. A parametrically constrained optimization method for fitting sedimentation velocity experiments. Biophys. J. 2014, 106, 1741–1750. [Google Scholar] [CrossRef] [Green Version]
- Carney, R.P.; Kim, J.Y.; Qian, H.; Jin, R.; Mehenni, H.; Stellacci, F.; Bakr, O.M. Determination of nanoparticle size distribution together with density or molecular weight by 2d analytical ultracentrifugation. Nat. Commun. 2011, 2, 335. [Google Scholar] [CrossRef] [Green Version]
- Mächtle, W. Schnelle dynamische h2o/percoll-dichtegradienten für mikropartikel in der analytischen ultrazentrifuge. Colloid. Polym. Sci. 1984, 262, 270–282. [Google Scholar] [CrossRef]
- Schneider, C.M.; Cölfen, H. Analytical band centrifugation revisited. Eur. Biophys. J. 2018, 47, 799–807. [Google Scholar] [CrossRef] [Green Version]
- Rockenberger, J.; Tröger, L.; Rogach, A.L.; Tischer, M.; Grundmann, M.; Eychmüller, A.; Weller, H. The contribution of particle core and surface to strain, disorder and vibrations in thiolcapped cdte nanocrystals. J. Chem. Phys. 1998, 108, 7807–7815. [Google Scholar] [CrossRef]
- Vossmeyer, T.; Reck, G.; Schulz, B.; Katsikas, L.; Weller, H. Double-layer superlattice structure built up of cd32s14 (sch2ch (oh) ch3) 36. Cntdot. 4h2o clusters. J. Am. Chem. Soc. 1995, 117, 12881–12882. [Google Scholar] [CrossRef]
- Mori, T.; Hegmann, T. Determining the composition of gold nanoparticles: A compilation of shapes, sizes, and calculations using geometric considerations. J. Nanopart. Res. 2016, 18, 295. [Google Scholar] [CrossRef] [Green Version]
- Schmid, G. The relevance of shape and size of au55 clusters. Chem. Soc. Rev. 2008, 37, 1909–1930. [Google Scholar] [CrossRef] [PubMed]
- Schneider, C.M.; Haffke, D.; Cölfen, H. Band sedimentation experiment in analytical ultracentrifugation revisited. Anal. Chem. 2018, 90, 10659–10663. [Google Scholar] [CrossRef] [PubMed]
Figure 1.
Analytical ultracentrifugation (AUC) raw data of a band forming experiment for the in situ nucleation of gold clusters obtained from the multiwavelength AUC at different times of the experiment. Shown are scans after: 3.8 min (top left), 7.7 min (top right), 13.8 min (bottom left), 24.5 min (bottom right). The absorbance of the species over the whole cell and their sedimentation from the top of the cell (5.8 cm radius) to the bottom (7.2 cm radius) can be followed. The particles present in the boundary are visible in the first scan and then the sedimentation toward the bottom and the broadening of the boundary due to diffusion can be observed.

Figure 2.
Analysis using SEDFIT showing the diffusion corrected sedimentation coefficient distribution c(s) of experiment A and repetitions (A-1, A-2, A-3) at 510 nm. The diffusion corrected s-distributions show several species. [S] specifies the unit Svedberg (10−13 s).
Figure 2.
Analysis using SEDFIT showing the diffusion corrected sedimentation coefficient distribution c(s) of experiment A and repetitions (A-1, A-2, A-3) at 510 nm. The diffusion corrected s-distributions show several species. [S] specifies the unit Svedberg (10−13 s).

Figure 3.
3D plot of the multiwavelength analysis of a band forming experiment of gold clusters (exp A-3). The plot is shown from two different viewpoints. The species are plotted versus the wavelength and discrete cluster species are determined.
Figure 3.
3D plot of the multiwavelength analysis of a band forming experiment of gold clusters (exp A-3). The plot is shown from two different viewpoints. The species are plotted versus the wavelength and discrete cluster species are determined.

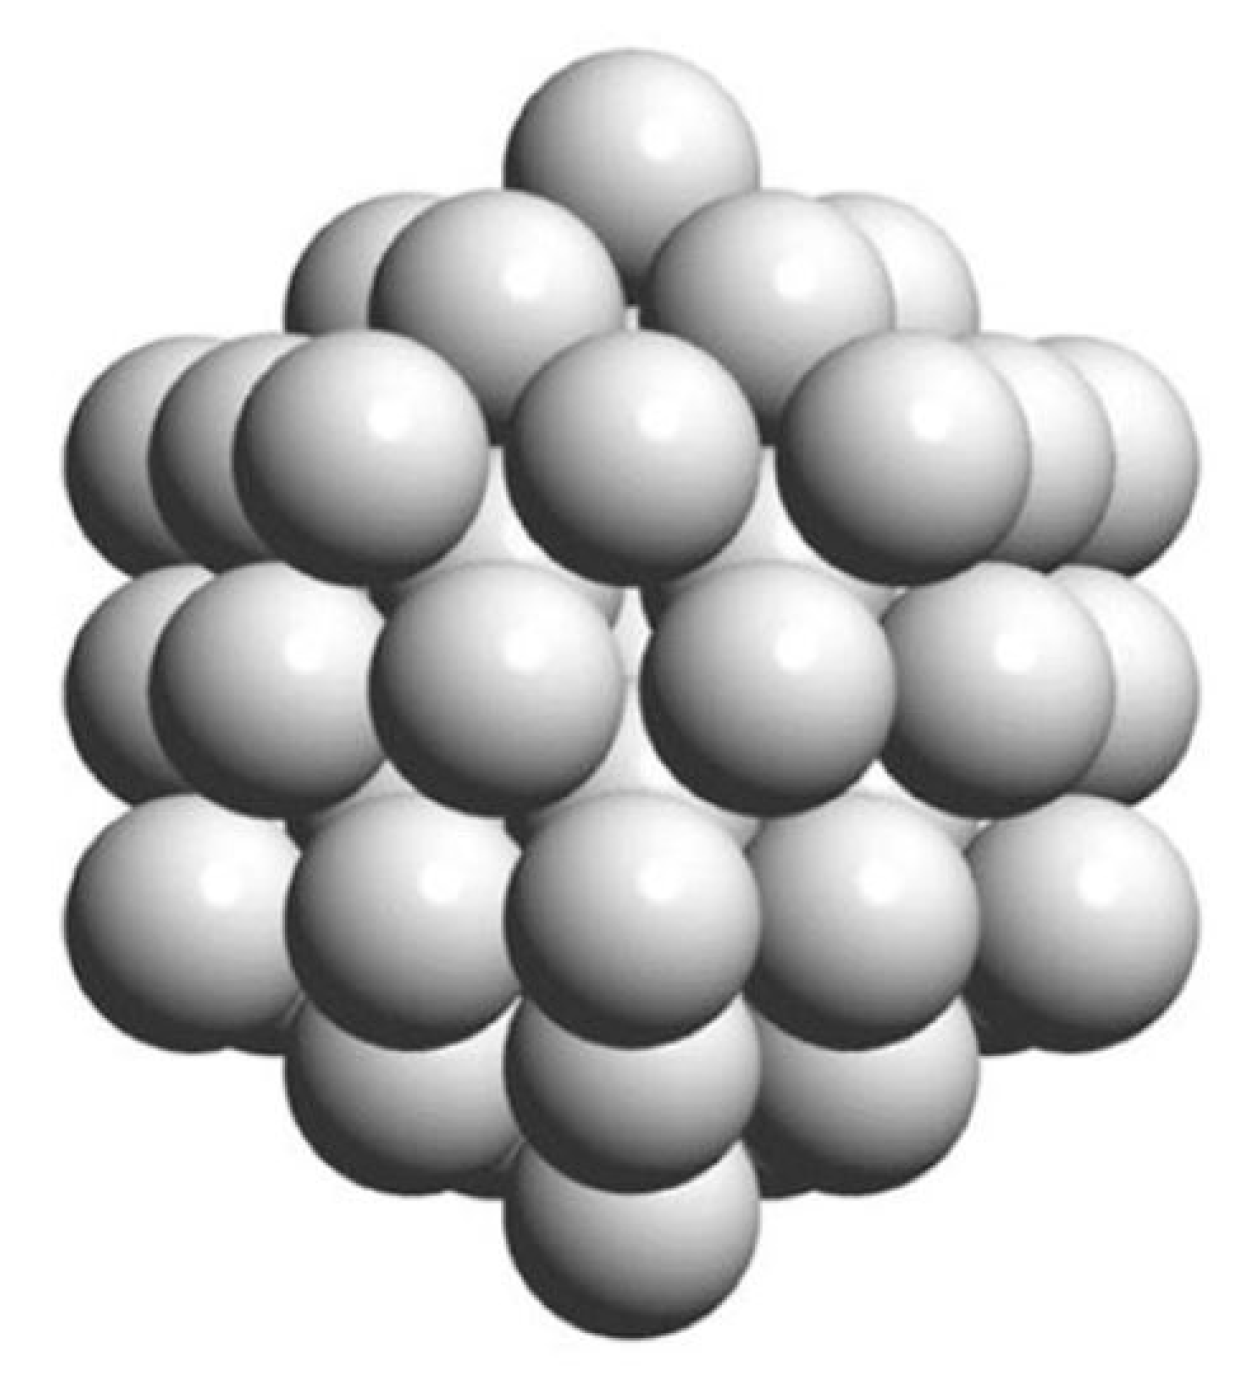
Figure 4.
Scheme of the icosahedral shaped gold cluster Au55. Graphic taken as a cutout from Figure 7 in T. Mori and T. Hegmann [42] under permission of the Creative Commons Attribution 4.0 International License (http://creativecommons.org/licenses/by/4.0/).
Figure 4.
Scheme of the icosahedral shaped gold cluster Au55. Graphic taken as a cutout from Figure 7 in T. Mori and T. Hegmann [42] under permission of the Creative Commons Attribution 4.0 International License (http://creativecommons.org/licenses/by/4.0/).


Table 1.
Overview of the experimental conditions of the experiments A–G.
| Exp. | V(Res.) µL (a) | [HAuCl4] mmol/L (b) | [NaBH4] mmol/L (c) | [Stabilizer] mmol/L (d) |
|---|---|---|---|---|
| A | 1 | 20 | 10 | 19.3 |
| B | 2 (2 eq) | 10 (1 eq) | 10 (1 eq) | 19.3 (1 eq) |
| C | 1 (1 eq) | 20 (1 eq) | 5 (0.5 eq) | 19.3 (1 eq) |
| D | 1 (1 eq) | 10 (0.5 eq) | 10 (1 eq) | 19.3 (1 eq) |
| E | 1 (1 eq) | 30 (1.5 eq) | 10 (1 eq) | 19.3 (1 eq) |
| F | 1 (1 eq) | 5 (0.25 eq) | 10 (1 eq) | 19.3 (1 eq) |
| G | 1 (1 eq) | 10 (0.5 eq) | 10 (1 eq) | 28.9 (1.5 eq) |
The volume contained in the reservoir is specified as V(Res) and the concentration of the chloroauric acid with [HAuCl4], which is in the reservoir for every experiment. Sodium borohydride and the stabilizer thioglycerol were both contained in the sample sector and their final concentrations are specified as [NaBH4] and [Stabilizer]. The values in brackets are the molar equivalents of each experiment correlating to experiment A.
Table 2.
Density and viscosity of the solvent used for the analysis of the gold clusters dependent on the experiment.
Table 2.
Density and viscosity of the solvent used for the analysis of the gold clusters dependent on the experiment.
| Exp. | H2O:D2O | ρ [g/mL] | η [P] |
|---|---|---|---|
| A,B,D,E,F | 51:149 | 1.0776 | 0.0104387 |
| C | 52:348 | 1.0905 | 0.0106841 |
| G | 103:297 | 1.0776 | 0.0104387 |
Table 3.
Overview of the different cluster species found in the ULTRASCAN analysis of exp. A-1, A-3, and C and the SEDFIT analysis of the same experiments.
Table 3.
Overview of the different cluster species found in the ULTRASCAN analysis of exp. A-1, A-3, and C and the SEDFIT analysis of the same experiments.
| ULTRASCAN | SEDFIT | ||||
|---|---|---|---|---|---|
| Sedimentation Coefficient [S] | Sedimentation Coefficient [S] | ||||
| Exp. A-1 | Exp. A-3 | Exp. C | Exp. A-1 | Exp. A-3 | Exp. C |
| 0.2 | |||||
| 1.3 | |||||
| 2.4 | |||||
| 5.6 | |||||
| 9.9 | 8.5 | 8.5 | |||
| 15.9 | 14.7 | 15.9 | 14.5 | 15.5 | 15.0 |
| 24.0 | 26.3 | 25.7 | 24.7 | 24.6 | 24.7 |
| 30.5 | 31.3 | 34.3 | 31.4 | 31.7 | 32.7 |
| 39.2 | 37.3 | ||||
| 45.7 | 44.3 | 44.0 | 39.4 | 42.4 | |
| 54.4 | 49.3 | 50.7 | 49.3 | ||
| 62.7 | 63.3 | 60.2 | |||
| 76.6 | 74.6 | ||||
| 90.5 | 85.8 | ||||
| 106.1 | 101.3 | ||||
| 124.5 | |||||
Table 4.
Calculated sizes and atom numbers including the standard deviation for each cluster species found in different experiments of the nucleation of gold particles. The magic size clusters are marked in grey.
Table 4.
Calculated sizes and atom numbers including the standard deviation for each cluster species found in different experiments of the nucleation of gold particles. The magic size clusters are marked in grey.
| Sedimentation Coefficient [S] | Cluster Density [g/mL] | d Au Core [nm] | Au Atoms | Δd [nm] |
|---|---|---|---|---|
| 1.3 ± 0.04 | 4.82 | 0.46 ± 0.01 | 4 a | - |
| 2.3 ± 0.15 | 6.10 | 0.60 ± 0.01 | 7 | 0.12 |
| 5.6 * | 8.20 | 0.88 * | 13 | 0.04 |
| 7.6 ± 0.30 | 9.04 | 1.02 ± 0.02 | 18 | 0.02 |
| 8.9 ± 0.45 | 9.37 | 1.08 ± 0.03 | 29 | 0.02 |
| 15 ± 0.47 | 10.75 | 1.40 ± 0.02 | 55 | 0.04 |
| 24 ± 0.63 | 11.92 | 1.72 ± 0.02 | 115 | 0.00 |
| 27 ± 0.56 | 12.16 | 1.82 ± 0.02 | 135 | 0.00 |
| 32 ± 0.98 | 12.58 | 1.96 ± 0.02 | 178 | 0.02 |
| 36 ± 0.80 | 12.82 | 2.08 ± 0.03 | 192 | 0.00 |
| 41 ± 1.46 | 13.13 | 2.20 ± 0.04 | 165 | 0.02 |
| 45 ± 0.69 | 13.34 | 2.28 ± 0.01 | 237 | 0.01 |
| 50 ± 1.72 | 13.56 | 2.42 ± 0.04 | 327 | 0.03 |
| 62 ± 1.24 | 14.00 | 2.68 ± 0.03 | 429 | 0.01 |
| 76 ± 1.00 | 14.38 | 2.94 ± 0.02 | 599 | 0.02 |
| 81 ± 0.50 | 14.51 | 3.04 ± 0.01 | 459 | 0.01 |
| 88 ± 2.35 | 14.66 | 3.16 ± 0.04 | 579 | 0.01 |
| 106 ± 2.61 | 15.00 | 3.46 ± 0.04 | 658 | 0.03 |
| 125 * | 15.27 | 3.74 * | 923 | 0.00 |
| 132 * | 15.36 | 3.84 * | 911 | 0.02 |
* No statistics possible. a Estimation based on the gold atom radius (0.135 nm).
© 2020 by the authors. Licensee MDPI, Basel, Switzerland. This article is an open access article distributed under the terms and conditions of the Creative Commons Attribution (CC BY) license (http://creativecommons.org/licenses/by/4.0/).
Share and Cite
MDPI and ACS Style
Schneider, C.M.; Cölfen, H. Formation of Nanoclusters in Gold Nucleation. Crystals 2020, 10, 382. https://doi.org/10.3390/cryst10050382
AMA Style
Schneider CM, Cölfen H. Formation of Nanoclusters in Gold Nucleation. Crystals. 2020; 10(5):382. https://doi.org/10.3390/cryst10050382
Chicago/Turabian StyleSchneider, Cornelia M., and Helmut Cölfen. 2020. "Formation of Nanoclusters in Gold Nucleation" Crystals 10, no. 5: 382. https://doi.org/10.3390/cryst10050382
Note that from the first issue of 2016, this journal uses article numbers instead of page numbers. See further details here.