Effect of HPHT Treatment on Spectroscopic Features of Natural Type Ib-IaA Diamonds Containing Y Centers
by
Igor N. Kupriyanov
1, 
Yuri N. Palyanov
1,2,*,
Alexander A. Kalinin
1 and
Vladislav S. Shatsky
1,2 1
Sobolev Institute of Geology and Mineralogy SB RAS, Koptyug ave. 3, 630090 Novosibirsk, Russia
2
Department of Geology and Geophysics, Novosibirsk State University, Novosibirsk 630090, Russia
*
Author to whom correspondence should be addressed.
Crystals 2020, 10(5), 378; https://doi.org/10.3390/cryst10050378
Submission received: 9 April 2020
/
Revised: 5 May 2020
/
Accepted: 6 May 2020
/
Published: 7 May 2020
(This article belongs to the Special Issue Diamond Crystals Volume II)
Abstract
:In this paper, we report a spectroscopic study of natural type Ib-IaA diamonds containing Y centers subjected to high-pressure high-temperature treatment at 7–7.5 GPa and 1700–2200 °C. Diamond samples showing the Y centers as the dominant absorption feature in the infrared spectra were selected from a collection of natural diamonds from alluvial placers of the northeastern Siberian Platform. The samples were investigated by spectroscopic techniques before and after each annealing stage. It was found that upon annealing at temperatures higher than 2000°C, the defect-induced one-phonon spectra changed from the Y centers to a new form with a characteristic band peaking at 1060 cm−1. Photoluminescence spectra of the samples were modified after each annealing stage starting from 1700 °C. The most significant changes in photoluminescence occurred at temperatures higher than 2000 °C and were associated with a sharp increase of the intensity of an emission band peaking at about 690 nm. A comparison with natural red-luminescing diamonds from Yakutian kimberlite pipes was performed. It was concluded that the observed 1060 cm−1 IR band and the 690 nm red emission band are genetically related to the Y centers and that defects or impurities responsible for the Y centers appear quite widespread in natural diamonds from various deposits worldwide.
1. Introduction
Natural diamonds are known to possess a highly diverse set of defect and impurity centers that reflect the wide variations of the conditions of diamond formation in nature, coupled with prolonged stages of annealing at high pressures and temperatures during their residence in the Earth’s mantle [1,2,3]. It has been generally recognized that deciphering the genetic information enclosed in the defect-and-impurity structure of diamond significantly contributes to our understanding of the physical and chemical environment of diamond formation and evolution deep in Earth’s mantle.
The principal impurity in diamond is nitrogen, which can be present in the diamond lattice in the form of various structural defects ranging from isolated substitutional atoms (C centers) to aggregates of substitutional atoms (A and B centers). Depending on the nitrogen concentration, diamonds are divided into type I nitrogen-containing diamonds and type II, containing less than ca 1 ppm of nitrogen. Type I diamonds are further subdivided into type Ib, containing nitrogen impurity in the form of isolated substitutional atoms, and type Ia, containing aggregated nitrogen forms. An overwhelming majority of natural diamonds correspond to the Ia type, which is a consequence of the nitrogen aggregation process occurring over geological time and at temperatures typical of the Earth’s upper mantle. The aggregation state of nitrogen impurities gives valuable insights into the “temperature–time” history of diamond residence in the mantle [4,5].
Recently, considerable attention has been paid to natural type Ib diamonds [6,7,8,9,10,11,12,13]. These diamonds are rare, accounting for less than 0.1% of natural diamonds [14]. Their evolution history differs from that of the majority of lithospheric diamonds, which has inflamed particular interest for researchers. Another interesting feature of natural diamonds with the type Ib character is that their infrared (IR) spectra in the defect-induced one-phonon region frequently cannot be described by the C and A components and show some additional absorption features [6,15]. Hainschwang et al. [6] performed a detailed spectroscopic study of a large collection natural type Ib-IaA diamonds and conclusively identified a new absorption component in the one-phonon spectra. The defects responsible for this new absorption were called Y centers. Neither the nature of these defects nor their possible relation to other defects in diamond have been established so far.
Recent investigations of diamonds recovered from the alluvial placers of the northeastern Siberian Platform have demonstrated an unexpectedly high occurrence of type Ib-IaA diamonds in these deposits [8,9]. Even more intriguing was the fact that a large portion of such diamonds show the Y center absorption in their infrared spectra [8,9]. In view of the continuing search for the sources for these placer diamonds, as well as the endeavor for a better understanding of the defects and impurities in diamond, investigations aimed at establishing an as full as possible picture of the Y centers’ properties are of high relevance.
In this study, we focused on exploring the behavior of the Y centers upon high-pressure high-temperature (HPHT) annealing and revealing possible relations of the Y centers to other optically active defects in diamond. Type Ib-IaA alluvial diamonds containing Y centers were subjected to HPHT treatments at 1700–2200 °C and their spectroscopic characteristics were compared with those of naturally occurring kimberlitic diamonds.
2. Materials and Methods
Diamond crystals were selected from a collection of alluvial diamonds (2–4 mm) recovered from the placers of the northeastern Siberian Platform. More than 30 rough crystals were initially screened for the occurrence of Y centers using infrared absorption spectroscopy. The selected crystals, showing relatively strong absorption from the Y centers, were mechanically polished along (100) (for diamonds with cuboid morphology) or (110) (for diamonds with dodecahedroid morphology) to produce plates with a thickness of 0.5–1 mm. Special care was taken to select and prepare samples without large inclusions and cracks, which may cause breaking of the samples during HPHT treatment. Four diamond samples denoted Y1, Y2, Y3, and Y4 were finally chosen for the annealing experiments. The experiments were performed at temperatures in the range 1700–2200 °C under a stabilizing pressure of 7–7.5 GPa for 1–2 h via the split-sphere multi-anvil apparatus (BARS) [16]. Samples Y1 and Y4 were annealed at 1700, 1900, and 2100 °C for 2 h at each temperature. Samples Y2 and Y3 were annealed at 1700, 1900, and 2200 °C for 1 h at each temperature. The samples were repolished after each step of HPHT annealing. Repolishing resulted in thickness loss, which, however, even after annealing at 2200 °C did not exceed 15–20% relative to the initial thickness of the samples.
For the comparison, we used natural (untreated) diamonds selected from a collection of small (1–2 mm) diamonds from the Udachnaya kimberlite pipe, Yakutia. Details on how these diamonds were selected are given in Section 3.3.
Infrared absorption spectra were measured at room temperature using a Bruker Vertex 70 FTIR spectrometer (Bruker Optics, Ettlingen, Germany) fitted with a Hyperion 2000 microscope. The IR spectra were taken at different locations of each sample using a 100 μm × 100 μm aperture of the microscope. The spectra were acquired with a resolution of 1 cm−1 and averaging over 64 scans. The samples were mounted onto a computer-controlled XY stage attached to the IR microscope and coordinates of the measurement locations were defined with reference to the corners and edges of the samples. This permitted precise repositioning of the measurement locations on the samples after the annealing experiments. The recorded spectra were converted to the absorption coefficient units by fitting to the standard infrared spectrum of type IIa diamond to obtain the best fit of the intrinsic two-phonon absorption bands (2700–1700 cm−1). The concentrations of the C-, N+-, and A-form nitrogen were determined by decomposing the IR spectra, in the one-phonon region (1350–900 cm−1), into the corresponding components and using conversion factors of 16.5 atomic ppm cm−1 of absorption at 1280 cm−1 for the A centers [17], 25 atomic ppm cm−1 of absorption at 1130 cm−1 for the C centers [18], and 5.5 atomic ppm cm−1 of absorption at 1332 cm−1 for the N+ centers [19]. The spectra were processed using a Bruker OPUS software package (version 6.5, Bruker Optics, Ettlingen, Germany)
Photoluminescence (PL) spectra were measured using a custom-built setup based on a Horiba JY iHR320 monochromator (Horiba Jobin Yvon S.A.S., Lonjumeau, France) equipped with a Syncerity CCD detector. Gratings with 2400, 1800, and 600 grooves/mm were selected from the turret depending on the desired spectral resolution and/or spectral range. Photoluminescence was excited using continuous-wave lasers operating at 473 and 532 nm. An achromatic lens with a focal length of 60 mm was used to focus the laser beam (to a spot of ~20 µm in diameter) onto the sample and to collect photoluminescence signal. Proper optical long-pass edge filters were placed between the collecting lens and a lens (f = 120 mm) focusing PL emission onto an entrance slit of the monochromator. A Linkam FTIR600 heating/freezing stage (Linkam Scientific Instruments, Tadworth, UK) mounted on an XYZ translation stage was used for the low-temperature measurements. The optical scheme also involved an additional switchable channel equipped with a digital camera, allowing for visualization and control of the laser spot position over the sample. Most of the PL spectra presented in this paper were normalized to the intensity of the first-order Raman peak of diamond, which permitted the semi-quantitative comparison of the PL spectra recorded before and after the annealing experiments. In several cases, normalization to the Raman peak intensity was not possible due to the very high intensity of the photoluminescence signal and the spectra were compared with reference to the experimental parameters (excitation laser power, acquisition time, etc.).
3. Results and Discussion
3.1. Characterization of Initial Diamonds
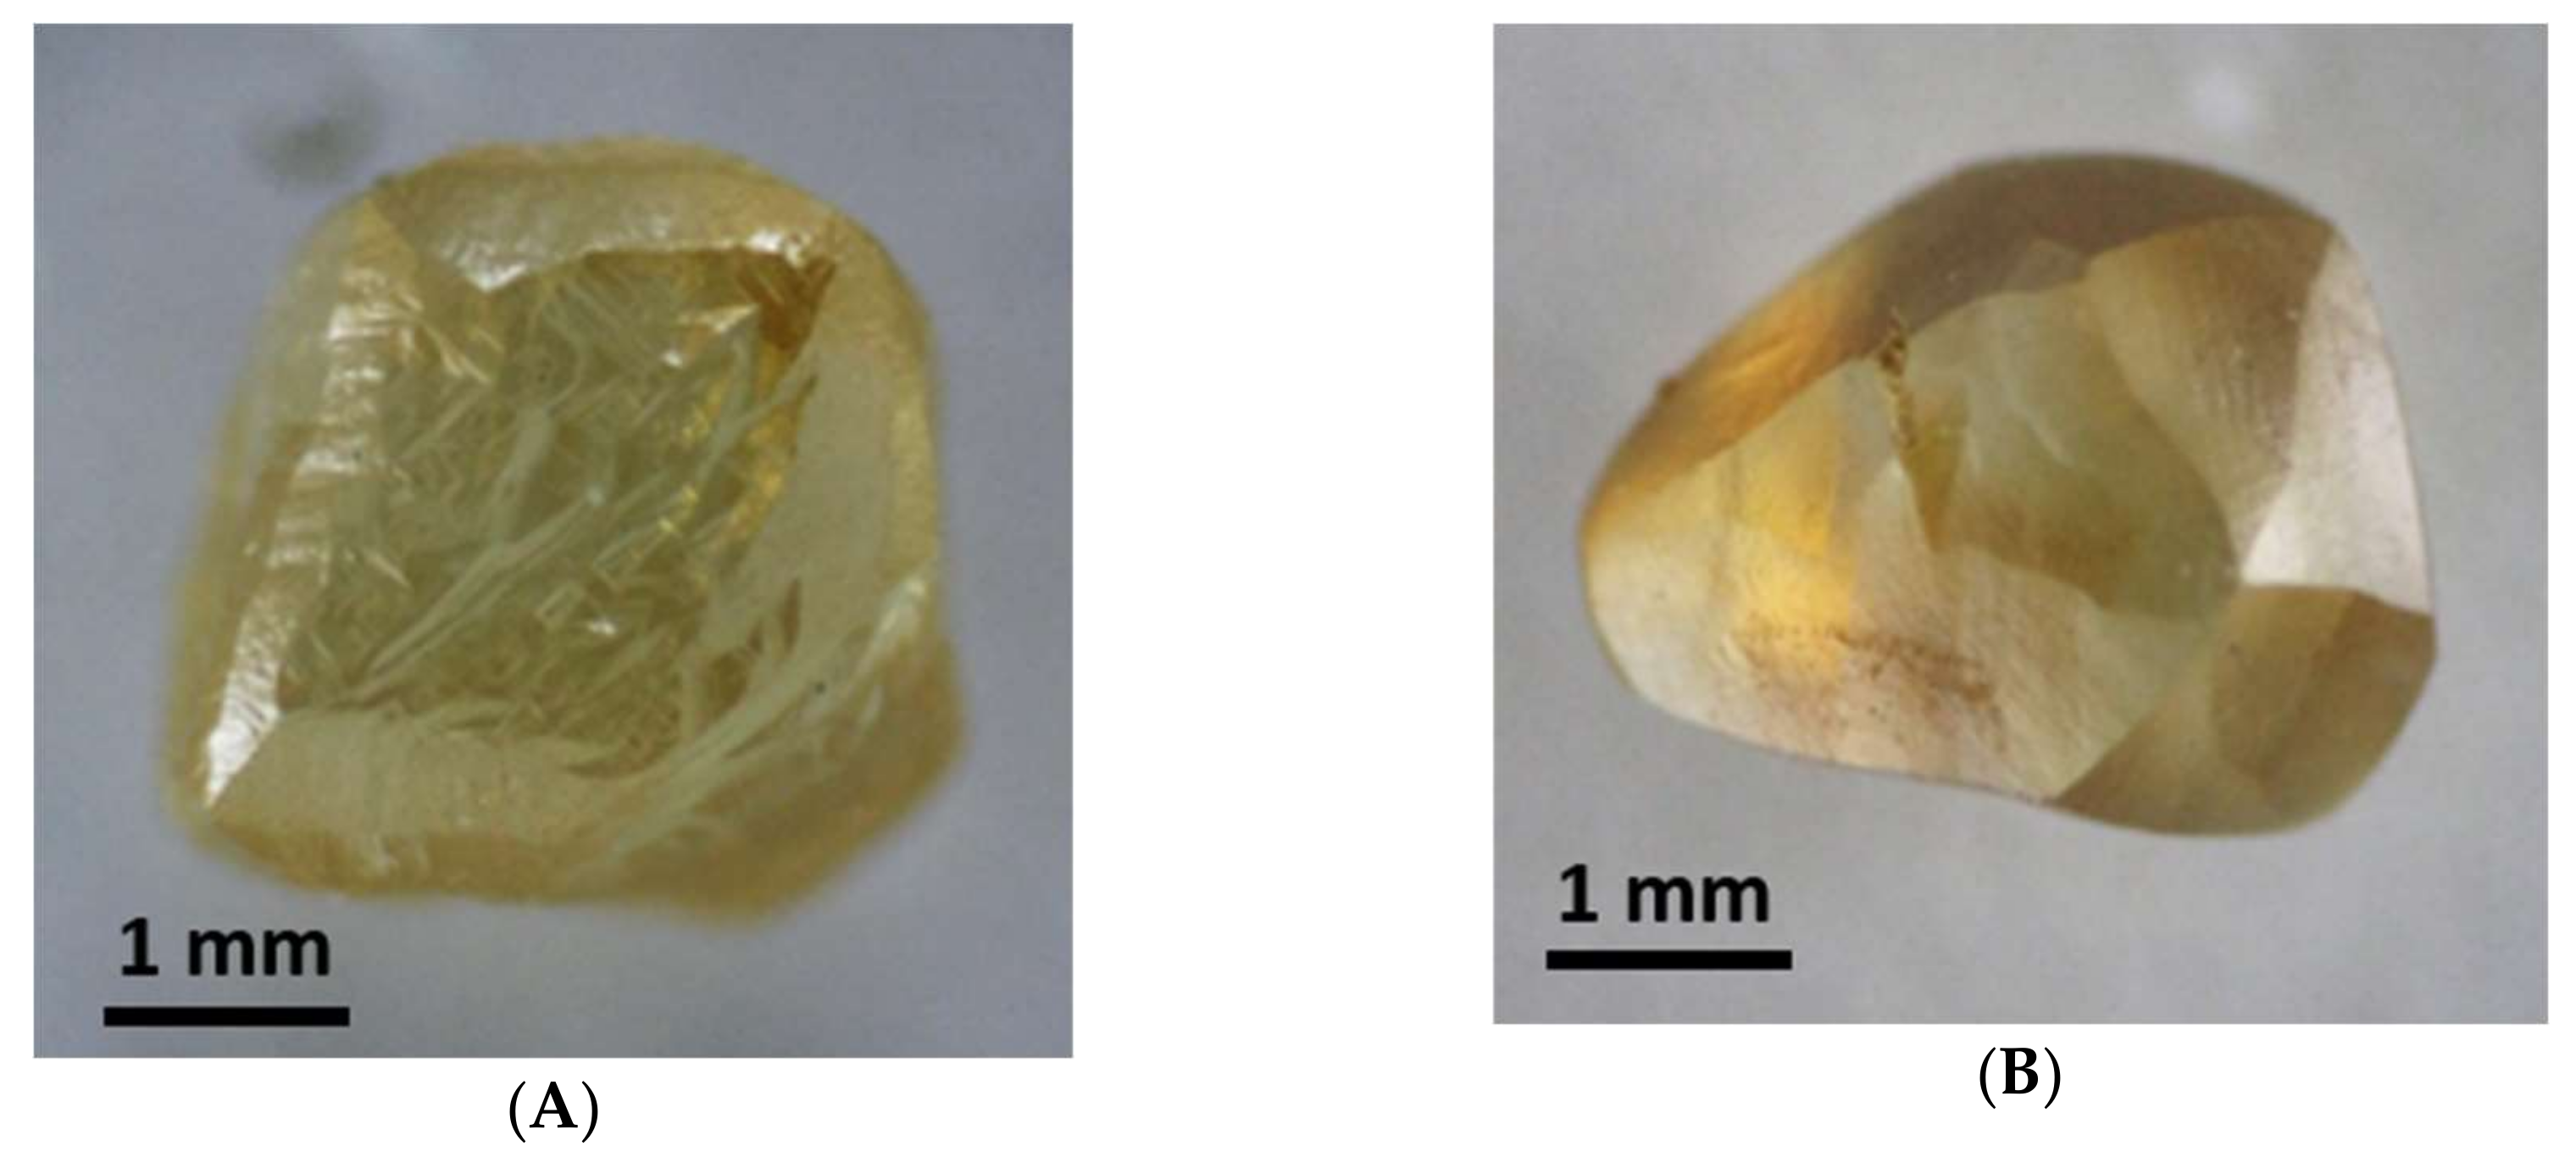
The morphology, internal structure, and spectroscopic characteristics of type Ib-IaA diamonds from the alluvial deposits of the northeastern Siberian Platform have been thoroughly investigated in a number of recent works [8,9,13,20]. The diamond crystals selected for the present study were in many respects similar to those described in these works. All the crystals have yellow-to-brown coloration and show resorbed cuboid (samples Y1 and Y2) or dodecahedral (samples Y3 and Y4) morphologies with extensive dissolution/resorption surface features (Figure 1). The prepared diamond plates show an inhomogeneous distribution of the color-causing defects. When viewed between crossed-polarizers in transmitted light, all the samples show abnormal birefringence, exhibiting either a wavy-like texture or a banded tatami-like texture. These features indicate post-growth plastic deformations, which were proposed to occur through the gliding dislocation mechanism [8]. As it will be shown below, our results further support these conclusions.
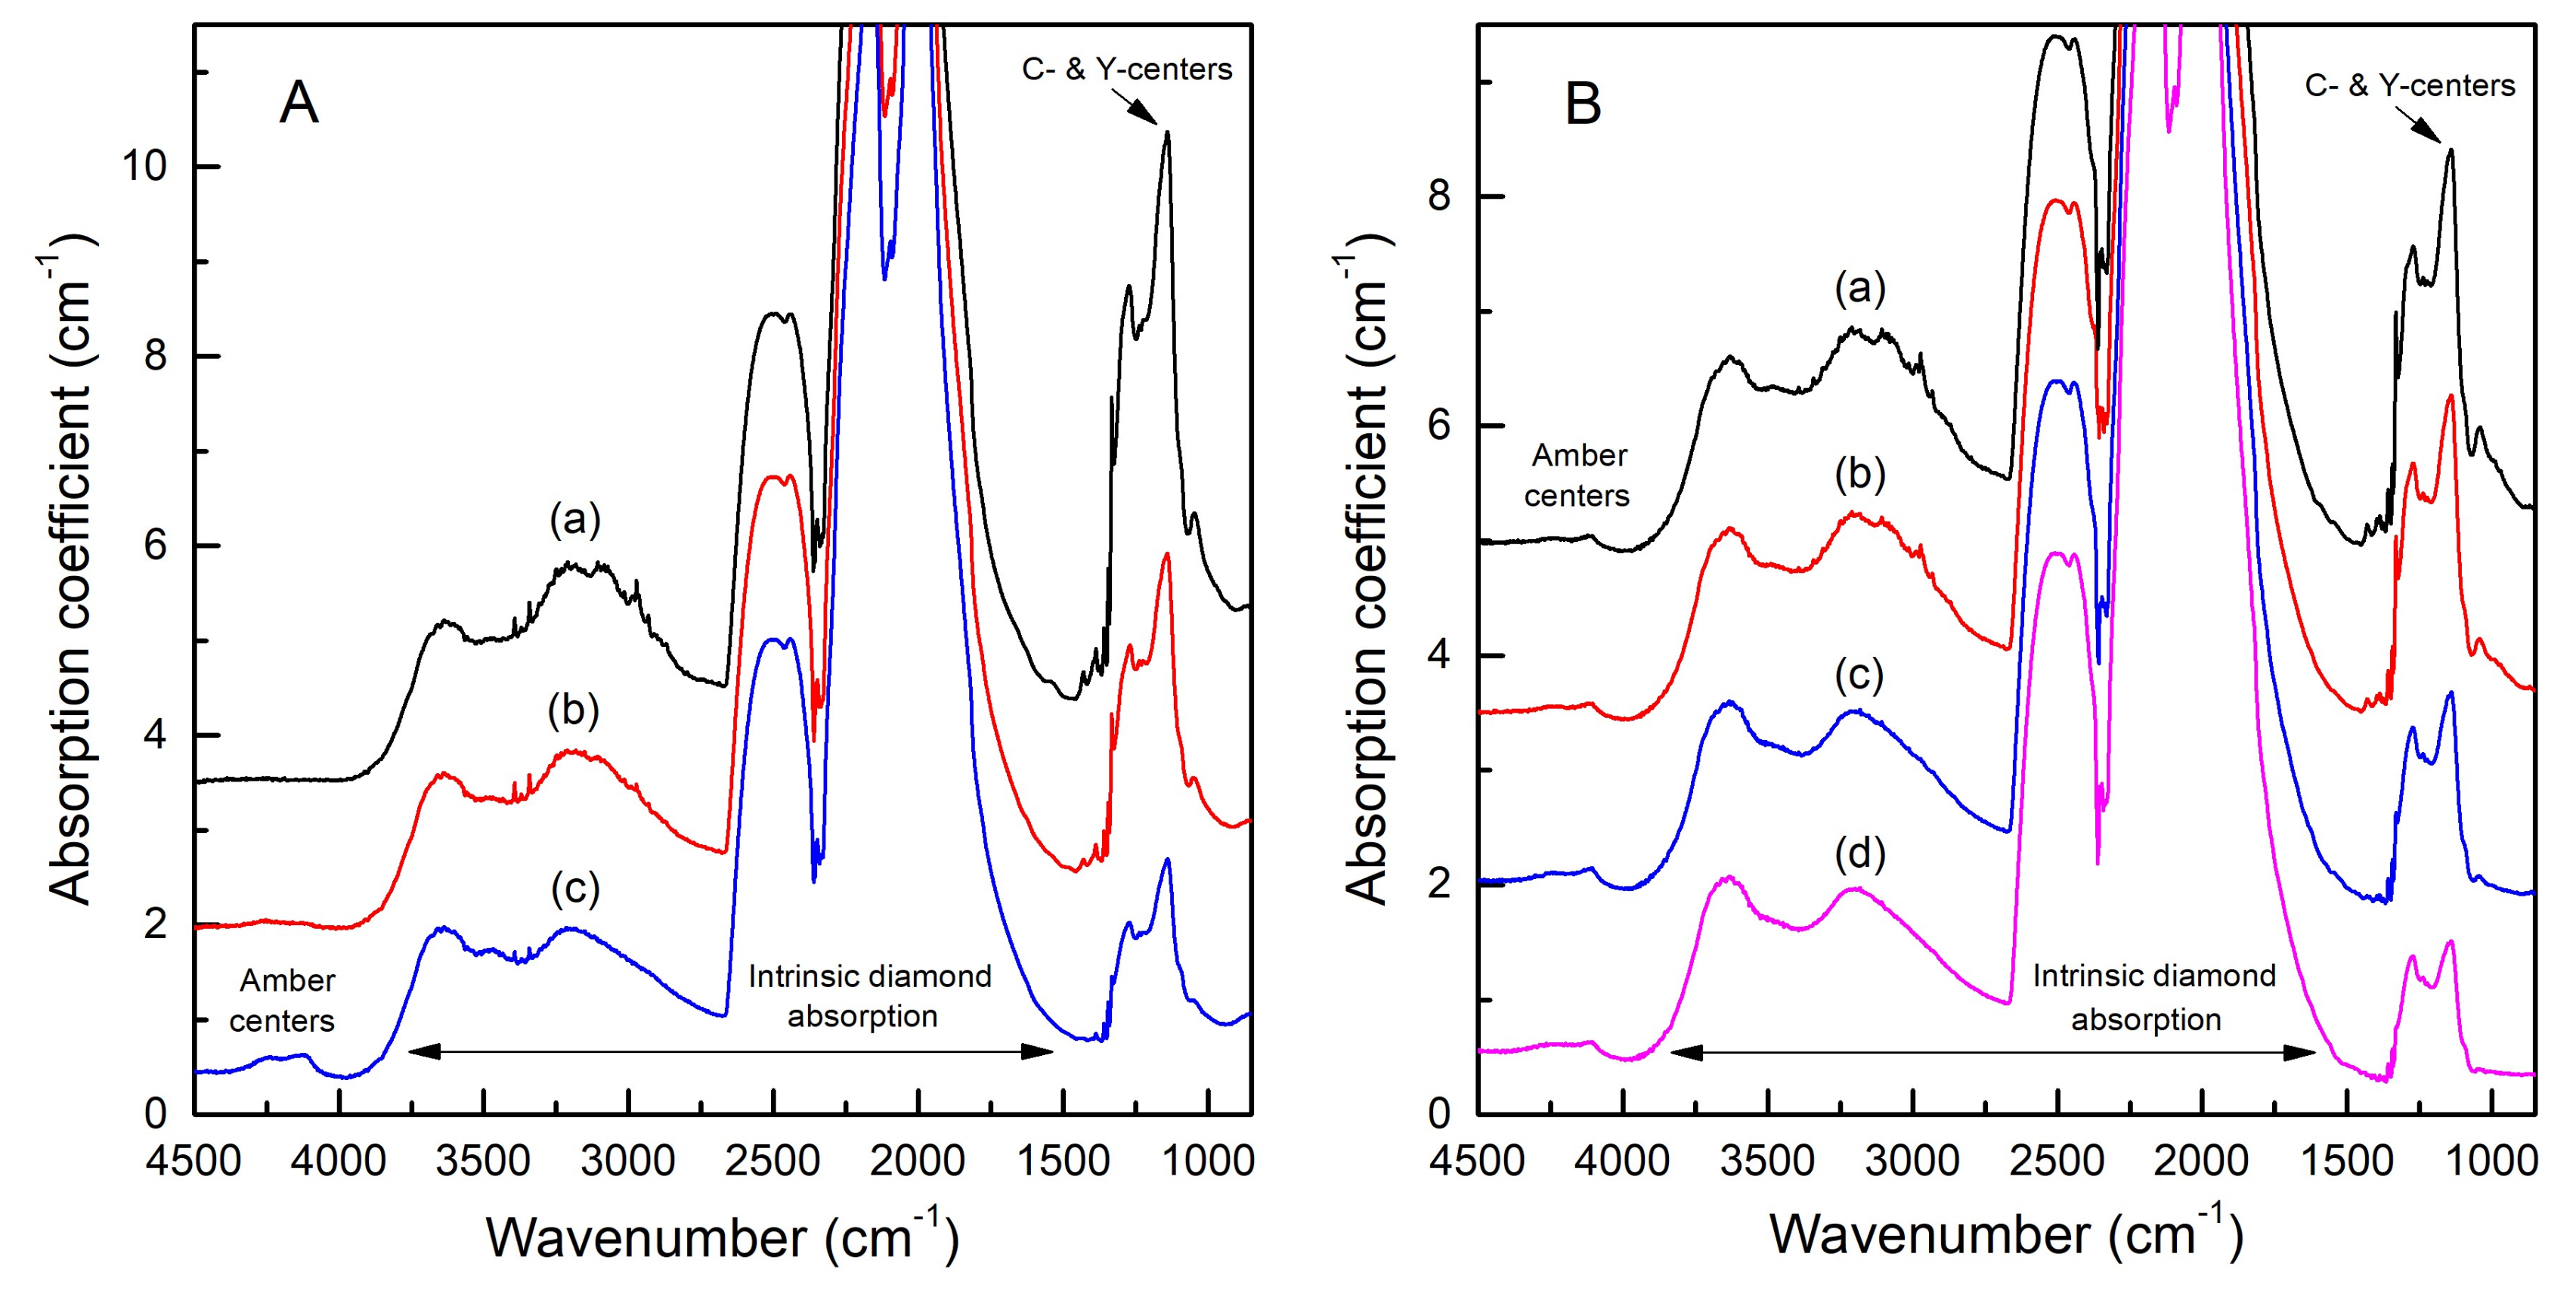
Figure 2 shows representative infrared spectra recorded from different zones across the samples Y1 and Y3. In both cases, absorption in the defect-induced one-phonon region is dominated by a combination of the C center and Y center absorption bands. The absorption has the highest intensity in the central zones of the samples and decreases towards the periphery. The overall band shape is nearly constant for sample Y1 and shows slight variations for sample Y3. In addition, the spectra exhibit relatively weak absorption features caused by the so-called “amber” centers (a series of absorption peaks in the range 4500–4000 cm−1). “Amber” centers are unidentified defects that are commonly observed in the IR spectra of plastically deformed brown diamonds [21]. Similar results were obtained for the other diamond samples (Y2 and Y4) used in the study.
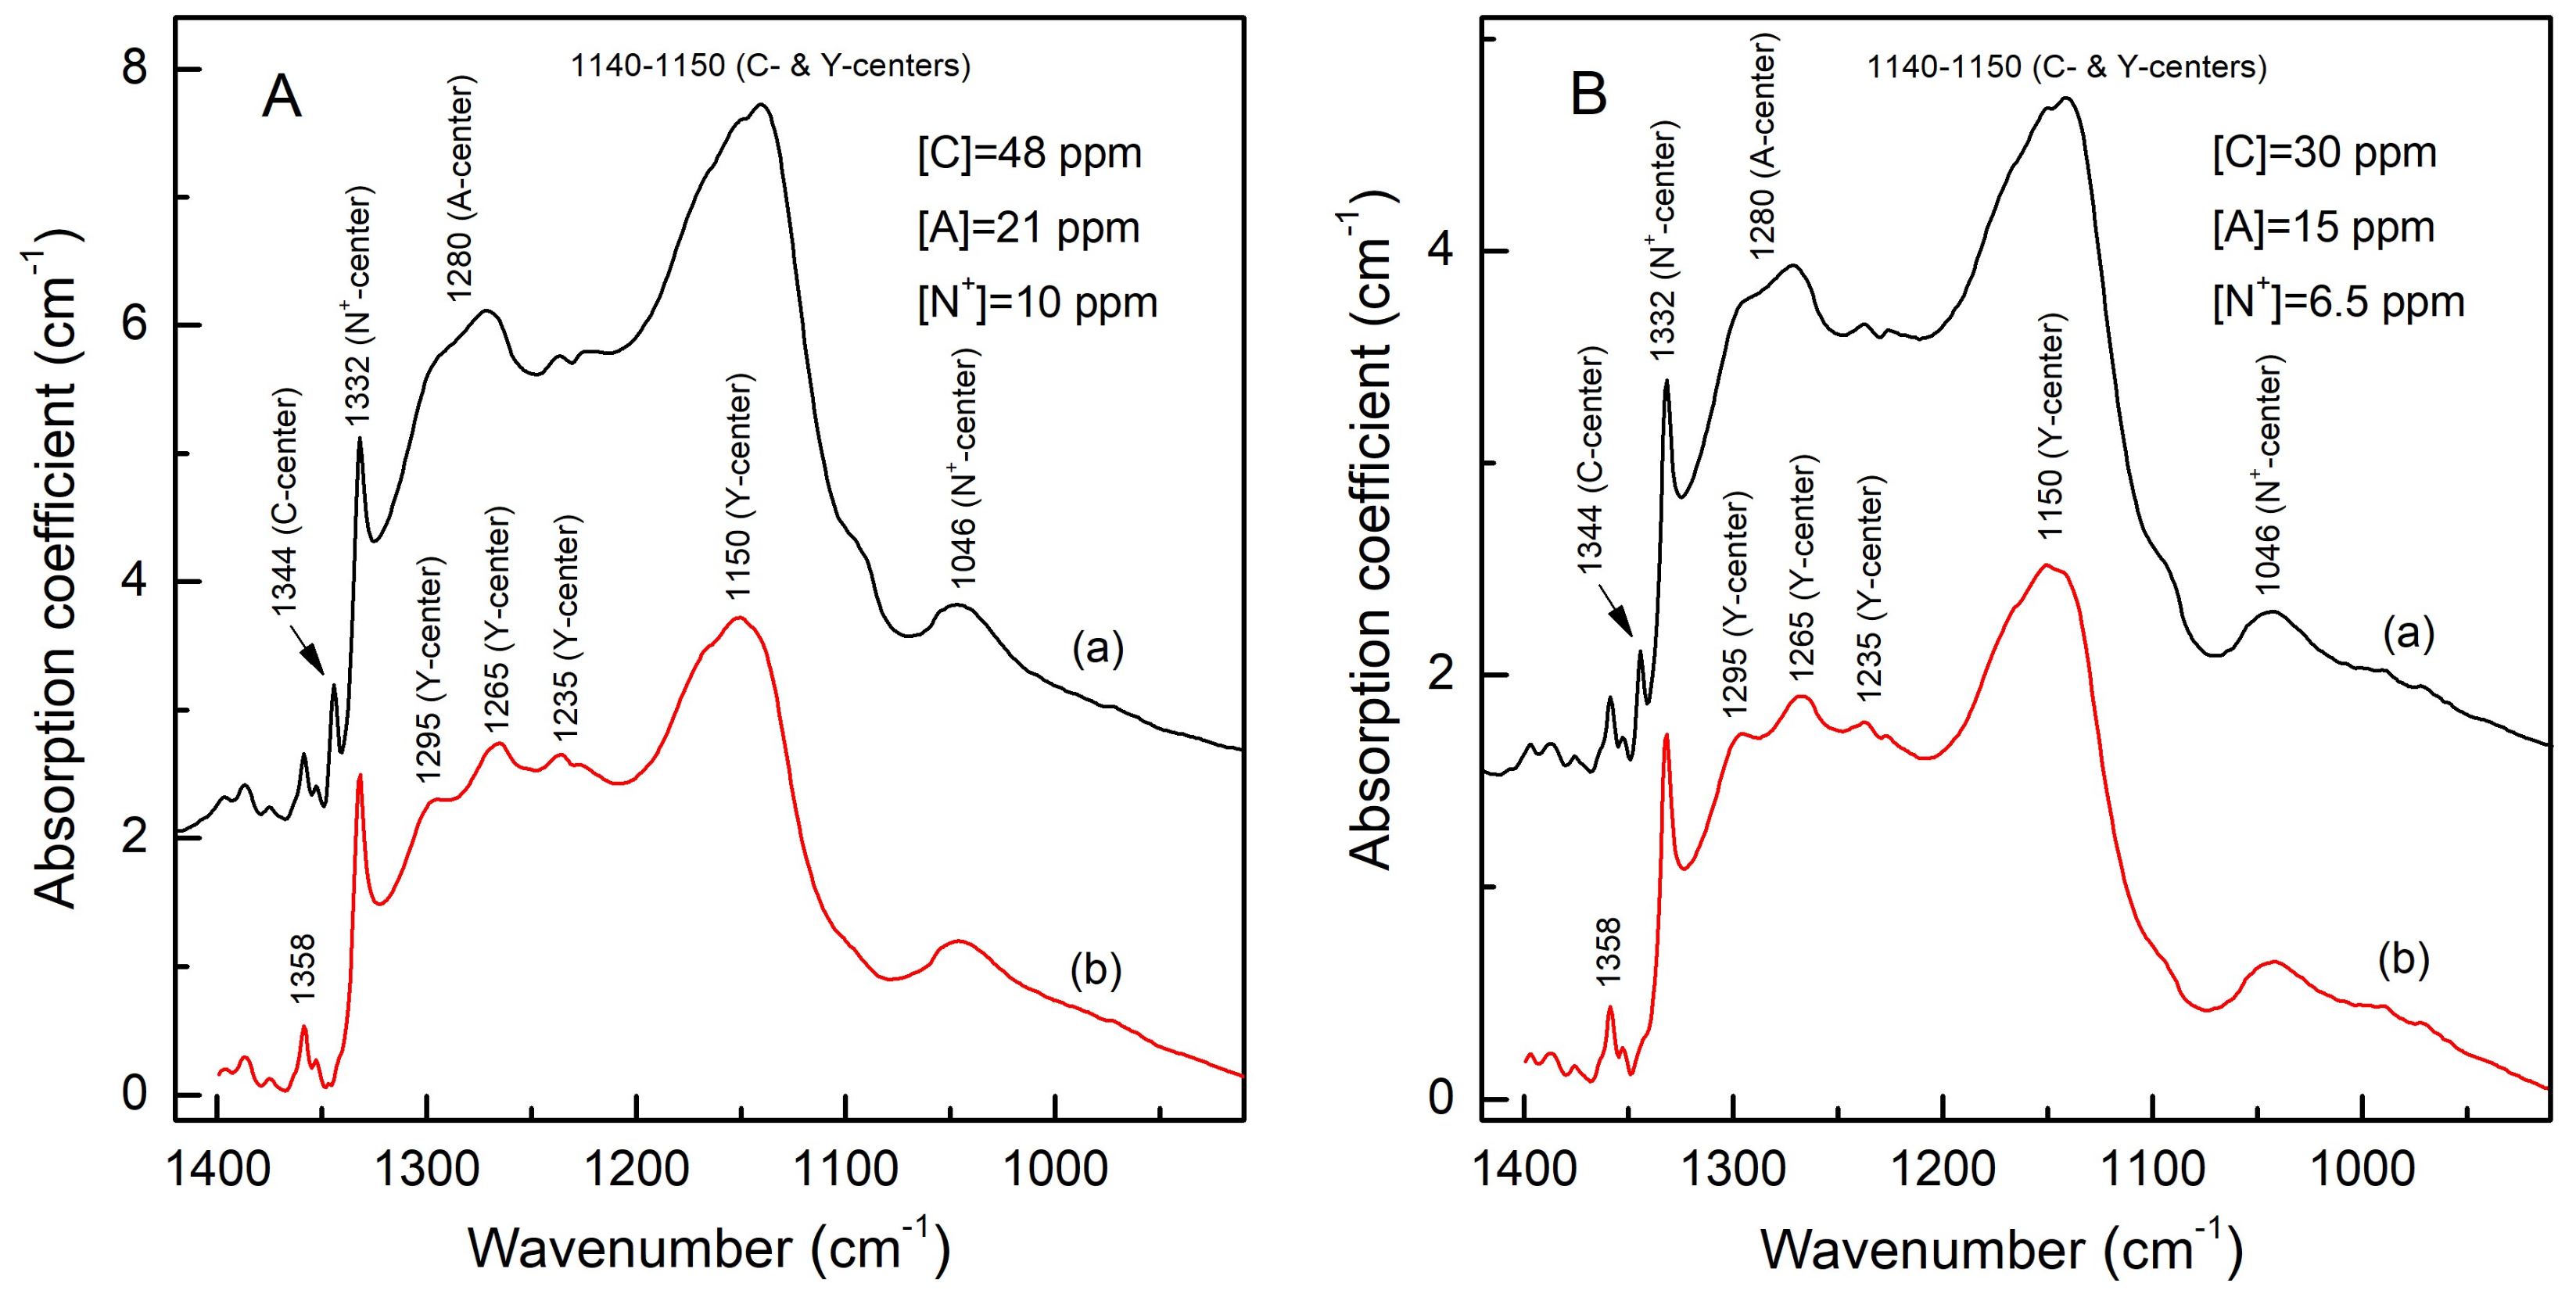
The one-phonon spectra taken from the locations with the dominating Y centers (traces (a) in Figure 2) are shown in Figure 3. It follows that the defect-induced one-phonon absorption is caused by a combination of absorption bands from C centers (isolated substitutional nitrogen with a principal band at 1130 cm−1 and a narrow peak at 1344 cm−1), A centers (nearest-neighbor substitutional nitrogen pairs with a principal band at 1280 cm−1), N+ centers (positively charged isolated substitutional nitrogen with a principal peak at 1332 cm−1 and a characteristic band at 1046 cm−1 [19], and Y centers (a principal band at 1145–1150 cm−1 and a number of weaker peaks at 1235, 1265, and 1295 cm−1 [6]). The difference spectra obtained after the fitting and subtraction of the C- and A-form nitrogen from the recorded spectra were similar for the different samples and agreed reasonably well with the spectra assigned to the Y centers in the preceding studies [6,8]. It should be noted that the diamond samples selected for this study are relatively rare and in most cases the Y centers were present in the IR spectra of type Ib-IaA diamonds as a minor feature dominated by the nitrogen-related absorption.
Let us now consider the photoluminescence characteristics of the initial diamonds. We found that the selected diamonds showed similar photoluminescence features, which, however, differed markedly depending on the sampling locations over the samples. Figure 4 shows the PL spectra recorded from sample Y1 from the areas where the Y centers dominated in the IR spectra. Under the 532-nm excitation, the dominant PL bands originated from the negatively charged nitrogen-vacancy (NV−) centers (zero-phonon line (ZPL) at 637.2 nm) and a vibronic system with a ZPL at 635.4 nm and a series of phonon-assisted peaks caused by the interaction of the electronic transitions with quasi-local phonons with an energy of 40 ± 1 meV. In addition, an array of weak peaks between 580 and 620 nm, and a narrow line at 903 nm were observed in the PL spectra. The 635.4-nm PL system was reported in previous studies of cubic diamonds from placers on the northeastern Siberian platform [9,20]. It is interesting to note that in an earlier paper by Van Royen and Palyanov [22], a vibronic system with a ZPL at 634.8 nm replicated by 40 meV phonons was reported in the PL spectra of type Ib-IaA diamonds from African deposits. We believe that the ZPL position could be determined in [22] with some uncertainty, and the 635.4-nm system observed in this work and preceding studies, and the 634.8-nm system observed by Van Royen and Palyanov [22] correspond to the same optical center. Under the 473-nm excitation, the major PL signals were from the H3 centers (NVN, ZPL at 503.2 nm) and a broad band peaking at about 680 nm. An interesting feature found in this case is a vibronic system with a narrow ZPL at 525.4 nm and weak phonon replicas caused by coupling with quasi-local phonons with energies of 37 ± 1, 48 ± 1, and 57 ± 1 meV. Obviously, it is the same vibronic system as that reported by Zudina et al. [20] (ZPL at 525.1 nm) for similar diamonds. Recently, a peak at 525.4 nm was reported to occur in the PL spectra of type Ib-IaA diamonds from Zimmi (West African craton) [11]. It is interesting to note that both for the diamonds studied in this work and diamonds from Zimmi, the occurrence of the 525.4-nm defects was restricted to central regions of the samples.
PL spectra recorded from the areas with a minor content of Y centers, which as a rule were located in the peripheral parts of the sample, mainly show the nitrogen-related centers (Figure 5). Neutral (575 nm) and negatively charged (637 nm) NV centers and the H3 centers (NVN, ZPL at 503.2) dominated in the PL spectra. Most probably, these centers could have formed as a result of plastic deformation processes. It should be noted that the overall PL intensity from the peripheral parts of most samples was several times higher than that from the central parts. Comparing the spectra in Figure 4 and Figure 5, one can note that the 635.4-nm defects are restricted to the central part of the sample where the Y and N+ centers dominate.
3.2. Characterization of Diamonds after HPHT Treatments
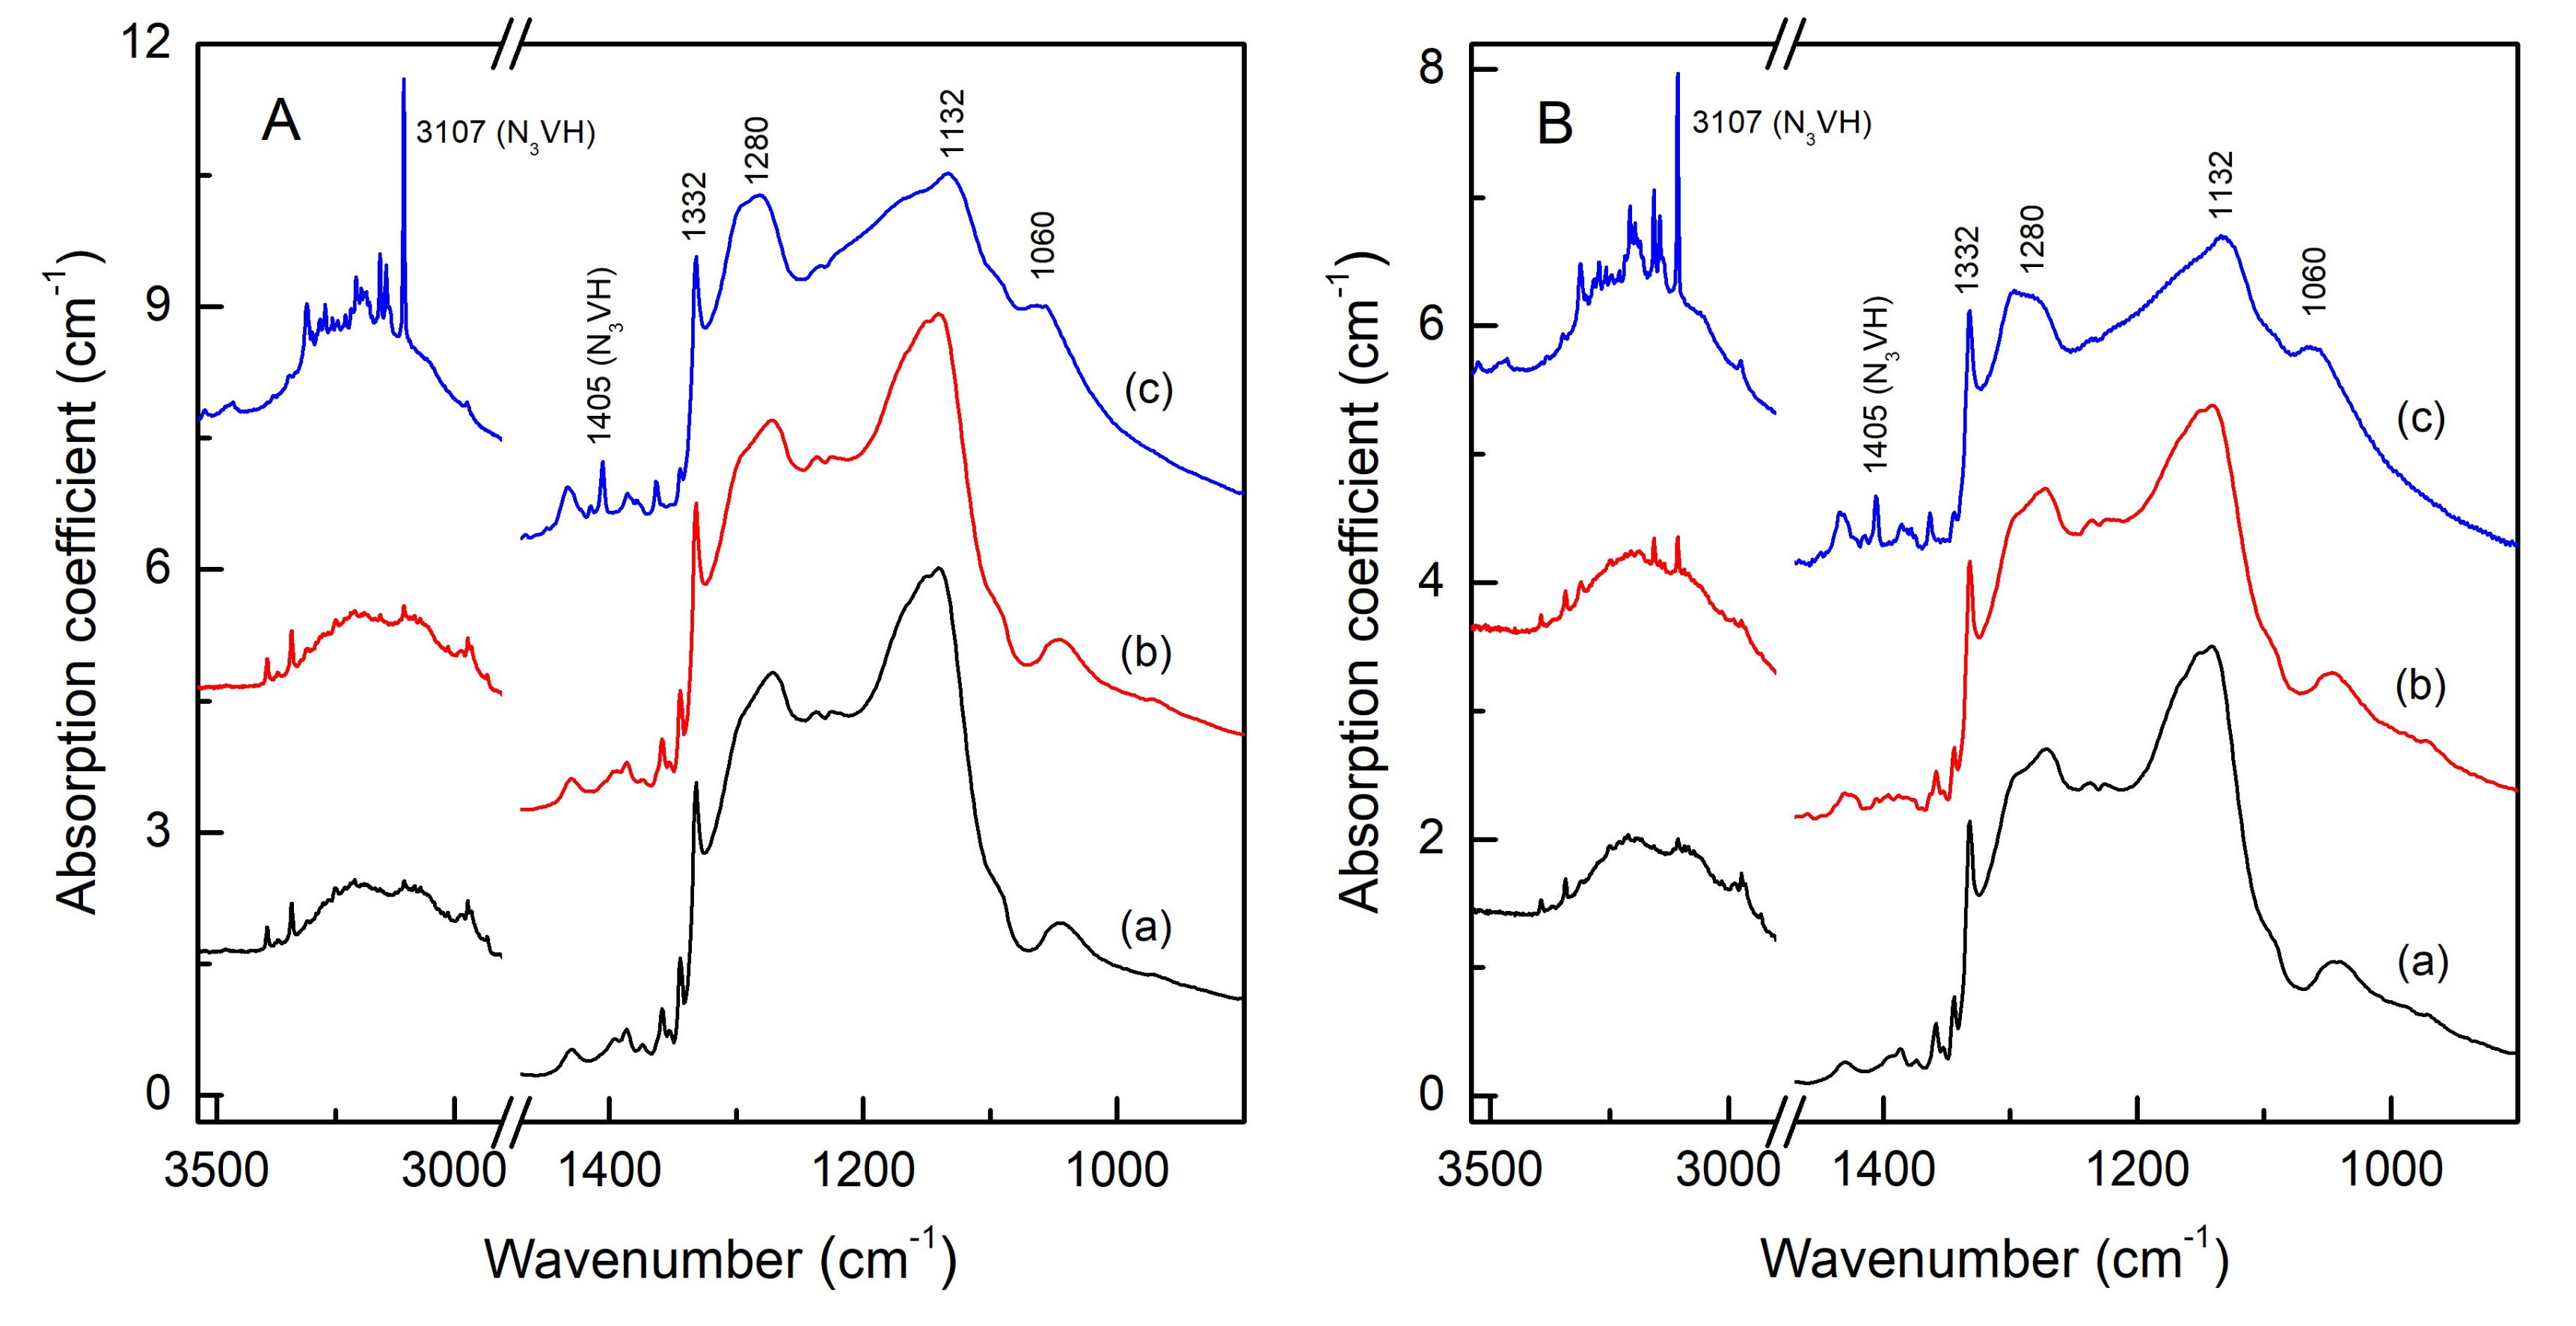
The diamond samples were annealed at several temperatures between 1700 and 2200 °C for 1-2 h. We found that treatments at 1700 and 1900 °C did not significantly affect the infrared spectra of the samples in the one-phonon region (Figure 6). Although these annealing temperatures were sufficiently high to activate the diffusion mobility of isolated substitutional nitrogen, no changes in the nitrogen aggregation degree were detected within the accuracy of the nitrogen content calculations. The only changes found in the spectra were associated with the annealing of the “amber” centers, which completely annealed out at 1900 °C. Annealing at higher temperatures, 2100–2200 °C, resulted in a drastic change of the IR spectra. The Y center absorption considerably decreased in intensity. Single substitutional nitrogen partly aggregated to form A centers. A new absorption component peaking at 1060 cm−1 appeared in the spectra. We shall consider this absorption feature later in the text. It was found that the total nitrogen concentration did not significantly change and, for a given measurement location, remained constant to within ±10 ppm throughout the annealing sequence. No clear signs indicating the formation of the B centers were detected in the IR spectra of samples annealed at 2100–2200 °C. In addition, annealing at 2100–2200 °C led to the formation of a complex array of absorption lines in the hydrogen-related spectral range (3400–3000 cm−1). The most intense of them was the 3107-cm−1 line caused by the N3VH defects [23]. Similar observations of the strong effect of HPHT treatment on the intensity of hydrogen-related absorption were made in a number of previous works concerned with the HPHT treatment of mixed type Ib-IaA natural diamonds [7,24,25].
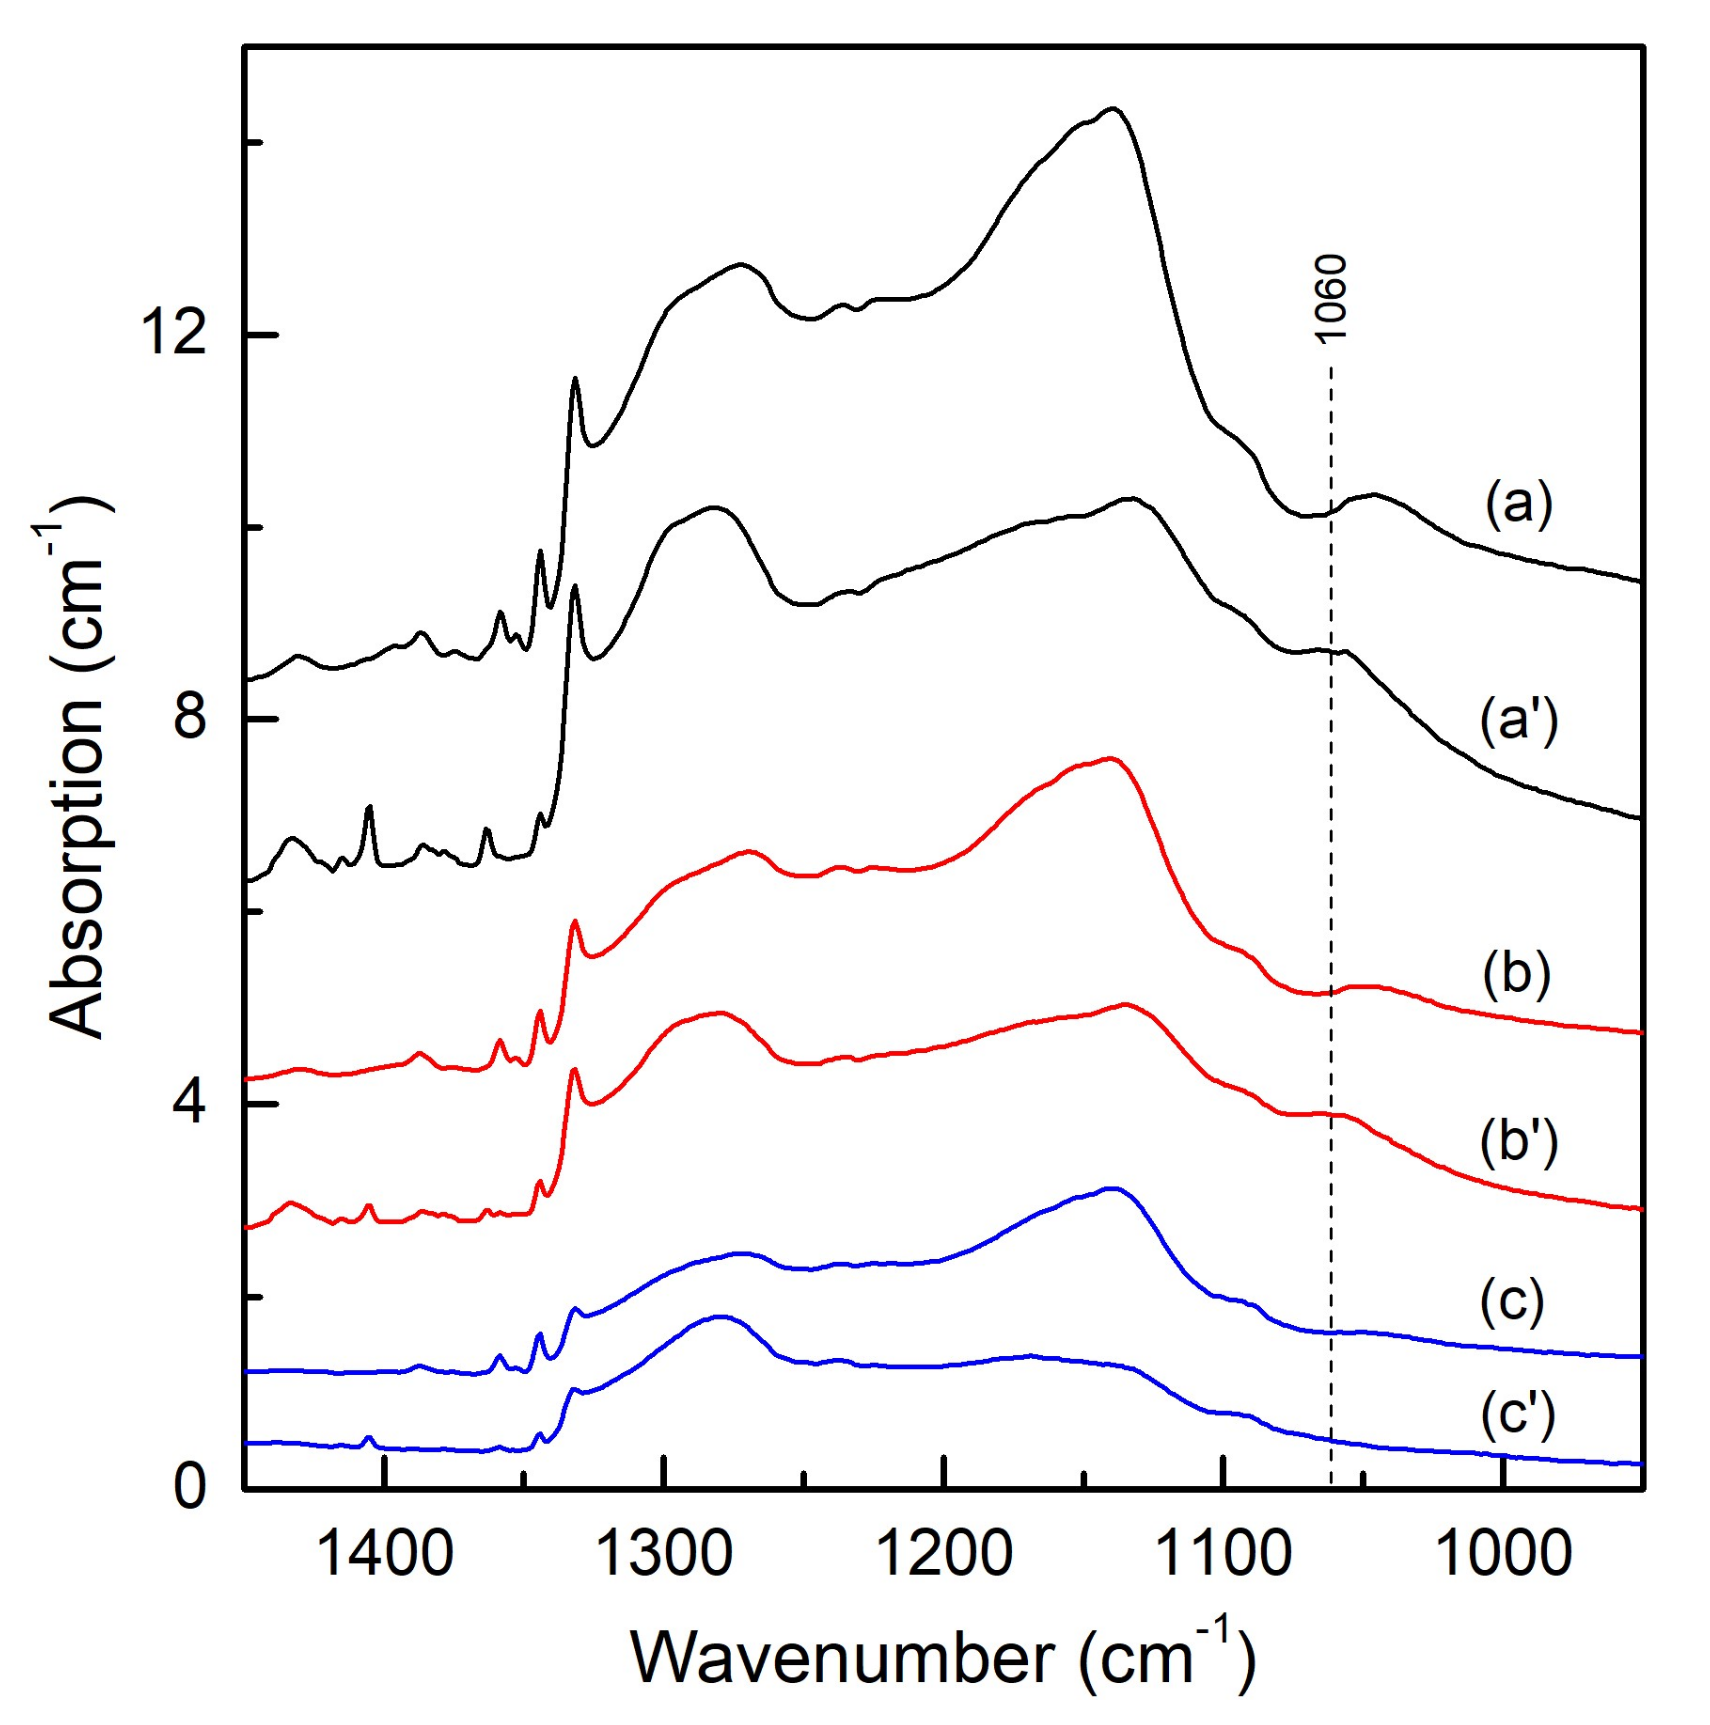
The absorption strength of the new component at 1060 cm−1 was found to correlate with the strength of the Y center absorption in the initial diamond samples. As demonstrated in Figure 7, in the spectra of annealed samples, the 1060-cm−1 peak was absent in the spectra recorded from those areas where the Y center absorption was very weak and/or absorption due to nitrogen defects prevailed.
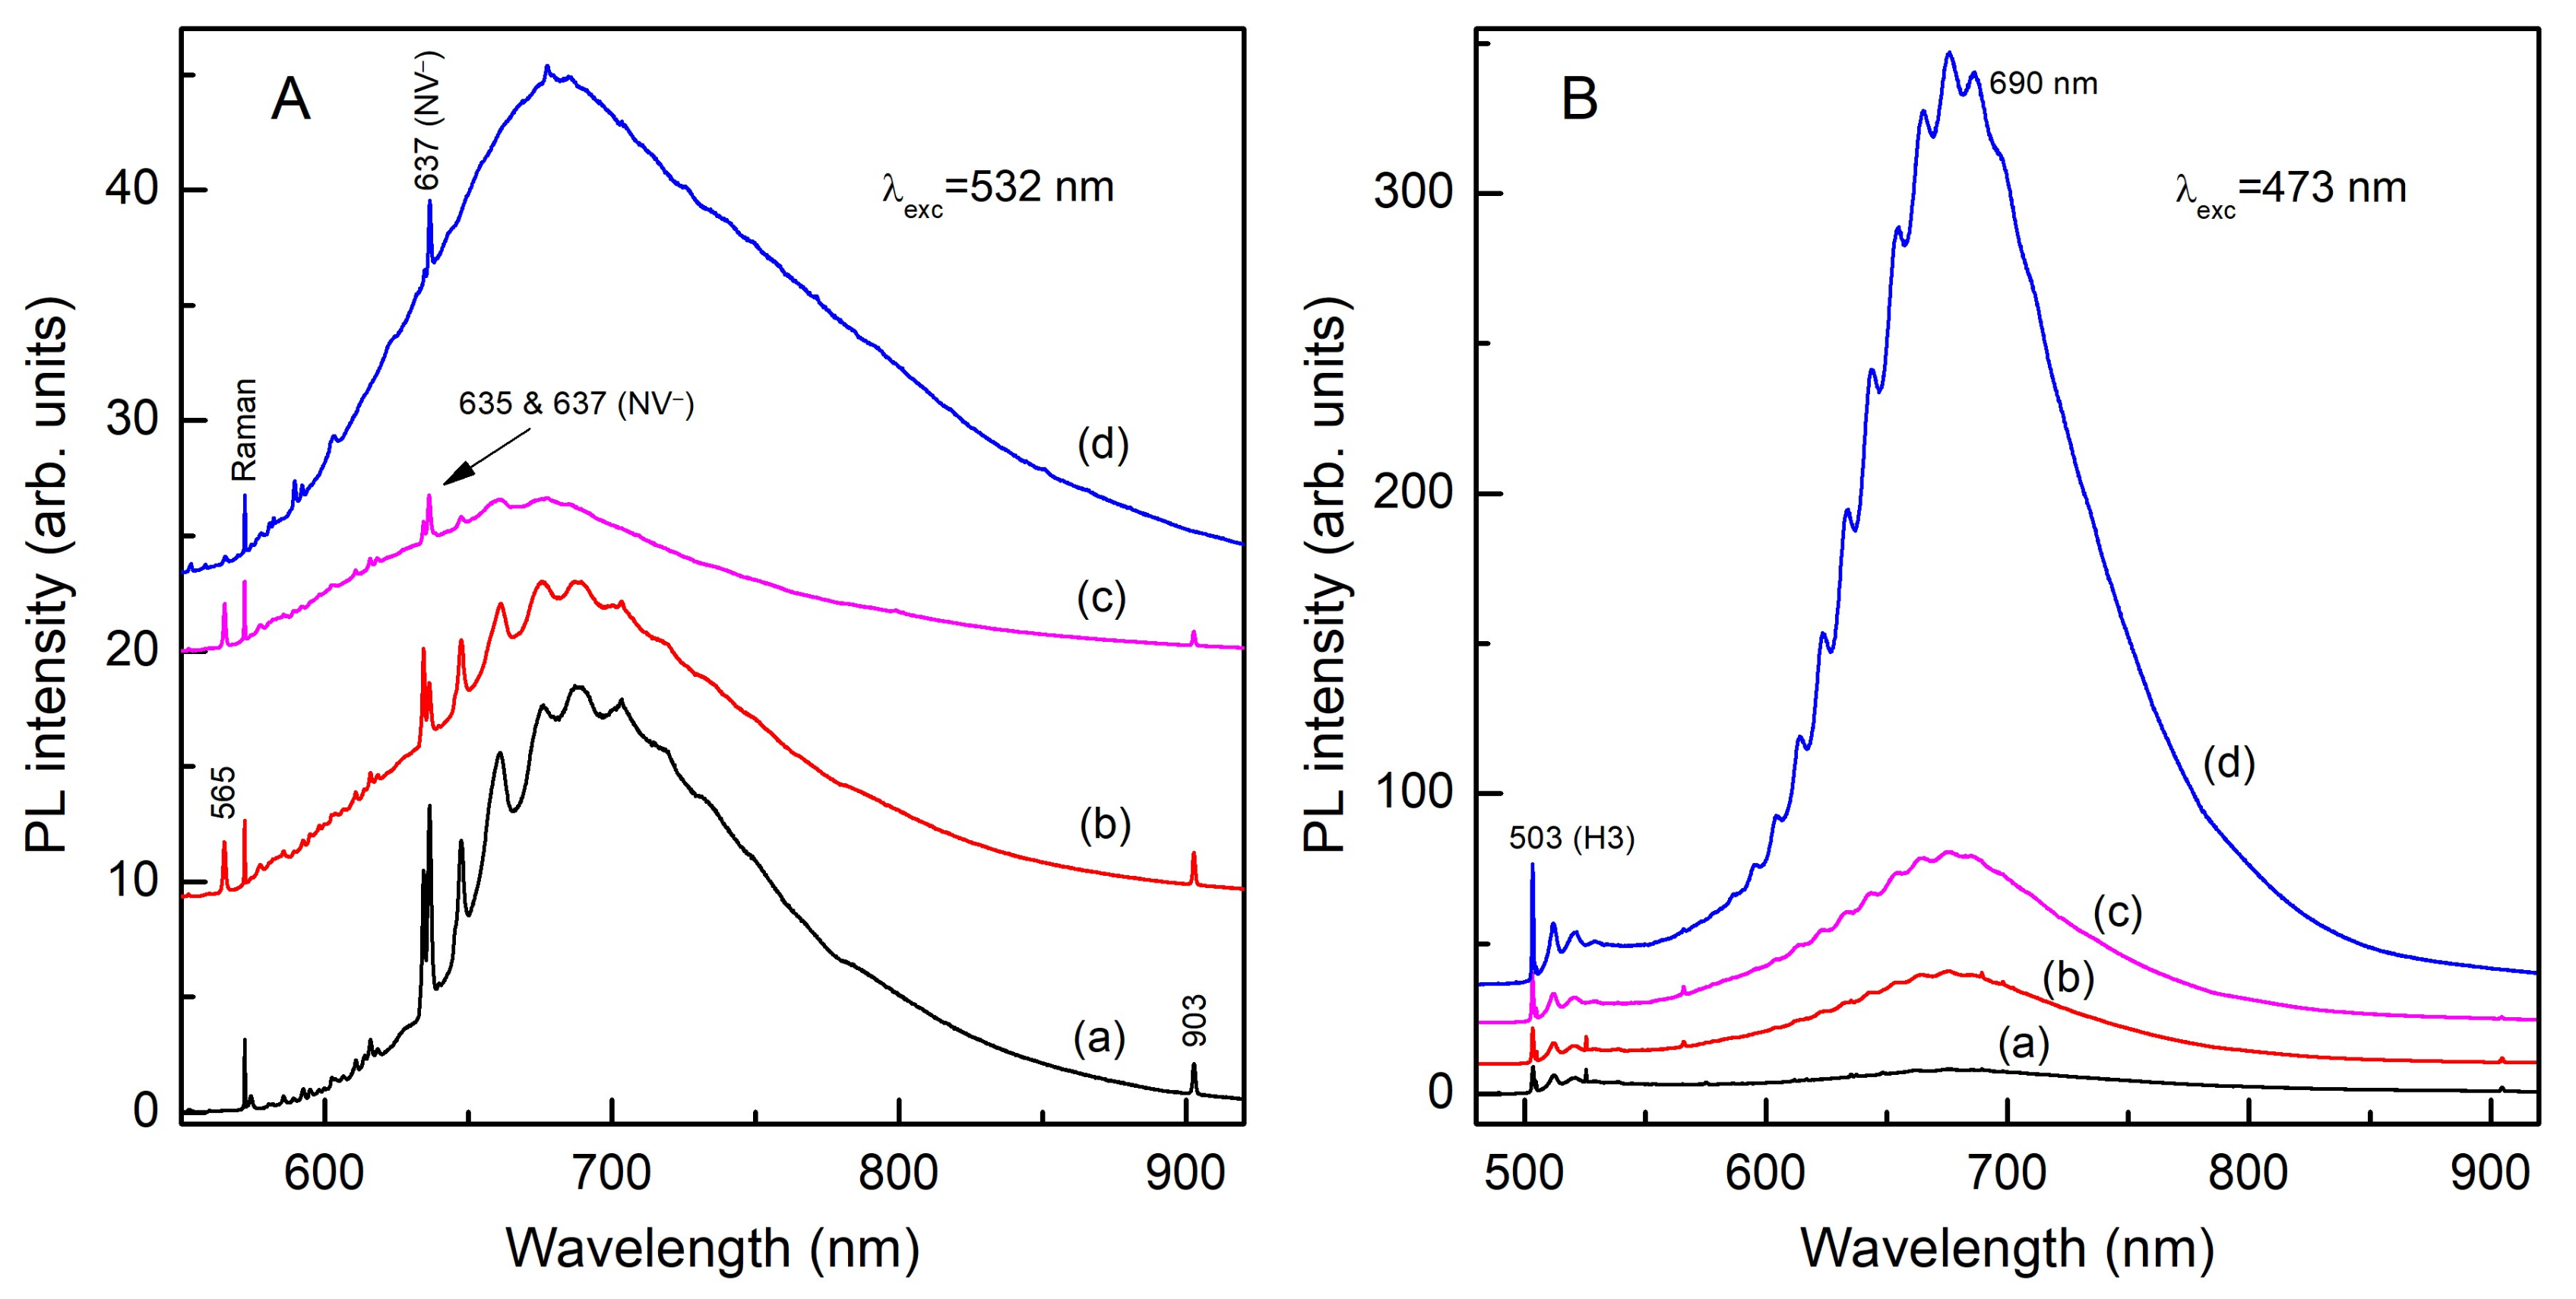
Let us now consider the changes produced by HPHT treatments in the photoluminescence spectra. Figure 8 shows the PL spectra recorded from nearly the same Y-center-rich area of sample Y1 after annealing at different temperatures. Measurements with the 532-nm excitation revealed that both the NV− centers and the 635.4-nm centers decayed throughout the annealing sequence from 1700 to 2100 °C. After annealing at 2100 °C, a broad featureless band peaking at 680–690 nm dominated in the PL spectra. Remarkable results were found from the PL measurements with the 473-nm excitation. The main finding here concerns the appearance and development of a broad band peaking at 690 nm and showing a specific phonon-related structure. Although the 690-nm band appeared in the spectra after annealing at 1700 °C, it was drastically enhanced only after annealing at 2100–2200 °C. Note, it is this threshold temperature that affected the Y centers most significantly. It should be noted that the presence of a broad band centered at about 690 nm in the photoluminescence of annealed diamonds containing Y centers was previously noted by Hainschwang et al. [7]. However, the PL spectrum presented in [7] exhibited this band only as a weak minor feature and was dominated by the emission from the H3 centers. The 690-nm red luminescence band representing an interesting case of a strong electron–phonon coupling (Huang-Rhys factor of 9.9) to a single low-frequency quasi-local mode (hνph = 30 meV) has been investigated in a number of earlier works [26,27,28] and more recent studies [29,30]. As it was found in the preceding studies, the 690-nm red luminescence band was frequently found in the PL spectra of some specific types of natural brown diamonds [26,27,28,29,30]. When excited with a long-wave ultraviolet light (365 nm), these diamonds show a characteristic yellow luminescence [27,28,29].
Different results were found for those areas of the diamonds where the Y center absorption in the IR spectra was weak or negligible relative to the nitrogen-related absorption. In this case, as shown in Figure 9, annealing at 1700 and 1900 °C resulted in a decrease of the PL intensity from the NV- centers and the development of another vibronic system with a ZPL 565.3 nm and an accompanying phonon sideband (one-phonon replicas are at 46 ± 1 and 70 ± 1 meV). After annealing at 2100–2200 °C, the 565.3-nm system significantly decreased in intensity and a number of new relatively weak PL features appeared in the spectra excited with the 532-nm wavelength. These include vibronic systems with ZPLs at 555.3, 559.1, and 597.1 nm (hνph = 50 ± 1 meV). Spectra recorded with the 473-nm excitation were dominated by the H3 centers, whose concentration increased on annealing at 1700 °C and more significantly at 1900 °C. After annealing at 2100–2200 °C, the 690-nm band appeared in the spectra, but with an intensity about an order of magnitude lower than in the case of Y-center-rich areas. In addition, a narrow peak at 486.1 nm was observed. We suppose that except for the appearance of the 690-nm band, the other changes observed in the PL spectra from the peripheral parts of the diamonds are related to the annealing and/or transformation of defects caused by plastic deformations [31,32]. This subject undoubtedly deserves further investigation and will be considered elsewhere.
3.3. Comparison with Red-Luminescing Natural Diamonds
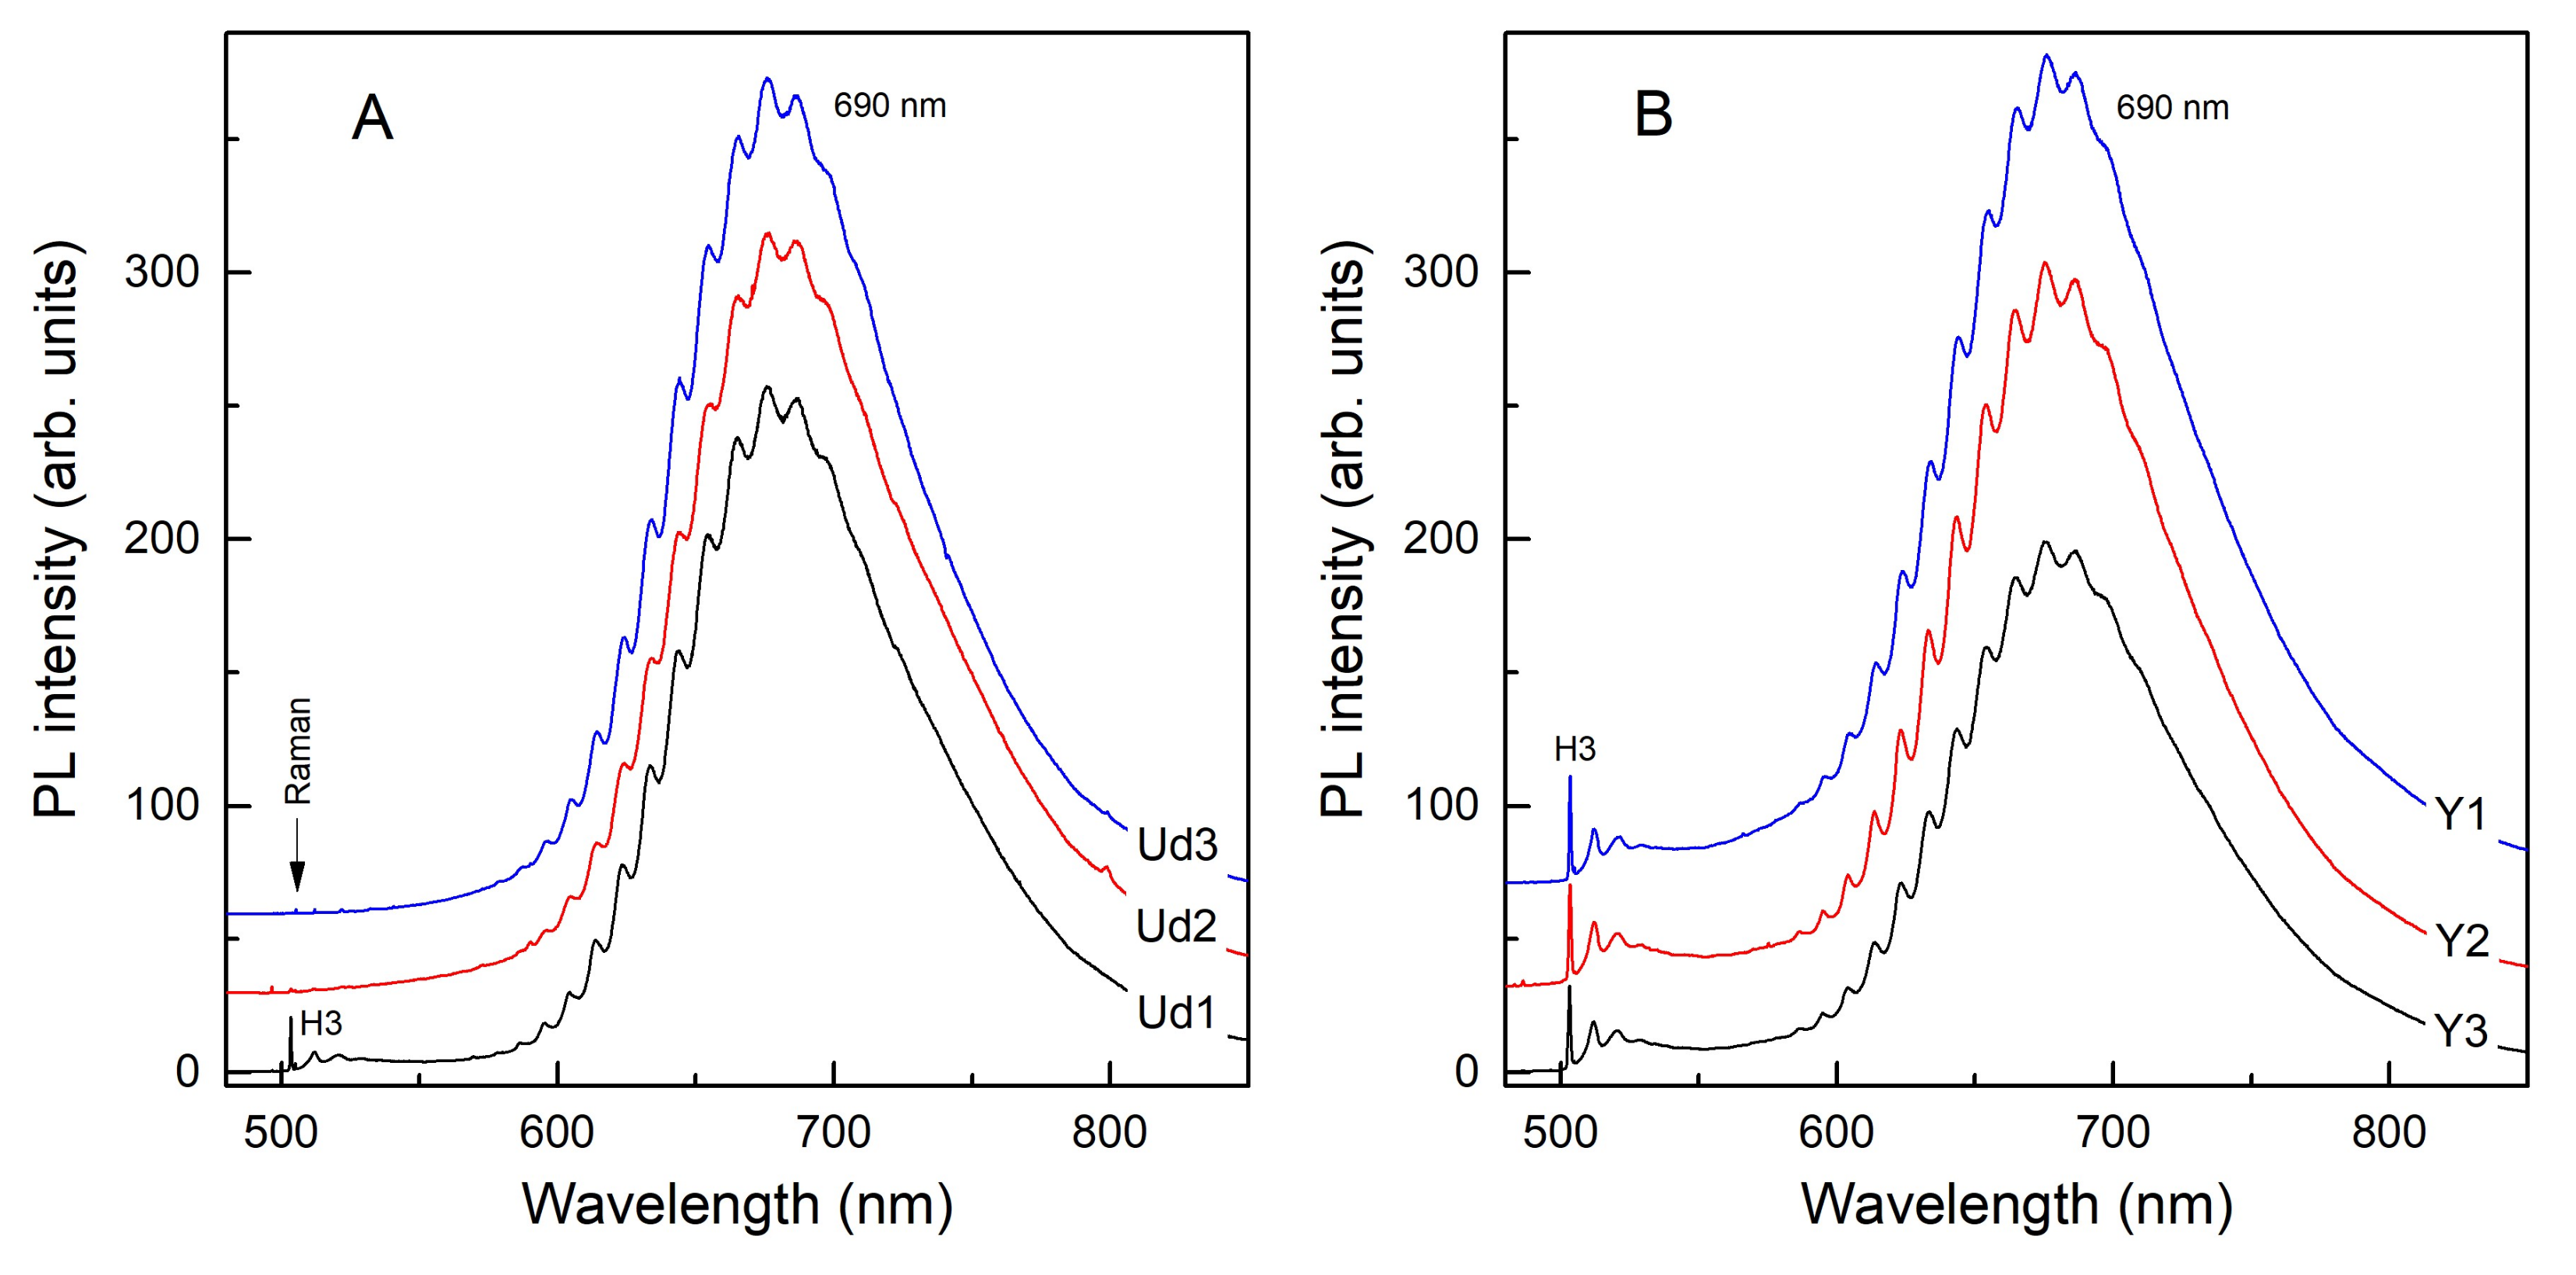
The results presented in the preceding sections show that HPHT treatment of natural type Ib-IaA diamonds containing Y centers produces significant changes in their infrared and photoluminescence spectra. The most striking results were found for the cases when the Y centers dominated. Annealing at 2100–2200 °C resulted in a drastic change of the infrared one-phonon spectra and the development of the 690-nm red luminescence band. This band has been frequently observed in the photoluminescence of specific natural brown diamonds that are thought to have some type Ib characteristics [26,27,28]. Therefore, it is of interest to compare the IR spectra of the diamonds annealed in this study with the spectra of naturally occurring red-luminescing diamonds. For this purpose, we examined a suite of small diamonds (1–2 mm) from the Udachnaya kimberlite pipe, Yakutia. A number of diamonds showing intense red luminesce under a blue light excitation were picked out and their PL and IR spectra were recorded. Figure 10 (panel A) shows the PL spectra recorded for the selected diamonds, denoted as Ud1, Ud2, and Ud3, and for the Y-center-rich diamonds annealed in this work (panel B). As it can be seen, the spectra are very similar, being dominated by the 690-nm band. The IR spectra of the Ud1–Ud3 diamonds are shown in Figure 11, panel A. In panel B, we show the IR spectra obtained in this work, from which the C center component was subtracted. It follows that the spectra of the red-luminescing natural diamonds and HPHT-treated diamonds containing the Y centers look similar, showing a common absorption feature at 1060 cm−1. We can conclude that the well-known 690-nm red emission band and the specific IR absorption band at 1060 cm−1 are genetically related to the Y centers. An intriguing question is what is the nature of the defects and/or impurities responsible for these features? It was hypothesized that the 690-nm red luminescence band and therefore the Y centers could be related to oxygen impurities [29,30,33]. This hypothesis awaits experimental confirmation using mass-spectroscopic and other techniques.
4. Summary
We report a spectroscopic study of natural type Ib-IaA diamonds containing Y centers subjected to HPHT treatment at 7–7.5 GPa and 1700–2200 °C. Diamond samples showing the Y centers as the dominant absorption feature in the infrared spectra were selected from a collection of natural diamonds from alluvial placers of the northeastern Siberian Platform. The samples were investigated by spectroscopic techniques before and after each annealing stage. It was found that upon annealing at temperatures higher than 2000 °C, the defect-induced one-phonon spectra changed from the Y centers to a new form showing a characteristic band peaking at 1060 cm−1. The photoluminescence spectra of the samples were modified after each annealing stage starting from 1700 °C. The most significant changes in photoluminescence occurred at temperatures higher than 2000 °C and were associated with a sharp increase of intensity of an emission band peaking at about 690 nm. A comparison with natural red-luminescing diamonds from Yakutian kimberlite pipes was performed. It was concluded that the observed 1060-cm−1 IR band and the well-known red emission band at 690 nm are genetically related to the Y centers. Given the abundance of the 690-nm PL band in natural diamonds, we may further speculate that the defects or impurities responsible for the Y centers are quite widespread in natural diamonds from various deposits worldwide.
Author Contributions
Conceptualization, Y.N.P., I.N.K., and V.S.S.; methodology, Y.N.P. and I.N.K.; investigation, I.N.K. and A.A.K.; writing—original draft preparation, I.N.K.; writing—review and editing, Y.N.P., I.N.K. and V.S.S. All authors have read and agreed to the published version of the manuscript.
Funding
This research was funded by RFBR grant 18-05-70014 and the state assignment of IGM SB RAS.
Acknowledgments
We thank Yu. M. Borzdov and D.V. Nechaev for their assistance in the course of the study.
Conflicts of Interest
The authors declare no conflict of interest.
References
- Walker, J. Optical absorption and luminescence in diamond. Rep. Prog. Phys. 1979, 42, 1605–1660. [Google Scholar] [CrossRef]
- Field, J.E. (Ed.) The Properties of Natural and Synthetic Diamond; Academic Press: London, UK, 1992. [Google Scholar]
- Zaitsev, A.M. Optical properties of diamond. In Data Handbook; Springer: Berlin, Germany, 2001; p. 502. [Google Scholar]
- Evans, T. Aggregation of nitrogen in diamond. In The Properties of Natural and Synthetic Diamond; Field, J.E., Ed.; Academic Press: London, UK, 1992; pp. 259–290. [Google Scholar]
- Taylor, W.R.; Canil, D.; Milledge, H.J. Kinetics of Ib to IaA nitrogen aggregation in diamond. Geochim. Cosmochim. Acta 1996, 60, 4725–4733. [Google Scholar] [CrossRef]
- Hainschwang, T.; Fritsch, E.; Notari, F.; Rondeau, B. A new defect center in type Ib diamond inducing one phonon infrared absorption: The Y center. Diam. Relat. Mater. 2012, 12, 120–126. [Google Scholar] [CrossRef]
- Hainschwang, T.; Fritsch, E.; Notari, F.; Rondeau, B.; Katrusha, A. The origin of color in natural C center bearing diamonds. Diam. Relat. Mater. 2013, 39, 27–40. [Google Scholar] [CrossRef]
- Titkov, S.V.; Shiryaev, A.A.; Zudina, N.N.; Zudin, N.G.; Solodova, Y.P. Defects in cubic diamonds from the placers in the northeastern Siberian platform: Results of IR microspectrometry. Russ. Geol. Geophys. 2015, 56, 354–362. [Google Scholar] [CrossRef]
- Zedgenizov, D.A.; Kalinina, V.V.; Reutsky, V.N.; Yuryeva, O.P.; Rakhmanova, M.I. Regular cuboid diamonds from placers on the northeastern Siberian platform. Lithos 2016, 265, 125–137. [Google Scholar] [CrossRef]
- Smit, K.V.; Shirey, S.B.; Wang, W. Type Ib diamond formation and preservation in the West African lithospheric mantle: Re-Os age constraints from sulphide inclusions in Zimmi diamonds. Precambrian Res. 2016, 286, 152–166. [Google Scholar] [CrossRef]
- Smit, K.V.; D’Haenens-Johansson, U.F.S.; Howell, D.; Loudin, L.C.; Wang, W. Deformation-related spectroscopic features in natural Type Ib-IaA diamonds from Zimmi (West African craton). Mineral. Petrol. 2018, 112, 243–257. [Google Scholar] [CrossRef]
- Timmerman, S.; Chinn, I.L.; Fisher, D.; Davies, G.R. Formation of unusual yellow Orapa diamonds. Mineral. Petrol. 2018, 112, S209–S218. [Google Scholar] [CrossRef]
- Reutsky, V.N.; Shiryaev, A.A.; Titkov, S.V.; Wiedenbeck, M.; Zudina, N.N. Evidence for large scale fractionation of carbon isotopes and of nitrogen impurity during crystallization of gem quality cubic diamonds from placers of North Yakutia. Geochem. Int. 2017, 55, 988–999. [Google Scholar] [CrossRef]
- Harlow, G.E. The Nature of Diamonds; Cambridge University Press: Cambridge, UK, 1998; p. 278. [Google Scholar]
- Clark, C.D.; Davey, S.T. One-phonon infrared absorption in diamond. J. Phys. C 1984, 17, 1127–1140. [Google Scholar] [CrossRef]
- Palyanov, Y.; Kupriyanov, I.; Khokhryakov, A.; Ralchenko, V. Crystal Growth of Diamond. In Handbook of Crystal Growth; Nishinaga, T., Rudolph, P., Eds.; Elsevier: Amsterdam, The Netherlands, 2015; Volume II, pp. 671–913, Chapter 17. [Google Scholar]
- Boyd, S.R.; Kiflawi, I.; Woods, G.S. The relationship between infrared absorption and the A defect concentration in diamond. Phil. Mag. B 1994, 69, 1149–1153. [Google Scholar] [CrossRef]
- Kiflawi, I.; Mayer, A.E.; Spear, P.M.; van Wyk, J.A.; Woods, G.S. Infrared absorption by the single nitrogen and A defect centres in diamond. Phil. Mag. B 1994, 69, 1141–1147. [Google Scholar] [CrossRef]
- Lawson, S.C.; Fisher, D.; Hunt, D.C.; Newton, M.E. On the existence of positively charged single-substitutional nitrogen in diamond. J. Phys. Condens. Matter 1998, 10, 6171–6180. [Google Scholar] [CrossRef]
- Zudina, N.N.; Titkov, S.V.; Sergeev, A.M.; Zudin, N.G. Features of photoluminescence centers in cubic diamonds of various coloration from placers in the north-east of Siberian platform. Proc. Russ. Miner. Soc. 2013, 142, 57–72. [Google Scholar]
- Massi, L.; Fritsch, E.; Collins, A.T.; Hainschwang, T.; Notari, F. The “amber centres” and their relation to the brown colour in diamond. Diam. Relat. Mater. 2005, 14, 1623–1629. [Google Scholar] [CrossRef]
- Van Royen, J.; Palyanov, Y.N. High-pressure–high-temperature treatment of natural diamonds. J. Phys. Condens. Matter 2002, 14, 10953–10956. [Google Scholar] [CrossRef]
- Goss, J.P.; Briddon, P.R.; Hill, V.; Jones, R.; Rayson, M.J. Identification of the structure of the 3107 cm−1 H-related defect in diamond. J. Phys. Condens. Matter 2014, 26, 145801. [Google Scholar] [CrossRef]
- Zedgenizov, D.A.; Kalinin, A.A.; Kalinina, V.V.; Palyanov, Y.N.; Shatsky, V.S. The transformation features of impurity defects in natural diamonds of various habits under high P–T conditions. Dokl. Earth Sci. 2016, 466, 32–37. [Google Scholar] [CrossRef]
- Lai, M.Y.; Breeding, C.M.; Stachel, T.; Stern, R.A. Spectroscopic features of natural and HPHT-treated yellow diamonds. Diam. Relat. Mater. 2020, 101, 107642. [Google Scholar] [CrossRef]
- Collins, A.T.; Mohammed, K. Optical studies of vibronic bands in yellow luminescing natural diamonds. J. Phys. C Solid State Phys. 1982, 15, 147–158. [Google Scholar] [CrossRef]
- Nazaré, M.H.; Thomaz, M.F.; Jorge, M.I.B. Luminescence bands in natural brown diamonds. Solid State Comm. 1985, 55, 577–581. [Google Scholar]
- Pereira, M.E.; Jorge, M.I.B.; Thomaz, M.F. The red luminescence spectrum of brown diamonds: Vibronic coupling. J. Phys. C Solid State Phys. 1986, 19, 1009–1015. [Google Scholar] [CrossRef]
- Hainschwang, T.; Notari, F.; Fritsch, E.; Massi, L.; Rondeau, B.; Breeding, C.M.; Vollstaedt, H. HPHT treatment of CO2 containing and CO2-related brown diamonds. Diam. Relat. Mater. 2008, 17, 340–351. [Google Scholar] [CrossRef]
- Titkov, S.V.; Mineeva, R.M.; Zudina, N.N.; Sergeev, A.M.; Ryabchikov, I.D.; Shiryaev, A.A.; Speransky, A.V.; Zhikhareva, V.P. The luminescent nature of orange coloration in natural diamonds: Optical and EPR study. Phys. Chem. Miner. 2014, 42, 131–141. [Google Scholar] [CrossRef]
- Collins, A.T.; Kanda, H.; Kitawaki, H. Colour changes produced in natural brown diamonds by high-pressure, high temperature treatment. Diam. Relat. Mater. 2000, 9, 113–122. [Google Scholar] [CrossRef]
- Eaton-Magana, S.; Ardon, T.; Zaitsev, A.M. LPHT annealing of brown-to-yellow type Ia diamonds. Diam. Relat. Mater. 2017, 77, 159–170. [Google Scholar] [CrossRef]
- Gali, A.; Lowther, J.E.; Deak, P. Defect states of substitutional oxygen in diamond. J. Phys. Condens. Matter 2001, 13, 11607–11613. [Google Scholar] [CrossRef]
Figure 1.
Microphotographs of representative diamond crystals selected for annealing experiments: (A) a resorbed cuboid (sample Y1) and (B) a resorbed secondary dodecahedroid (sample Y3).
Figure 1.
Microphotographs of representative diamond crystals selected for annealing experiments: (A) a resorbed cuboid (sample Y1) and (B) a resorbed secondary dodecahedroid (sample Y3).

Figure 2.
Representative infrared spectra recorded from different zones of samples (A) Y1 and (B) Y3. The spectra were collected in traverses from the core (a) to the rim (c,d). For better readability, the spectra were successively offset by 1.5 cm−1 along the ordinate axis in both panels.
Figure 2.
Representative infrared spectra recorded from different zones of samples (A) Y1 and (B) Y3. The spectra were collected in traverses from the core (a) to the rim (c,d). For better readability, the spectra were successively offset by 1.5 cm−1 along the ordinate axis in both panels.

Figure 3.
The one-phonon spectra recorded from samples Y1 (A) and Y3 (B): (a) as-collected spectra; (b) the same spectra after the fitting and subtraction of the C and A forms of nitrogen. The N+ form was not subtracted from the spectra due to poor convergence at 1332 cm−1. For better readability, the spectra were 2 and 1.5 cm−1 offset in panels A and B, respectively.

Figure 4.
Photoluminescence spectra measured at 78 K with (A) 532- and (B) 473-nm excitation from two locations (a,b) in the central part of sample Y1. The spectra were displaced vertically for clarity.
Figure 4.
Photoluminescence spectra measured at 78 K with (A) 532- and (B) 473-nm excitation from two locations (a,b) in the central part of sample Y1. The spectra were displaced vertically for clarity.

Figure 5.
Photoluminescence spectra measured at 78 K with (A) 532- and (B) 473-nm excitation from two locations (a,b) in the peripheral part of sample Y1. The spectra were displaced vertically for clarity.
Figure 5.
Photoluminescence spectra measured at 78 K with (A) 532- and (B) 473-nm excitation from two locations (a,b) in the peripheral part of sample Y1. The spectra were displaced vertically for clarity.

Figure 6.
Infrared spectra measured from the same locations of samples (A) Y1 and (B) Y3 after annealing at different temperatures. Sample Y1 was annealed at (a) 1700, (b) 1900, and (c) 2100 °C for 2 h. Sample Y3 was annealed at (a) 1700, (b) 1900, and (c) 2200 °C for 1 h. For better readability, the spectra were successively offset by 3 and 2 cm-1 along the ordinate axis in panels A and B, respectively.

Figure 7.
Infrared spectra recorded from different zones of sample Y1 (a,b,c) before and after (a’,b’,c’) annealing at 2100 °C. The spectra were arbitrarily offset, but the absorption scale was identical for all spectra.
Figure 7.
Infrared spectra recorded from different zones of sample Y1 (a,b,c) before and after (a’,b’,c’) annealing at 2100 °C. The spectra were arbitrarily offset, but the absorption scale was identical for all spectra.

Figure 8.
Photoluminescence spectra recorded at 78 K with (A) 532- and (B) 473-nm excitation from the same location in the central part of sample Y1: (a) before annealing and after annealing at (b) 1700, (c) 1900, and (d) 2100 °C. The spectra were displaced vertically for clarity.
Figure 8.
Photoluminescence spectra recorded at 78 K with (A) 532- and (B) 473-nm excitation from the same location in the central part of sample Y1: (a) before annealing and after annealing at (b) 1700, (c) 1900, and (d) 2100 °C. The spectra were displaced vertically for clarity.

Figure 9.
Photoluminescence spectra recorded at 78 K with (A) 532- and (B) 473-nm excitation from the same location in the peripheral part of sample Y1: (a) before annealing and after annealing at (b) 1700, (c) 1900, and (d) 2100 °C. The spectra were displaced vertically for clarity.
Figure 9.
Photoluminescence spectra recorded at 78 K with (A) 532- and (B) 473-nm excitation from the same location in the peripheral part of sample Y1: (a) before annealing and after annealing at (b) 1700, (c) 1900, and (d) 2100 °C. The spectra were displaced vertically for clarity.

Figure 10.
Photoluminescence spectra recorded at 78 K with 473-nm excitation from (A) red-luminescing natural diamonds from Udachnaya kimberlite pipe and (B) Y-center-rich zones of samples Y1, Y2, and Y3 after annealing at 2100–2200 °C. The spectra are displaced vertically for clarity.
Figure 10.
Photoluminescence spectra recorded at 78 K with 473-nm excitation from (A) red-luminescing natural diamonds from Udachnaya kimberlite pipe and (B) Y-center-rich zones of samples Y1, Y2, and Y3 after annealing at 2100–2200 °C. The spectra are displaced vertically for clarity.

Figure 11.
Infrared absorption spectra of (A) red-luminescing natural diamonds from Udachnaya kimberlite pipe and (B) Y-center-rich zones of samples Y1, Y2, and Y3 after annealing at 2100–2200 °C. For better readability, the spectra were successively offset by 2 cm−1 along the ordinate axis in both panels.

© 2020 by the authors. Licensee MDPI, Basel, Switzerland. This article is an open access article distributed under the terms and conditions of the Creative Commons Attribution (CC BY) license (http://creativecommons.org/licenses/by/4.0/).
Share and Cite
MDPI and ACS Style
Kupriyanov, I.N.; Palyanov, Y.N.; Kalinin, A.A.; Shatsky, V.S. Effect of HPHT Treatment on Spectroscopic Features of Natural Type Ib-IaA Diamonds Containing Y Centers. Crystals 2020, 10, 378. https://doi.org/10.3390/cryst10050378
AMA Style
Kupriyanov IN, Palyanov YN, Kalinin AA, Shatsky VS. Effect of HPHT Treatment on Spectroscopic Features of Natural Type Ib-IaA Diamonds Containing Y Centers. Crystals. 2020; 10(5):378. https://doi.org/10.3390/cryst10050378
Chicago/Turabian StyleKupriyanov, Igor N., Yuri N. Palyanov, Alexander A. Kalinin, and Vladislav S. Shatsky. 2020. "Effect of HPHT Treatment on Spectroscopic Features of Natural Type Ib-IaA Diamonds Containing Y Centers" Crystals 10, no. 5: 378. https://doi.org/10.3390/cryst10050378
Note that from the first issue of 2016, this journal uses article numbers instead of page numbers. See further details here.