


The hypothalamic–pituitary–adrenal (HPA) axis regulates glucocorticoid homeostasis. The hypothalamus secretes corticotrophin releasing hormone, which stimulates the pituitary to release adrenocorticotrophin (ACTH; Liyanarachchi et al., Reference Liyanarachchi, Ross and Debono2017). ACTH, in turn, stimulates the adrenal cortex to secrete cortisol. Cortisol is metabolized by various enzymes, including A-ring reductases, 11β-hydroxysteroid dehydrogenase type 2 (11β-HSD type 2) and cytochrome P450 (CYP) 3A4 (Figure 1). Long-lasting alterations in HPA axis activity have been associated with disease susceptibility, including increased risks of cardiovascular, auto-immune and psychiatric conditions, suggesting that the settings of this axis are critical for wellbeing (Dekker et al., Reference Dekker, Koper, van Aken, Pols, Hofman, de Jong and Tiemeier2008; Liyanarachchi et al., Reference Liyanarachchi, Ross and Debono2017; Silverman & Sternberg, Reference Silverman and Sternberg2012; Tzioufas et al., Reference Tzioufas, Tsonis and Moutsopoulos2008; Zorn et al., Reference Zorn, Schur, Boks, Kahn, Joels and Vinkers2017).

Fig. 1. Schematic overview of cortisol metabolism. THF, tetrahydrocortisol; THE, tetrahydrocortisone; aTHF, allotetrahydrocortisol; 6β-OH-cortisol, 6β-hydroxy-cortisol; HSD, hydroxysteroid dehydrogenase; CYP, cytochrome P.
Life-course experiences may permanently alter the settings of the HPA axis, suggesting that HPA axis activity is, at least partially, stable over time (Barker, Reference Barker1993; Hanson & Gluckman, Reference Hanson and Gluckman2014; Weaver et al., Reference Weaver, Cervoni, Champagne, D’Alessio, Sharma, Seckl and Meaney2004). We recently demonstrated in a twin study with 8 years of follow-up that the contribution of unshared environmental factors on cortisol production was already high at the age of 9 years and continued to increase with age, suggesting that cortisol production is mainly determined by individual experiences (van Keulen et al., Reference van Keulen, Dolan, Andrew, Walker, Hulshoff Pol, Boomsma and Finken2020). However, it is unclear if the responsible environmental factors are consistent or change with time. In the same study, we showed that cortisol metabolism was mainly determined by genetic factors. Heritability of the activities of A-ring reductases was found to increase with age, while for the activities of 11β-HSD isoenzymes and CYP 3A4 heritability peaked at 12 years (van Keulen et al., Reference van Keulen, Dolan, Andrew, Walker, Hulshoff Pol, Boomsma and Finken2020).
Despite this evidence, there is limited data on the long-term stability of cortisol. To the best of our knowledge, only few studies in children have reported on the long-term stability of cortisol. A study among 410 adolescents, in whom the cortisol awakening response (CAR) was assessed annually over a 3-year period, reported a low stability of .15 at awakening and .24 at 30 and 60 min post-awakening (Platje et al., Reference Platje, Vermeiren, Branje, Doreleijers, Meeus, Koot and Jansen2013). In a sample of 357 children, diurnal cortisol slopes were assessed at the ages of 9, 11, 13 and 15 years. After accounting for situation-specific sources in HPA axis activity and short-term cortisol stability, 13.2% of the variance in cortisol levels was stable across the 6 years of follow-up, while the remainder was explained by day-to-day or within-day fluctuations (Shirtcliff et al., Reference Shirtcliff, Allison, Armstrong, Slattery, Kalin and Essex2012). Moreover, evidence from three studies showed that approximately 50% of the variance in salivary cortisol was dependent on day-to-day fluctuations. Of all parameters that were assessed, the total daily cortisol output was most stable, followed by the diurnal cortisol slope and the CAR (Ross et al., Reference Ross, Murphy, Adam, Chen and Miller2014).
These studies provide evidence regarding the limited long-term stability in circulating cortisol, but several questions remain unanswered. First, these studies only measured cortisol in saliva. Therefore, the question arises as to which extent the production and metabolism of cortisol account for this low stability. In addition, it remains unclear whether this low stability is indeed explained by environmental factors, such as early-life experiences, or by genetic factors. Therefore, the purpose of this study was to test the stability of cortisol production and metabolism over time between ages 9 and 17 years, in a cohort of twins, as well as the contributions of genetic and environmental factors to this stability.
Methods
Participants
Nine-year-old twins were recruited from the Netherlands Twin Register, a nationwide twin register (Boomsma et al., Reference Boomsma, de Geus, Vink, Stubbe, Distel, Hottenga and Willemsen2006). Parents were approached for their offspring to take part in the BrainScale study, which is a prospective follow-up study on the development of cognition, hormones, and brain structure and function, as described previously (Teeuw et al., Reference Teeuw, Brouwer, Koenis, Swagerman, Boomsma and Hulshoff Pol2018; van Soelen et al., Reference van Soelen, Brouwer, Peper, van Leeuwen, Koenis, van Beijsterveldt and Boomsma2012). The parents of twins born between 1995 and 1996 received a letter 4–8 weeks before the 9th birthday of their children. Two weeks later, the parents were approached by phone with further explanation about the study, and to ask if they consented to their children taking part. Written informed consent was obtained from parents at the ages of 9 and 12 years. At the third measurement occasion (around age 17), twins signed for themselves. The BrainScale study was approved by the Central Committee on Research Involving Human Subjects of The Netherlands (CCMO), and studies were performed in accordance with the Declaration of Helsinki. In total, 214 families were approached, of which 109 consented to take part (51%). In the follow-up study, 78% and 73% of the participants provided samples at the ages of 12 and 17 years, respectively.
Zygosity was established by genome-wide DNA markers (Ligthart et al., Reference Ligthart, van Beijsterveldt, Kevenaar, de Zeeuw, van Bergen, Bruins and Boomsma2019). DNA samples were tested for genome-wide single nucleotide polymorphic markers (Scheet et al., Reference Scheet, Ehli, Xiao, van Beijsterveldt, Abdellaoui, Althoff and Boomsma2012). Based on their zygosity and sex, twins were categorized in the following groups: monozygotic males (MZMs), dizygotic males (DZMs), monozygotic females (MZFs), dizygotic females (DZFs) or dizygotic opposite-sex pairs. Information on demographics was collected at the time of registration by questionnaire (Gielen et al., Reference Gielen, van Beijsterveldt, Derom, Vlietinck, Nijhuis, Zeegers and Boomsma2010).
Study Protocol
At the ages of 9, 12 and 17 years, participants were requested to collect morning urine immediately after awakening in the provided tubes and to store them in their refrigerator prior to the study visit. Samples were subsequently stored at −20 and −80°C and thawed once just before analysis.
Laboratory Analysis
Analyses were carried out at the Edinburgh Clinical Research Facility Mass Spectrometry Core Laboratory. Gas chromatography-tandem mass spectrometry was conducted in order to determine glucocorticoid metabolites (Homer et al., Reference Homer, Kothiya, Rutter, Walker and Andrew2017). Samples were analyzed in 15 batches. Creatinine concentrations were measured by the Jaffé method (Apple et al., Reference Apple, Bandt, Prosch, Erlandson, Holmstrom, Scholen and Googins1986). Enzymatic activities were inferred through ratios of cortisol metabolites, as depicted in Table 1.
Table 1. Ratios indicating enzyme activity

Twin Modeling
Monozygotic (MZ) twins share 100% of their alleles identical by descent (IBD), while dizygotic (DZ) twins share on average 50% of their alleles IBD (Boomsma et al., Reference Boomsma, Busjahn and Peltonen2002). This difference in genetic relatedness enables us to estimate the contributions of genetic and environmental factors to a trait by comparing within-pair correlations between MZ and DZ twins. A MZ correlation higher than the DZ correlation indicates an influence of genetic factors, which may be additive (A) or non-additive (genetic dominance; D). The proportion of phenotypic variance that can be attributed to genetic factors is termed ‘heritability’. In addition, resemblance between twins can be explained by common environmental influences (C), defined as the environmental factors that make family members similar to each other. The presence of common environmental factors is suggested when the correlation in DZ twins is larger than half of the correlation in MZ twins. Unique environmental factors (E) are not shared between family members, and so contribute to the phenotypic variance but not to the phenotypic covariance between twins. Generally, E includes measurement error.
Statistical Analyses
Outliers, defined as any value ≥3 SD above the phenotypic mean (on average six per index) and twin pairs with highly discordant outcomes (on average one per index) were, given their impact on the MZ and DZ correlations, excluded from statistical analyses. In order to correct for batch effects, a random effect model was fitted to the twin data, which included batch as a random effect (Odintsova et al., Reference Odintsova, Willemsen, Dolan, Hottenga, Martin, Slagboom and Boomsma2018).
Structural equation modeling, implemented in the OpenMx Package in R 3.4.2., was used in all analyses to estimate the phenotypic correlations (R ph) between observed traits and the relative contributions of genetic and environmental effects to this correlation (Boker et al., Reference Boker, Neale, Maes, Wilde, Spiegel, Brick and Fox2011). For each phenotypic measure, we fitted a trivariate model to the data in which variables assessed at the age of 9, 12 and 17 years were analyzed simultaneously. Based on our previous work (van Keulen et al., Reference van Keulen, Dolan, Andrew, Walker, Hulshoff Pol, Boomsma and Finken2020), we fitted a model that allowed for additive genetic, common environmental and unique environmental effects (i.e., the ACE model). The twin correlations in 5β-reductase activity [tetrahydrocortisol (THF)/cortisol] and the balance of 11β-HSD activities [(THF +allo-THF)/THE] were hard to interpret at the ages of 12 and 17 (5β-reductase activity: MZ correlations: .00 and .65; DZ correlations 5β-reductase activity: .25 and .06 at the ages of 12 and 17 years, respectively, balance of 11β-HSD activities: MZ correlation: .25; DZ correlation: .04 at the age of 12 years). We attributed this to sampling fluctuation, in view of the modest sample size, and discarded these phenotypes. The trivariate model provides information concerning the contributions of genetic and environmental factors to the variance of each phenotype, and to the phenotypic covariance (or correlation) among the phenotypes. As mentioned above, the proportion of the phenotypic variance that can be attributed to genetic factors is an estimate of standardized genetic variance, which is also known as the heritability (h2). Standardized common environmental factors (c2) and unique environmental (e2) variance similarly represent proportions of phenotypic variance (i.e., h2 + c2 + e2 = 1). Genetic effects can contribute to the phenotypic covariance between the phenotype at different ages, if same genes contribute to the variance at different ages. This also applies to environmental factors. Just as the standardized variance is expressed in terms of standardized variance components (h2, c2 and e2), the correlation of the phenotype at different ages can be expressed in terms of standardized components. To explain this, we consider the phenotype of interest measured at the ages of 9 and 12 (the same applies to ages 9 and 17, and ages 12 and 17). On the one hand, we have the variance components h92, c92 and e92 at the age of 9 and h122, c122 and e122 at the age of 12. The decomposition of the phenotypic correlation r Ph9,12 depends both on the standardized variance components and on the correlation between the A factors at the ages of 9 and 12 (r A9,12) and the correlation between the C and the E factors at the ages of 9 and 12 (r C9,12 and r E9,12, respectively; see Figure 2). The phenotypic correlation is modeled as r Ph9,12 = h9 * r A9,12 * h12 + c9 * r C9,12 * c12 + e9 * r E9,12 * e12 (see Figure 2).
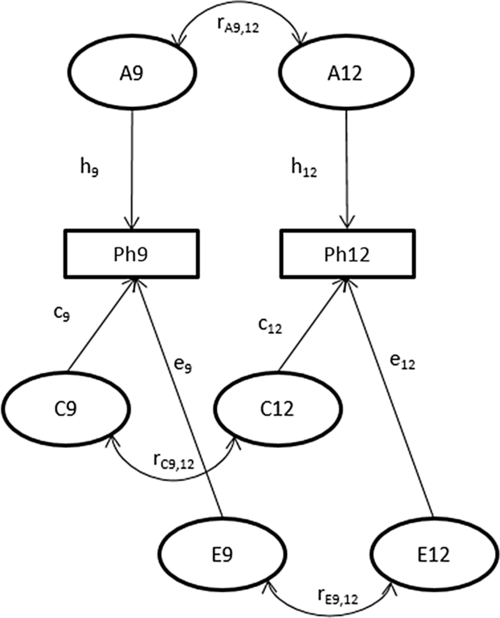
Fig. 2. Path diagram representing the bivariate ACE model.
Note that the additive genetic correlation r A9,12 can only be estimated if both h92 and h122 are greater than zero. Clearly if, say, h122 is zero, then there are no genetic effects at the age of 12, and consequently no genetic overlap between ages 9 and 12. So if h122 (or h92) is zero, the genetic correlation r A9,12 is necessarily fixed to zero in the analysis. In practice, if either h9 or h12 is relatively small, it is difficult to obtain a stable estimate of r A9,12 (the same applies to the environmental contributions to the phenotypic correlation). In practice this means that the correlation r A9,12 (r C9,12, r E9,12) is estimated only if h9 (c9, e9) and (c12, e12) are appreciably greater than zero. Therefore, we decided to fix the influence of these factors to zero if they were 10% or smaller.
Results
A total of 218 twins were enrolled in this study, including 94 MZ and 124 DZ twins. The MZ pairs included 23 male (MZM) and 24 female (MZF) twin pairs. The DZ twins included 22 male (DZM), 21 female (DZF) and 19 DZ opposite-sex (DOS) twin pairs. There was an equal sex distribution. Participants were tested at a mean (SD) age of 9.1 (±0.1), 12.2 (±0.3) and 17.2 (±0.2) years. Mean (±SD) gestational age was 36.8 weeks (±1.72), and mean (±SD) birthweight was 2602 g (±475). Mean SD scores (±SD) for body mass index [weight (kg)/height (m)2] were 0.14 (± 0.93), 0.45 (± 1.00) and 0.27 (±1.08) at the ages of 9, 12 and 17 years, respectively. Mean SD scores for weight (kg) were 0.31 (±0.93), 0.23 (±0.99) and 0.26 (±1.06), and for height (cm) were 0.04 (±0.82), −0.56 (±0.98) and −0.16 (0.88) at the ages of 9, 12 and 17 years, respectively (TNO, 2010).
Stability of Cortisol Production and Metabolism Over Time
Table 2 presents the stability over time for cortisol metabolite excretion rate and cortisol metabolism activities. Correlations were relatively low (Rph = −.02 to .46). Cortisol metabolite excretion rates at the ages of 9 and 12 years were correlated with one another (Rph = .19). Between ages 9 and 17 years, and 12 and 17 years, no significant correlations were found for cortisol metabolite excretion rate. For cortisol metabolism, significant correlations were found between ages 9 and 12 years for the activities of 5α-reductase, 5β-reductase, 11β-HSD type 2 and CYP3A4 activities (Rph = .25, .26, .27 and .46, respectively), and between ages 9 and 17 years for 5α-reductase activity only (Rph = .28).
Table 2. Associations between cortisol metabolite excretion rate and metabolism activity at different ages
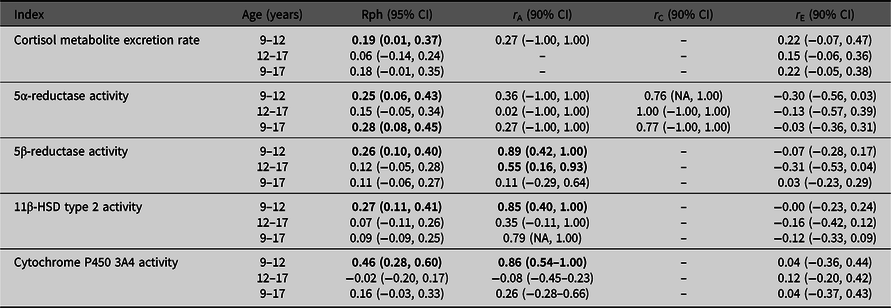
Note: CI, confidence interval; HSD, hydroxysteroid dehydrogenase. Phenotypic correlations (Rph, calculated as, e.g., h9 * r A9,12 * h12 + c9 * r C9,12 * c12 + e9 * r E9,12 * e12) between ages 9–12 years, 12–17 years and 9–17 years are depicted with their 95% confidence intervals. Bolded phenotypic correlations are significant at p value < .05. Genetic (r A), common environmental (r C) and unique environmental correlations (r E) acting on both ages are given with their 90% confidence intervals. Bold typed genetic correlations are significant at p value < .10.
Contribution of Genetic Versus Environmental Factors
Table 2 also presents genetic and environmental correlations to the stability of our outcomes. Estimates of these correlations were often imprecise, as indicated by the wide 90% confidence intervals, which is likely due to the low phenotypic stability over time.
Trivariate genetic analyses (Table 2, Figure 3) showed that cortisol metabolism correlations were predominantly driven by genetic factors, especially between ages 9 and 12 years. Additionally, the influence of environmental factors on the stability of cortisol metabolism was not statistically significant.
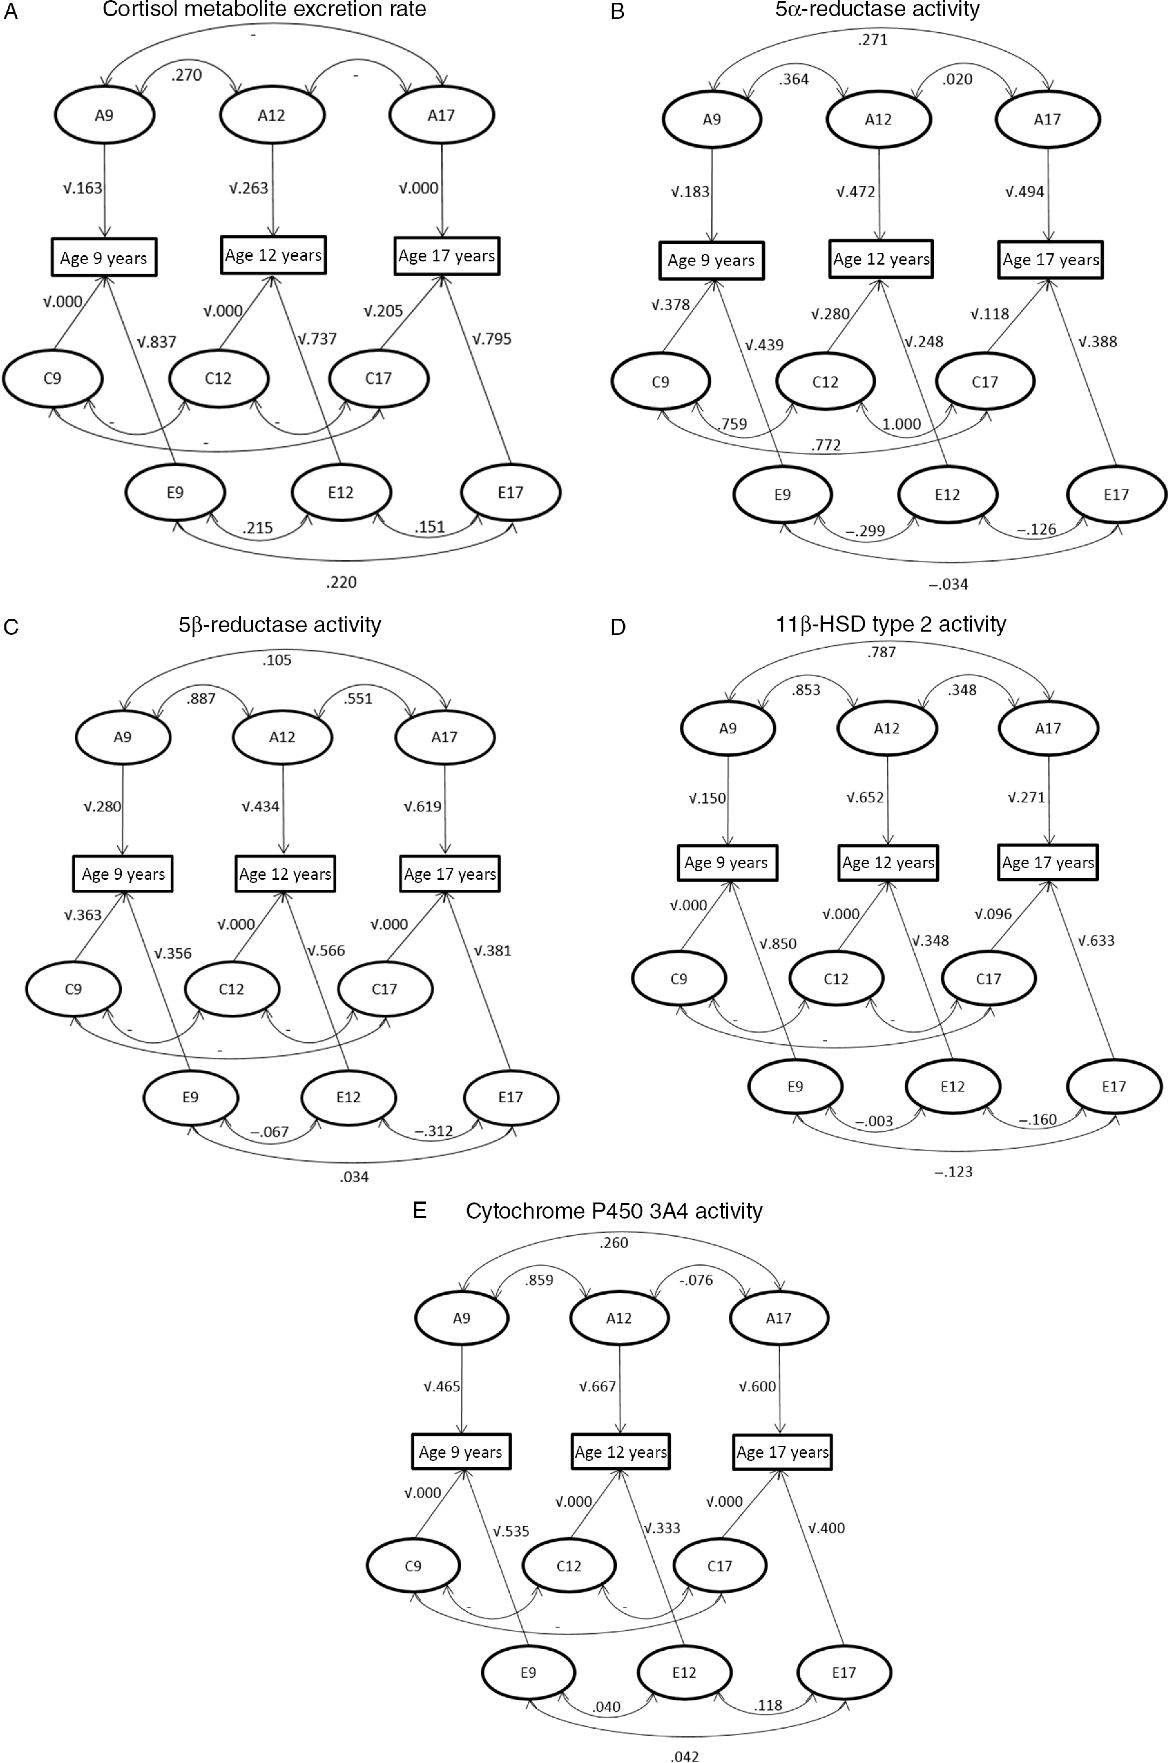
Fig. 3. Path diagram representing the correlations between genetic (A), shared environmental (C) and unique environmental (E) influences between ages 9–12 years, 12–17 years and 9–17 years and the influences of genetic and environmental factors on the phenotypic variance at the ages of 9, 12 and 17 years. (A) Cortisol metabolite excretion rate, (B) 5α-reductase activity, (C) 5β-reductase activity, (D) 11β-HSD type 2 activity and (E) cytochrome P450 3A4 activity.
Discussion
We described the stability of cortisol production and metabolism over time in healthy twins assessed at the ages of 9, 12 and 17 years, as well as the contribution of genes and the environment to this stability. The most important finding from our study is that the stability of both cortisol production and metabolism over time is low, so that in view of the limited number of participants, genetic versus environmental contributions to this stability are difficult to assess.
It has previously been demonstrated that only a small proportion of the variance in salivary cortisol level shows a stable pattern (Platje et al., Reference Platje, Vermeiren, Branje, Doreleijers, Meeus, Koot and Jansen2013; Ross et al., Reference Ross, Murphy, Adam, Chen and Miller2014; Shirtcliff et al., Reference Shirtcliff, Allison, Armstrong, Slattery, Kalin and Essex2012), and that approximately 50% of this variance could be explained by day-to-day fluctuations (Ross et al., Reference Ross, Murphy, Adam, Chen and Miller2014). In children aged 9–15 years, only 13% of the variance in salivary cortisol level showed stability over the years (Shirtcliff et al., Reference Shirtcliff, Allison, Armstrong, Slattery, Kalin and Essex2012). However, these studies had only measured cortisol in saliva and hence could not distinguish between cortisol production and elimination.
In contrast, a recent study among adolescents demonstrated a higher long-term stability of cortisol production, as assessed by hair cortisol concentration (HCC), namely a two-year’s stability of 0.32 [95% CI (0.16, 0.45); Rietschel et al., Reference Rietschel, Streit, Zhu, McAloney, Frank, Couvy-Duchesne and Rietschel2017]. Measurement of HCC is a relatively new method that enables the assessment of cortisol production over a prolonged period (with 1 cm of hair segment representing cortisol production over a period of 1 month). HCC is therefore less sensitive to daily fluctuations in the secretion of cortisol, such as the diurnal rhythm, nutrition and physical activity, as compared to measurement of cortisol in blood, saliva or urine (Stalder et al., Reference Stalder, Steudte, Miller, Skoluda, Dettenborn and Kirschbaum2012). As we measured cortisol metabolites in morning urine, our study might have underestimated the long-term stability of cortisol production. However, HCC only represents cortisol production, and a major disadvantage of this technique compared to ours is that it could not distinguish between cortisol production and metabolism.
We have previously demonstrated that both genetic and environmental factors contributed to cortisol production and metabolism throughout adolescence (van Keulen et al., Reference van Keulen, Dolan, Andrew, Walker, Hulshoff Pol, Boomsma and Finken2020). Our current findings suggest that the processes underlying these contributions are highly dynamic over time. Indeed, it is possible that during adolescence not only environmental stressors but also genomic influences — for example, those relevant to growth and puberty — vary over time.
Our study has several strengths and limitations. Participants were recruited from a population-based register, and the numbers lost to follow-up were acceptably low. As participants were measured at fixed ages, our observations could not be explained by variability in the timing of the assessments. However, a number of limitations should be considered. The limited stability of cortisol parameters over time could, in addition to the relatively small sample size, lead to unstable heritability and environmental estimates, resulting in wide confidence intervals. Cortisol metabolites were measured in urine samples obtained immediately after awakening. Preferably, cortisol metabolites are measured in 24-hour’s urine samples, as cortisol is secreted rhythmically (Young et al., Reference Young, Abelson and Lightman2004). The timing of urine collection could therefore have influenced our stability estimates.
Conclusion
Our current findings showed that the stability in both cortisol production and metabolism, as assessed in early-morning urine, between ages 9 and 17 years is low, reflecting the dynamic nature of the HPA axis.
Acknowledgments
We thank our participants for making this study possible. We thank the staff of the Edinburgh Mass Spectrometry Core for specialist support. BRW is a Wellcome Trust Investigator. RA and BRW were supported by a British Heart Foundation Programme Grant and by a Wellcome Trust equipment grant. This work was supported by the Netherlands Organization for Scientific Research (NWO, 51.02.060, 668.772; NWO-MagW 480-04-004; NWO/SPI 56-464-14192). DIB acknowledges KNAW Academy Professor Award (PAH/6635).
Conflict of interest
None.


 Open access