
Abstract
To achieve regeneration of long sections of damaged nerves, restoration methods such as direct suturing or autologous grafting can be inefficient. Solutions involving biohybrid implants, where neural stem cells are grown in vitro on an active support before implantation, have attracted attention. Using such an approach, combined with recent advancements in microfabrication technology, the chemical and physical environment of cells can be tailored in order to control their behaviors. Herein, a neural stem cell polycarbonate fiber scaffold, fabricated by 3D printing and thermal drawing, is presented. The combined effect of surface microstructure and chemical functionalization using poly-L-ornithine (PLO) and double-walled carbon nanotubes (DWCNTs) on the biocompatibility of the scaffold, induced differentiation of the neural stem cells (NSCs) and channeling of the neural cells was investigated. Upon treatment of the fiber scaffold with a suspension of DWCNTs in PLO (0.039 g l−1) and without recombinants a high degree of differentiation of NSCs into neuronal cells was confirmed by using nestin, galactocerebroside and doublecortin immunoassays. These findings illuminate the potential use of this biohybrid approach for the realization of future nerve regenerative implants.
Export citation and abstract BibTeX RIS

Original content from this work may be used under the terms of the Creative Commons Attribution 4.0 license. Any further distribution of this work must maintain attribution to the author(s) and the title of the work, journal citation and DOI.
1. Introduction
Peripheral nerve trauma can lead to loss of innervation, loss of motor and sensory functions and lifelong disability [1]. The peripheral neural system (PNS) has a limited intrinsic ability to regenerate and regrow axons [2], with spontaneous recovery possible for small-gap injuries (<2 cm) [3]. If the nerve gap is small (<0.5 cm), and there is no tension [4], end-to-end suturing of nerve stumps is possible, adequately restoring function in 50% of patients [3]. However, if the gap is large, bridging is needed between the two nerve stumps. Nerve autografting is considered the gold standard for PNS nerve repair for gaps >2 cm [5], but, only 50% of patients regain useful function [6, 7]. Furthermore, there are limited suitable nerve harvesting sites and the length of graft tissue that can be sourced is also limited (<5 cm) [5]. Allografts (from cadavers) and xenografts (from animals) are alternative solutions [6], but, despite decellularization and sterilization, there is still a risk of disease communication, and to avoid rejection, immune suppression is essential [7].
A potential solution for peripheral nerve regeneration could be fully artificial cell scaffolds [6, 8]. The success of artificial scaffolds strongly depends on the choice of fabrication materials [9]. Indeed, the materials need to be biocompatible and beneficial for cell development. Biomaterials such as keratin [10], collagens [11] or chitosan [12] have been proposed. Synthetic materials have also been investigated, such as polystyrene [13], polydimethylsiloxane (PDMS) [14, 15] and polycarbonate (PC) [15], among others [16]. Such artificial conduits enhance passively the local regeneration of the damaged nerve by functioning as a scaffold to guide the nerve growth, providing mechanical support, and guiding axonal growth between nerve stumps. However, simple cylindrical lumens have failed to surpass or even match the functional outcomes achieved with autologous nerve grafts [1]. Nerve regeneration over distances >3 cm is considered impractical solely with a hollow nerve conduit [17]. Via adapted fabrication methods, those scaffolds can combine physical (micro- and nanostructure of the substrate), chemical (neurotrophic factors) and biological cues (extracellular matrix proteins and glial cells) to guide development of the cells, as well as electrical stimulation [1, 8, 16, 18]. Such combinations have led to improved neural regeneration [1, 18, 19].
Stem cells on these scaffolds allows for regeneration of large sections of damaged nerves that cannot self-heal [14]. Such active biohybrid or 'living' scaffolds can drive regeneration instead of being acellular passive structures. Neural stem cells (NSCs) are self-renewing, multi-potent cells with low immunogenicity, that can be differentiated into neurons and glial phenotypes [13, 20]. While there has been much focus on the differentiation of stem cells into glial-like cells, there is also evidence that neural cell-line phenotypes transplanted in the PNS have the potential for repair of nerve defects [18]. NSCs have been employed for PNS regeneration in a number of studies with promising results [21–27]. Finally, transplanted stem cells release neurotrophic and immunoprotective factors supporting the repair process through paracrine activity [18, 27].
Another factor to be considered is surface modification of the scaffolds. For cell culture on solid surfaces, it has been shown that microstructure, such as micron-scaled grooves [13], can promote cell proliferation [28]. Moreover, it has been shown that micron-scale surface structures have an impact on cell signaling and directionality [13, 29, 30]. Such micro-architectures can provide structural support for axonal regrowth and induce specific cellular orientations [13]. Directional control of axonal outgrowth is essential for nerve regeneration, and micron-scale grooves and channels can address this need [31].
Additionally, it has been shown that surface chemistry optimization and the use of nanomaterials can further aid cell development, as nanotopography profoundly affects the behavior of stem cells [32]. The chemistry of the surface can be controlled by the application of polymers such as poly-L-lysine, poly-L-ornithine (PLO) (used in standard protocol culturing of nerve cells [33]), chitosan, poly( -caprolactone), poly(acrylic acid), or polypyrrole [16, 32, 34]. Carbon nanotubes (CNTs) have been exploited as a surface functionalization in cell culturing platforms, and are increasingly employed at interfaces between cells and substrates due to their biocompatibility, electrical conductivity and mechanical properties suitable for tissue interfacing [32, 35]. CNTs promote higher cell density[30], increase neurite length [36], and enhance spontaneous synaptic activity in neuronal cells [37]. Differentiated neurons and neurites have been shown to favor CNT-containing substrates, while they also promote stem cell differentiation to the neuronal lineage, and they promote neural network connectivity and enhance signal transmission [32]. CNTs have also been proven useful for cell culture when used as an electrode material or as part of composite materials [38, 39]. The above have been attributed also to the geometric resemblance of CNTs with the nanostructured features of neural tissue, leading to neural environment mimicking topographies [40]. Consequently, hybrid approaches combining micro- and nano-scale methodologies are attracting interest in order to combine the corresponding advantages [30, 41].
Future neural scaffolds would benefit from combining surface micropatterning, bespoke surface functionalization and the ability to simultaneously deliver stimuli and stem cells. The multi-material thermal fiber drawing method is a promising approach for the realization of nerve regeneration guidance conduits, enabling fine control of geometrical structures on the fiber in the micron-scale and solvent-free fabrication [15, 42]. This is achieved by preforms with centimeter-scale features, realized via conventional machining and assembly, composed of multiple materials of similar glass transition and melting temperatures [15, 43]. This approach allows for versatile high throughput fabrication of high aspect ratio devices on which multiple functions can be integrated [44], such as various types of electrodes [38], microfluidic devices, optical fiber-based sensors [45], and optogenetic stimulation, neural recording and drug delivery in vivo [42, 43]. Adipose-derived stem cells have been cultured on grooved drawn PC fibers, aligning cells along grooves with nuclei elongating into the grooves, while dorsal root ganglia axons have been grown and aligned along grooves in PDMS conduits molded with such drawn fibers and in polyetherimide fibers, with axonal growth both within micropatterned lumens, but also on the external fiber surface [3, 15]. It was reported that the drawn fibers themselves act as neurite growth guidance cues, both within fiber micropatterned lumens, but also on the fiber surface, while fiber microgrooves enhanced neurite growth [3]. However, the use of such fibers for neural regeneration is yet to be reported. In addition, the ability to make intricate preform designs with additive manufacturing [46], to allow for drawing of complex neural cell scaffold fibers for neural regeneration, has also yet to be explored.
Herein, a micro-structured PC fiber, drawn from a 3D printed preform (figure 1(a)), functionalized with PLO and double-walled carbon nanotubes (DWCNTs) (figure 1(b)), and then used as a neural cell scaffold (figure 1(c)), is presented. Microgrooves were incorporated into the fiber design as it has been shown that fiber microgrooves enhance neurite growth [3]. PLO was chosen as it is widely used for treatment of cell culture plasticwares to enhance NSC attachment and adhesion [47]. The effect of the fiber scaffold surface chemistry on cell vitality and differentiation was assessed. In particular, the effect of different concentrations of DWCNTs on cell vitality in terms of cytotoxicity on rat fetal NSCs and cell differentiation was investigated. It is observed that the surface modification of this fiber scaffold with PLO and DWCNTs promoted an augmented nestin phenotype expression. This study highlights the potential of drawn fibers from 3D printed preforms as neural cell scaffolds via the use of DWCNTs as a stimulus for NSC self-differentiation. Thermal drawing of fibers is a promising method for the realization of engineered artificial nerve conduits for neuro-regeneration. This work exploits and expands the fiber drawing technology toolbox and represents a new paradigm in neural regeneration.
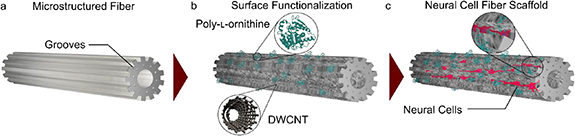
Figure 1. An overall schematic highlighting the overall concept of the neuronal implant. (a) A micro-structured drawn PC fiber artificial scaffold. (b) The surface of the fiber is modified using PLO and DWCNTs. (c) NSCs are cultured on the fiber scaffold.
Download figure:
Standard image High-resolution image2. Materials and methods
2.1. General experimental
All chemicals, reagents and solvents were obtained from Sigma-Aldrich, VWR or Fisher Scientific and were used as received, unless indicated. Biochemical reagents suitable for cell culture grade or greater were used. PC sheets (1 mm thick) used as planar substrates in this work were purchased from RS Components and were cut into pieces of appropriate size for characterization experiments. The DWCNTs were synthesized using a catalytic chemical vapor deposition (CVD) technique. A substituted magnesium oxide/chromium solid solution was used as a catalyst for the synthesis at 1000 °C in a H2:CH4 atmosphere. After dissolution of the remaining catalyst by hydrochloric acid treatment, the solution was dispersed in water with carboxymethyl cellulose as a surfactant using an ultrasonic probe. The resulting solution was a homogeneous suspension containing 7.8 g l−1 of approximately 80% DWCNTs as previously reported [30, 48]. The resulting high aspect ratio DWCNTs were several micrometers long with a median outer diameter of 2.05 nm [48].
The stock suspension of DWCNTs was 7.8 g l−1 DWCNTs: 7.8 g l−1 carboxymethyl cellulose (1:1) in de-ionized water. The subsequent 10×, 100× and 1000× dilutions of the PLO:DWCNT (1:1) suspensions contained 0.39 g l−1, 0.039 g l−1 and 0.0039 g l−1, respectively. This range of concentrations was chosen to enable a thorough investigation of the DWCNT concentration parameter space, and its subsequent effect on cell vitality and differentiation. Furthermore, the concentration range chosen for this work falls within the wider range of CNT concentrations that have been investigated in the literature [30, 36, 37, 40].
2.2. Characterization methods
Surface topography of the drawn fiber was examined using a Tescan LYRA3 XM scanning electron microscope (SEM). The DWCNT suspensions utilized for surface treatment of the fiber scaffold and planar substrates were characterized using a transmission electron microscope (TEM) JEOL STEM/TEM 2100Plus with a LaB6 source filament. Water contact angle measurements were performed in at least triplicate at ∼25 °C using a Keyence VHX2000 Digital Microscope and a bespoke 3D printed substrate holder. The water droplet volume was equal to 10 µl and the average contact angles on each different surface condition with associated errors were calculated using the Circle Best Fit model within the Contact Angle plugin in Image J software. The reported associated errors of the average water contact angle values are either the standard deviation (SD) or the propagated error, whichever was greatest in magnitude. A Bruker Innova atomic force microscope (AFM) was also employed to further confirm the presence of the DWCNTs on the planar substrates after surface treatment. Raman spectra of the DWCNT functionalized surfaces of the PC fibers were collected with a Thermo Fisher Scientific Inc. DXR™2xi Raman microscope using a 20× objective lens and the following settings: 532 nm laser, a laser power of 1.5 mW, 25 Hz exposure and 800 scans. A Raman spectral mapping experiment of a 40 × 40 µm area (chosen at random) on the surface of the 100× 1:1 PLO:DWCNT functionalized fiber was performed using a Thermo Fisher Scientific Inc. DXR™2xi Raman microscope using similar settings as given above, except for a laser power of 0.7 mW and the spot size was 0.5 × 0.5 µm.
2.3. Fiber fabrication
The scaffold fabrication process starts by defining the geometry of the preform using standard 3D design software (SolidWorks, Dassault Systèmes, France). The preform design is shown in figure 2(a) and is discussed in the section 3. This was then 3D printed by feeding PC (Ultimaker PC Transparent, 2.85 mm filament, Netherlands) filament into a commercial Fused Deposition Modelling (FDM) printer (Ultimaker 3 Extended, Netherlands). Table 1 shows the 3D printing settings.

Figure 2. Scaffold fabrication process. (a) The design of the fiber is realized on CAD software. (b) The fiber preform is 3D printed. (c) Preform is drawn thermally into a fiber of several meters using a custom-built draw tower. (d) Photograph of the 3D printed preform. (e) A SEM image of a section of the thermally drawn fiber showing the obtained microstructure.
Download figure:
Standard image High-resolution imageTable 1. 3D printing parameters used for the fabrication of the fiber preform.
| Setting | Value |
|---|---|
| Extruder printing temperature | 270 °C |
| Layer height | 0.1 mm |
| Print speed | 50 mm s−1 |
| Infill density | 100% |
| Infill pattern | Triangles (default) |
| Build plate temperature | 115 °C |
| Build plate adhesion type | Brim |
To prevent warping of the 3D printed PC preform, an adhesive layer (DIMAFIX, 3D GBIRE, Lancashire, United Kingdom) was sprayed onto the glass build plate, and the printer was fitted with an upper enclosure and a door (Accante cover Ultimaker 3 Extended, 3D GBIRE, Lancashire, United Kingdom) to maintain a constant chamber temperature. The dimensions of the 3D printed preform were 20 mm in diameter and 150 mm in length. The central lumen of the preform was 10 mm in diameter, while the smaller peripheral lumens were 1.5 mm in diameter. The grooves of the preform were 500 ± 200 µm in width, 800 ± 100 µm in depth and the terraces were 1350 ± 200 µm wide. Then for thermal drawing of the preform, the 3D printed preform was attached to the preform holder and was fed into the 3-zone furnace of the draw tower. The temperature of the 3-zone furnace used for thermally drawing the fiber was as follows: top zone: 120 C, middle zone: 220 C and bottom zone: 75 C.
2.4. Surface treatment
The following surface treatments were applied to the drawn PC fibers for cell culture experiments and to planar PC sheet substrates for the contact angle characterization experiments. Therefore, in the following descriptions, substrate can refer to either a section of drawn fiber or a planar PC sheet substrate.
2.4.1. Control surface protocol (bare surfaces)
Substrates were first rinsed copiously with propan-2-ol, before sterilization by sonication in methanol for 5 min and followed by sonication in sterile de-ionized water for 5 min. The substrates were then either used directly in experiments or were stored in Dulbecco's Modified Eagle Medium (DMEM) cell culture medium at 4 °C before subsequent use.
2.4.2. PLO coating protocol
Substrates were prepared as per the control surface protocol vide supra, and directly after sonication in sterile deionized water, the substrates were treated with a PLO (MW = 30 000–70 000 Da) in deionized water (20 μg ml−1) working solution. PLO was chosen as it is widely used for treatment of cell culture plasticwares to enhance NSC attachment and adhesion [47]. This concentration was chosen as it is within the range of concentrations used in the literature for coating cell culture plasticwares [47].
2.4.3. PLO:DWCNT suspension (1:1) coating protocol
PLO (MW = 30 000–70 000 Da) was dissolved in deionized water (20 μg ml−1) and was then added to the desired dilution of the DWCNT suspension, either 10×, 100× or 1000×, to form a 1:1 PLO:DWCNT suspension with a concentration of PLO of 10 μg ml−1 and a DWCNT concentration of either 0.39 g l−1, 0.039 g l−1 or 0.0039 g l−1, respectively. The substrate was then treated with this suspension. It has been demonstrated in the literature that CNTs interact with polycations through non-covalent adsorption interactions [49].
2.5. Cell culture
2.5.1. Cell culture and seeding
The NSCs were isolated from the cortexes of 14 d embryo of a rat. Cells were then expanded in N-2/DMEM/F-12 medium and supplemented with 10 ng ml−1 FGF Basic Recombinant Human (bFGF) and cryopreserved at passage 0 in N-2/DMEM/F-12 and 10% dimethyl sulfoxide (DMSO). Rat fetal NSC cell lines used in this study were obtained from Gibco™ (Catalog No. N7744-100). In order to have an optimal growth and expansion, the cell culture medium was supplemented with: KnockOut™ DMEM/F-12 (12660-012) 1 × 97 ml, 1 ml GlutaMAX™-I (35050-061) supplement (2 mM), 2 μg bFGF (PHG0024) (20 ng ml−1), 2 μg EGF Recombinant Human (PHG0314) (20 ng ml−1) and 2 ml StemPro® NSC SFM Supplement (2% v/v). The growth rate of the NSCs was maintained in the mid-logarithmic phase with a 75%–90% confluency prior to subculturing (figure S1 (available online at stacks.iop.org/BMM/15/055011/mmedia)). Cells were passaged at a seeding density of 50 000 cells cm−2. Treated cell culture vessels were coated with CELLStart™ (Catalog No. 10142-01) prior to seeding the cells. To prevent the NSCs from differentiation, they were supplemented with 10 ng ml−1 of bFGF (PHG0024) added into the cell culture medium every day. Upon withdrawal of the bFGF the cells start to differentiate into neurons, astrocytes, and oligodendrocytes.
2.5.2. Cell imaging and morphology
The NSCs seeded on the fiber scaffold were observed using a Tescan LYRA3 XM SEM. Fluorescence images were acquired using a CF3-Leica SP5 MP/FLIM upright confocal microscope or a custom-made confocal microscope consisting of a Thorlabs Confocal Laser Scanner coupled to objectives and a Thorlabs MPH16 CCD device. The source was a Thorlabs Multi Channel Fiber Coupled Laser Source. After the required cultivation time period, supernatant media were aspirated. First, the specimens were followed by fixing of the samples in 2% glutaraldehyde in 0.1 M pH 7.3 sodium 7 cacodylate buffer for 1 h. Next, the specimens were immersed in 0.1 M sodium cacodylate buffer with 0.2 M pH 7.3 sucrose for 20 min, followed by dehydration at increasing concentrations of alcohol for 20 min. An ImageJ plugin was used for computing cell directionality.
2.5.3. Live/dead cell vitality assay
Quantification of live and dead cells was performed using the LIVE/DEAD™ Cell Vitality Assay Kit, C12 Resazurin/SYTOX™ Green (ThermoFisher, Catalog#: L34951), which provides a two-color fluorescence method to determine the metabolic activities of the cells. This assay simultaneously distinguishes between the live and dead cells based on reduction of C12-resazurin to red-fluorescent C12-resorufin that indicates the healthy cells; this fluorophore excites at 563 nm and emit at 587 nm. Cells with compromised plasma membranes emit green fluorescence, which is a nucleic acid stain, upon uptake of SYTOX Green dye with excitation and emission of 504 nm and 523 nm, respectively.
2.5.4. Immunofluorescence assays
2.5.4.1. Anti-nestin antibody
Prior to the immunofluorescence assay, the NSCs cultured on fiber scaffold were fixed with 100% methanol for 5 min and permeabilized in 0.1% Triton X-100 for 5 min and followed by blocking in 1% bovine serum albumin (BSA)/10% goat serum/0.3 M glycine in 0.1% phosphate buffer solution (PBS)-Tween for 1 h. After the fixation of NSCs on the fiber scaffold, they were then incubated in the presence of anti-nestin antibody (Catalog number: ab196693) conjugated with Alexa Fluor® 647 at a 1:50 dilution (red fluorescence) overnight at 4 °C. Nuclear DNA was labelled in blue with 4'-6-diamidino-2-phenylindole (DAPI).
2.5.4.2. Anti-galactocerebroside (GalC) antibody
The NSCs were fixed with 4% paraformaldehyde and incubated for 20 min at room temperature and permeabilized in 0.3% Triton® X-100/PBS/0.1% BSA agent for 5 min and followed by blocking in 1X PBS/5% BSA for 30 min. They were then incubated in the presence of anti-GalC, Alexa Fluor® 488 Conjugate at 1:200 dilution (green fluorescence) for 1 h. Nuclear DNA was labelled in blue with DAPI.
2.5.4.3. Anti-doublecortin (Dcx) antibody
The NSCs were fixed 4% paraformaldehyde for 20 min, permeabilized with 0.3% Triton® X-100 in PBS and blocked with 10% serum. The cells were stained with Doublecortin/Dcx Antibody (Catalog number: 48-1200) at a 1:1000 dilution in 0.1% BSA and incubated for 3 h at room temperature and then labeled with Goat anti-Rabbit IgG (H + L) Superclonal™ Secondary Antibody with an Alexa Fluor® 488 (Catalog number: A27034) conjugate at a 1:2000 dilution for 45 min at room temperature, followed by staining the nuclei with DAPI (blue).
2.5.4.4. Statistics
All the cell culture experiment assays were performed at least three times and the data points are averages unless otherwise noted. The error bars indicate the mean ± SD. Statistical significance was evaluated using two-way analysis of variance (ANOVA) with *p < 0.05 and **p < 0.01 and Tukey's multiple comparisons test between the group means.
3. Results and discussion
3.1. Fabrication and surface modification of NSC scaffold
The polymeric fiber scaffold was fabricated via thermal drawing of a 3D printed preform as described in figure 2. In this study, we incorporated micro-grooves on the surface of the 3D printed preform design, a large central lumen for potential future microfluidic capability and smaller peripheral lumens (figures 2(a) and (b)) to allow for future electrode integration for localized electrical stimulation. The dimensions of the 3D printed preform, before thermal drawing, were 20 mm in diameter and 150 mm in length. The preform (figure 2(d)) was then fed into a three-zone tube furnace of a drawing tower while being pulled down vertically (figure 2(c)). The three-zone furnace ensured stable and uniform control on the temperature profile across the length of the preform. The top zone was set for preheating the preform, the middle zone heated the preform to a temperature above the glass transition temperature of Ultimaker Transparent PC (Manufacturer's Datasheet: Tg = 112–113 °C), and the bottom zone defined the quenching time of the drawn fiber. Once the fiber is quenched, a capstan is used to pull the fiber at a constant speed and the diameter of the fiber was continually monitored by a laser micrometer. 3D printing presents weaker polymer adhesion in the axial direction due to layer by layer production nature of the technology. In order to maintain a continuous draw, the tension is kept at low values (below 50 grams) during draw to prevent detachment of layers. This process allowed for the fabrication of tens of meters of fiber presenting a microstructure well controlled by the features of the initial preform. The micro-grooves on the surface of the fiber, the central lumen and the peripheral lumens are evident in the scanning electron micrograph (figure 2(e)). The resulting width of the grooves (wg) was ∼46 µm wide, the terrace was ∼63 µm wide and the height of the grooves was ∼34 µm. These surface structures are similar to previously reported microgrooves that were shown to promote cell development and permit cell alignment [50]. Finally, the fiber was cut into the appropriate length depending on the final desired geometry of the scaffold (ca. 25 mm for this study).
In this study, different surface treatments for enhancement of the cell interaction with the surface of the fibers were examined, such as PLO. Furthermore, integration of DWCNTs with PLO as a surface treatment was also used, to investigate the effect of CNTs on inducing differentiation of NSCs. To enable characterization of the surface treatments, they were first applied to planar PC substrates and the surface properties were then characterized. The procedure of the surface treatments is explained in the section 2 above, but briefly the planar PC substrates were coated with three suspensions containing different concentrations of DWCNTs; 0.39 g l−1, 0.039 g l−1 and 0.0039 g l−1, denoted as dilutions 10 ×, 100 × and 1000 ×, respectively. This range of concentrations was chosen to enable a thorough investigation of the DWCNT concentration parameter space, and its subsequent effect on cell vitality and differentiation. Furthermore, these concentrations are within the range of CNT concentrations previously investigated in the literature [30, 36, 37, 40]. The presence of well separated DWCNTs in these suspensions were confirmed with TEM as shown in figure 3(a).
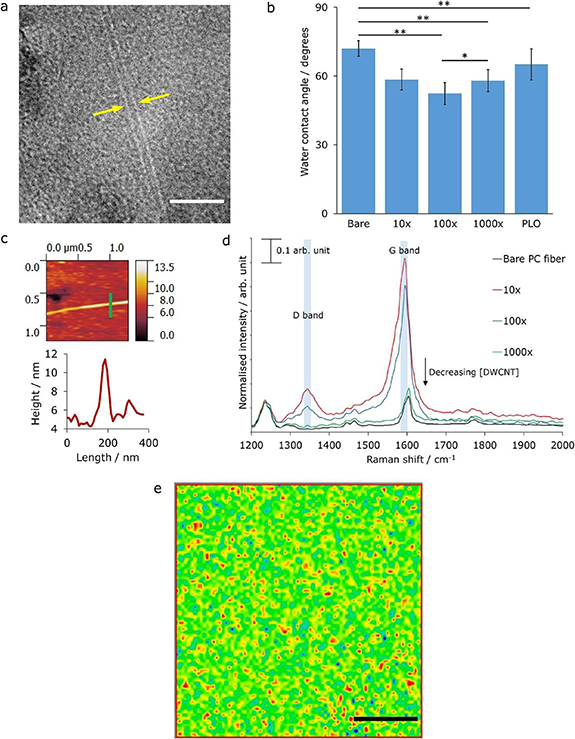
Figure 3. (a) Transmission electron micrograph of the DWCNTs. The width of a DWCNT is highlighted by the yellow arrows. Scale bar = 20 nm. (b) Measured water contact angles for each surface functionalization. 'Bare' refers to unfunctionalized PC surface, 10×, 100× and 1000× refer to surfaces modified with coatings of 1:1 suspension of PLO:DWCNTs, in which the concentrations of DWCNTs were 0.39 gl−1, 0.039 gl−1 and 0.0039 gl−1, respectively. PLO refers to the surface functionalized with PLO. Error bars correspond to the associated propagated errors. *P < 0.05; **P < 0.01; otherwise, not significant (one-way ANOVA followed by post-hoc t-tests using the Bonferroni approach). (c) (Top) AFM image of a section of the surface of a PC substrate functionalized with the 100× suspension. A cross section through that feature (the bright green line) is shown in the (bottom) image where the height of the bright line feature is ∼5 nm—this corresponds to the width of a DWCNT. (d) Normalized Raman spectra (532 nm) demonstrating the presence of DWCNTs on the surface of the PC fiber scaffolds that were functionalized with the three 1:1 PLO:DWCNT suspensions, due to the presence of the D band at ∼1350 cm−1 and the G band at ∼1580 cm−1. The spectra were normalized at 50 cm−1. (e) Raman mapping (532 nm) highlighting the widespread distribution of DWCNTs on the surface of the PC fiber scaffold that was functionalized with the 100× 1:1 PLO:DWCNT suspension. The colors represent the intensity of the D band at ∼1350 cm−1 at each point (0.5 × 0.5 µm) within the mapping region (40 × 40 µm), with red as the highest intensity values (thus showing the presence of DWCNTs) and blue as the lowest intensity values. The scale bar = 10 µm.
Download figure:
Standard image High-resolution imageTo characterize the surface functionalized planar PC substrates, contact angle measurements and atomic force microscopy were conducted. As shown in figure 3(b) and detailed in table S1, different surface functionalization resulted in different water contact angles, with the highest water contact angle measured on the bare PC surface (72.0 ± 3.4)°. The water contact angles measured for the surfaces functionalized with the 10 ×, 100 × and 1000 × suspensions of 1:1 PLO:DWCNT were all similar within error (see figure 3(b)) (not statistically significant p > 0.05, apart from 100 × compared to 1000× p < 0.05), but were all very statistically significantly different (p < 0.01) when compared to the contact angle of the bare PC surface. It has been shown that cell attachment is enhanced with an increase of the hydrophilicity of the surface [51, 52], therefore improved cell adhesion on the PLO:DWCNT functionalized surfaces, compared to the bare PC surface was expected. Furthermore, an AFM study was performed to demonstrate the presence of DWCNTs on the planar PC substrates after treatment with the 100 × DWCNT 1:1 PLO suspension. Bright line features were visible in the AFM image (figure 3(c) (top)). Upon further examination, a cross section through one of the bright line features (figure 3(c) (bottom)), revealed a height of ∼5 nm, which is in agreement with the expected thickness of DWCNTs [53]. The corresponding cross section is highlighted as a bright green line in figure 3(c) (top).
After confirmation of the efficacy of the surface functionalization steps, the drawn and sterilized fibers were subsequently coated with the three suspensions containing different concentrations of DWCNTs; 0.39 g l−1, 0.039 g l−1 and 0.0039 g l−1, denoted as dilutions 10×, 100× and 1000×, respectively. A bare surface PC fiber was used as a control for these characterization experiments. It is known in the literature that CNTs interact with polycations (in this case PLO) through non-covalent adsorption interactions [49], and the presence of DWCNTs on the surface of the fiber substrates functionalized with the suspensions of 1:1 PLO:DWCNT (at varying concentrations) was confirmed by Raman spectroscopy (figure 3(d), individual normalized spectra figures (S2–5)), due to the presence of the D and G band peak features in the normalized Raman spectra at ∼1350 cm−1 and ∼1580 cm−1, respectively. It should be noted that the G band peak feature at ∼1580 cm−1 was partly convoluted with a Raman shift peak feature at ∼1600 cm−1 arising from the PC substrate, but the G band could still be observed in the spectra. A Raman spectroscopy mapping experiment (532 nm) was then conducted on the surface of the fiber coated with the 100× 1:1 PLO:DWCNT suspension, to investigate the distribution of the DWCNT on the fiber surface. The mapping spectral data from the investigated region (40 × 40 µm area, each spot is 0.5 × 0.5 µm) was then analyzed in terms of the intensity of the D band (∼1350 cm−1) peak at each point, and this was then output as a color scale, with red as the highest intensity value at ∼1350 cm−1 and blue as the lowest intensity value at ∼1350 cm−1. As can be seen in figure 3(e), the distribution of red, which represents high peak intensity at ∼1350 cm−1 and thus the presence of DWCNTs, is well spread across the surface of the fiber. Having successfully treated and characterized the functionalized PC fiber scaffolds, cell culture experiments, including biocompatibility and immunofluorescence assays, were performed.
3.2. Cell culture experiments
3.2.1. Live/dead vitality assay
To ascertain the implementation of the fiber scaffold for NSC-based therapy and PNS nerve regeneration, NSCs were used as a case study, following the example of previous works in the literature [21–27]. The influence of different surface modifications on the cell vitality was first evaluated using the Live/Dead vitality assay, for 3 and 7 d on a planar PC substrate. Briefly, a PC substrate was diced into 1 × 1 cm2 specimens and subsequently coated with PLO:DWCNT (1:1) suspensions at nominal 10×, 100× and 1000× dilutions, followed by culturing the NSCs at a seeding density of 50 000 cells cm−2 in passage 2 and incubation for 3 and 7 d. In order to determine the effect of the DWCNT on cell viability, the control samples were coated with just PLO. The cell vitality used in this study is based on distinguishing metabolically active cells from injured and dead cells. The active cells (healthy) metabolize the C12-resazurin to C12-resorufin and emit red fluorescence. On the other hand, cells at late apoptotic and necrotic stages with compromised plasma membranes emit green fluorescence on the uptake of the SYTOX Green dye. The result obtained from the live/dead vitality assay is shown in figure 4.
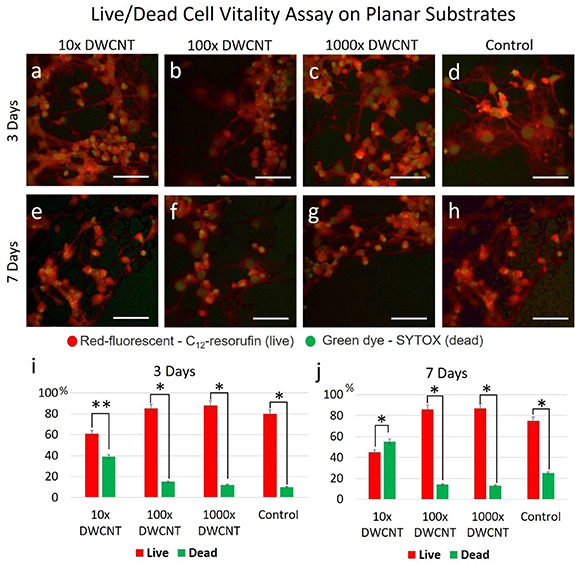
Figure 4. Live/Dead cell vitality assay on planar PC substrates treated with different concentrations of DWCNT and PLO. The fluorescent images of NSCs cultured on samples with 10×, 100× and 1000× DWCNT concentrations for 3 and 7 d are shown in (a)–(c) and (e)–(g), respectively, and compared with the control in (d) and (h). The statistical analysis of the Live/Dead cell vitality assay obtained after 3 (i) and 7 (j) d shows higher cell vitality at lower concentrations (100× and 1000×) of DWCNTs. Cells cultured on an unfunctionalized PC petri dish were used as the control. The scale bars represent 50 µm. Error bars indicate the mean ± SD. (n = 6). Two-way ANOVA and Tukey's multiple comparison test were carried out for statistical difference between the group means (*P < 0.05; **P < 0.01; otherwise, not significant).
Download figure:
Standard image High-resolution imageFluorescent images of the cell vitality assay obtained from the 10×, 100× and 1000× DWCNT concentrations and control samples for 3 and 7 d are depicted in figures 4(a)–(d) and (e)–(h), respectively. The statistical analysis shows that NSCs cultured on the 10× specimen have lower vitality than the cells cultured on the 100× and 1000× specimens, the same trend has been observed for 3 (figures 4(i)) and 7 (figure 4(j)) d of incubation. The results obtained from 100× and 1000× are in line with the ones from the control in which an average cell vitality of 70% has been observed. In this study, a standard PC cell culture petri dish was used as the control. Given the optimal cell vitality is achieved on 100×, this dilution factor has been applied for throughout the rest of this study.
In addition to cytotoxicity evaluation of the surface treatment on the planar PC substrate, cell vitality of the NSCs seeded on the fiber scaffold before (figures 5(e)–(h)) and after (figures 5(a)–(d)) EGF and bFGF recombinant withdrawal has been assessed. For better comparison, the following experiments have been carried out on the fiber scaffolds coated with 100× PLO:DWCNT suspension, and only coated with PLO (without DWCNT). Fluorescent images taken from both surface functionalized, and untreated fiber scaffolds are shown at different magnifications in figures 5(a)–(b), (e)–(f) and (c)–(d), (g)–(h), respectively. The statistical analysis of cell vitality of NSCs on the fiber scaffold is plotted in figure 5(i). As depicted in figures 4 and 5, neither the 100× PLO:DWCNT surface treatment, nor peripheral microgrooves on the fiber have antagonistic effect on cell vitality of NSCs before and after differentiation. Therefore, in the following experiments, in which the influence of DWCNTs and the surface morphology on the differential fate of the NSCs was determined, the use of the 100× PLO:DWCNT suspension was implemented to perform the following immunofluorescence assays.

Figure 5. Fluorescent images obtained with the Live/Dead cell vitality assay of NSCs cultured on the fiber scaffold after (a)–(b) and (e)–(f) and before (c)–(d) and (g)–(h) surface treatment with 100× PLO:DWCNT. This experiment has been carried out on differentiated (a)–(d) and undifferentiated (e)–(h) NSCs after 3 d of incubation. The statistical analysis of cell vitality is compared and plotted in (i), indicating that topographical and physiochemical attribution of the fiber scaffold has no impact on cell vitality. An average of 75% cell vitality has been observed. The scale bars represent 50 µm. Error bars indicate the mean ± SD. (n = 3). Two-way ANOVA and Tukey's multiple comparison test were carried out for statistical difference between the group means (*P < 0.05; **P < 0.01; otherwise, not significant).
Download figure:
Standard image High-resolution image3.2.2. NSC directionality
While cultured on the micro-structure neural scaffold, an alignment of the cells along the axis of the grooves can be observed, which corroborates with the works of Koppes et al and Nyugen-Dang et al [3, 15]. The SEM micrograph of NSCs cultured on the fiber scaffold demonstrates cell directionality imposed by the facial grooves on the periphery of the fiber scaffold as shown in figure 6(a). The effect of cell trapping caused by the grooves could be prevented by optimizing the cell seeding density and the width and the shape of the grooves. Furthermore, directionality afforded by fiber grooves can be qualitatively observed when fluorescent microscope images of NSCs cultured on a planar substrate (figure 6(b)) and fluorescent microscope images of NSCs cultured on the fiber scaffold are compared. As can be seen in (figure 6(b)), the cells and on the planar surface are orientated in all directions, whereas the cells on the fiber scaffold are mostly orientated along the direction of the long axis of the microgrooves. To quantify this observation, an analysis of the morphology of the cell body was carried out. The directionality of the NSCs seeded on the fiber scaffold (figure 6(c)) was measured using an ImageJ particle analysis function, with the cell cytoskeletons stained red in the fluorescence microscopy images. The cell cytoskeletons are approximated by an ellipse and the angle (α) between the long axis of the cell and the vertical axis (noted 0°), parallel to the scaffold grooves, was measured, as show in figure 6(d). The polar diagram of figure 6(e) represents the distribution of the cell orientation and highlights the directionality of the culture. The mechanical constraints applied to cells during culture can dictate a specific growth directionality.

Figure 6. Study on the effect of the surface structure of the fiber scaffold on the NSC directionality. (a) SEM micrograph of NSC (false colorized in blue for emphasis) cultured on the fiber scaffold, demonstrating cell directionality and axon extensions. The scale bar represents 20 µm. (b) Fluorescent microscope image of NSCs cultured on a planar substrate. The scale bar represents 50 µm. (c) Fluorescent microscope image of NSCs cultured on the fiber scaffold. The scale bar represents 50 µm. (d) Schematic view of the method for calculation of the cell angle, α. (e) Polar diagram plot of the distribution of NSC directionality on the surface of the functionalized fiber scaffolds.
Download figure:
Standard image High-resolution image3.3. Immunofluorescence assays
3.3.1. Anti-nestin antibody phenotype expression
In order to carry out the immunofluorescence assays, cells at passage 2 were cultured on both fiber scaffolds treated with and without DWCNTs for 7 d. In order to avoid undesirable differentiation, the growth rate was maintained in mild-logarithmic phase with 75%–90% confluency. To also better understand the influence of the DWCNTs on cell differentiation, these assays were compared before and after withdrawal of the recombinants.
Nestin protein is expressed in undifferentiated radial glia/neural progenitor cells (NSCs) at a very high level [54]. Therefore, the NSCs were first examined against immature primary neurons in culture by using anti-nestin antibody expression. It was observed that in the presence of the recombinants (figures 7(c)–(d)) cells remained undifferentiated. However, this ratio was 2-fold higher on the fiber scaffold treated with the DWCNTs in the presence of recombinants (figures 7(g)–(h)). Moreover, upon withdrawal of the recombinants a lower number of cells expressed nestin on the DWCNT-treated fiber scaffold (figures 7(e)–(f)), which means there is a higher tendency towards differentiation and only 15% of the cells remained undifferentiated. This observation contrasts with the counterpart fiber that was not treated with DWCNTs (figures 7(a)–(b)), on which almost twice the number of cells remained undifferentiated. To validate the phenotype of the differentiated cells, they were examined against glial and neuronal cells. Images of NSCs cultured on the control and stained with nestin are demonstrated in Fig. S6.
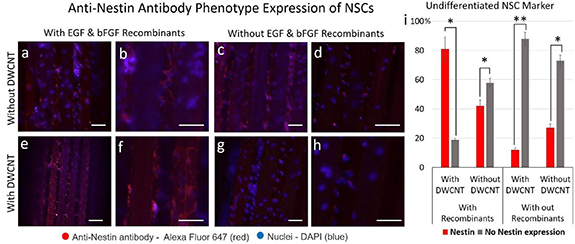
Figure 7. Immunofluorescence staining of nestin in NSCs cultured on fiber scaffolds treated with and without 100× DWCNT, after and before withdrawal of the recombinants. Overlaid fluorescence images taken from fiber scaffold without surface treatment before (a)–(b) and after (c)–(d) withdrawal of the recombinants. NSCs in presence of DWCNTs (e)–(h) exhibit lower expression of nestin shown in red-fluorescence both after (e)–(f) and before (g)–(h) elimination of the recombinants. The statistical analysis (i) shows a higher number of NSCs differentiated in the presence of DWCNTs after withdrawal of recombinants. The NSCs were fixed with 100% methanol for 5 min and permeabilized in 0.1% Triton X-100 for 5 min, followed by blocking in 1% BSA/10% goat serum/0.3 M glycine in 0.1%PBS-Tween for 1 h. After the fixation of NSCs on the fiber scaffold, they were incubated in the presence of anti-nestin antibody conjugated Alexa Fluor® 647 at 1/50 dilution (red fluorescence) overnight at + 4 °C. Nuclear DNA was labelled in blue with DAPI. The scale bars represent 50 µm. Error bars indicate the mean ± SD. (n = 3). Two-way ANOVA and Tukey's multiple comparison test were carried out for statistical difference between the group means (*P < 0.05; **P < 0.01; otherwise, not significant).
Download figure:
Standard image High-resolution image3.3.2. Anti-GalC antibody phenotype expression
An immunoassay using a GalC antibody was exploited to identify the phenotype of the differentiated cells. As immunofluorescence images depicted in figure 8, NSCs were cultured on the fiber scaffold in the presence (figures 8(a)–(b)) and absence (figures 8(c)–(d)) of the recombinants, wherein figures 8(c)–(d) is with DWCNT surface treatment and figures 7(e)–(h) is without. Our observation evidenced that NSCs cultured on the fiber scaffold treated with DWCNTs, shown in figures 8(g)–(h), revealed lower expression of the GalC phenotype, displayed as green fluorescence both before and after withdrawal of the recombinants. Further statistical analysis demonstrated in figure 8(i) shows a fewer NSCs differentiated into oligodendrocytes in the presence of DWCNTs and the absence of recombinants. NSCs cultured on the control and stained with GalC is demonstrated in figure S7. Significantly fewer NSCs differentiated into oligodendrocytes in this condition than the oligodendrocytes observed while the recombinants were still administrated. It is known that recombinants prevent the NSCs from differentiation. However, the statistical analysis shows that this function is significantly more effective in the presence of the DWCNTs.

Figure 8. Immunofluorescence images of GalC expression in NSCs cultured on fiber scaffolds treated with and without 100× DWCNTs, after and before differentiation. Overlaid fluorescence images taken from fiber scaffolds with surface treatment before (a)–(b) and after (c)–(d) differentiation. NSCs in absence of DWCNTs (e)–(h) exhibit higher expression of GalC phenotype shown in green fluorescence both before (e)–(f) and after (g)–(h) elimination of the recombinants. The statistical analysis (i) shows a higher number of NSCs differentiated into neuroglia in the absence of DWCNTs and after withdrawal of recombinants. The NSCs were fixed with 4% paraformaldehyde, incubated for 20 min at room temperature, and permeabilized in 0.3% Triton® X-100/PBS/0.1% BSA agent for 5 min, followed by blocking in 1X PBS/5% BSA for 30 min. They were then incubated in the presence of Anti-GalC, Alexa Fluor®488 conjugate at a 1:200 dilution (green fluorescence) for 1 h. Nuclear DNA was labelled in blue with DAPI. The scale bars represent 50 µm. Error bars indicate the mean ± SD. (n = 3). Two-way ANOVA and Tukey's multiple comparison test were carried out for statistical difference between the group means (*P < 0.05; **P < 0.01; otherwise, not significant).
Download figure:
Standard image High-resolution image3.3.3. Anti-Dcx antibody phenotype expression
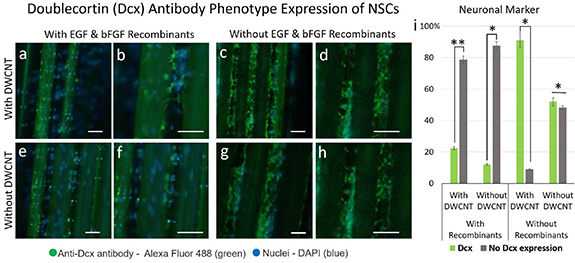
The NSCs were further characterized by using the Dcx marker. In contrast to GalC, Dcx is expressed in neuronal cells. The same procedure used for the nestin and GalC assays was applied to identify neural cells and further elucidate the influence of the DWCNT surface treatment on the differentiation of NSCs. Interestingly, a significantly higher number of cells (twice the number of NSCs after elimination of the recombinants) were Dcx-positive, indicating that they had differentiated into neurons. This observation agrees with the assessments of figures 7 and 8, where remarkably fewer NSCs expressed nestin or differentiated into oligodendrocytes on the DWCNT-treated fiber scaffold, respectively. It was noticed that cells expressing neurites were generally nestin-negative after the withdrawal of recombinants and nestin-positive in the presence of the recombinants. These results are demonstrated in the immunofluorescence assays shown in figure 8, where Dcx was used as a marker for neural cells. NSCs in the presence of DWCNT (figures 9(a)–(d)) exhibit higher expression of the Dcx marker, shown in green fluorescence, both before (figures 9(a)–(b)) and after (figures 9(c)–(d)) elimination of the recombinants. NSCs cultured on the control and stained with Dcx are demonstrated in figure S8. This was further confirmed by statistical analysis (figure 9(i)), which showed that a significantly higher number of NSCs differentiated into neuronal cells in the presence of DWCNTs and after withdrawal of the recombinants.
Figure 9. Immunofluorescence analysis of neuronal cells was performed using Dcx as a marker on 70% confluent log phase NSCs cultured on the fiber scaffolds, both with and without 100× DWCNT surface treatment, before and after differentiation. Overlaid fluorescence images taken from fiber scaffolds with surface treatment before (a)–(b) and after (c)–(d) differentiation. NSCs in the presence of DWCNTs (a)–(d) exhibit higher expression of the Dcx marker shown in green-fluorescence, both before (a)–(b) and after (c)–(d) elimination of the recombinants. The statistical analysis (i) shows a significantly higher number of NSCs differentiated into neuronal cells in the presence of DWCNTs and after withdrawal of the recombinants. The NSCs were fixed with 4% paraformaldehyde for 20 min, permeabilized with 0.3% Triton® X-100 in PBS and blocked with 10% serum. The cells were stained with Dcx antibody at a 1:1000 dilution in 0.1% BSA and incubated for 3 h at room temperature and then labeled with a secondary Alexa Fluor® 488 conjugate antibody at a dilution of 1:2000 for 45 min at room temperature, followed by DAPI (blue) nuclei staining. The scale bars represent 50 µm. Error bars indicate the mean ± SD. (n = 3). Two-way ANOVA and Tukey's multiple comparison test were carried out for statistical difference between the group means (*P < 0.05; **P < 0.01; otherwise, not significant).
Download figure:
Standard image High-resolution image
Therefore, it could be inferred that the observed phenomenon of maintaining the NSCs undifferentiated in the presence of the recombinant, and differentiated in the absence of the recombinant more effectively compared to the control (samples coated with PLO only), is due to the DWCNT, as a potential influence of the PLO was ruled out by using PLO treated fiber scaffolds as the control.
Overall, a DWCNT-functionalized microstructured drawn fiber (figures 2 and 3) has been shown to be an effective biocompatible scaffold for NSC culture, as demonstrated in figure 5. This is further corroborated with the directionality results shown in figure 6, which are in line with previous reports [13, 29, 30], as well as the proliferation and differentiation results highlighted in figures 7–9. The combination of the microstructured fiber scaffold with an optimized DWCNT and PLO coating, following on from the planar culturing substrate approaches [16, 30, 41], has expanded the toolbox of the thermal fiber drawing technique for potential PNS applications. However, it is acknowledged that this current iteration of the scaffold can be improved in terms of the constituent fiber material, following the works on hollow-core conduits[8, 10, 12]. The aim of this initial work was to highlight, for the first time, that these technologies and parameters can be combined to form a novel and viable route to nerve regeneration technology, which does not require the use of allograft or xenograft tissues and thus avoids the associated issues [6]. Therefore, for pragmatic reasons, PC was chosen as the constituent fiber material – PC is well suited to the fiber thermal drawing technique. However, the Young's modulus of PC is ∼285 times larger than the Young's modulus of an adult peripheral nerve [55], but in future work, further iterations of these living scaffolds will be comprised of polymers with similar Young's moduli values to peripheral nerve tissue, such as poly[styrene-(ethylene-co-butylene)-styrene] (SEBs). SEBs has been successfully thermally drawn into fibers [56], and it has a Young's modulus similar in magnitude to nerve tissue [57]. In addition, biodegradability is a crucial parameter for consideration, and it is noted that aromatic backbone PCs, the type used in this proof-of-concept work, exhibit low biodegradability. This is a limitation common to other drawn fiber examples in the literature [3, 15]. Therefore, future iterations of this scaffold technology will explore the use of polymers with higher biodegradability, such as aliphatic backbone PCs, which are more biodegradable than aromatic backbone PCs [58], or other specially designed biodegradable polymers, such as the Bio-Flex® or Mater-Bi families of polymers, which can be thermally drawn into fibers [59]. We anticipate that further development of these fiber scaffolds, focused on improving flexibility and biodegradability, plus the integration of electrodes and microfluidic channels, will enable future improvements in nerve regeneration technology [1].
4. Conclusions
In this paper, the feasibility of an engineered neural cell scaffold, fabricated by thermal drawing of a 3D printed preform was examined. This fabrication approach allows for a wide range of complex scaffold designs to be achieved. In this work, a fiber scaffold, which combines micron-scale grooves on the surface with a central lumen, for future microfluidic capabilities and intraluminal cell growth, and peripheral lumens, for incorporation of electrodes for future cell electrical stimulation, has been demonstrated. In combination with surface functionalization of the scaffolds via treatment with DWCNT-PLO suspensions, we demonstrated biocompatibility. By optimizing the DWCNT-PLO suspension concentrations, cell vitality was improved by greater than 20%. The optimized surface functionalization with 100× DWCNT-PLO without presence of recombinants, was shown to enhance differentiation of NSCs two-fold compared to scaffolds without DWCNTs. The induced neuronal characteristic of NSCs in presence of 100× DWCNT-PLO was further validated by using the Dcx marker, both before and after removal of recombinants, and in both cases significant propensity towards neuronal cell differentiation was evidenced.
Overall, our results illustrate the potential for the use of this scaffold as part of a nerve regenerative implant. In this study we designed a thermally drawn scaffold fiber and examined the effect of surface engineering on neural cell behavior. This work expands the toolbox of the thermally drawn fiber technique into the area of neural regeneration. In addition, the scaffold design presented herein allows for future investigation of the effect of electrical, chemical, optical and biochemical stimuli, and their synergy together with surface engineering, for the goal of a new paradigm in nerve regeneration.
Acknowledgments
This work was financially supported by the Engineering and Physical Sciences Research Council (EPSRC), United Kingdom (EP/L014149/1, Smart Sensing for Surgery), (EP/P012779, Micro-Robotics for Surgery) and Imperial College Healthcare NHS Trust-BRC, United Kingdom (WSSS_P69945). We would like to also thank Dr Jang Ah Kim for assistance with figure 6(a). We would like to thank Dr Mahmoud Ardakani in the Harvey M. Flower Microstructural Characterization Suite for assistance with TEM and Dr Victoria Bemmer for AFM measurements. We would also like to thank the Imperial College FILM facility for access to the CF3-Leica SP5 MP/FLIM upright confocal microscope, which was funded by the Wellcome Trust (Grant 104931/Z/14/Z).
Conflict of interest
The authors declare no competing financial interest.
Data availability
Raw data available at Imperial College London Research Computing Service data repository: http://doi.org/10.14469/hpc/7130.