


Increasing the energy density of rations for cattle is a widely adopted strategy to improve nutrient intake and production performance (Penner and Oba, Reference Penner and Oba2009). However, substantial imbalances between readily fermentable carbohydrate and physically effective NDF may result in repeated episodes of low ruminal pH, causing sub-acute ruminal acidosis (SARA) (Humer et al., Reference Humer, Petri, Aschenbach, Bradford, Penner, Tafaj, Südekum and Zebeli2018; Stefanska et al., Reference Stefanska, Człapa, Pruszynska-Oszmałek, Szczepankiewicz, Fievez, Komisarek, Stajek and Nowak2018). SARA has been variably defined since it was initially proposed as a syndrome with the focus of the definition shifting from rumen pH to rumen microbiome and its metabolic activity (Gozho et al., Reference Gozho, Plaizier, Krause, Kennedy and Wittenberg2005; Saleem et al., Reference Saleem, Ametaj, Bouatra, Mandal, Zebeli, Dunn and Wishart2012; McCann et al., Reference McCann, Luan, Cardoso, Derakhshani, Khafipour and Loor2016). The comparison between the effect of starch and sugar supplementation on reticuloruminal pH and metabolism has been investigated several times in the last decades, with apparently contradictory results. In some studies, addition of dietary sugars did not cause significant reductions in pH values (Broderick and Radloff, Reference Broderick and Radloff2004; DeFrain et al., Reference DeFrain, Hippen, Kalscheur and Schingoethe2004; Broderick et al., Reference Broderick, Luchini, Reynal, Varga and Ishler2008; Chibisa et al., Reference Chibisa, Gorka, Penner, Berthiaume and Mutsvangwa2015). In others, however, there were decreased mean pH values (Chamberlain et al., Reference Chamberlain, Thomas, Wilson, Newbold and Macdonald1985; Gao and Oba, Reference Gao and Oba2016), or even increased values (Penner and Oba, Reference Penner and Oba2009; Penner et al., Reference Penner, Guan and Oba2009; Martel et al., Reference Martel, Titgemeyer, Mamedova and Bradford2011). None of the above-mentioned studies described the inflammatory response induced by these two sources of carbohydrate.
Forestomach motility has been investigated in the past to describe pathophysiological changes that occur following acute lactic acidosis (Gregory, Reference Gregory1987), however, few descriptions of reticuloruminal motility at mildly acidotic pH values are available in the literature (Crichlow and Chaplin, Reference Crichlow and Chaplin1985). We hypothesized that a suboptimal rumen milieu would affect the ruminal contraction rate and that those indwelling devices designed to continually measure rumen motility would identify this change of pattern.
Therefore, the objectives of this study were (1) to test the hypothesis that reticuloruminal pH profiles, reticuloruminal motility, blood biochemistry and haematology, and ruminal biochemistry profiles would differ in cattle fed on one of two isoenergetic and isonitrogenous diets, of divergent starch and sugar content, but designed to induce SARA, and (2) to test the value of continually monitored reticuloruminal contraction patterns in parallel with the continuous monitoring of reticuloruminal pH during experimentally induced SARA.
Material and methods
Animals and experimental procedures
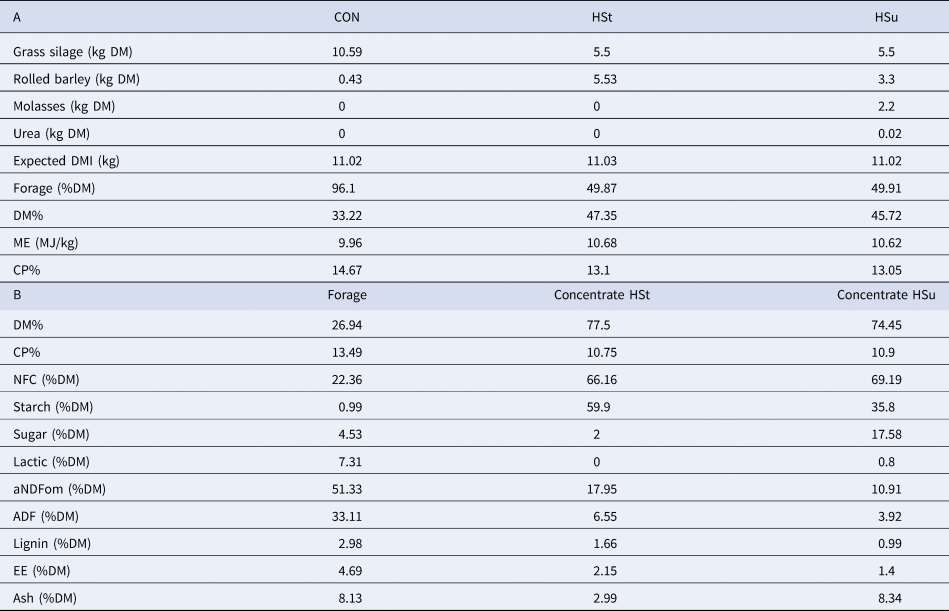
The experiment involved six adult, non-lactating, rumen-fistulated Jersey cows and was conducted at the University of Glasgow's Cochno Farm near Glasgow, UK. Ethical approval was provided under the Home Office Project Licence PPL 60/4156. The mean initial weight for the animals was 625 ± 40 kg (mean ± standard deviation). The study was a 3 × 3 Latin square of 9 wk divided into 3 periods of 3 wk each. During the first 2 wk of each experimental period, cows were fed on a maintenance diet (CON). In the last week of each experimental period each animal was allocated to one of three diets: continuation of the existing maintenance diet (CON), a high-starch diet (HSt) or a high-sugar diet (HSu). The composition of the three diets is summarized in Table 1. Dietary components were regularly sampled and analysed by near-infrared (NIR) spectroscopy to ensure consistency in diet composition. Cows were stabled in pairs with mattresses and wood shavings, and with free access to water. Concentrate was offered individually once daily between 09 : 00 and 11 : 00. At 11 : 00, any left-over diet was removed and weighed. Then grass silage was offered at the maximum inclusion rate indicated in Table 1. Grass silage was withdrawn (without recording the weight) at 21 : 00 in those weeks in which challenge diets were offered or left overnight during the washout periods before being withdrawn. Animals were monitored daily according to four health parameters: faecal consistency, inappetence, depression, and ruminal tympany. Faecal consistency was scored using a simplified scale from 0 (not present) to 2 (severe) adapted from Atkinson (Reference Atkinson2009). Inappetence was scored as 1 if more than 25% of the concentrate was refused, or 2 if it was totally refused. Animals less active compared with pen-mates were scored 1 for depression while animals unable to stand would have been scored as 2 (this did not happen during the experiment).
Table 1. Ingredients (A) of the experimental diets and chemical composition (B) of diets' constituents (dry matter basis)
Sample collection
All feed samples were stored in the freezer at −20°C until they were analysed. Silage was sampled four times during the experiment; barley and molasses two times each. Blood and ruminal samples were taken on the first (TP-1), the second (TP-2), and the last (TP-7) day of each challenge week for a total of nine sampling times. Blood samples were always taken before animals had access to the diet. Rumen fluid was collected from the ventral sac of the rumen through the cannula, into two Falcon tubes (15 ml) with and without glycerol (3 ml). Blood was collected via jugular venepuncture into vacutainers for blood and plasma and all the samples were kept refrigerated till they were processed in the laboratory within 4 h.
Feed analyses
Feed analysis was outsourced to an external laboratory (CVAS Dalton, Thirsk, North Yorkshire, YO7 3JA, UK) which analysed silage, barley and molasses using NIR (FOSS 5000 NIR, FOSS UK Ltd, Warrington, WA3 6AE, UK) using calibrations provided by CVAS and reported the results based on the CNCPS system.
Haematological and biochemical analysis
Haematological and biochemical analyses were performed by the University of Glasgow Veterinary Diagnostic Services laboratory. A flow-cytometer (ADVIA 120, Haematology System, Siemens, UK) was used to obtain haemoglobin, red blood cell count, haematocrit, mean corpuscular volume, mean corpuscular haemoglobin, mean corpuscular haemoglobin concentration, platelet count, white cell count, and differentiated white cell count (neutrophils, lymphocytes, monocytes, eosinophils, basophils). An integrated chemistry system (Dimension Xpand Plus, Siemens, UK) was used to obtain sodium, potassium, chloride, calcium, phosphate, magnesium, urea, creatinine, bilirubin, alkaline phosphatase, aspartate aminotransferase, gamma-glutamyl transferase, total protein, albumin, globulin, glutamate dehydrogenase concentrations. Glucose concentration in plasma was determined using a commercial kit (GLUC, Dimension clinical system, Siemens, UK) based on the assay described by Kunst et al. (Reference Kunst, Drager, Ziegenhorn and Bergmeyer1984). β-hydroxybutyrate (BHB) was determined by a commercially available enzymatic method (RANBUT, Randox Laboratories Ltd, UK). The procedure is based on the oxidation of D-3-hydroxybutyrate to acetoacetate by 3-hydroxybutyrate dehydrogenase and the reduction of a cofactor NAD+ to NADH + H+. The variance in absorbance determined by the NADH is directly correlated with the BHB concentration. Non-esterified fatty acids (NEFA) analysis was outsourced to an external ISO 17025 accredited laboratory (SAC Consulting Veterinary Services, Auchincruive, UK, KA6 5AE) which perform the analysis using a photometric assay (FA115, Non-Esterified Fatty Acids, Randox Laboratories Ltd, UK). SAA concentration was determined using a commercially available ELISA kit (SAA-11, Cow serum amyloid A ELISA, Life Diagnostic Inc., UK) as described by Glidden et al. (Reference Glidden, Beechler, Buss, Charleston, de Klerk-Lorist, Maree, Muller, Pérez-Martin, Scott, van Schalkwyk and Jolles2017). Full details of the procedure are available in the Supplementary Materials.
The Hp determination was performed as described by Eckersall et al. (Reference Eckersall, Duthie, Safi, Moffatt, Horadagoda, Doyle, Parton, Bennett and Fitzpatrick1999) with minor modifications (available in the online Supplementary File). VFA concentrations were determined using high-performance liquid chromatography by an external ISO 17025 accredited laboratory (Sciantec Analytical, Cawood, UK, YO8 3SD). The lab analyser used is an Agilent 7890B Gas Chromatography system (Agilent, Santa Clara, CA 95051, US) with a J&W HP-FFAP GC Column, 30 m, 0.53 mm, 1.00 μm, 5-inch cage (Part Number: 19095F-123E, Agilent, Santa Clara, CA 95051, US). The concentration of histamine in the ruminal fluid was obtained with a competitive ELISA kit (KA 1888 Histamine ELISA kit, Abnova, Tw) as described by Kim et al. (Reference Kim, Kim, Lee, Lee, Im, Kim, Lee and Son2015). Full details of the procedure are available in the online Supplementary File.
Continuous measurement of reticuloruminal motility
Reticuloruminal motility was measured using a prototype motion-sensitive bolus, as described by Hamilton et al. (Reference Hamilton, Davison, Tachtatzis, Andonovic, Michie, Ferguson, Somerville and Jonsson2019). Each bolus contained a 3-axis accelerometer with integrated data storage, sd card, real-time clock and a lithium battery with a battery life of approximately 30 d. All components were inserted into a cylindrical plastic bolus which was weighted to be at least 200 g to ensure that the device would rest on the floor of the reticulum. The amplitude of contractions and the inter-contraction periods were identified as previously described (Hamilton et al., Reference Hamilton, Davison, Tachtatzis, Andonovic, Michie, Ferguson, Somerville and Jonsson2019).
Continuous measurement of reticuloruminal pH
Reticuloruminal pH was measured every 10 min over the period 01-04-2017 to 08-06-2017 using wireless, indwelling remote sensors placed in the reticulum of the animals (smaXtec, Animal Care Gmbh, Graz, At). The sensors were initialized as described by the manufacturer. Briefly, the boluses were activated through contact with a magnet provided by the manufacturers. Following activation, boluses were submerged in buffer solution (pH 7.00) to calibrate them and inserted in the reticulum via rumen fistula. Boluses were retrieved at the end of the experiment, which is within the 90 d period in which the accuracy of pH measurement is higher (±0.2) according the manufacturer. There is no procedure for re-calibrating these devices post deployment. None of the devices showed any indication of electrode drifts as indicated by a persistent upwards or downwards trend in pH or any tendency to fixation.
Statistical analysis: reticuloruminal pH and motility
To ensure that we obtained data that reflected the dietary challenge rather than a post-adaptation period, we censored the data to include only those observations from the first 5 d after the introduction of each of the three treatments (CON, HSt and HSu). Motility readings were initially processed as described by Hamilton et al. (Reference Hamilton, Davison, Tachtatzis, Andonovic, Michie, Ferguson, Somerville and Jonsson2019) to generate a time series of values at 4′30″ intervals (270 s) for activity (representing the variance in the energy of the movement vector) and inter-contraction interval (period). To reduce the noise caused by extraneous movements of cattle, a night-only data-frame was established using observations recorded from 21 : 00 until 07 : 00. The pH data were analysed using the method described in Denwood et al. (Reference Denwood, Kleen, Jensen and Jonsson2018) to generate a list of predicted values for each animal according to a generalized additive model fitted with a single sine-wave. For each predicted value, the residual was calculated, and the absolute value of the residual was used for the subsequent analysis. pH data were also analysed using standard descriptive statistics to allow an easier comparison with previous research reports. The number of minutes for which pH <5.6 and pH <5.8, minimum, maximum and median values were obtained for each cow for each day. Finally, two samples from each of six animals on each of the diets were randomly taken from the pool of all pH values from between 16 : 00 and 17 : 00 as described by Jonsson et al. (Reference Jonsson, Kleen, Wallace, Andonovic, Michie, Farish, Mitchell, Duthie, Jensen and Denwood2019) and compared against the thresholds mentioned above. Linear mixed effect models (LME) were applied using LME4 package (Bates et al., Reference Bates, Maechler, Bolker and Walker2015) in R (R Core Team, 2018), in which animal ID was a random factor while treatment and time-points and their interactions were considered as fixed effects. The best model was selected in each case according to the lowest AIC (Akaike information criterion) and BIC (Bayesian information criterion).
Statistical analysis: health, haematological and biochemical parameters
Health data were obtained for each cow for every day of the experiment and data from the first 5 d of each challenge period were analysed in relation to pH and motility data. These data were count-based and therefore highly skewed, so were converted to a binary variable for each cow. These presence/absence indicators were then summarized as a 3 × 2 contingency table and analysed using Fisher's exact test to determine the overall effect of treatment group on each binary health indicator. For blood biochemical parameters (continuous observations), linear mixed effects models (LME) were applied using treatment and time point as fixed effects, and a random effect of animal ID to control for the repeated observations within animal. Shapiro−Wilk tests and visual appraisal were used to assess the distribution of the residuals for each biochemical parameter, and where these were found to be non-normal (therefore violating the assumption of the LME model) the respective data were log-transformed and re-analysed with subsequent re-assessment of normality using the same procedure. All statistical analyses were carried out using R (R Core Team, 2018), with LME models implemented using the lme4 package (Bates et al., Reference Bates, Maechler, Bolker and Walker2015).
Results
Feed intake and health parameter analysis
The high sugar diet was more likely to be partially or completely refused than the control diet (P < 0.001), and there was a tendency for the animals on the high starch diet to consume a lower proportion of concentrate than animals offered the control diet (P = 0.06). Both the HSt (P = 0.001) and HSu (P = 0.004) diets were more likely to be accompanied by diarrhoea compared with the CON diet and this was more likely to occur on the second and fifth day of the challenge (P < 0.001). There was no difference between the two challenge diets in the likelihood of diarrhoea (P > 0.05). Table S1 in the Supplementary Materials provides a summary of the effects of each of the treatments. None of the other health parameters differed by treatment or sequence day, probably because there were very few observations of abnormality. None of the pH indicators (daily median, daily mean absolute residual, min per day under pH 5.6 or 5.8) or motility indicators (amplitude, period) were significantly associated with the probability of refusal of concentrate or with diarrhoea (data not shown). Including pH or motility variables in the GLM (in which treatment was also included) did not substantively improve the model fit (data not shown).
Haematological and biochemical analysis
Table 2 shows the haematological, blood biochemical and ruminal biochemical data, with a summary of the effects of diets and time points. The HSt diet affected some of the inflammatory markers and some of the VFA. It significantly increased plasma SAA concentration, neutrophil count, ruminal iso-valerate and iso-butyrate concentrations, and it decreased lymphocyte count (all P < 0.05 or better). The HSt diet also caused non-significant numerical changes in ruminal propionate concentration (increased) and plasma NEFA concentration (decreased). The HSu diet significantly reduced albumin and total protein concentrations in plasma (P < 0.05). The mixed-effects model indicated that all of the VFA apart from iso-valerate increased at TP-2 (P < 0.05). The concentration of SAA in plasma and neutrophils both increased at TP-2 while lymphocytes decreased (all P < 0.01). At TP-2, there was a reduction in red blood cell count (P < 0.05) and a non-significant numerical reduction in PCV. The concentration of SAA and all of the VFA except for acetate were increased at TP-7 (P < 0.05). In contrast, monocytes, RBC and PCV decreased (all P < 0.01) whilst GGT showed a non-significant numerical decrease.
Table 2. Median values of haematology and biochemical analytes according to dietary treatment and time of sampling
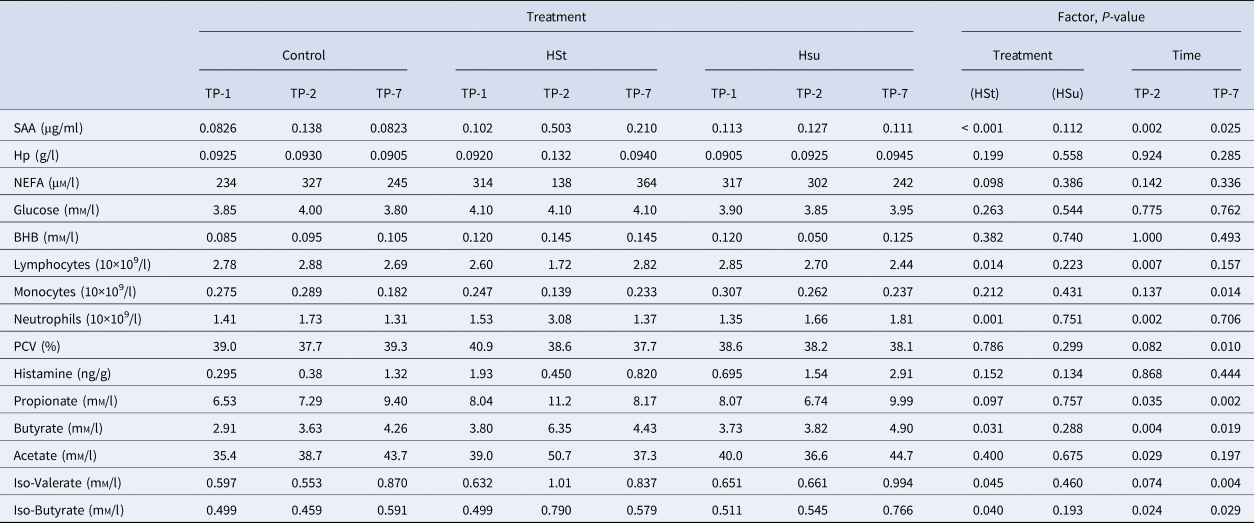
SAA, Serum amyloid A; Hp, Haptoglobin; NEFA, non-esterified fatty acid; PCV, Packed cell volume.
For each variable a P-value for the effects of diet (Control, High Starch (HSt), High Sugar (HSu), model reference = Control) and time-point (TP-1, TP-2, TP-7, model reference = TP-1) is also provided for the main effects of the relevant linear mixed effects model.
Reticuloruminal pH
The smaXtec devices generated 56 160 observations during the study period. The minimum recorded pH was 4.38, and maximum was 7.00. The effect of treatment, sequence day and hour of day on pH, residual pH, min/d under pH 5.6 and 5.8, were assessed using linear mixed effect models. Hour of day had strong effects on each variable (online Supplementary Figs S1 and S2). Both diets reduced median pH (−0.064 and −0.088 pH units for HSt and Hsu, respectively) but this was only significant (P < 0.05) for HSu. The pH was reduced overall on day 2, day 3 and day 4, with the strength of the effect decreasing from −0.16 to −0.084 pH units over that time. The number of min/d under pH 5.6 was significantly increased by the HSu treatment (P < 0.01) adding 108 min/d, whilst the numerical increase caused by HSt (adding 53.7 min/d) did not achieve statistical significance. The effect of day was not significant except for day 3, which was associated with an increase. The number of min/d with pH <5.8 was significantly increased by both treatments (P < 0.01, adding 131.3 and 201.7 min/d for HSt and Hsu respectively) and there was an effect of day with around 145 min/d additional; time on days 2 and 3 (P < 0.01). The data are shown in Fig. 1 and online Supplementary Table S2. Absolute mean residual pH was not affected by the sequence day but it was significantly affected by dietary treatment. Effect sizes were 0.083 for starch and 0.063 for sugar (both P < 0.001). In a simulation of the conventional diagnostic approach, using the method of Jonsson et al. (Reference Jonsson, Kleen, Wallace, Andonovic, Michie, Farish, Mitchell, Duthie, Jensen and Denwood2019), none of the samples obtained from cows fed CON diet fell below the thresholds of pH 5.8 or 5.6, but 7/12 animals on HSt diet and 4/12 animals on HSu diet fell below the higher threshold while 2/12 animals on HSt diet and 3/12 animals on HSu diet fell below the lower one (online Supplementary Table S3).
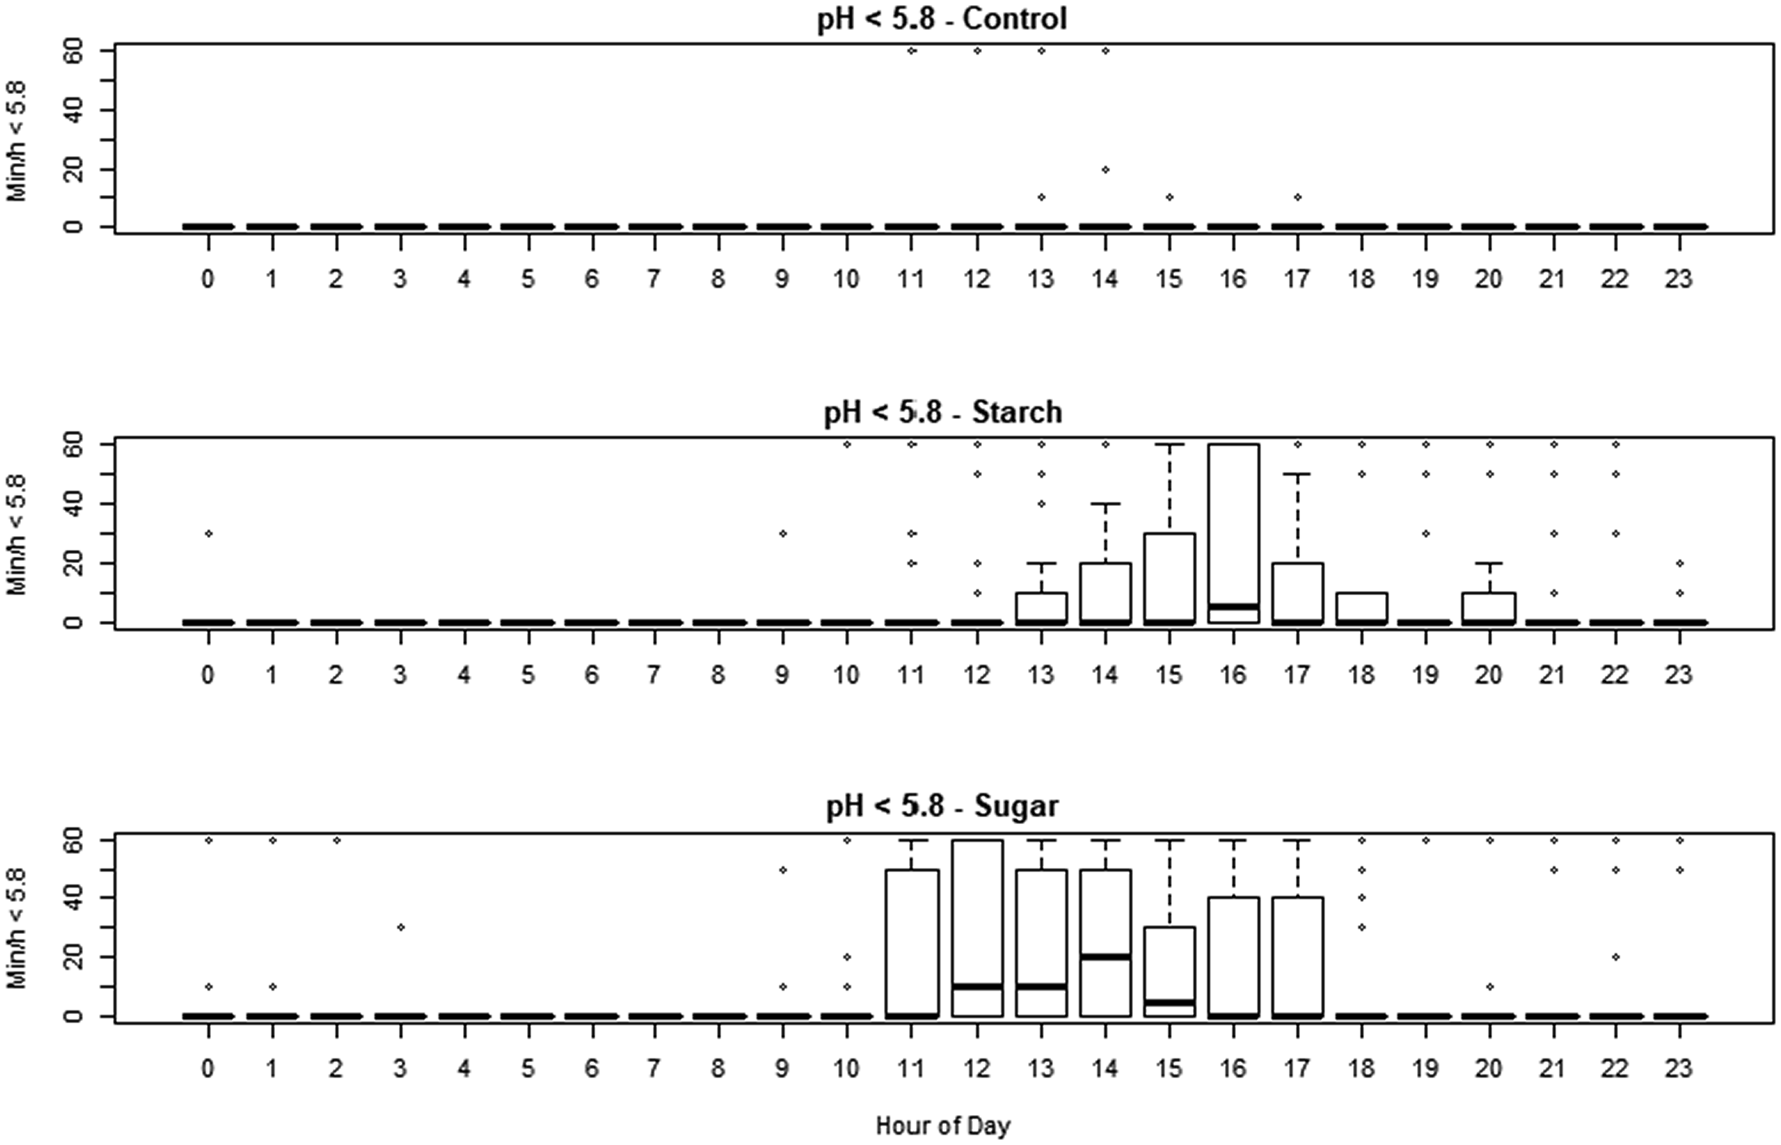
Fig. 1. Min/h when the pH was less than 5.8 in cows subjected to each of the treatments, for each hour of the day. Starch: high starch diet, HSt. Sugar: high sugar diet, Hsu.
Ruminal motility
Motility data were incomplete, with irregular intervals of apparent failure to generate a variance signal. This resulted in an unbalanced design that limited the potential for analysis of the effects of all factors. In total, 23 883 observations were recorded, with amplitude ranging from 0 to 0.0104 units and period ranging from 4 to 4,681 s and there were 1,028 observations with periods of >200 s. Filtering the data to include only those obtained between 09 : 00 pm and 07 : 00 am reduced the dataset to 7,607 observations (Control n = 2,961; HSt n = 2374; Hsu n = 3548) but reduced the coefficient of variation from 3.18 to 0.517%. A density plot of the reduced dataset is seen in Fig. 2. The amplitude of motility recordings was significantly increased in HSt (P < 0.01) but not in HSu. There was no improvement to the models by the inclusion of the sequence day. The period between presumed contractions was decreased by both treatments (−4.16 and −4.19 s for HSt and Hsu, respectively, P < 0.01). The inclusion of sequence day slightly improved the model for the period between movements (inter-contraction interval, period), but none of the time-points individually had a significant effect.
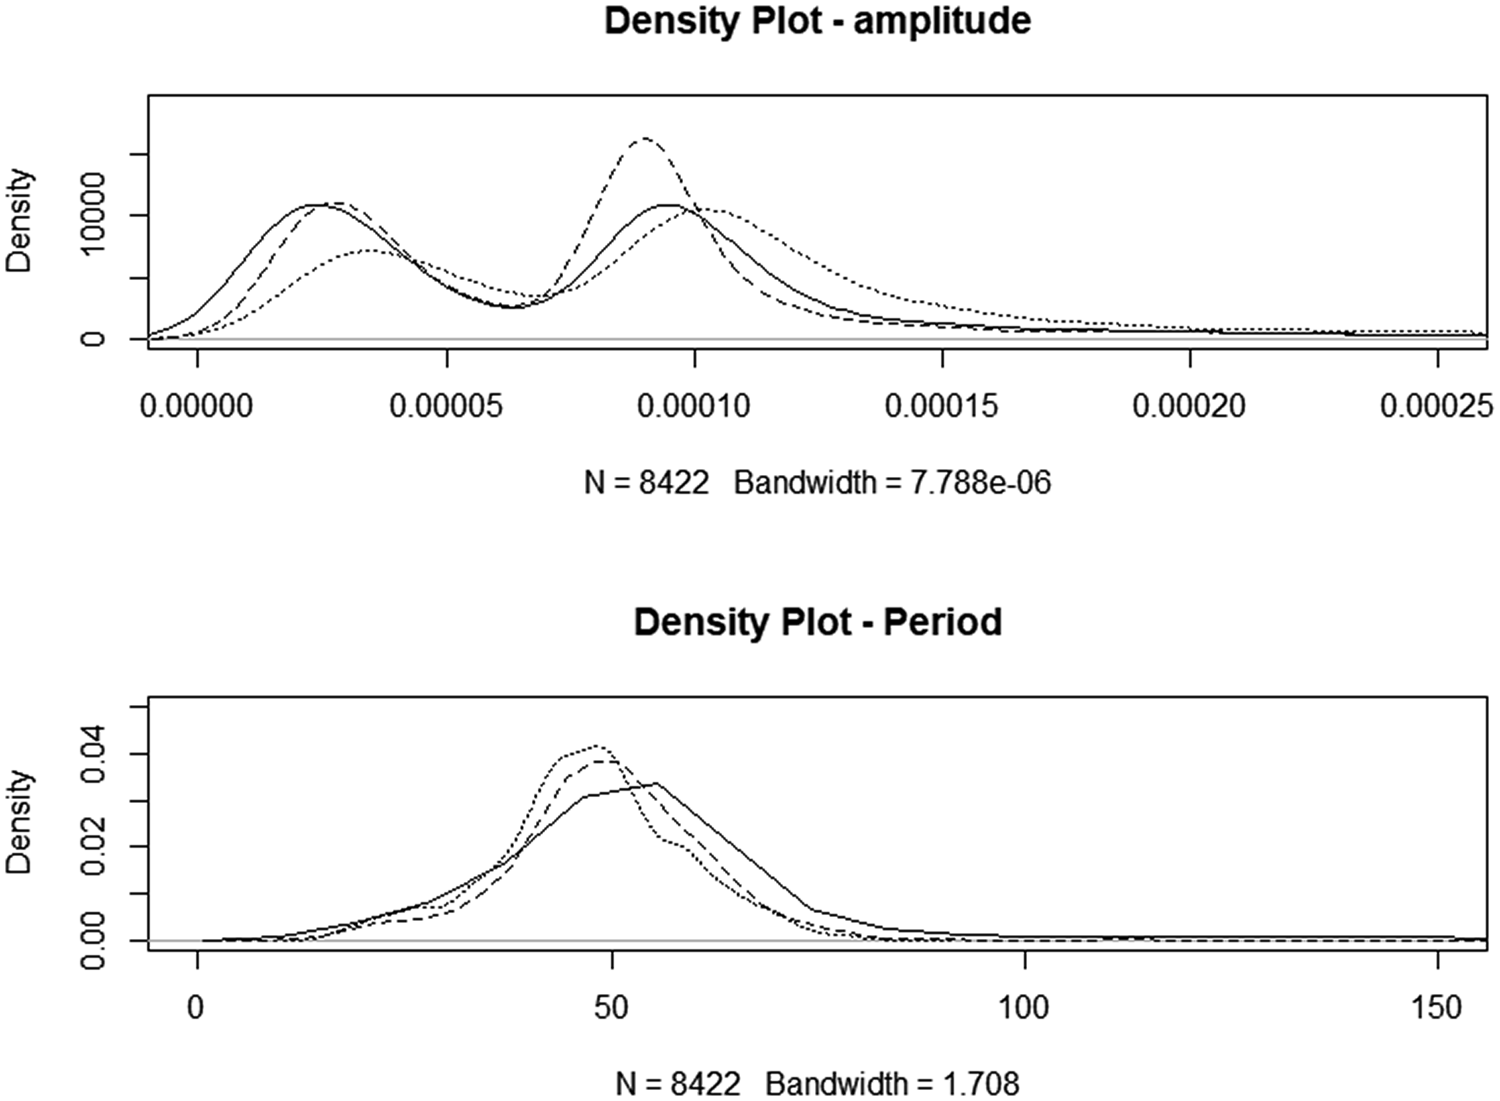
Fig. 2. Density plots for night-only motility. Solid line: CONTROL, dotted line: high starch diet, HSt, dashed line: high sugar diet, Hsu.
Discussion
SARA is a metabolic disorder characterized by repeated bouts of depressed ruminal pH (Gozho et al., Reference Gozho, Plaizier, Krause, Kennedy and Wittenberg2005). Different thresholds have been discussed in the past according to the technique used to sample rumen fluid and the rumen compartment where the samples were taken (Duffield et al., Reference Duffield, Plaizier, Fairfield, Bagg, Vessie, Dick, Wilson, Aramini and McBride2004; Neubauer et al., Reference Neubauer, Humer, Kröger, Braid, Wagner and Zebeli2018). We selected pH <5.6 for 180 min/d and pH <5.8 for 330 min/d as criteria to define SARA because both are widely reported in the literature. Applying these criteria, the conditions for SARA were never met on the control diet but, although the overall treatment mean values on any day did not exceed the thresholds, the conditions were met by several of the cows on the HSt diet on days 2–4, and by cows on the HSu diet on days 2–5. A commonly recommended clinical approach to determine whether SARA has occurred is the collection of ruminal fluid samples from 12 animals, of which three should have a pH below one or other of the commonly used thresholds discussed above in order to make a diagnosis in the herd (Garrett et al., Reference Garrett, Pereira, Nordlund, Armentano, Goodger and Oetzel1999). In a simulation of this sampling method, using reticuloruminal pH values selected and analysed as per Jonsson et al. (Reference Jonsson, Kleen, Wallace, Andonovic, Michie, Farish, Mitchell, Duthie, Jensen and Denwood2019), none of the samples obtained from cows fed the control diet fell below the thresholds during these periods whereas 7/12 animals (HSt) and 4/12 animals (HSu), and 2/12 animals (HSt) and 3/12 animals (HSu) fell below the thresholds of pH 5.8 and 5.6, respectively. We concluded that, taken together, these observations were consistent with a diagnosis of SARA and, therefore, we contend that the experimental challenge to induce SARA was effective.
A common model utilized to induce SARA is to reduce the forage:concentrate ratio, usually increasing the starch DM% in the ration, resulting in a rate of VFA production that exceeds the rate of VFA absorption or buffering of protons. Sugars are the carbohydrates that are most rapidly fermented in the rumen, hence it is logical to assume that increasing the inclusion rate of sugars in the diet should lead to a greater ruminal accumulation of VFA compared with starches (Lanzas et al., Reference Lanzas, Sniffen, Seo, Tedeschi and Fox2007). However, the inclusion of various sugars in the diet has not always led to reductions in ruminal pH values (Oba, Reference Oba2011). For instance, the inclusion of lactose up to 13% DM and sucrose up to 10% DM did not cause a statistically significant reduction in ruminal pH or increase in the period in which pH was below 5.8 (Broderick and Radloff, Reference Broderick and Radloff2004; DeFrain et al., Reference DeFrain, Hippen, Kalscheur and Schingoethe2004; Broderick et al., Reference Broderick, Luchini, Reynal, Varga and Ishler2008; Chibisa et al., Reference Chibisa, Gorka, Penner, Berthiaume and Mutsvangwa2015). In our study we compared the effect of two different, iso-energetic and iso-nitrogenous SARA-inducing diets. Forage:concentrate ratio was 50 : 50 for both diets, starch and sugar content were 30 and 2% in the HSt diet and 18 and 12.5% in the HSu diet (DM basis). The HSu diet resulted in a longer time in which the reticuloruminal pH fell below thresholds, on average, 212 min/d below 5.8 and 115 min/d below 5.6 compared with 141.5 min/d below pH 5.8 and 60 min/d below pH 5.6 on the HSt diet. It is possible to hypothesize that, while some of the starch may have bypassed the rumen fermentation, the whole of the sugar supplementation has probably been fermented in the reticulorumen, leading to a deeper and more sustained reduction in reticuloruminal pH. The slower fermentation rate of the starch may also partially explain these findings. Delaying the fermentation over time may have led to the longer persistence of VFA in the ruminal fluid registered without causing persistence of ruminal pH below the threshold.
The potential inflammatory effects of diet were assessed using haematology and plasma concentrations of SAA and Hp. The HSt diet caused an increase in SAA concentrations in plasma ranging from 0.01 to 0.58 μg/ml, whereas the HSu diet had no significant effect. This result appears to be mild in comparison with previous reports. For instance, SAA increased up to 170, 430 and 498 μg/ml in three experiments (Gozho et al., Reference Gozho, Plaizier, Krause, Kennedy and Wittenberg2005, Reference Gozho, Krause and Plaizier2007; Khafipour et al., Reference Khafipour, Krause and Plaizier2009a). Horadagoda et al. (Reference Horadagoda, Knox, Gibbs, Reid, Horadagoda, Edwards and Eckersall1999) suggested that plasma concentrations <8.8 mg/l should be considered to be within the reference range for SAA. However, despite the relatively low values, the increase we observed was associated with a significant increase in the count of circulating neutrophils and a concomitant decrease in the count of circulating lymphocytes. Neither diet caused a detectable increase in plasma Hp concentration, which might be due to the lower sensitivity of Hp in detecting inflammatory process (Horadagoda et al., Reference Horadagoda, Knox, Gibbs, Reid, Horadagoda, Edwards and Eckersall1999). Collectively, these observations are consistent with the presence of a mild, acute inflammatory response triggered by the HSt diet. In contrast, CON and HSu diets did not have any detectable effect on any of the inflammatory markers, despite the severe changes in pH registered with the latter.
According to our knowledge, this is the first time that the inflammatory response subsequent to a high sugar challenge has been characterized and compared with the response that follows a high starch challenge. We cannot state what component of the starch diet triggered inflammation but, because no difference in reticuloruminal histamine concentration was attributable to diet, LPS might be implicated. However, high barley diets have been shown to increase the ruminal concentration of a variety of bioactive compounds such as putrescine, methylamines, N-nitrosodimethylamine and ethanolamine that might initiate the inflammatory process (Saleem et al., Reference Saleem, Ametaj, Bouatra, Mandal, Zebeli, Dunn and Wishart2012). Although such an interaction between rumen milieu and diet component has not been characterized yet for molasses, several bioactive molecules have been identified in the raw product (Ali et al., Reference Ali, El Gedaily, Mocan, Farag and El-Seedi2019), and it is well recognized that, under conditions of relative abundance of carbohydrate, amino-acids may be decarboxylated rather than deaminated, generating biogenic amines (Sanford, Reference Sanford1963; Wang et al., Reference Wang, Zhang, Zhu and Mao2013). Previously, it has been demonstrated that low ruminal pH and increased ruminal concentrations of LPS are not sufficient conditions to cause inflammation, but it is necessary for LPS to first translocate into the bloodstream (Khafipour et al., Reference Khafipour, Krause and Plaizier2009a, Reference Khafipour, Krause and Plaizier2009b). The translocation site is still a matter of debate as it has been hypothesized that the stratified ruminal epithelium might be less susceptible than, for instance, large intestinal monolayer epithelium to acidic pH (Graham and Simmons, Reference Graham and Simmons2005; Plaizier et al., Reference Plaizier, Danesh Mesgaran, Derakhshani, Golder, Khafipour, Kleen, Lean, Loor, Penner and Zebeli2018). Therefore, which xenobiotics, or combination of xenobiotics, activate the inflammatory response and in which site of the digestive tract the xenobiotic absorption happens, remains to be elucidated.
Ruminal motility is under the control of both extrinsic and intrinsic pathways (Constable et al., Reference Constable, Hoffsis and Rings1990). Extrinsic innervation consists of the gastric centre, located in the medulla oblongata, the vagus nerve, which connects the forestomach with the gastric centre and provides parasympathetic control, and splanchnic nerves originating from the thoracolumbar segment, which provide sympathetic, mainly inhibitory, inputs. The gastric centre does not have a spontaneous rhythm. In order to periodically originate a depolarization wave it is, therefore, dependent upon excitatory afferent inputs (Leek, Reference Leek1969). Excitatory signals are generated by mechanoreceptors located in the oral mucosa, low threshold tension receptors most densely located in the medial wall of the reticulum and chemical receptors that perceive acidification of abomasal content (Leek, Reference Leek1969; Gregory, Reference Gregory1987). All these receptors stimulate the gastric centre which, in turn, enhances strength and rhythm of reticulorumen contraction via vagal nerves. In contrast, pain and pyrexia, high threshold tension receptors and acid-sensitive receptors in the reticulum as well as tension receptors in the abomasum all downregulate the gastric centre and, hence, reticuloruminal contraction (Constable et al., Reference Constable, Hoffsis and Rings1990). Motility of the forestomach has been investigated in the past to describe pathophysiological changes that occur following acute lactic acidosis. However, to our knowledge, this is the first time that this concept has been applied to SARA diagnosis and in which motility has been monitored over a period of several days. In this study, we continuously monitored ruminal contraction, inter-contraction period and variance in the amplitude of the contraction with a prototype motion-sensitive bolus which contained a three axis accelerometer configured to sample the, X, Y and Z acceleration at 12.5 Hz. The amplitude of presumptive reticuloruminal contractions was highest and most variable during daytime and lowest and most consistent during the night. The period of the presumptive reticuloruminal contractions followed the inverse pattern, being shorter during the day. These effects are most likely the result of an overall higher activity level of animals during the day as well as the fact that, during the challenge weeks, the eating period was confined to the daytime. Stronger and faster reticular contractions are stimulated by eating while contraction rate decrease during rumination period (Sellers and Stevens, Reference Sellers and Stevens1966). The main focus in the past has been to identify clinical parameters that abolish rumen function. For instance, Crichlow and Chaplin (Reference Crichlow and Chaplin1985) caused an acute grain overload in fistulated sheep placing ground wheat (40 g/kg BW) and water in a 50 : 50 ratio through the rumen cannula. They monitored ruminal contraction amplitude and frequency every 2 for 12 h after the engorgement (i.e. when all the nine animals developed rumen stasis). At the first check, 2 h after the engorgement, amplitude and frequency increased in all the animals but decreased in the following 10 h until the complete abolition of reticulorumen motility. In our study, we summarized the effect on contraction amplitude over 7 d and we found that HSt but not HSu diet increased the amplitude of rumen contraction. HSt diet led to a more persistent increase of VFA in the rumen (i.e. VFA detected 24 h after feed delivery), and it might be hypothesized that VFA might exert not just an inhibitory but, to a certain extent, also an excitatory effect on the gastric centre. The period between movements was decreased by both diets and this seems to reinforce the hypothesis that the gastric centre has different circuits that control rate and amplitude of the contraction (Gregory, Reference Gregory1987). Further studies to monitor reticuloruminal contractions in the long term are necessary to characterize the normal diurnal pattern of reticulorumen contraction, influence of diet types and how well the results are related to overall cow health status.
Based on the work of Denwood et al. (Reference Denwood, Kleen, Jensen and Jonsson2018), we hypothesized that the absolute mean residual of pH, after fitting a model that accounted for an individual animal's diurnal rhythm and median pH, would be closely related with an animals' health status. However, only feed refusal data were suitable for analysis and only dietary treatment had any significant effect on refusal of feed. This is suggestive that reticuloruminal pH is not so much a cause of inappetence arising from the HSu diet but an associated clinical finding.
In conclusion, diets with similar levels of rapidly fermentable carbohydrate but including divergent concentrations of starch and sugar resulted in distinct effects on indicators of inflammation and on feed refusal, despite the fact that ruminal pH dynamics were quite similar. A prototype of indwelling reticular motility bolus was tested as a diagnostic tool for general cow health and SARA with encouraging results although a better characterization of the diurnal normal pattern is necessary before it can be used for clinical or research purposes.
Supplementary material
The supplementary material for this article can be found at https://doi.org/10.1017/S002202992000031X.
Acknowledgements
The authors would like to thank Dr H. Ferguson for her assistance with the laboratory work. The work was partially funded by the Biotechnology and Biological Research Council, UK (Industrial Partnership Award BB/J016373/1, BB/J016608/1 and BB/J018120/1).


 Open access