


Abstract
To investigate hydrostatic pressure and temperature effects on electron energy levels of an InAs spherical segment quantum dot with wetting layer embedded in GaAs barrier, we use the finite element method to solve the Schrödinger equation in the effective mass approximation. Results show that the ground, the first and the second excited state energies decrease (increase) as the hydrostatic pressure (temperature) increases for the constant temperature (pressure). Moreover, given the optical properties of the system interacting with two laser fields, red (blue) shifts are observed in the linear and nonlinear absorptions and dispersions for the probe pulse as the hydrostatic pressure (temperature) increases. Furthermore, as the hydrostatic pressure increases, the maximum of the group velocity of light inside the slow light frequency range increases and the slow light frequency range shifts to the lower probe frequencies.
Export citation and abstract BibTeX RIS
1. Introduction
Nanostructures like quantum wells, wires and dots have been one of the important subjects for research groups in recent years. Quantum dots (QDs) with three-dimensional confinement of carriers have interesting applications such as QD lasers [1, 2], QD solar cells [3, 4], QD photodetectors [5, 6] and biomedical applications [7]. Researchers have investigated the electronic structure and optical properties of QD systems. QDs with various shapes were observed. One of the shapes was spherical segment QD (SSQD) reported by Leonard et al in experimental results [8]. We studied the electronic structure and the optical properties of SSQD/wetting layer (WL) with and without hydrogenic donor impurity [9]. Electron and heavy hole energy levels of two vertically coupled SSQDs/WLs were calculated [10]. On the other hand, temperature and hydrostatic pressure affect the energy levels and consequently the optical properties of the QD systems. The temperature and the hydrostatic pressure effects were investigated extensively: hydrostatic pressure and temperature effects on the electronic energy levels of a spherical QD placed at the center of a nano-wire [11]; pressure-dependent photoluminescence of CdSe/ZnS QDs; critical point of different pressure regimes [12]; simultaneous effects of hydrostatic pressure, temperature and electric field on optical absorption in InAs/GaAs lens shape QD [13]; simultaneous influence of hydrostatic pressure and temperature on the binding energy of impurity-doped QDs in the presence of noise [14]; temperature and hydrostatic pressure effects on single dopant states in hollow cylindrical core–shell QD [15]; the effects of polaronic mass and conduction band non-parabolicity on a donor-binding energy under the simultaneous effect of pressure and temperature basing on the numerical FEM in a spherical QD [16]; combined influence of hydrostatic pressure and temperature on interband emission energy of impurity doped QDs in the presence of noise [17]; modulating optical rectification; second and third harmonic generation of doped QDs; interplay between hydrostatic pressure, temperature and noise [18]; the effects of temperature, hydrostatic pressure and size on optical gain for GaAs spherical QD laser with hydrogen impurity [19]; pressure dependent optical properties of QD with spin orbit interaction and magnetic field [20]. In this paper, we investigate the temperature and the hydrostatic pressure effects on electronic structure and optical properties of the SSQD/WL interacting with two laser fields. The novelty of this work lies in the different shape of the QD as a spherical segment. As mentioned above, this shape was monitored by Leonard et al using atomic force microscopy for self-assembled InAs dots on GaAs. They observed from atomic force microscopy data that QD was similar to a spherical segment [8]. Group velocity of light in quantum well [21] and QD systems [22–24] were studied, so we investigate the group velocity of probe pulse in the SSQD/WL system.
In this article, hydrostatic pressure and temperature effects on electron energy levels of SSQD/WL were investigated. We used the finite element method to solve the Schrödinger equation in the effective mass approximation (section 2). In section 3, matrix elements of dipole moment were calculated numerically, then the influence of hydrostatic pressure and temperature on optical properties of the system interacting with two laser fields was studied. Furthermore, group velocity of the probe pulse in the system was calculated. Section 4 shows the results of this work: the electronic structure changes of the system for different values of hydrostatic pressure (temperature) at constant temperature (hydrostatic pressure), linear and nonlinear absorptions and dispersions of probe pulse for different values of hydrostatic pressure (temperature) at fixed temperature (hydrostatic pressure), control Rabi frequency, control field detuning and hydrostatic pressure dependence of group velocity of probe pulse. Conclusions are explained in section 5.
2. Influence of hydrostatic pressure and temperature on electronic structure
In this paper, an InAs SSQD with a WL embedded in a GaAs barrier is considered. The spherical segment is chosen because this shape was observed by Leonard et al experimentally. From atomic force microscopy data, the QD was found to be similar to a spherical segment (an object of similar shape formed by the intersection of a sphere and a plane) [8]. The base radius (R = 10 nm) and height (h = 5 nm) of SSQD are the same as in our previous paper [9]. These values were observed experimentally in [8]. The wetting layer height is 2 nm. This system is shown in figure 1.
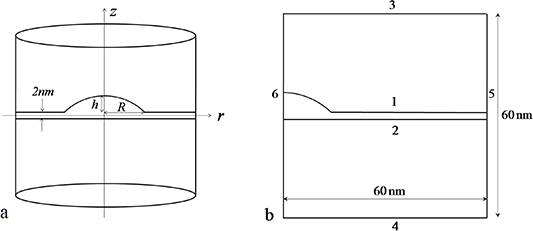
Figure 1. (a) An InAs SSQD with WL embedded in a GaAs barrier. (b) The simulation region and numerical boundaries.
Download figure:
Standard image High-resolution imageThe electronic levels of this system were obtained in our previous paper [9]. In this paper we investigate the influence of hydrostatic pressure and temperature on these levels. As we can see in reference [11], applying the hydrostatic pressure causes changes in the size of QDs. The fractional change in volume V for InAs QD under hydrostatic pressure P is obtained by [25]:
where  and
and  are the compliance constants.
The energy gap  depends on both hydrostatic pressure P and temperature T according to [11, 26]:
where  is the energy gap at P = 0 and T = 0,
  is the pressure coefficient,
  and
and  are the temperature coefficients.
Also, the hydrostatic pressure P and temperature T can change the confining potential as [11, 27]:

 is the conduction band off-set parameter that is taken to be 0.6. This value was determined by Brubach et al experimentally [28].
The electron effective mass changes under hydrostatic pressure P and temperature T are given by [11, 29]:
where  is the gap energy given by equation (2),
  is the spin-orbit splitting,
  is the free electron mass and
  are the Luttinger parameters.
  is the interband momentum matrix element between conduction and valence bands.
To calculate the electronic structure of the system for different values of hydrostatic pressure and temperature, we solved the Schrödinger equation in the effective mass approximation for an electron confined to SSQD/WL:
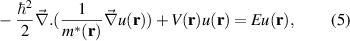
where  is Planck's constant divided by
  ,
,  is the position-dependent electron effective mass and
  is the position-dependent confining potential.
  and
and  are the energy eigenvalue and eigenfunction of the system, respectively. Using equations (2)–(4), the electron effective masses and the confining potentials were obtained. The parameters used in the calculations were the same as reference [30] (table 1).
Table 1. Values of the parameters used in the calculation of the electron effective masses and the confining potentials.
| InAs | GaAs | |
|---|---|---|
 |
0.533 |
1.519 |
 |
7.7 |
10.8 |
 |
2.76 | 5.405 |
 |
83 | 204 |
 |
19 | 12.9 |
 |
380 | 341 |
aIndicates that the tension effect is taken into account [30].
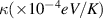
Because of azimuthal symmetry, we rewrite equation (5) in cylindrical coordinates. This equation is azimuthally separable, so we assume  (
( is the normalization constant). Equation (5) can be written as:
It is necessary for the azimuthal part to be single valued because of the full azimuthal range  , so
, so  is an integer (
 ).
).
To calculate the electronic structure of the system, we solved equation (6) numerically. The finite element method was used. The simulation region ( ) and numerical boundaries are indicated in figure 1(b). To solve the equation, we used some boundary conditions: For boundaries 1 and 2 between InAs SSQD/WL and GaAs barrier, the following boundary conditions were used [31]:
where  is the outer normal vector. For outer boundaries 3 and 4, the condition
  and for boundary 5, the condition
  were satisfied. The boundary condition for 6 depends on
  value. For
  , the condition
  was used to prevent the divergence of the term
  at
at  (equation (6)). However, for
  , this term vanishes, so the condition
  was satisfied. The simulation region was divided into triangle elements.
3. Effect of hydrostatic pressure and temperature on optical properties
The optical properties of SSQD/WL interacting with two laser fields were studied in our previous paper [9]. In this paper, we are going to investigate the influence of hydrostatic pressure and temperature on the optical properties of SSQD/WL. To this goal, the three lowest energy levels of the system were considered and the matrix elements of the dipole moment  were calculated numerically.
  is the eigenfunction of the ith subband calculated in this paper for different values of hydrostatic pressure and temperature. e is the electronic charge and transitions between two subbands in the conduction band are induced by electromagnetic fields polarized along the x-direction. Given the calculated dipole moments, the configuration of these three levels is the cascade type as shown in figure 2 (
 and
and  are electric dipole-allowed transitions;
  is electric dipole-forbidden transition).

Figure 2. The cascade type of SSQD/WL.
Download figure:
Standard image High-resolution imageSSQD/WL system interacts with two laser fields propagating along z-direction. The transition  is driven by weak, pulsed probe field (with frequency
  ) and the transition
  is driven by strong continuous-wave control field (with frequency
  ). Applied electric field to the system is given by:

 ,
,  are the slowly varying envelopes and
  ,
,  are the wave vectors of probe and control fields, respectively.
The Hamiltonian of the system in the interaction picture is [32]:
using the rotating-wave and the electric-dipole approximations.  and
and  are the probe and the control field detunings from frequencies
  and
and  , respectively (
 and
and  are, respectively, the frequencies of the transitions
  and
and  ).
).  and
and  are the Rabi frequencies for the transitions
  and
and  (
( and
and  are the matrix elements of the dipole moment). Using the time-dependent Schrödinger equation and the induced polarization at the probe frequency, the linear and third-order nonlinear susceptibilities for the probe pulse are obtained as [9]:
where N is the electron density,  is the decay rate of the subband
  and
and  . The absorption and dispersion are proportional to
  and
and  [33], so the linear absorption and dispersion for the probe pulse are proportional to [9]:
The third-order nonlinear absorption and dispersion for the probe pulse are proportional to [9]:

Here two laser fields are applied to the SSQD/WL system and electromagnetically induced transparency (EIT) phenomenon occurs. When EIT happens, quantum interference induced by a control field makes an opaque medium transparent for a resonant probe field. The other result is a decrease in the group velocity of the probe pulse (slow light) [22, 34]. The linear refractive index of the system is related to susceptibility by  [35]. The group velocity of the probe pulse in the system can be written as [34]:
4. Numerical results and discussion
We calculated the electron energy levels of the SSQD/WL system for different values of hydrostatic pressure and temperature. For each hydrostatic pressure and temperature, the size of SSQD/WL, the electron effective masses in InAs and GaAs and the confining potential were determined according to equations (1)–(4) and table 1. The size of SSQD/WL decreases, and the electron effective masses and the confining potential increase as the hydrostatic pressure increases. Depicting the ground, the first and the second excited state energies of the QHD/WL system as a function of hydrostatic pressure for different values of temperature (T= 10 100 200 300 K), figure 3 shows that at a constant temperature all the three lowest level energies decrease as the hydrostatic pressure increases, although the dot size decreases, and the confining potential increases. This result is in line with [30].

Figure 3. (a) Ground, (b) first and (c) second excited state energies of SSQD/WL as a function of pressure at T = 10, 100, 200, 300 K.
Download figure:
Standard image High-resolution imageFigure 4 shows the three lowest energy levels of the QHD/WL as a function of temperature for different values of hydrostatic pressure (P = 2,3,4 GPa). It can be seen that, for a constant pressure, the energy of the ground, the first and the second excited states increases as the temperature increases.
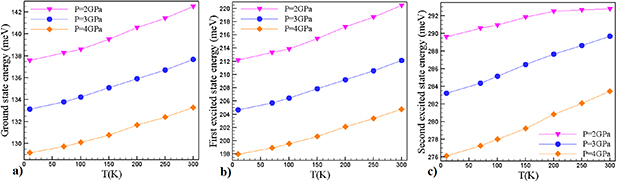
Figure 4. (a) Ground, (b) first and (c) second excited state energies of SSQD/WL as a function of temperature at P = 2,3,4 GPa.
Download figure:
Standard image High-resolution imageNext the optical properties of the system were calculated using equations (12)–(15) and  [36],
[36],  ,
,  , numerically. Figure 5 shows the linear and the nonlinear absorptions and dispersions for the probe pulse as a function of the probe frequency
  for different values of hydrostatic pressure P = 0,2,4,10 GPa at the constant temperature T = 300 K (the decay rates depend on the temperature, so
  [37]). Red shifts are observed in the linear and the third-order nonlinear absorptions and dispersions of figure 5 for the constant temperature, as the hydrostatic pressure increases due to a decrease in the transition energy. Furthermore, the dipole moment
  decreases as the hydrostatic pressure increases, which decreases the linear and the nonlinear absorptions and dispersions.

Figure 5. Linear (a) absorption (b) dispersion and the third-order nonlinear (c) absorption (d) dispersion of the probe pulse as a function of the probe frequency  for hydrostatic pressures P = 0, 2, 4, 10 GPa at the constant temperature T = 300 K. Solid, dashed, dot-dashed and dotted lines represent the optical properties for pressures 0, 2, 4 and 10 GPa, respectively.
Download figure:
Standard image High-resolution imageThe linear and the third-order nonlinear absorptions and dispersions for the probe pulse are shown in figure 6 as a function of the probe frequency  for different temperatures T = 70 100 150 K for the constant hydrostatic pressure P = 1 GPa. We determined
  and
and  from [37] (decay rates depend on temperature strongly) and
  . Figure 6 shows that, for the constant pressure, the linear and the third-order nonlinear absorptions and dispersions for the probe pulse represent blue shifts as the temperature increases because of an increase in the transition energy. Moreover, the linear and the third-order nonlinear absorptions and dispersions decrease as the temperature increases.

Figure 6. Linear (a) absorption (b) dispersion and the third-order nonlinear (c) absorption (d) dispersion of the probe pulse as a function of the probe frequency  for temperatures T = 70,100,150 K and the constant hydrostatic pressure P = 1 GPa. Solid, dashed and dot-dashed lines represent the optical properties for temperatures 70, 100, 150 K, respectively (the nonlinear absorptions and dispersions at temperatures 100 K and 150 K are multiplied by 10 and 100, respectively).
Download figure:
Standard image High-resolution imageIt is seen in figures 5(a) and 6(a) that when the control field is applied, the linear absorption breaks into two peaks because the excited level of the SSQD/WL splits into two levels. The probe pulse induces transitions to the two aforementioned energy levels. The quantum interference between the two aforementioned transitions results in the transparency for the probe pulse. Therefore, the linear absorption for the probe pulse becomes very small near its resonant frequency (without the control field, the linear absorption profile has a single peak at the transition frequency; hence, the probe pulse with frequency near the transition frequency of the system is largely absorbed). Also the linear dispersion (figures 5(b) and 6(b)) shows that applying the control field results in changing the system to a normal dispersion regime. The group velocity of the probe pulse becomes lower than the light velocity because the slope of the linear dispersion at transparency window is positive in equation (16).
Then the group velocity of the probe pulse in the SSQD/WL system was investigated. Figure 7 shows the group velocity of the probe pulse as a function of the probe frequency  for different values of the one-half control Rabi frequency
  at temperature T = 150 K and hydrostatic pressure P = 1 GPa. The other parameters are:
  [37] and
  . As can be seen in figure 7 when the control field is turned off, the group velocity of the probe pulse in the system becomes minimum at resonant frequency (note that the probe pulse with this frequency is absorbed). When the control field is applied, the group velocity of the probe pulse increases at the resonant frequency and two minimums appear around the resonant frequency. The frequency range between these two group velocity minimums is known as the slow light frequency range. The slow light frequency range increases as the control Rabi frequency (or control field intensity) increases. Also, the maximum of the group velocity inside the slow light frequency range increases as the control Rabi frequency increases. These results are in line with reference [22].
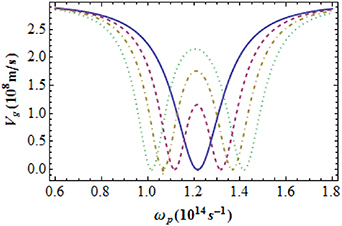
Figure 7. Group velocity of the probe pulse as a function of the probe frequency  at T = 150 K and P = 1 GPa for different values of the control Rabi frequency
  . Solid, dashed, dot-dashed and dotted lines represent the group velocities for control Rabi frequencies 0,
  ,
,  and
and  , respectively.
Download figure:
Standard image High-resolution imageThe group velocity of the probe pulse in the system as a function of the probe frequency  for different hydrostatic pressures P = 0,1,3,10 GPa at the temperature T = 150 K is plotted in figure 8, where
  and
and  were used for plotting. As the hydrostatic pressure increases, an increase in the maximum of the group velocity inside the slow light frequency range is observed. Furthermore, two minimums of the group velocity and consequently the slow light frequency range shift to the lower probe frequencies because the transition frequency decreases.
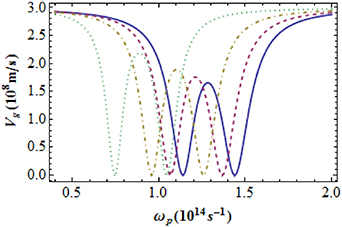
Figure 8. Group velocity of the probe pulse as a function of the probe frequency  at T = 150 K for different values of hydrostatic pressure P. Solid, dashed, dot-dashed and dotted lines represent the group velocities for hydrostatic pressures 0, 1, 3, 10 GPa, respectively.
Download figure:
Standard image High-resolution imageFigure 9 represents the group velocity of the probe pulse as a function of the probe frequency  at temperature T = 150 K and hydrostatic pressure P = 1 GPa for different values of the control field detuning
  . The one-half control Rabi frequency is
  . As
. As  increases, the slow light frequency range widens, and two minimums of the group velocity shift towards the lower (larger) probe frequencies for
  (
( ).
).

Figure 9. Group velocity of the probe pulse as a function of the probe frequency  at T = 150 K and hydrostatic pressure P = 1 GPa for different values of the control field detuning
  . Solid, dashed and dot-dashed lines represent the group velocities for control field detunings (a) 0,
  and
and  (b) 0,
  and
and  , respectively.
Download figure:
Standard image High-resolution image
5. Conclusion
In summary, an InAs SSQD/WL embedded in GaAs barrier was considered. First, we calculated the electron energy levels of the system for different values of hydrostatic pressure and temperature. To this end, we used the finite element method to solve the Schrödinger equation in the effective mass approximation numerically. Results show that the ground, the first and the second excited state energies decrease (increase) as the hydrostatic pressure (temperature) increases for the constant temperature (pressure). Then, the optical properties of the system interacting with two laser fields were investigated. According to the results, the linear and the third-order nonlinear absorptions and dispersions for the probe pulse exhibit red shifts as the hydrostatic pressure increases at the constant temperature. Furthermore, the linear and the third-order nonlinear absorptions and dispersions for the probe pulse represent blue shifts as the temperature increases for the constant pressure. Finally, the group velocity of the probe pulse in the system was studied. Results show that as the control Rabi frequency increases, the slow light frequency range and the maximum of the group velocity inside that increase. Increasing the hydrostatic pressure increases the maximum of the group velocity inside the slow light frequency range and shifts the slow light frequency range to the lower probe frequencies. As the absolute value of the control field detuning increases, the slow light frequency range widens and two minimums of the group velocity shift towards the lower (larger) probe frequencies for positive (negative) control field detunings.