
Abstract
One of the advantages of mesh-based geometric morphometrics (GM) over landmark-based approaches, is that it affords the possibility of the precise examination of highly irregular shapes and complex topographic surfaces. In the case of spherical-harmonic-based GM, the main prerequisite is a completely closed mesh surface, which is often lacking, particularly when dealing with natural objects. Here we present a methodology to prepare 3D segmentations with large cavity openings for spherical-harmonics-based GM analysis. This will be exemplified by a case study of hermit crab (Paguroidea, Decapoda, and Crustacea) claws. The joint openings of the claws—between manus and ‘movable finger’ (dactylus)—typify the problem of the large cavity opening. We described a methodology, including an ambient-occlusion-based segmentation algorithm, which leads to precise results and thereby enables the study of inter- and intraspecific differences in the shape of hermit crab claws. Analysis showed a statistically significant separation between all examined diogenid and pagurid claws, whereas separation observed between all left and right claws was not significant. Additionally, the procedure offers other benefits: it is easy to reproduce and causes little variance in the data, closures integrate smoothly into the overall structures and the algorithm saves a significant amount of time.
Introduction
Paguroidea
Hermit crabs (Paguroidea, numbering over 1100 species) represent one of the most fascinating and successful taxa within the decapod crustaceans (Decapoda). Phylogenetically, king crabs (Lithodoidea) and the terrestrial Coenobitidae, e.g. the coconut crab (Birgus latro), also belong to the Paguroidea. The groups’ most conspicuous anatomical feature is the soft-shelled pleon, which is hidden within a snail shell in most of the species. No less interesting are the first walking legs, which are formed as chelipeds and can reach astonishing size in relation to body length. There are hermit crabs with a prominent right claw (or chela) (Paguridae and Lithodoidea) and some with a prominent left claw (Diogenidae and Coenobitidae). However, some species display no discrepancy in claw size (Pylochelidae and some Diogenidae). The claws are used for a variety of tasks (e.g. biological roles); most commonly for food manipulation, but also as weapons to fight potential predators or other threats, and for shell closure. Depending on the taxon, closure of the shell can be effected by the right, the left, or both chelipeds. For food consumption, the overall shape of the claw(s) is apparently less relevant than the cutting edge between the immovable and movable finger (propodus and dactylus, respectively). The dentition of the cutting edges has some characteristics which apparently resemble different types of pliers (Schäfer 1954). Since handedness within paguroidean taxa is genetically fixed and, therefore, serves as phylogenetic feature, the comparison of claw shape is very meaningful, especially between left- and right-handed taxa.
Geometric morphometrics
Modern geometric morphometrics offer a meaningful way of identifying and quantifying variations in the shape of structures (Mitteroecker and Gunz 2009; Schultz et al. 2017) and, thus, constitute a first step in the detailed examination of a form-function complex (e.g. crab claws). In contrast to classic morphometrics, carrying out a superimposition, the Procrustes Fit, standardizes the size, position, and the orientation of structures (morphemes sensu Richter and Wirkner 2014). This is usually done with the help of Generalized Procrustes Analyses (GPA) (Gower 1975) and allows a purely shape-dependent statistical analysis (Hammer and Harper 2006; Zelditch et al. 2012). Prior to the analysis, points have to be chosen, which are homologous and recognizable in all structures that are to be examined—the so-called landmarks (Bookstein 1991, 1997). Landmark-based approaches are successful for many cases in GM but are restricted to one decisive factor: the replicability of points in all investigated structures. For objects lacking these points—such as spherical or rounded structures, e.g. claws—this becomes a problem.
To capture the morphologic features of spherical and rounded structures, semi-landmarks can be used. These constitute a set of points on homologous curves or surfaces with positions along the object that cannot be exactly determined as true landmarks (Mitteroecker and Gunz 2009). By applying the sliding landmark algorithm (Bookstein 1997; Gunz et al. 2005), positions of semi-landmarks can be estimated along the curve and thus are used to depict morphologic features. Homologous curves can also be defined using consistent distances between semi-landmarks throughout all objects in question. But in terms of defining highly irregular shapes or highly topographic surfaces, even semi-landmarks quickly reach their limitations.
Recent methods in shape analysis, like the semi-automated landmarking procedure (Felice and Goswami 2017) and generalized Procrustes surface analysis (Pomidor et al. 2016), tackle this difficulty and are more precise in capturing curvatures and surfaces. Furthermore, approaches based on spherical harmonics (SPHARM), which represent an extension of Fourier analyses, facilitate an accurate comparison of overall shape, including structures that are highly irregular in shape and size and which contain only few definable and morphologically suitable points where landmarks could be set. Taking the whole object into account, the previously mentioned methods provide a more objective approach to shape comparison, which is in our opinion an ultimate goal in comparative morphology. In this study, we used the open source software SPHARM v. 1.4 (https://www.enallagma.com/SPHARM.php; Shen and Makedon 2006; Shen et al. 2009). As the name suggests, the software is based on SPHARM and generates 3D geometrical models of object surfaces (Brechbühler et al. 1995). The software has helped to understand the coevolution of reproductive organs in damselflies on a morphological basis (McPeek et al. 2009, 2011) and was also successfully used to investigate shape patterns of frontal sinuses in Carnivora (Curtis and van Valkenburgh 2014). More recently, it was used to explore the relationship between the middle ear shape of turtles and habitat preferences (Foth et al. 2019).
The fact that SPHARM can only be used on models with completely closed surfaces gives rise to the question of how to deal with structures exhibiting large openings, like single segments of arthropods. One can argue that the openings do not belong to the studied feature itself and should not be considered for shape comparison at all, but this is only partly true. The margin of such an opening does have a certain shape and this form also contributes to the shape of the entire feature. This means that including openings as part of the overall shape of studied objects is necessary, and the problem that SPHARM-based applications only work on models with completely closed surfaces has to be addressed.
Ambient occlusion
There are some software applications, which can be used to identify and close small holes in generated mesh surfaces (e.g. MeshLab, Geomagic Studio and Deep Exploration). However, when it comes to apertures that must be closed before a surface for SPHARM-based analysis can even be generated, capabilities are quickly exhausted. For this reason, we applied an ambient-occlusion (AO)-based segmentation algorithm (Baum and Titschack 2016) using Amira to our segmented datasets. Based on a separation of the data into foreground (object) and background (rest), the AO algorithm computes an approximation for how much each point of the background would be occluded from the ambient light source, hence the name of the algorithm. An advantageous property of AO is that it generates smooth scalar fields and, thus, subsequent segmentations based on those scalar fields result in smooth boundaries at pore and cavity openings. This is a very desirable property, particularly when dealing with natural objects. Using this algorithm offers three main advantages: (1) it is a mathematically based closing procedure that is easy to reproduce, generates less variance in the data than handmade closures and is thus well suited to represent the shape of closed openings; (2) it mostly creates closures that integrate smoothly into the total structures; and (3) it saves a significant amount of time compared with creating handmade closures.
A requirement for the algorithm is the classification of input data into the aforementioned background and foreground sets, that is, a binary segmentation, which is often generated prior to computing a surface representation anyway. Openings and holes to be extracted, as well as the structures outside, are part of the background, whereas the structures themselves are categorized as foreground. To determine the amount of ambient light that can reach a certain point in the background, a large number of directions are considered given by the points that are uniformly sampled on a full sphere. In contrast to the typical usage of AO for shading surfaces in computer graphics, which only considers a hemisphere close to the surface, the herein used algorithm considers the directions on a full sphere at each point of the background. The algorithm works by casting rays from each point (voxel) of the background into all directions given by uniformly sampled points on the sphere. For each ray, it is determined whether or not the ray hits a foreground voxel. The number of rays that hit the foreground divided by the overall number of rays gives the AO value for each background voxel. Those values are output as a scalar field, the AO field.
Claw shape comparison
We exemplify the topic with a preliminary study on shape comparison of claws in hermit crabs. The articulation socket between propodus (forming the manus as well as the pollex, the fixed finger) and dactylus (the movable finger) are depicted as a hole, as is the articulation socket between propodus and the next more proximal element, the carpus. We applied a methodology including an ambient-occlusion-based segmentation algorithm to test whether the algorithm results in precise and suitable shape representations that are detailed enough to study the inter- and intraspecific differences in shape of hermit crab claws. Obviously, for a comparison, one of the chelae needs to be mirrored.
Materials and methods
Studied species
In total, we studied 18 specimens of paguroid species, which are summarized in Table 1. Except for one, all specimens were collected in 2017 along the Istrian coastline, the Kvarner Gulf, Croatia. All specimens were stored in 70% EtOH.
Fixation and dehydration
In preparation for microCT scanning, an ascending alcohol series for dehydration using 70, 80, 90, 96, and 99.8% EtOH, was carried out on the claws of the listed specimens. Afterwards, the claws were supercritical dried (Leica EM CPD300) to enhance contrast in CT images. We omitted further contrasting methods, since the contrast of dried, calcified cuticles is sufficient for shape analyses using microCT.
Microcomputer tomography
Dried chelipeds were mounted with hot glue on specimen holders. X-ray imaging was performed with a ZEISS Xradia 410 Versa (Carl Zeiss X-ray Microscopy Inc., Pleasanton, USA) at 50–80 kV and 8 W (0.4 scintillator-objective lens unit, 5–12-µm pixel size).
Workflow
Here, we describe the complete workflow used to generate SPHARM-based surface models of the compiled microCT scans, including the conduction of PCA. Programs used were Amira, MeshLab, and SPHARM.
3D surface reconstruction and AO segmentation—Amira
3D reconstruction was performed using image stacks of virtual sections obtained by microCT. All reconstructions were created using the software Amira (FEI Visualization Sciences Group, Zuse Institute Berlin, 6.4.0). After saving segmentations of claw podomeres (propodus and dactylus) separately as Amira label files (Fig. 1b), the AO-based segmentation algorithm was applied to each segmentation [the XImagePAQ extension of the latest Amira version (2019) includes the proposed AO segmentation algorithm as a standard application]. For best results in this case, the AO value of the segmentation algorithm was set to 0.7 for all structures (Fig. 1c). Since transition lines between the computed closures and the segmentations were still visible, further smoothing was achieved using the smooth function in Amira (x–y, x–z and y–z plane). Afterwards, the merged totals of closures and segmentations were used to calculate surface models (rendering) of the podomeres using the module Generate Surface. A first reduction of vertices and faces was done using the Simplification Editor application in Amira. Thereby surfaces were downscaled by one third. Then the Remesh Surface and the Smooth Surface modules were applied. For further data processing, the generated surfaces were exported as PLY data files using MeshLab v. 1.3.4beta (Visual Computing Lab, ISTI, CNR).

a Depiction of the left claw of Clibanarius erythropus (dactylus highlighted in yellow) in lateral view. Further processing steps are exemplified on the left dactylus of C. erythropus (rotated through 180° along the long axis and shown in distal view). b Volumetric segmentation before and after (c) the application of the AO-based segmentation algorithm. d the standardized surface model including the set of orientation landmarks and e the finished SPHARM model. D1—distal dactylus ending, D2—median joint surface to propodus, D3—median boundary of closure apodem, D4—lateral boundary of closure apodem, D5—lateral joint surface to propodus
3D mesh processing—MeshLab
Most mesh processing steps were conducted using MeshLab (Cignoni et al. 2008) and are listed in chronological order in the following protocol. The program contains features for detecting and correcting errors in mesh geometry. All processing steps used can be found in the tab Filters. Furthermore, we used the standard settings of processing steps where parameters could be adjusted. Again, following these steps, the corrected and processed surfaces were exported as PLY data files.
-
1.
Option Cleaning and Repairing processing steps remove duplicate faces, remove duplicate vertices and remove unreferenced vertices.
-
2.
Option Remeshing, Simplification and Reconstruction processing steps close holes, surface reconstruction: Poisson and quadric edge collapse decimation (number of faces / vertices was set to 5000/2502 for dactyli and 10,000/5002 for propodi).
-
3.
Option Smoothing, Fairing and Deformation processing step Taubin smooth.
-
4.
Option Normals, Curvatures and Orientation processing steps transform: flip and/or swap axis and invert faces orientation (both steps were only conducted with the right podomeres, since they were necessary for mirroring).
Landmarks—Amira
A set of five orientation landmarks were applied for scaling, rotating, and aligning specimens before SPHARM analyses could be conducted. The landmarks were set on the standardized surface models in Amira (Fig. 1d), and were exported as landmarkAscii files.
Geometric morphometrics—SPHARM
Prior to the SPHARM analyses, the 3D surface models had to be converted into Matlab (M) data files, since SPHARM v. 1.4 is written in Matlab (The MathWorks, https://de.mathworks.com/products/matlab.html). Options used were Make Models from Input Files, Make Surfaces From SPHARM Models, and Principal Components Analysis. Again, standard settings of the tasks were used.
-
1.
Option Make Models From Input Files
Surface and landmark data were loaded in SPHARM v. 1.4. In the first processing step (Resize Objects and Landmarks), the ‘Resize’ and ‘Centroid’ options were activated to superimpose all surface models on the basis of the orientation landmarks using GPA. Calculated centroid sizes (CS) were saved as TXT files.
In the second processing step (Make Template), a spherical parameterization was conducted to determine a reference dataset. In our case, the logarithm of the median of all CS was calculated and the M data file with the log(CS) closest to the median was chosen as template.
For the third processing step (Make SPHARM Models), the template and the corresponding M data files had to be selected. This step resulted in three output data files per uploaded M data file. The reg_MAT data files contained the corresponding SPHARM model coefficients for further analyses.
-
2.
Option Make Surfaces from SPHARM Models
This option can be seen as a last check of input data before executing the PCA. On the basis of the reg_MAT data files, surfaces were compiled (Figure 1e), which could then be reviewed for surface artifacts and falsely set landmarks using Amira, or similar programs.
-
3.
Option Principal Components Analysis
In this option, the previously checked reg_MAT data files (36 for dactyli and 36 for propodi) were uploaded. Afterwards PCAs were carried out (one PCA for each podomere data set). Output data consisted of 35 PCs. Eigenvalue models of the PCs including the consensus shapes were calculated as surfaces (Figs. 2 and 3). Numerical summaries of PCAs (total variance, eigenvalue of PCs, explained variance of PCs and PC results) were compiled as DTA data files.
Fig. 2 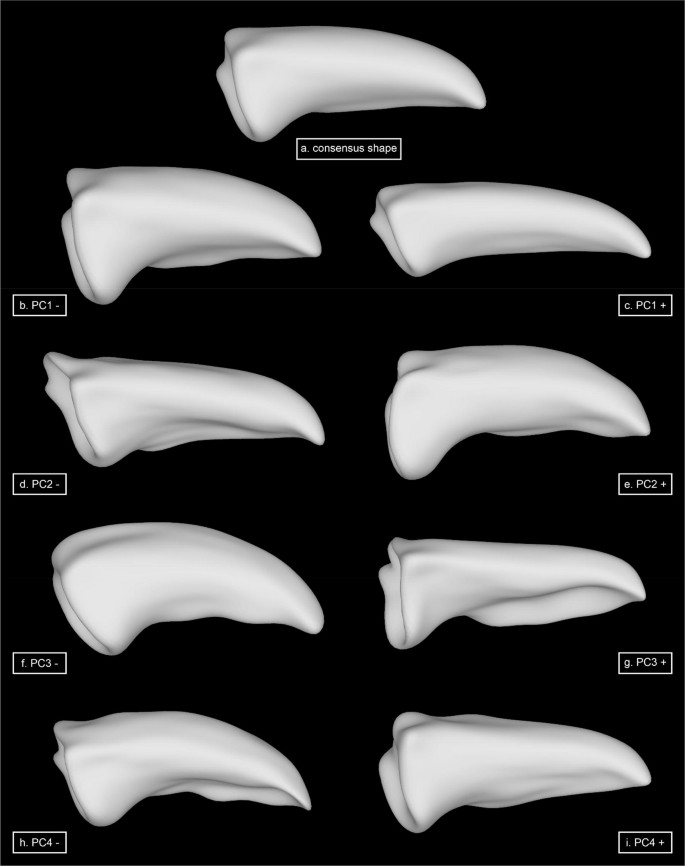
Results of the 3D spherical harmonic analyses of dactyli showing major shape variation of the first four principal components compared to the consensus shape (a). All depictions of shape variation comprise exactly the same orientation and proportions
Fig. 3 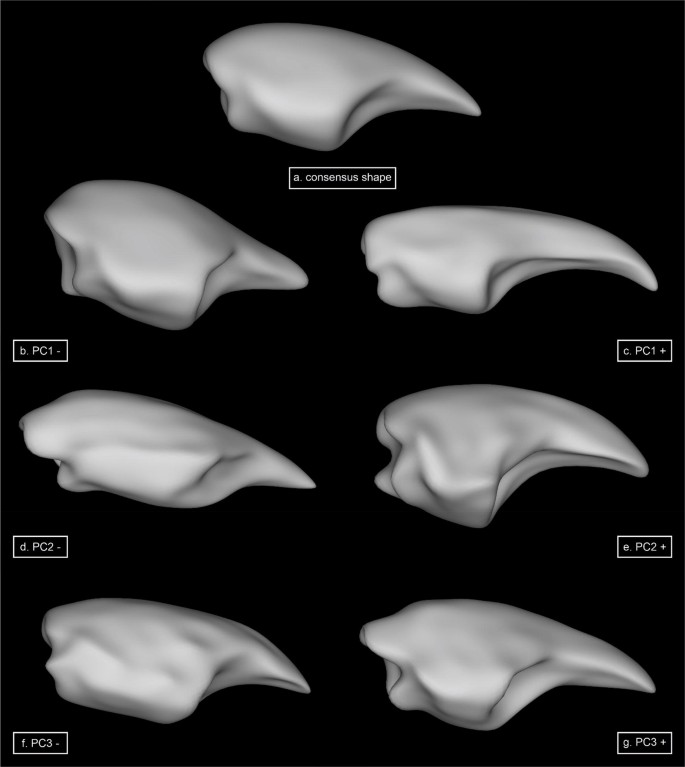
Results of the 3D spherical harmonic analyses of propodi showing major shape variation of the first three principal components compared to the consensus shape (a). All depictions of shape variation comprise exactly the same orientation and proportions


Multivariate statistics
PCs with significant shape variation were calculated with the help of the broken stick method (Jackson 1993) performed in PAST v3.18 (Hammer et al. 2001). To test whether right and left podomeres of representatives of Diogenidae and Paguridae species overlap with each other or are significantly separated from each other in morphospace, multivariate analyses of variance (MANOVA) and nonparametric multivariate analyses of variance (npMANOVA) also were performed in PAST. Furthermore, classifications into diogenid left, diogenid right, pagurid left and pagurid right dactyli and propodi were tested with MANOVA, npMANOVA and a canonical variate analysis (CVA). If the p-values of each test were below 0.05, a significant separation between two groups within the morphospace was given.
Results
Dactyli shape variation
The first four PCs define significant shape variation, explaining 80.1% of total shape variation (PC1: 31.3%; PC2: 22.3%; PC3: 16.3% and PC4: 10.2%).
Regarding PC1, negative values (Fig. 2b) include shortened dactyli with a dominant appearance, referred to the bigger extent, the distinct cutting edge, and the enlarged insertion point. Positive values of this component (Fig. 2c) account for an elongated dactylus with a small extent compared to the consensus shape (Fig. 2a). Also, the cutting edge is more rounded and, therefore, appears less dominant.
Shape changes associated with negative values of PC2 (Fig. 2d) show dorsally flattened dactyli with a ventromedially twisted tip. Also, the cutting edge is proximally elongated. The dorsal part of the insertion point is posteriorly tilted. Positive values of PC2 (Fig. 2e) represent longitudinally bent dactyli with a waved cutting edge and insertion points standing approximately at a 90° angle to the long axis.
Negative values of the third PC (Fig. 2f) account for dactyli exhibiting a pronounced curve along the dorsal long axis, as well as a centered, broad cutting edge. They also exhibit a joint opening that is anteriorly tilted in the ventral section. In contrast, positive values of PC3 (Fig. 2g) describe dorsally flattened dactyli with a very dominant, lateral cutting edge, a strong concave arch on the inside and insertion points standing approximately at a 90° angle to the long axis.
Negative values of PC4 (Fig. 2h) represent dorsally bent dactyli with a pointed tip, a wavy cutting edge and a concave arch on the dactylus inside. The joint openings are quite similar to the consensus shape. The positive values of PC4 (Fig. 2i) include dactyli that are dorsally flattened and exhibit a rounded tip. The lateral located cutting edge is recognizable but not dominant, whereas the joint opening is more dominant than in the consensus shape.
Propodi shape variation
The first three PCs explain 73.7% of total shape variation (PC1: 38.7%; PC2: 27.4% and PC3: 7.6%).
Negative values of PC1 (Fig. 3b) are associated with propodi that exhibit a clinched pollex with a rounded cutting edge. Compared to the consensus shape (Fig. 3a), the manus appears bigger, both in length and extent. Insertion points are more dominant compared to the consensus shape. In contrast, positive values of PC1 (Fig. 3c) describe a propodus comprising a strongly elongated, dorsally curved pollex and a shortened manus. Insertion points are less dominant compared to the consensus shape.
Negative values of PC2 (Fig. 3d) are associated with a less marked, rounded pollex, and an elongated manus. The axis of the proximal insertion point is tilted, so that the ventral boundaries of the closure apodemes project even further in proximal direction. In contrast, positive values of PC2 (Fig. 3e) capture propodi with a dominant spoon-shaped pollex and a distinct cutting edge, whereas the manus is shortened compared to the consensus shape. Also, insertion points are larger and much more distinct, especially the proximal boundaries of the closure apodemes.
Negative values of PC3 (Fig. 3f) represent propodi with an edged pollex exhibiting a small cutting edge right behind the apex. Compared to the consensus shape, the manus is elongated and ventrally flattened along the long axis. Shape changes associated with positive values of PC3 (Fig. 3g) show propodi with an elongated pollex compared to consensus shape. The manus is shortened with insertion points that are both much more dominant, especially the proximal boundaries of the closure apodemes (cf. PC2 +).
PCA data output
For the examined dactyli, specimens are mainly distributed into four groups separated along the PC1 and PC2 axes (Fig. 4a). Right and left dactyli of C. erythropus are well separated from other species in an area determined by PC2 values below − 0.003. While having a similar extent as C. erythropus on the PC1 axis, the group 1 subdominant diogenid and pagurid claws is clearly separated from other groups by PC2 values above 0.003. Group 4 containing homoiochelic and dominant diogenid claws is separated from other groups by PC1 values below − 0.0015. Dominant claws of P. cuanensis represent an extreme in the morphospace with values between 0.009 and 0.01 along the PC1 axis. Dominant claws of P. anachoretus are located near the middle of the morphospace and, therefore, share PC1 value ranges with group 1 and 3 and PC2 value ranges with group 4. In Fig. 4b, the morphospace of the PCs 3 and 4 is displayed, wherein only one group, comprised of right and left dactyli of D. pugilator, is clearly separated from other specimens by PC3 values below − 0.005.

Scatterplots of PC1 vs. PC2 (a) and PC3 vs. PC4 (b), whereby every point represents the dactylus of an examined claw. Circles distinguish between groups in the 2D morphospace. The closer points lay together, the more similar the respective dactyli are. a PC1 and PC2 together capture 55.1% of the overall shape variance and, therefore, provide a clear first assessment of the data. Group 1: left dactyli of P. anachoretus, P. cuanensis and right dactyli of D. pugilator; group 2: right dactyli of P. anachoretus and P. cuanensis; group 3: left and right dactyli of C. erythropus; group 4: left dactyli of D. pugilator and left and right dactyli of P. eremita and P. streaensis. b PC3 and PC4 together capture 26.5% of the overall shape variance. Group 1: left and right dactyli of D. pugilator
In the morphospace for propodi (Fig. 5), dominant claws of D. pugilator (group 1) clearly demarcate from other claws along the PC1 and PC2 axes (Fig. 5a) with PC values around − 0.008. Group 2 containing dominant claws of Paguristes is also clearly separated in the morphospace; likewise group 3, composed of Clibanarius and subdominant claws of Paguristes. Subdominant pagurid claws (group 4) comprise the highest values along the PC1 axis and, therefore, separate from other claws in the morphospace. In the scatter plot for propodi comprising PCs 1 and 3 (Fig. 5b), the groupings are less distinct. But the groups one, two, and four (cf. Fig. 5a) are still recognizable.

Scatterplots of PC1 vs. PC2 (a) and PC1 vs. PC3 (b), whereby every point represents the propodus of an examined claw. Circles distinguish between groups in the 2D morphospace. a PC1 and PC2 together capture 65.1% of the overall shape variance. b PC1 and PC3 together capture 46.3% of the overall shape variance. Group 1: left propodi of D. pugilator; Group 2: left propodi of P. streaensis and P. eremita; Group 3: right propodi of P. streaensis, P. eremita and both propodi of Clibanarius; Group 4: left propodi of P. anachoretus and P. cuanensis
Multivariate statistics
For dactyli, the separation between Diogenidae and Paguridae was highly significant (p < 0.0001 for MANOVA and npMANOVA), whereas a separation between right and left dactyli across families did not show any significant relation (p > 0.05). Concerning the CVA, results show significant separations between all groups except left and right diogenid claws, which overlap in Fig. 6a (see Table 2).

CVA scatter plots of the groupings diogenid left claws (red), diogenid right claws (blue), pagurid left claws (dark blue) and pagurid right claws (green). a The results for dactyli are illustrated, b the results for propodi
For the propodi, the separation of Diogenidae and Paguridae was highly significant (p < 0.0001 for MANOVA and p = 0.0001 npMANOVA) whereby a separation of all examined right and all examined left propodi did not show significant relations (p > 0.05). The results of the CVA only show a significant separation between the pagurid left propodi. The remaining groupings overlap at least with one other group (see Fig. 6b, Table 3).
Discussion
The final transformation of harmonized 3D meshes via PCs allows the quantification of shape variation—data that can later be further processed with different multivariate analyses, including MANOVA, CVA and disparity analyses. By illustrating numeric values of the first two PCs as a scatter plot for dactyli (Fig. 4), on the one hand, one can easily discriminate between dominant and subdominant claws of heterochelic species, e.g. P. anachoretus, D. pugilator, and even illustrate different levels of intraspecific variability regarding dominant and subdominant claws, e.g. P. cuanensis. On the other hand, claws of homoiochelic species such as C. erythropus or P. eremita, and P. streaensis cluster together. Concerning the propodi (Fig. 5), it is again easy to discriminate between dominant and subdominant claws, whereas homoiochelic claws cluster together (cf. C. erythropus). Of all examined hermit crab claws, dominant propodi of D. pugilator have the least divergence and are clearly separated from other species in the morphospace (Fig. 5). We consider the present study as a case study for the introduction of our newly established methodology, showing that it is well suited for detailed shape investigations. Future studies with larger sample size will show whether claw shape is determined more by a phylogenetic signal with higher similarities in claw shape between species within the same family than between species ranking in different families, or by a stronger functional signal with stronger shape resemblance in dominant (right claw in Paguridae and Lithodoidea, left claw in Diogenidae and Coenobitidae) and subdominant claws beyond family boundaries.
Summary
We describe a procedure for modeling 3D segmentations with large cavity openings using SPHARM-based GM. In this case study, we examined the 3D shape of the dactyli and propodi of hermit crab claws: insertion points were closed using an algorithm based on ambient occlusion (AO) before surfaces were calculated and subjected to shape analyses. AO provided an optimal geometrical solution for the closures, additionally it can be reproduced more objectively than handmade closures and thus extends the application range of SPHARM to biological structures that are more complex in their morphology. Using the aforementioned procedure yielded results which are precise and suitable not only for studying the inter- and intraspecific differences in shape of hermit crab claws, but also for further statistical analyses as PCA, MANOVA and CVA. Furthermore, the procedure is easy to reproduce and creates little variance in the data, closures integrate smoothly into the total structures and the algorithm saves a significant amount of time.
References
Baum D, Titschack J (2016) Cavity and pore segmentation in 3D images with ambient occlusion. In: Bertini E, Elmqvist N, Wischgoll T (eds) Eurographics conference on Visualization (EuroVis). The Eurographics Association, Zuse Institute Berlin (ZIB), Berlin, Germany, pp 113–117
Bookstein FL (1991) Morphometric tools for landmark data: geometry and biology. Cambridge University Press, Cambridge
Bookstein FL (1997) Landmark methods for forms without landmarks: morphometrics of group difference in outline shape. Med Image Anal 1:225–243
Brechbühler C, Gerig G, Kübler O (1995) Parametrization of closed surfaces for 3-D shape description. Comput Vis Image Underst 61:154–170
Curtis AA, van Valenburgh B (2014) Beyond the sniffer: Frontal sinuses in carnivora. Anat Rec 297:2047–2064
Cignoni P, Callieri M, Corsini M, Dellepiane M, Ganovelli F, Ranzuglia G (2008) MeshLab: an open-source mesh processing tool. Eurogr Ital Chapter Conf 6:129–136
Felice RN, Goswami A (2017) Developmental origins of mosaic evolution in the avian cranium. Proc Natl Acad Sci USA 115:555–560
Foth C, Evers SW, Joyce WG, Volpato VS, Benson RBJ (2019) Comparative analysis of the shape and size of the middle ear cavity of turtles reveals no correlation with habitat ecology. J Anat 235:1078–1097. https://doi.org/10.1111/joa.13071
Gower JC (1975) Generalized procrustes analysis. Psychometrika 40:33–51
Gunz P, Mitteroecker P, Bookstein FL (2005) Semilandmarks in three dimensions. In: Slice DE (ed) Modern morphometrics in physical anthropology. Developments in primatology: progress and prospects. Springer, Boston, pp 73–98
Hammer Ø, Harper DAT, Ryan PD (2001) PAST: Paleontological statistics software package for education and data analysis. Palaeontol Electron 4:1–9
Hammer Ø, Harper DAT (2006) Paleontological data analysis. Blackwell Publishing Ltd., Malden
Jackson DA (1993) Stopping rules in principal components analysis: A comparison of heuristical and statistical approaches. Ecology 74:2204–2214
McPeek MA, Shen L, Farid H (2009) The correlated evolution of three-dimensional reproductive structures between male and female damselflies. Evolution 63:73–83
McPeek MA, Symes LB, Zong DM, McPeek CL (2011) Species recognition and patterns of population variation in the reproductive structures of a damselfly genus. Evolution 65:419–428
Mitteroecker P, Gunz P (2009) Advances in geometric morphometrics. Evol Biol 36:235–247
Pomidor BJ, Makedonska J, Slice DE (2016) A landmark-free method for three-dimensional shape analysis. PLoS ONE 11:3
Richter S, Wirkner CS (2014) A research program for evolutionary morphology. J Zool Syst Evol Res 52:338–350
Schäfer W (1954) Form und Funktion der Brachyuren-Schere. Abhandlung der Senckenbergischen naturforschenden Gesellschaft 489. W. Kramer & Co, Frankfurt
Schultz NG, Otárola-Castillo E, Dean MD (2017) Dissection, microCT scanning and morphometric analyses of the Baculum. J Vis Exp 121:e55342
Shen L, Farid H, McPeek MA (2009) Modeling three-dimensional morphological structures using spherical harmonics. Evolution 63:1003–1016
Shen L, Makedon F (2006) Spherical mapping for processing of 3D closed surfaces. Image Vis Comput 24:743–761
Zelditch ML, Swiderski DL, Sheets HD, Fink WL (2012) Geometric morphometrics for biologists: a primer. Elsevier Academic Press, San Diego
Acknowledgements
Open Access funding provided by Projekt DEAL. The authors would like to thank Stephan Scholz for the technical support. Many thanks to the team of MareMundi for assisting with sampling. An anonymous reviewer provided helpful comments and Helen Johnson improved the English. This is gratefully acknowledged. The microCT machine at the University of Rostock was sponsored by the German Science Foundation (DFG INST 264/130-1 FUGG, respectively) as well as the present project (DFG RI 837/24-1).
Author information
Authors and Affiliations
Corresponding author
Ethics declarations
Conflict of interest
All authors declare that they have no conflict of interest.
Ethical approval
All applicable international, national, and institutional guidelines for the care and use of animals were followed. No endangered species or animals from protected areas were used for this study. This article does not contain any studies with human participants performed by any of the authors.
Additional information
Publisher's Note
Springer Nature remains neutral with regard to jurisdictional claims in published maps and institutional affiliations.
Rights and permissions
Open Access This article is licensed under a Creative Commons Attribution 4.0 International License, which permits use, sharing, adaptation, distribution and reproduction in any medium or format, as long as you give appropriate credit to the original author(s) and the source, provide a link to the Creative Commons licence, and indicate if changes were made. The images or other third party material in this article are included in the article's Creative Commons licence, unless indicated otherwise in a credit line to the material. If material is not included in the article's Creative Commons licence and your intended use is not permitted by statutory regulation or exceeds the permitted use, you will need to obtain permission directly from the copyright holder. To view a copy of this licence, visit http://creativecommons.org/licenses/by/4.0/.
About this article

Cite this article
Ege, Y.C., Foth, C., Baum, D. et al. Adapting spherical-harmonics-based geometric morphometrics (SPHARM) for 3D images containing large cavity openings using ambient occlusion: a study with hermit crab claw shape variability. Zoomorphology 139, 421–432 (2020). https://doi.org/10.1007/s00435-020-00488-z
Received:
Revised:
Accepted:
Published:
Issue Date:
DOI: https://doi.org/10.1007/s00435-020-00488-z