Article

Genetic Diversity and Population Structure of Acanthochiton rubrolineatus (Polyplacophora) Based on Mitochondrial and Nuclear Gene Markers

1
College of Life Sciences, Ludong University, Yantai 264025, China
2
College of Life Sciences, Nantong University, Nantong 226019, China
*
Authors to whom correspondence should be addressed.
Diversity 2020, 12(4), 159; https://doi.org/10.3390/d12040159
Submission received: 18 March 2020 / Revised: 16 April 2020 / Accepted: 17 April 2020 / Published: 19 April 2020
(This article belongs to the Section Marine Diversity)

Abstract

:
Acanthochiton rubrolineatus (Cryptoplacidae, Neoloricata, Polyplacophora) has a narrow distribution range along the seacoasts of China, the Korean Peninsula and Japan. We collected 238 samples from eight localities along the Chinese coast, and analyzed the genetic diversity and population structure with COI, 16S-rRNA and 28S-rRNA gene sequences. All analyses based on combined sequences of COI and 16S-rRNA suggested that there was evident genetic differentiation between the northern populations (YT, WH, DL, QD, LYG) and southern populations (ZS, YH, XM) of A. rubrolineatus. The haplotype distribution pattern and genetic diversity based on 28S-rRNA sequences also supported the genetic divergence between the two groups. Both groups had experienced population expansion after the ice age of Pleistocene, and an additional population bottleneck had happened in the southern group in recent history, which led to low genetic diversity of mitochondrial DNA and abnormally high diversity of nuclear DNA in this group. Our results suggested that the protection on A. rubrolineatus is necessary, and the northern and southern group should be protected separately.

1. Introduction

Polyplacophora (Mollusca) contains more than 940 species and 430 fossil species of chitons [1,2], which are oval, dorsoventrally compressed and bilaterally symmetrical marine invertebrates with eight valves in their dorsum [3]. Chitons are a relatively primitive group among mollusks [4], but their shape and living habits have not changed significantly in the past 500 million years [5,6]. Therefore, chitons are called as “living fossils”, and they have great value in studies of speciation and the evolution of mollusks [7]. Many investigations about this group have been focused on the origin and phylogenetic relationships among different species [7,8,9,10,11], population structure [12], morphology [13,14] and embryonic development [15,16,17,18]. In addition, as chitons are common species in littoral rocky coasts in their distribution regions, they can serve as good indicators of the local environment. Some species of chitons can be eaten as food and have great medicinal interest [19,20,21,22,23]. The radular teeth of chitons, containing large amounts of magnetite in the form of nanoparticles, were found to be interesting research materials of biomineralization, magnetic materials and natural nanomaterials [24,25,26,27].
Acanthochiton rubrolineatus (Cryptoplacidae, Neoloricata, Polyplacophora) is a species that only distributes along the seacoasts from the Bohai Sea to the East China Sea, and the Korean Peninsula and Japan [3,28]. The three red dark fringes on the intermediate valves, the wide girdle scales, and the granule shape bulges on scales’ surface are distinctive morphological features of A. rubrolineatus [3]. Studies on this species have been focused on its great economical values on new magnetic materials and natural nanomaterials [24,25] and biopharmaceuticals [20,21,22,23,29]. The concern is that the wild resources of A. rubrolineatus are declining sharply in Chinese coasts due to coast overexploitation and ocean pollution [30]. Our field survey showed that this species has disappeared in some previously recorded localities.
Wild resource protection is the only way to conserve A. rubrolineatus, because this species has not been artificially cultured so far [31]. A comprehensive understanding on the genetic diversity and population structure of this species is necessary for the establishment of protection measures. Population genetic diversity and structure can reveal the evolutionary history of the species [32,33]. Mitochondrial gene markers, especially the cytochrome c oxidase subunit I gene (COI) and 16S ribosomal RNA gene (16S-rRNA), are commonly used in genetic diversity analyses of marine invertebrates [34,35,36,37,38]. Now, the genetic diversity and population structure of A. rubrilineatus in the whole distribution region is still unclear, though samples from Bohai Bay have been analyzed with COI sequences [39].
In this study, we collected A. rubrolineatus samples from eight localities along the Chinese coast, which generally represent the whole distribution region of this species in China. We analyzed the population genetic diversity and structure using both mitochondrial (COI, 16S-rRNA) and nuclear (28S-rRNA) gene markers. The results will be greatly helpful for wild resource conservation and fisheries management of A. rubrolineatus.

2. Materials and Methods

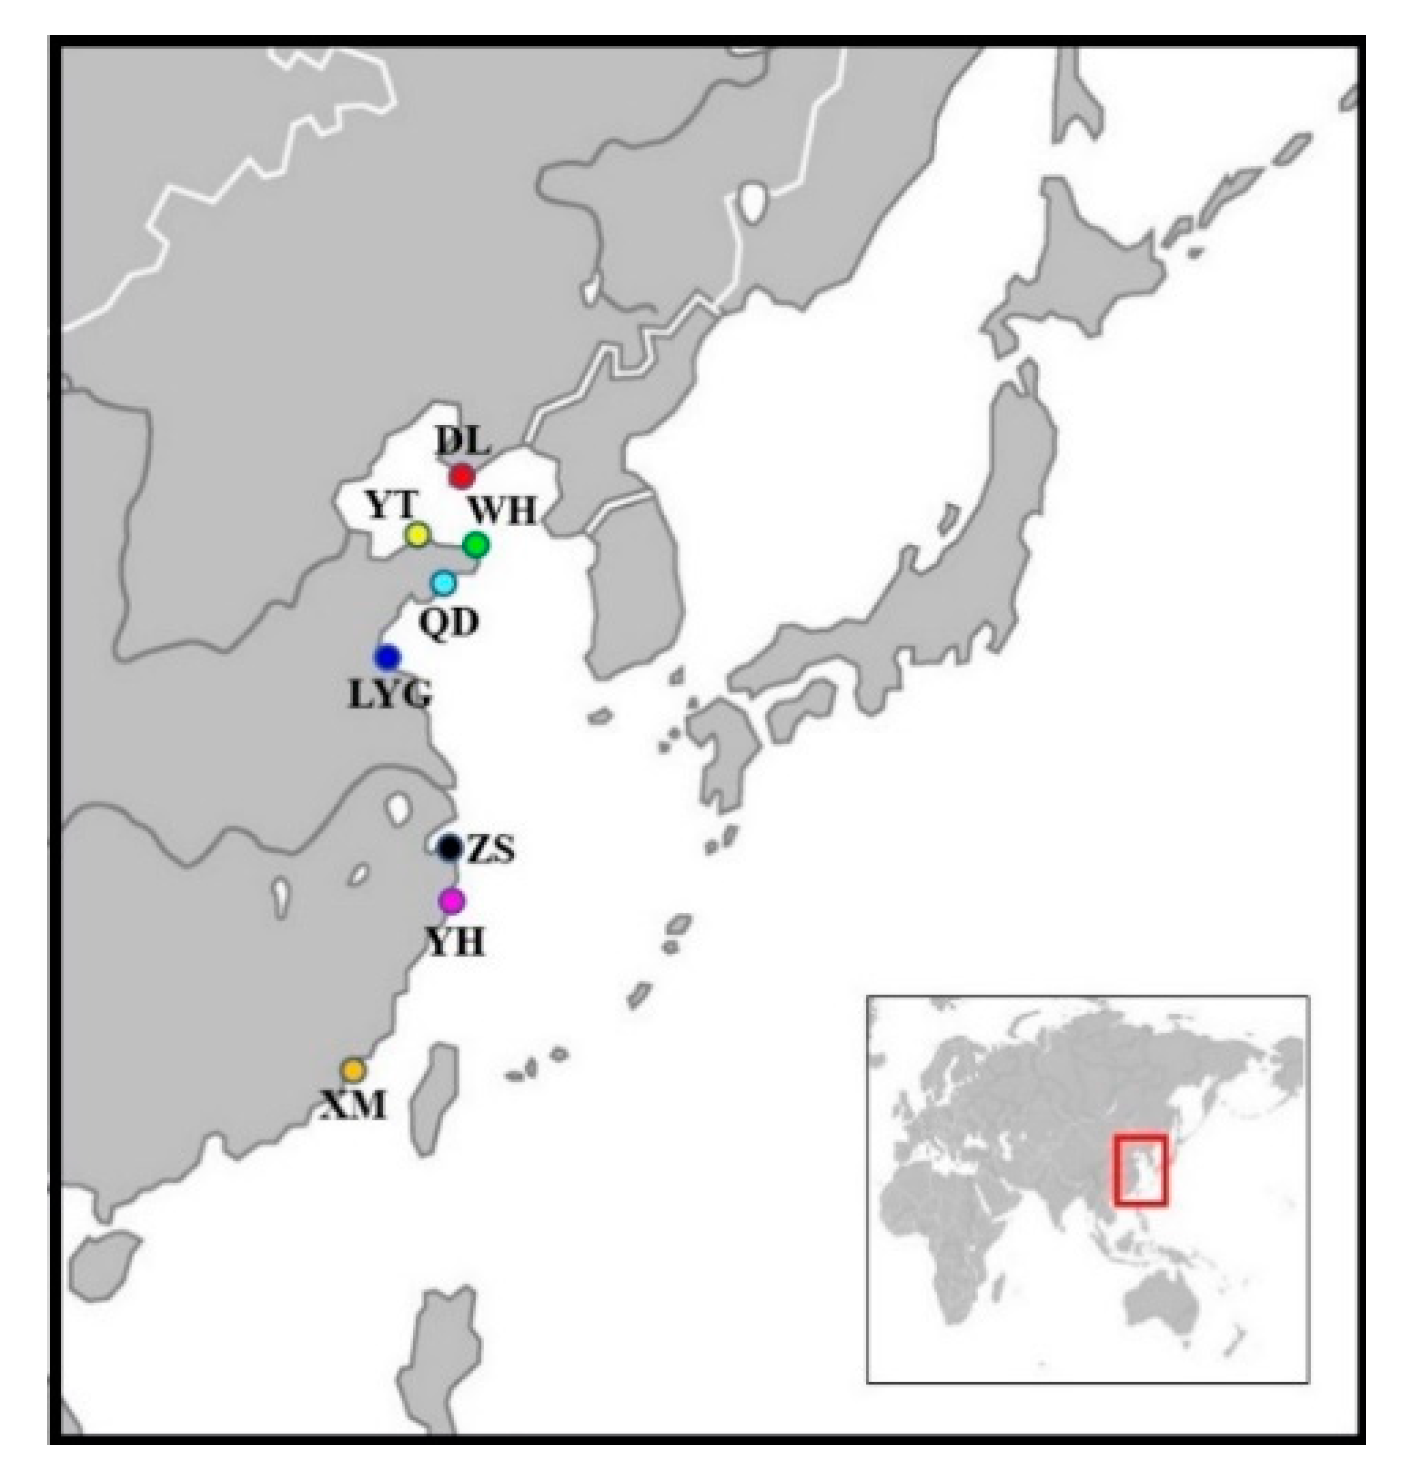
2.1. Sample Collection

A total of 238 individuals of A. rubrolineatus were collected from eight localities across the coasts of China sea (Dalian, DL; Yantai, YT; Wehai, WH; Qingdao, QD; Lianyungang, LYG; Zhoushan, ZS; Yuhuan, YH; Xiamen, XM) (Table 1, Figure 1). All individuals were live trapped and identified based on morphological characters [40]. The abdomen muscle tissues were placed in absolute alcohol and transported to the laboratory, and then were stored at −80 °C until DNA extraction.

2.2. PCR Amplification and Sequencing

The genomic DNA of each individual was extracted from muscle tissue with a TIANamp Marine Animals DNA Kit (Catalog number: DP324-03, TIANGEN, Beijing, China) according to the manufacturer’s instructions, and was adjusted to 50 ng/μL. The gene segments of COI, 16SrRNA and 28SrRNA were amplified respectively with a polymerase chain reaction (PCR) technique using the primers listed in Table S1. The PCR reaction system was same as that described in Gong et al. [37]. The PCR procedures were listed in Table S1. A negative control without genomic DNA was included in each round of PCR to check for contamination, and all negative controls obtained no products. The PCR products were checked on 1.5% agarose gels stained by ethidium bromide and were visualized by ultraviolet transillumination (UVP, Upland, CA, USA). Then, the products were purified with a gel extraction kit (Sangon BioMedical, Shanghai, China) and sequenced (both directions) with an ABI 3730 XL automatic sequencer (Perkin-Elmer, Waltham, MA, USA) using an ABI PRISM BigDye Terminator Cycle Sequencing Ready Reaction kit (with AmpliTaq DNA polymerase FS, Applied Biosystems, Foster City, CA, USA).

2.3. Data Analysis

The sequences of COI (652 bp) and 16S-rRNA (533 bp) segments from 238 individuals (Table 1) and sequences of 28S-rRNA (326 bp) segments from 235 individuals (27 individuals in WH) were obtained separately. All sequences were deposited in GenBank (accession numbers: MT338576 - MT338813 for COI, MT331859 - MT332096 for 16S-rRNA, MT326640 - MT326874 for 28S-rRNA). In the analyses, two mitochondrional genes (COI and 16S-rRNA) were combined. All sequences were aligned using the ClustalX 2.0 [41,42] under default settings with manual corrections as implemented in the software BioEdit v7.0.9 [43], and then were adjusted by visual inspection and BLAST analyses in the NCBI database. All haplotypes were defined by DNASP5.10.01 [44], and the genetic diversity parameters (the number of haplotypes—h, haplotype diversity—Hd, number of segregating sites—S and nucleotide diversity—π), were also calculated using DNASP 5.10.01. To evaluate historical demography, the Fu’s Fs statistics and Tajima’s D [45] were calculated using the Arlequin 3.5.13 [46] with 1000 permutation to test for neutrality. The values of fixation index (FST) between different populations and the analyses of molecular variance components (AMOVA) were also calculated by the Arlequin 3.5.13. Kimura 2-parameter model distances were calculated using Mega 6.0.6 [47]. The expansion times of the southern and northern groups were inferred using a Bayesian skyline plot (BSP) model implemented in BEAST v2.6.2 [48]. The appropriate substitution model of sequences was chosen by Modeltest version 3.7 [49,50]. Coalescent genealogies of BSP were constructed with a lognormal relaxed clock model for a total of 10 million generations by sampling every 1000 generations. The mutation rate of COI sequences is 2%/Mya (the mutation rate of COI in mollusk) [51,52], the appropriate substitution model is TPM3+G, and G is 0.1850. For 16S rRNA sequences, the mutation rate is 1.2%/ Mya [51,52], the appropriate substitution model is GTR +G, and G is 0.6420.
Phylogenetic trees were constructed using Bayesian inference and maximum likelihood methods to explore the relationship among different haplotypes defined from eight geographical localities. The phylogenetic analyses were based on combined sequences of COI and 16S rRNA and sequences of 28S rRNA, respectively. Acanthochitona crinite (COI and 16S-rRNA: MG680027) and Liolophura japonica (28S-rRNA: AY377683.1) were used as outgroup in analyses with two sets of data. Bayesian analyses were performed using MrBayes 3.2.7 [53] with an appropriate substitution model of sequence that was chosen by Modeltest v3.7 [49,50]. The best substitution model for combined sequences of COI and 16S-rRNA (GTR+G) and 28S-rRNA (K80+G) was estimated separately. For the Bayesian procedure, four independent Markov chains were run for 10 million generations by sampling one tree per 1000 generations and allowing adequate time for convergence. The first 2500 trees (25%) were discarded as part of a burn-in procedure (that was determined by checking for the likelihood of being stationary); the remaining 7500 sampling trees were used to construct a 50% majority rule consensus tree. Two independent runs were carried out to provide additional confirmation of the convergence of the Bayesian posterior probabilities (BPP) distribution. The maximum likelihood (ML) tree with 100 bootstrap pseudoreplicates was constructed online with PhyML 3.0 [54] (http://www.atgc-montpellier.fr/phyml/). The model of evolution chosen by Modeltest v3.7 was applied, but PHYML was allowed to estimate parameter values independently.
A median-joining network was constructed using Network 5.0.1.1 [55] to infer relationships among 92 haplotypes defined by combined sequences of COI and 16S rRNA.

3. Results

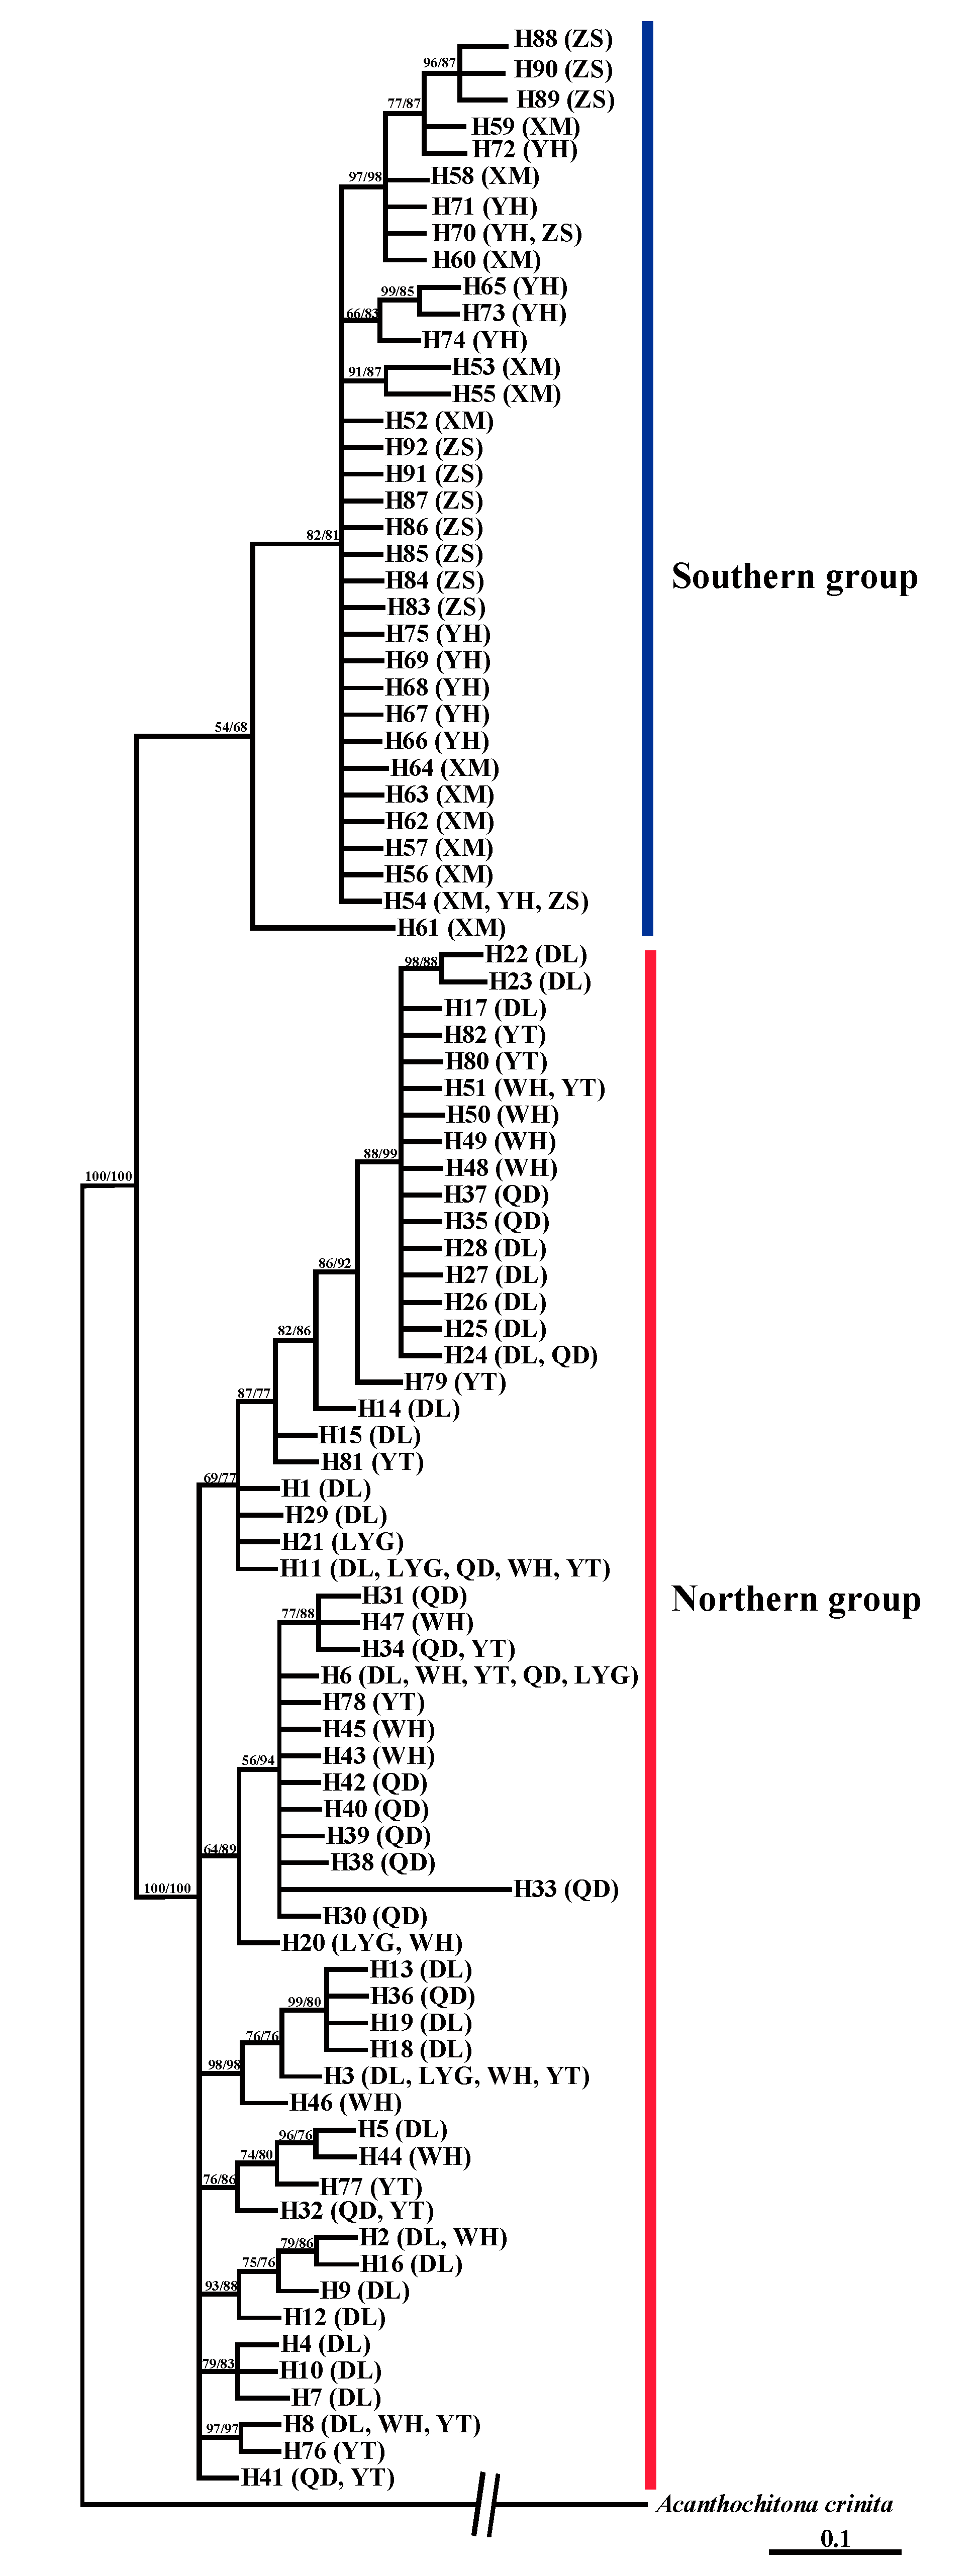
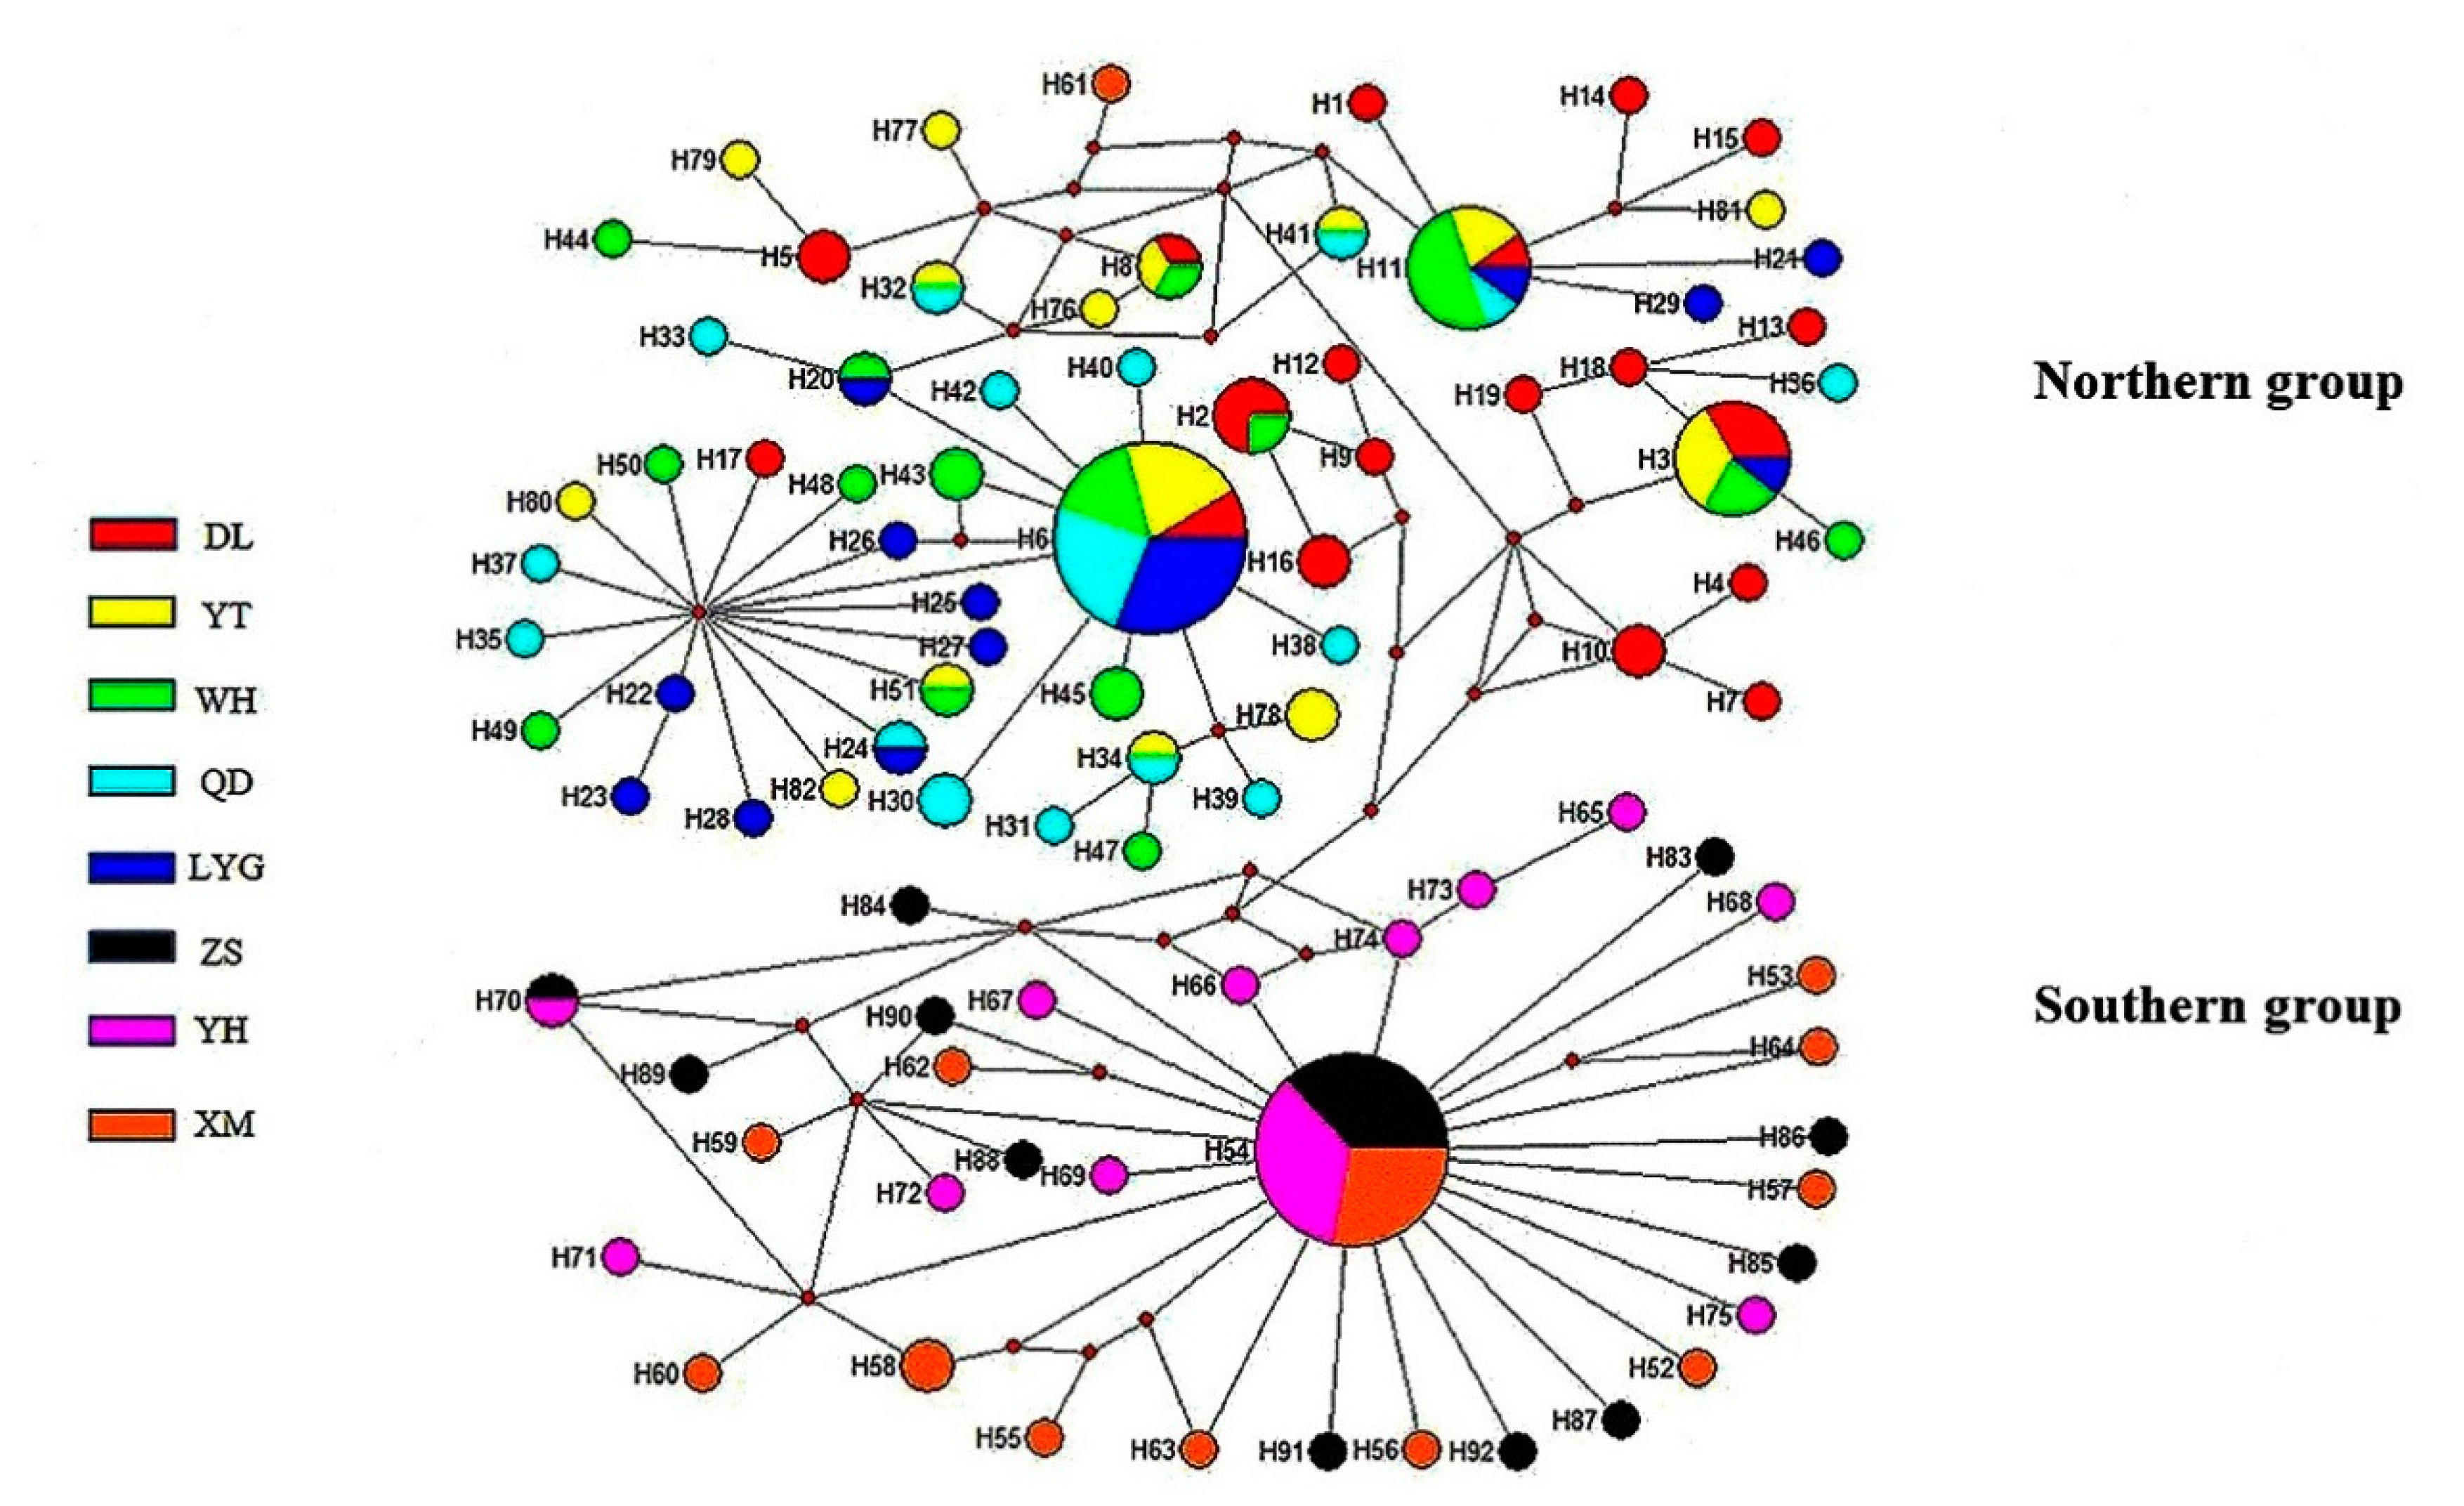
3.1. Population Structure and Genetic Diversity Based on Mitochondrial Gene Markers

A total of 92 haplotypes and 249 polymorphic sites (156 singleton variable sites and 93 parsimony informative sites) were defined by 238 combined sequences of COI and 16S rRNA (1185 bp) (Table 2, Table S2). The Bayesian tree and ML tree, based on sequences of 92 haplotypes, presented consistent topology, which showed clearly that all haplotypes were clustered into two lineages (Figure 2). All haplotypes from northern China (YT, WH, DL, QD, LYG) gathered into a lineage, and all haplotypes from southern China (ZS, YH, XM) grouped into another lineage.
Among 92 haplotypes, 71 haplotypes were private (accounting for 77.2%) (Table S2). Five northern populations shared two haplotypes (H6 and H11), and three southern populations shared one haplotype (H54). In the median joining network, two radiation clades corresponding to the northern and southern group were presented (Figure 3). In the northern clade, the haplotype H6, shared by five populations, was the dominant haplotype. In the southern clade, the haplotype H54, shared by three populations, was located in the radiation center. The correlations among haplotypes reflected in the network (Figure 3) were generally consistent with the relationships showed in the phylogenetic tree (Figure 2).
For all samples, the haplotype diversity (Hd) and nucleotide diversity (π) were 0.889 and 0.03310, respectively. For different populations, the Hd ranged from 0.648 (LYG) to 0.959 (DL), and the π ranged from 0.00152 (ZS) to 0.01059 (QD) (Table 2). Because two apparent groups were suggested by the phylogenetic tree, the genetic diversity for the two groups were also calculated. For the northern group (DL, YT, WH, QD, LYG), the Hd was 0.858 and the π was 0.00871; for the southern group (ZS, YH, XM), the Hd was 0.639 and the π was 0.00379 (Table 2).
In the neutrality tests, except the Tajima’s D value of DL, the other Tajima’s D and Fu’s Fs test values for all eight populations were negative (Table 2). The P values for five populations (QD, LYG, ZS, YH, XM) were smaller than 0.05. When the tests were carried out based on northern and southern groups, all of the Tajima’s D and Fu’s Fs test values were negative with P values smaller than 0.02.
Based on the combined sequences of mitochondrial gene segments, the FST values among populations from northern region ranged from −0.02071 to 0.13911, and the FST values among populations from southern China ranged from −0.02332 to −0.00791 (Table 3). However, the FST values between northern and southern populations ranged from 0.59467 to 0.74835. The Kimura 2-parameter model distance among populations from the northern region ranged from 0.00604 to 0.01489, and the distance among the populations from southern China ranged from 0.00105 to 0.00579. Between the northern and southern populations, the K2P distance ranged from 0.06106 to 0.07025 (Table 3).
AMOVA analyses based on eight localities showed that 53.19% of the genetic variance of A. rubrolineatus came from different populations (Table S3). When the analysis was carried out based on two groups (the northern and southern group), the results suggested that 66.78% of the genetic variance existed between two groups (Table S3).

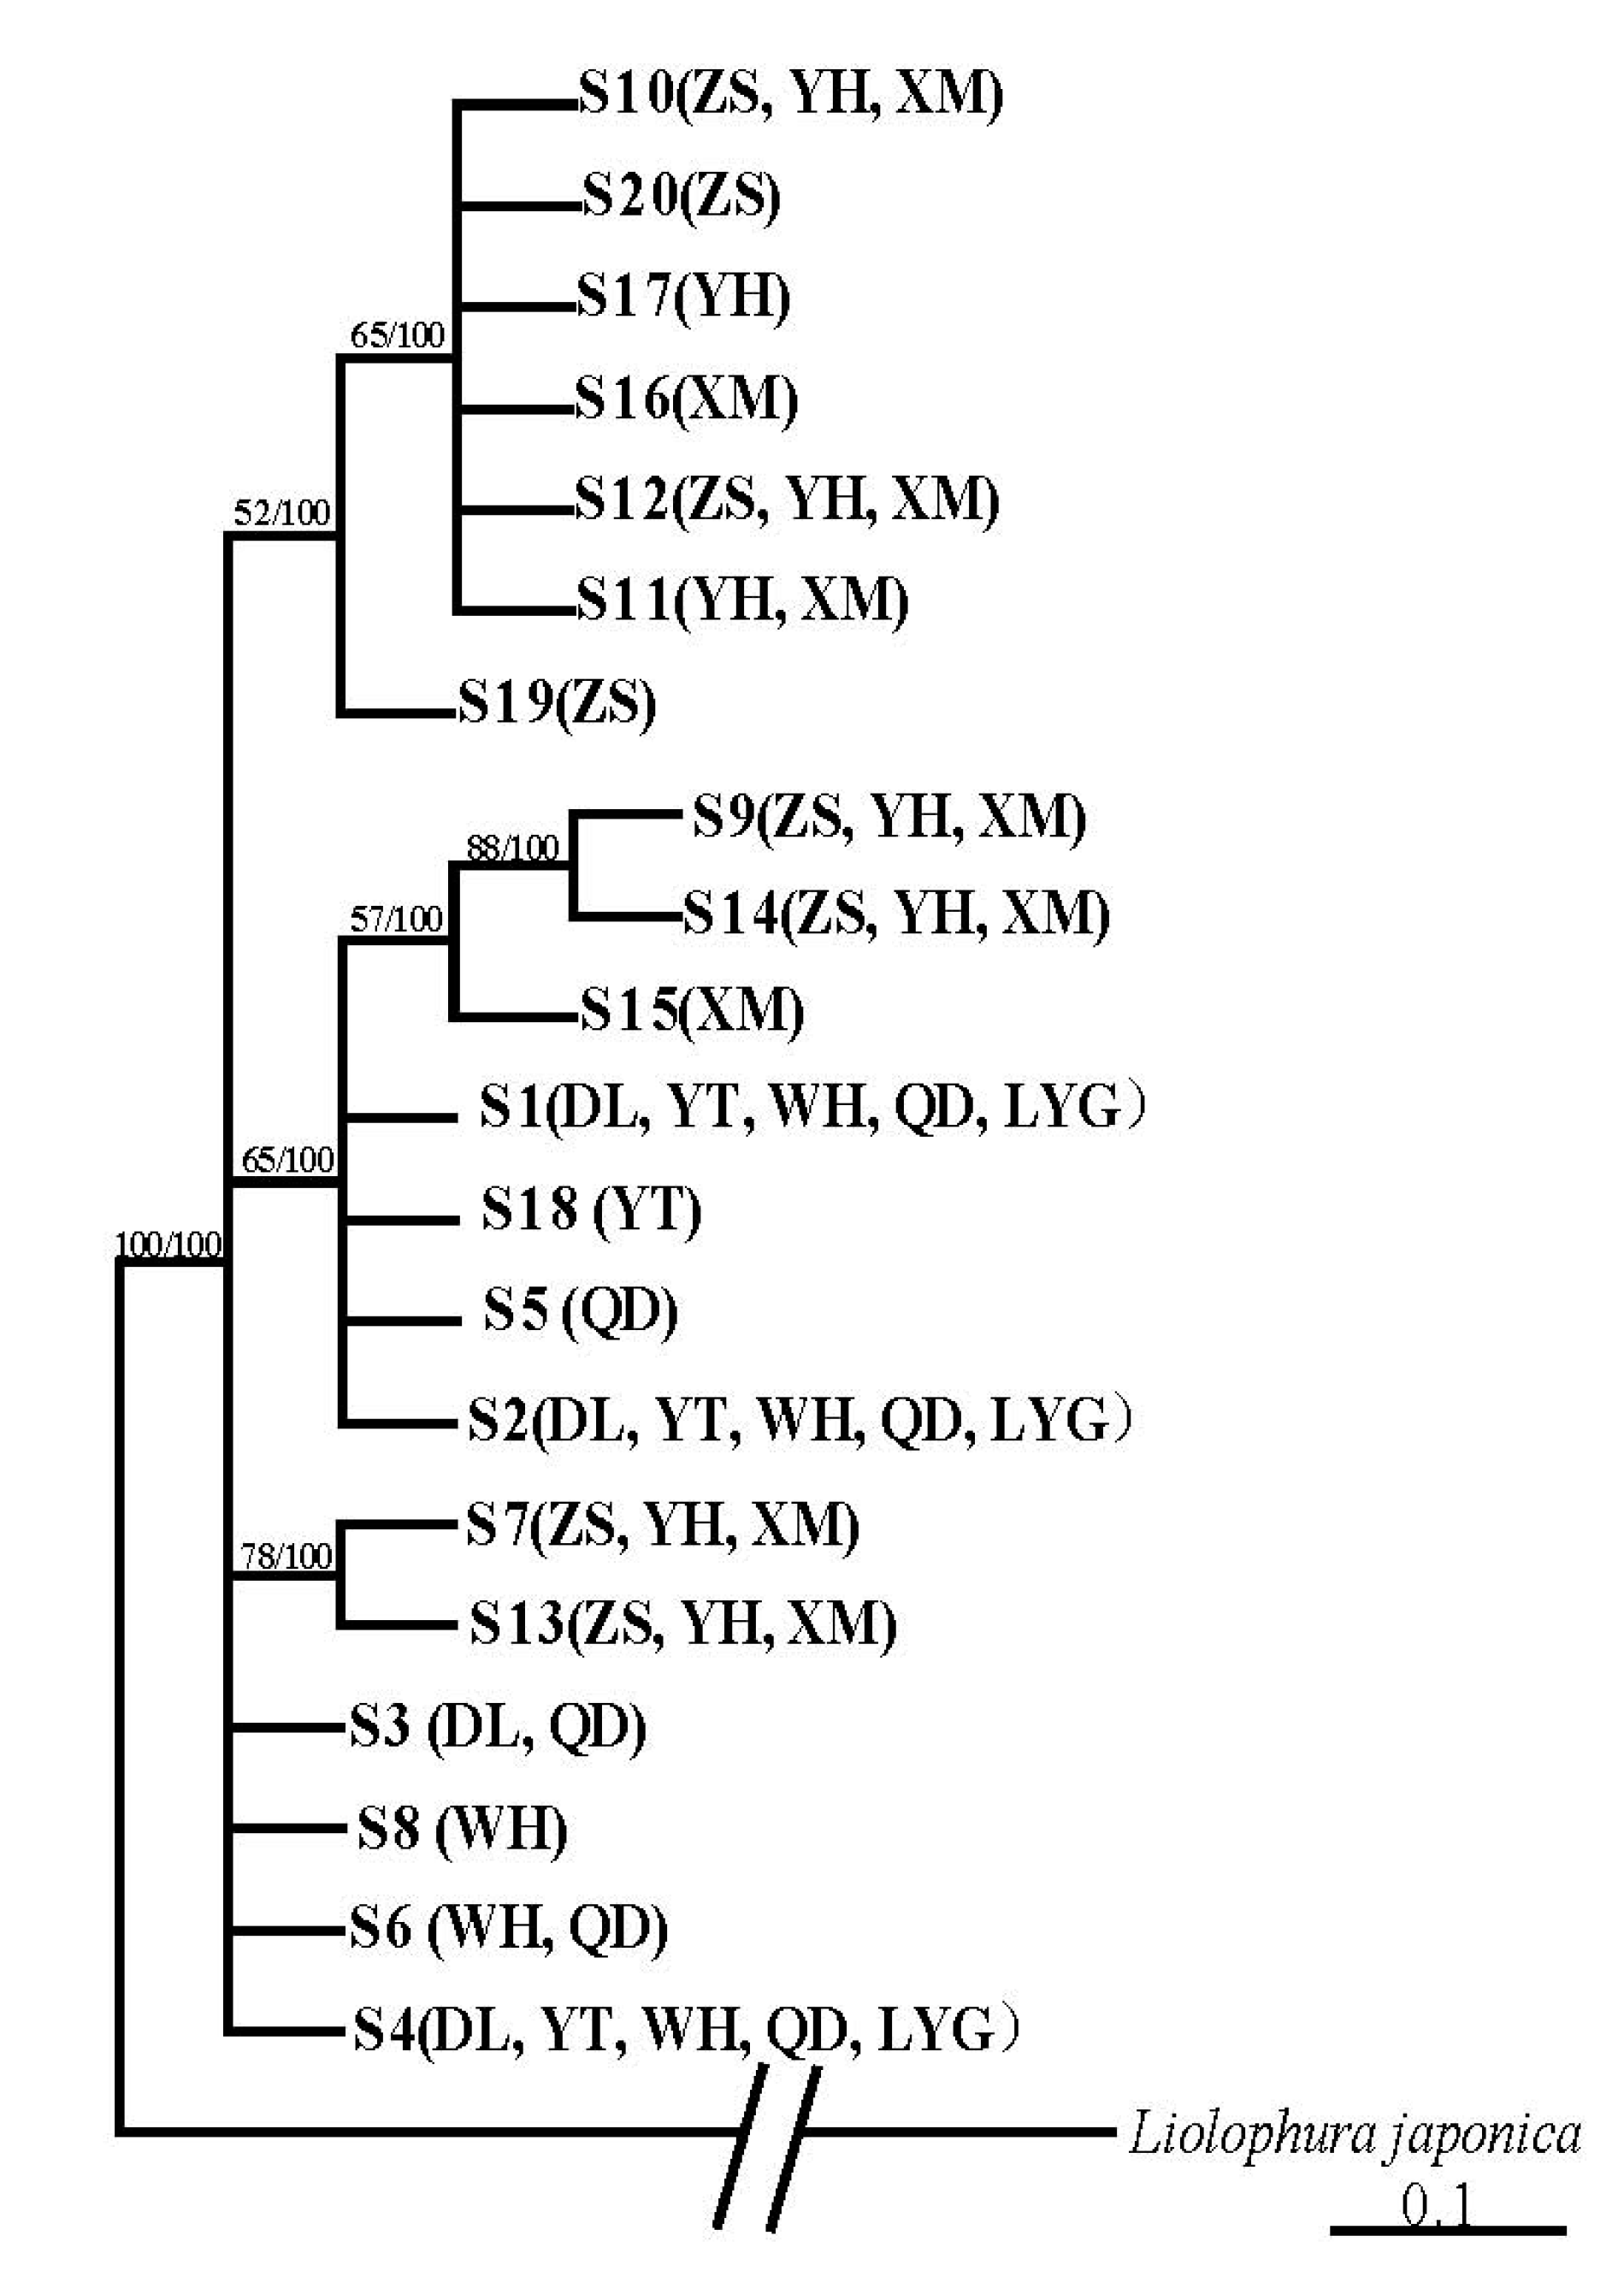
3.2. Population Structure and Genetic Diversity of A. rubrolineatus Inferred from 28S-rRNA Sequences

Only 20 haplotypes and 23 polymorphic sites (10 singleton variable sites and 13 parsimony informative sites) were defined by 235 28S-rRNA sequences (342 bp) from eight localities (Tables S4 and S5). The phylogenetic tree, based on 28S-rRNA sequences (Figure 4), presented different topology from that of the mitochondrial gene markers (Figure 2). There was no distinct lineage corresponding to the northern or southern group, and some haplotypes from the northern and southern regions mixed in one clade (Figure 4).
Among 20 haplotypes, eight haplotypes were private (account for 40.0%) (Table S5). Five northern populations shared two haplotypes (S2 and S4), and three southern populations shared six haplotypes (S7, S9, S10, S12–S14). The Hd and π values of all samples were 0.830 and 0.01350, respectively (Table S4). For different populations, the Hd ranged from 0.614 (YT and LYG) to 0.834 (ZS and YH), and the π ranged from 0.00316 (DL) to 0.01975 (ZS). The Hd and π values of the southern populations were greater than those of the northern populations (Table S4).

4. Discussion

4.1. Significant Genetic Divergence Between Northern and Southern Groups of A. rubrolineatus

Among 92 haplotypes defined by the mitochondrial gene markers, no haplotype was shared by northern and southern populations (Table S2). In the phylogenetic trees, all 58 haplotypes from northern populations (YT, WH, DL, QD, LYG) grouped into one lineage, and 34 haplotypes from southern populations (ZS, YH, XM) grouped into another lineage (Figure 2). In the median joining network, haplotypes from northern and southern regions also distributed in two radiation clades, respectively (Figure 3).
Mitochondrial COI and 16S rRNA sequences were extensively used to assess the genetic diversity of marine invertebrate species [28,37,56,57,58,59,60,61]. Combining previous reports, the mitochondrial DNA diversity of A. rubrolineatus was relatively high. However, the diversity level of the northern group and southern group was very different, and the overall diversity of the northern group was significantly higher than that of the southern group (Table 2).
The pairwise FST value is a popular parameter to estimate gene flow and genetic differentiation between different populations. When the FST values are greater than 0.05, genetic differentiation exists among populations; if the FST values are greater than 0.25, the genetic differentiation among populations is significant [62,63,64]. Based on the mitochondrial gene markers, the FST values among populations from the southern region were negative (−0.02332 to −0.00791) (Table 3), which indicated that there was no genetic divergence within the southern group. Except DL, the FST values among the other four northern populations were smaller than 0.05. However, the FST values between the northern and southern populations were all significantly greater than 0.25 (0.59467 to 0.74835) (Table 3).
The Kimura 2-parameter model distance between the northern and southern populations (0.06106–0.07025) were significantly greater than those within the northern group (0.00604–0.01489) and southern group (0.00105–0.00579) (Table 3). The AMOVA analyses also showed that most of the genetic variance (66.78%) existed between two groups (Table S3).
The results of all above analyses, based on combined sequences of mitochondrial gene segments, suggested that gene flow between the northern and southern group of A. rubrolineatus was very limited, and significant genetic divergence had been accumulated between two groups (Figure 2 and Figure 3; Table 2 and Table 3; Tables S2 and S3). Our results indicated that the classification of A. rubrolineatus need to be reconsidered, though there was no report about the reproductive isolation between the northern and southern groups of this species.
Because of the low mutation rate of 28S-rRNA, few haplotypes were defined by sequences of this gene (Tables S2 and S5), and the phylogenetic tree based on sequences of this gene did not show two distinct geographic lineages (Figure 4). However, the haplotype distribution pattern and genetic diversity also presented evidence for obvious divergence between northern and southern groups. Two groups shared no 28S-rRNA haplotype (Table S5), and the genetic diversity of southern populations were greatly higher than those of northern populations (Table S4).
There are several possible reasons to explain the great genetic divergence between the northern and southern groups. First, most adults of chitons live on reefs, and it is difficult for them to migrate a long distance. Moreover, the planktonic larval of chitons have limited capacity for long-distance dispersal [65,66,67], because most chiton species have only lecithotrophic (non-feeding) larvae and their planktonic larval stage is very brief [68]. Second, the Yellow Sea and East China Sea were separated during the subglacial periods of the Pleistocene Ice Age because of the falling water level [69], which would hinder the gene flow between the northern and southern group completely. During the interglacial stage, there are many small and persistent convection and eddy currents near the coasts of China Sea [70], which will limit the planktonic larva of chitons to nearshore areas and furtherly hinder their long-distance migration. DL and the other four northern populations were isolated by the Bohai Sea (Figure 1). The greater FST values between DL and the other four populations within the northern group (Table 3) can be well explained by the limited migration capacity of the adults and planktonic larvae of chitons. Third, Bohai Bay, the Yellow Sea (monsoon climate of medium latitudes) and East China Sea (subtropical monsoon climate) belong to different climatic types, and their annual temperature change characteristics, the annual precipitation, and the water salinity and pH values are very different [71]. These factors lead to the differences of growth rate, individual size and reproductive period between the northern and southern populations of A. rubrolineatus. Rising temperature and acidification of the seawater would increase feeding amount due to the increase of metabolic demand [72,73]. The body sizes of individuals from southern China are generally larger than those of samples from northern China. In addition, there is a distribution gap of A. rubrolineatus at the southern border of the Yellow Sea (because about 900 km of the coasts in Jiangsu Province is mudflat without rock), which lead to the absence of step-stone populations between the northern and southern group. Last, the different natural climate and coastal ecological environment produced different natural selective pressures on the northern and southern populations, which may furtherly facilitate the accumulation of genetic divergence.
Considering the apparent genetic divergence and different genetic diversity between the two groups, we proposed that the northern group and southern group of A. rubrolineatus should be protected separately.

4.2. Historic Demography of A. rubrolineatus

In general, the genetic diversity of A. rubrolineatus is characterized by high haplotype diversity and low nucleotide polymorphism (Table 2, Table S4). Many marine invertebrate species that have experienced population decline and following expansion showed this type of genetic diversity [37,58,59], because haplotype diversity may increase rapidly in a short period of time by accumulating mutations, while nucleotide polymorphism cannot return to the original level in the same time [74].
A total of 68 individuals in five northern populations shared mitochondrial DNA haplotypes H6 and H11, and 125 individuals shared 28S-rRNA haplotypes S2 and S4 (Tables S2 and S5). There were 53 individuals in three southern populations that shared the mitochondrial haplotype H54, and a total of 80 individuals shared six 28S-rRNA haplotypes (S7, S9, S10, S12–S14) (Tables S2 and S5). The extensively shared haplotypes among different populations is another sign of population expansion.
Tajima’s D values and Fu’s Fs tests are frequently used parameters in neutrality tests to examine recent population expansion [75]. Negative Tajima’s D value with a P value smaller than 0.05 indicates that the sequence contains more nucleotide changes than the neutral evolution model [76]. Based on combined sequences of COI and 16S rRNA segments, the Tajima’s D and Fu’s Fs test values for five populations (QD, LYG, ZS, YH, XM) were negative with P values smaller than 0.05, and the values were negative with P values smaller than 0.02 when the estimation was carried out for two (northern and southern) groups (Table 2). The patterns of genetic diversity and haplotype distribution, as well as the results of the neutrality test, suggested that both groups of A. rubrolineatus had experienced population expansions.
We calculated the expansion times for two groups using the extended Bayesian skyline plot [48] based on COI and 16S rRNA sequences, respectively. Based on COI sequences, the expansion time was about 0.349 Mya and 0.205 Mya for the northern group and southern group, respectively. Based on 16S rRNA sequences, the expansion time was about 0.280 Mya and 0.160 Mya for the northern group and southern group, respectively. The estimated time was corresponding to the interglacial stage after the Dagu-Lushan glaciation of middle Pleistocene [77].
In the quaternary glacial epoch, there were at least four subglacial and interglacial periods in China. Previous studies on population structures of many marine invertebrate species from Chinese seacoasts [37,78,79,80,81] showed that Pleistocene glaciation was the main driving force to shape the genetic structures of marine mollusks in China. The dramatical shrinkage of the China Sea and temperature decrease in the subglacial periods led to the population decline or extinction of many marine invertebrate species in some regions. During the last glacial maximum (21,000 BP–15,000 BP), Bohai Bay and the Yellow Sea almost disappeared [69], the East China Sea became the shelter of most marine mollusk species. As a primitive mollusk species that has existed for hundreds of million years, A. rubrolineatus must have experienced several times population decline and following population expansion during the Pleistocene Ice Age. Under this condition, the expansion time estimated from sequences of a few genes cannot reflect the detailed population history of A. rubrolineatus, and the error of calculation is easy to understand.
Previous studies on population structures of other marine mollusk species (such as Atrina pectinate, Coelomactra antiquata, Eriocheir sensu stricto, Urechis unicinctus) did not find obvious genetic divergence between northern and southern populations [37,78,79,80]. Therefore, it was proposed that the existing populations of many marine mollusk species in Bohai Bay and the Yellow Sea migrated from the East China Sea by population expansion after the last glacial maximum [81]. However, the situation in A. rubrolineatus was very different, the great genetic divergence between northern and southern group and the different expansion time estimated by mitochondrial genes indicated that the existing populations of A. rubrolineatus along Bohai Bay and the Yellow Sea are descendants of native survivors in the ice age.
We should notice that the genetic diversity of the two groups inferred from mitochondrial and nuclear gene segments were very different (Table 2, Table S4). Considering the lower mutation rate of 28S-rRNA than mitochondrial genes, the lower genetic diversity of 28S-rRNA than that of mitochondrial genes in northern groups should be a normal situation. The low genetic diversity of mitochondrial DNA and abnormally high diversity of nuclear DNA in the southern group indicated that an additional population bottleneck had happed in recent history. Strong typhoons and storm surges often attack coasts of the East China Sea, while the coasts of Bohai Bay and the Yellow Sea are rarely attacked by such disasters [82]. Strong typhoons and storm surges always destroy coastal rocks and reefs severely, and habitat destruction will lead to the population decline of A. rubrolineatus in southern China. The bottleneck effect, combining the genetic drift effect, result in the special genetic diversity pattern in southern populations.

5. Conclusions

A. rubrolineatus is a species of chitons with a narrow distribution area. This species has great scientific and economical values, but its wild resources are declining sharply. A comprehensive understanding of the genetic diversity and population structure of this species is necessary for the establishment of protection measures. In the present study, 238 individuals of A. rubrolineatus were collected from eight localities along Chinese seacoasts, and the population genetic diversity and structures were analyzed with both mitochondrial (COI, 16S-rRNA) and nuclear (28S-rRNA) gene markers. The results showed that there was great genetic differentiation between the northern and southern group of A. rubrolineatus and both groups had experienced population expansion. An additional population bottleneck had happened in the southern group in recent history, which led to the different patterns of genetic diversity in the two groups. We proposed that the northern group and southern group of A. rubrolineatus should be protected separately.

Supplementary Materials

The following are available online at https://www.mdpi.com/1424-2818/12/4/159/s1, Table S1: PCR primer sequences and procedure used in this study, Table S2: Distribution of 92 haplotypes inferred from 238 combined sequences of COI and 16S rRNA segments of A. rubrolineatus, Table S3: Molecular variance (AMOVA) analysis in based on COI and 16S-rRNA sequences. Table S4: Genetic diversity parameters based on 28S-rRNA sequences of A. rubrolineatus, Table S5: Distribution of 20 haplotypes inferred from 235 28S-rRNA sequences of A. rubrolineatus.

Author Contributions

Conceptualization, L.H. and M.J.; methodology, L.H. and M.J.; software, H.X. and M.J.; validation, L.H. and M.J.; formal analysis, H.X.; investigation, H.X., Z.C. and J.Z.; resources, H.X. and Z.C.; data curation, J.Z. and Z.C.; writing—original draft preparation, H.X.; writing—review and editing, L.H. and M.J.; visualization, M.J.; supervision, L.H; project administration, M.J.; funding acquisition, L.H. All authors have read and agreed to the published version of the manuscript.

Funding

This work was supported by the Natural Scientific Foundation of China (No. 31171189 and 31371252) and the Second Tibetan Plateau Scientific Expedition and Research program (STEP) (Grant No. 2019QZKK05010303).

Acknowledgments

We are especially grateful to lab member Jie Gong; he provided help during data analysis.

Conflicts of Interest

There are no conflicts of interest, the authors alone are responsible for the content and writing of the article.

References

  1. Schwabe, E. A catalogue of Recent and fossil chitons (Mollusca: Polyplacophora). Addenda. Novapex 2005, 6, 89–105. [Google Scholar]
  2. Puchalski, S.S.; Eernisse, D.J.; Johnson, C.C. The effect of sampling bias on the fossil record of chitons (Mollusca, Polyplacophora)*. Am. Malacol. Bull. 2008, 25, 87–95. [Google Scholar] [CrossRef]
  3. Zhang, J.; Shi, Z.; Wang, C.; Zhang, S.; Zhang, S. Taxonomic study on some common species of Polyplacophora in the coast of China based on valves and rudular morphology. Mar. Sci. 2015, 39, 96–107. [Google Scholar] [CrossRef]
  4. Okusu, A.; Schwabe, E.; Eernisse, D.J.; Giribet, G. Towards a phylogeny of chitons (Mollusca, Polyplacophora) based on combined analysis of five molecular loci. Org. Divers. Evol. 2003, 3, 281–302. [Google Scholar] [CrossRef] [Green Version]
  5. Denny, M.W.; Gaines, S.D. Encyclopedia of tidepools and rocky shores. Zool. J. Linn. Soc. 2007, 154, 735. [Google Scholar] [CrossRef] [Green Version]
  6. Sigwart, J.D. Morphological cladistic analysis as a model for character evaluation in primitive living chitons (Polyplacophora, Lepidopleurina)*. Am. Malacol. Bull. 2009, 27, 95–104. [Google Scholar] [CrossRef]
  7. Scherholz, M.; Redl, E.; Wollesen, T.; Todt, C.; Wanninger, A. Aplacophoran mollusks evolved from ancestors with polyplacophoran-like features. Curr. Biol. 2013, 23, 2130–2134. [Google Scholar] [CrossRef] [Green Version]
  8. Sigwart, J.D.; Sutton, M.D. Deep molluscan phylogeny: Synthesis of palaeontological and neontological data. Proc. R. Soc. B 2007, 274, 2413–2419. [Google Scholar] [CrossRef] [Green Version]
  9. Guo, X.; Cui, Y.; Wang, S.; Xu, R.; Sun, X.; Li, R.; Wang, Y.; Qu, J.; Wang, X.; Liu, X. The complete mitochondrial genome and phylogenetic analysis of Acanthochitona rubrolineatus (Lischke, 1873). Mitochondrial DNA Part B 2019, 4, 2622–2624. [Google Scholar] [CrossRef] [Green Version]
  10. Wray, C.G.; Jacobs, D.K.; Kostriken, R.; Vogler, A.P.; Baker, R.; Desalle, R. Homologues of the engrailed gene from five molluscan classes. FEBS Lett. 1995, 365, 71–74. [Google Scholar] [CrossRef] [Green Version]
  11. Winnepenninckx, B.; Backeljau, T.; Wachter, R.D. Complete small ribosomal subunit RNA sequence of the chiton Acanthopleura japonica (Lischke, 1873) (Mollusca, Polyplacophora). Nucleic Acids Res. 1993, 21, 1670. [Google Scholar] [CrossRef] [PubMed] [Green Version]
  12. Boyle, P.R. Aspects of the ecology of a littoral chiton, Sypharochiton pellisekpentis (Mollusca: Polyplacophora). N. Z. J. Mar. Freshw. Res. 2010, 4, 364–384. [Google Scholar] [CrossRef] [Green Version]
  13. Clode, P.L. Charge contrast imaging of biomaterials in a variable pressure scanning electron microscope. J. Struct. Biol. 2006, 155, 505–511. [Google Scholar] [CrossRef] [PubMed]
  14. Vendrasco, M.J.; Wood, T.E.; Runnegar, B.N. Articulated Palaeozoic fossil with 17 plates greatly expands disparity of early chitons. Nature 2004, 429, 288–291. [Google Scholar] [CrossRef]
  15. Friedrich, S.; Wanninger, A.; Brückner, M.; Haszprunar, G. Neurogenesis in the mossy chiton, Mopalia muscosa (Gould) (Polyplacophora): Evidence against molluscan metamerism. J. Morphol. 2002, 253, 109–117. [Google Scholar] [CrossRef]
  16. Voronezhskaya, E.E.; Tyurin, S.A.; Nezlin, L.P. Neuronal development in larval chiton Ischnochiton hakodadensis (Mollusca: Polyplacophora). J. Comp. Neurol. 2002, 444, 25–38. [Google Scholar] [CrossRef]
  17. Wanninger, A.; Haszprunar, G. Chiton myogenesis: Perspectives for the development and evolution of larval and adult muscle systems in molluscs. J. Morphol. 2002, 251, 103–113. [Google Scholar] [CrossRef]
  18. Lee, S.E.; Jacobs, D.K. Expression of Distal-less in molluscan eggs, embryos, and larvae. Evol. Dev. 1999, 1, 172–179. [Google Scholar] [CrossRef]
  19. Jiang, F.; Deng, M. Medicinal Fauna of China, 2rd ed.; Tianjin Science & Technology Press: Tianjin, China, 1983; p. 571. [Google Scholar]
  20. Zhang, L.; Fan, X.; Li, X. Anticancer activity of 21 marine invertebrate species. Mar. Sci. 2003, 27, 63–67. [Google Scholar]
  21. Zhang, L.; Fan, X.; Han, L. Antitumor and immune regulation activities of the extracts of some Chinese marine invertebrates. Chin. J. Oceanol. Limnol. 2005, 23, 110–117. [Google Scholar] [CrossRef]
  22. Zhang, L.; Fan, X.; Niu, R. Immunomodulatory acitity determination of ethanol extracts from some marine invertebrates. Chin. J. Immunol. 2003, 19, 739–743. [Google Scholar]
  23. Fan, Q.; Huang, C.; Miao, H.; Jiao, B.; Yuan, Q. Screening of bioactive products in twelve kinds of marine animals from Zhoushan archipelago in Zhejiang province. Chin. J. Mar. Drugs 2005, 2, 24. [Google Scholar] [CrossRef]
  24. Liu, C.; Zhao, J.; Cui, L.; Liu, X. Morphology and mineral contents of the radula of chiton (Acanthochiton rubrolineatus lischke). Acta Zool. Sin. 2001, 553–557. [Google Scholar]
  25. Qian, X. Magnetite in the radula teeth of chiton. J. Sichuan Univ. (Nat. Sci. Ed.) 2018, 55, 788. [Google Scholar] [CrossRef]
  26. Kirschvink, J.L.; Lowenstam, H.A. Mineralization and magnetization of chiton teeth: Paleomagnetic, sedimentologic, and biologic implications of organic magnetite. Earth Planet. Sci. Lett. 1979, 44, 193–204. [Google Scholar] [CrossRef]
  27. Joester, D.; Brooker, L.R. Chapter 8. The Chiton Radula: A Model System for Versatile Use of Iron Oxides*. In Iron Oxides: From Nature to Applications; Faivre, D., Ed.; Wiley-VCH: Hoboken, NJ, USA, 2016. [Google Scholar] [CrossRef] [Green Version]
  28. Masato, O. Phylogenetic Relationships Among Japanese Species of the Genus Ischnochiton (Polyplacophora: Ischnochitonidae), Including a New Species. Zool. Sci. 2018, 35, 281–291. [Google Scholar] [CrossRef] [Green Version]
  29. Li, S.; Luo, X. Compendium of Materia Medica; Foreign Languages Press: Beijing, China, 2003. [Google Scholar]
  30. Zhuang, S.; Wang, K.; Chen, L. Study on Invertebrate Communities in Rocky Intertidal Zones Influenced by Human Activities. J. Oceanogr. Huanghai Bohai Seas 2001, 19, 54–64. [Google Scholar] [CrossRef]
  31. Zhao, Q.; Jin, S.; Chen, Y. Structure and behavior of Chitons. Reserv. Fish. 2007, 27, 46–47. [Google Scholar] [CrossRef]
  32. Dimitriou, A.C.; Chartosia, N.; Hall-Spencer, J.M.; Kleitou, P.; Jimenez, C.; Antoniou, C.; Hadjioannou, L.; Kletou, D.; Sfenthourakis, S. Genetic Data Suggest Multiple Introductions of the Lionfish (Pterois miles) into the Mediterranean Sea. Diversity 2019, 11, 149. [Google Scholar] [CrossRef] [Green Version]
  33. Banerjee, A.R. An Introduction to Conservation Genetics. Yale J. Biol. Med. 2010, 83, 166–167. [Google Scholar] [CrossRef] [Green Version]
  34. Riesgo, A.; Pérez-Portela, R.; Pita, L.; Blasco, G.; Erwin, P.M.; Lόpez-Legentil, S. Population structure and connectivity in the Mediterranean sponge Ircinia fasciculata are affected by mass mortalities and hybridization. Heredity 2016, 117, 427–439. [Google Scholar] [CrossRef] [PubMed] [Green Version]
  35. Ammon, U.V.; Wood, S.A.; Laroche, O.; Zaiko, A.; Tait, L.; Lavery, S.; Inglis, G.J.; Pochon, X. Combining morpho-taxonomy and metabarcoding enhances the detection of non-indigenous marine pests in biofouling communities. Sci. Rep. 2018, 8, 16290. [Google Scholar] [CrossRef] [PubMed] [Green Version]
  36. Zeng, C.; Clark, M.R.; Rowden, A.A.; Kelly, M.; Gardner, J.P.A. The use of spatially explicit genetic variation data from four deep-sea sponges to inform the protection of Vulnerable Marine Ecosystems. Sci. Rep. 2019, 9, 5482. [Google Scholar] [CrossRef] [PubMed]
  37. Gong, J.; Zhao, R.; Deng, J.; Zhao, Y.; Zuo, J.; Huang, L.; Jing, M. Genetic diversity and population structure of penis fish (Urechis unicinctus) based on mitochondrial and nuclear gene markers. Mitochondrial DNA Part A 2018, 29, 1261–1268. [Google Scholar] [CrossRef]
  38. Kim, D.W.; Yoo, W.G.; Park, H.C.; Yoo, H.S.; Kang, D.W.; Jin, S.D.; Min, H.K.; Paek, W.K.; Lim, J. DNA barcoding of fish, insects, and shellfish in Korea. Genom. Inform. 2012, 10, 206–211. [Google Scholar] [CrossRef] [Green Version]
  39. Wang, R.; Li, Y.; Liu, C.; Du, W.; Hou, J.; Yao, W.; Zhang, J.; Zhang, Y.; Wang, Y.; Qu, J. Genetic Diversity of Acanthochiton rubrolineatus in the Bohai Rim. Sichuan J. Zool. 2019, 38, 20–27. [Google Scholar] [CrossRef]
  40. Chen, D.; Sun, S. Observations on the Shell Plates of 9 Chiton Species (Polyplacophora). Period. Ocean Univ. China 2010, 40, 53–60. [Google Scholar] [CrossRef]
  41. Larkin, M.A.; Blackshields, G.; Brown, N.P.; Chenna, R.; McGettigan, P.A.; McWilliam, H.; Valentin, F.; Wallace, I.M.; Wilm, A.; Lopez, R. Clustal W and Clustal X version 2.0. Bioinformatics 2007, 23, 2947–2948. [Google Scholar] [CrossRef] [Green Version]
  42. Thompson, J.D.; Gibson, T.J.; Plewniak, F.; Jeanmougin, F.; Higgins, D.G. The ClustalX windows interface: Flexible strategies for multiple sequence alignment aided by quality analysis tools. Nucleic Acids Res. 1997, 25, 4876–4882. [Google Scholar] [CrossRef] [Green Version]
  43. Hall, T. BioEdit: An important software for molecular biology. Gerf. Bull. Biosci. 2011, 2, 60–61. Available online: https://www.researchgate.net/publication/258565830 (accessed on 4 January 2019).
  44. Librado, P.; Rozas, J. DnaSP v5: A software for comprehensive analysis of DNA polymorphism data. Bioinformatics 2009, 25, 1451–1452. [Google Scholar] [CrossRef] [PubMed] [Green Version]
  45. Tajima, F. Statistical method for testing the neutral mutation hypothesis by DNA polymorphism. Genet. Soc. Am. 1989, 123, 585–595. Available online: https://www.ncbi.nlm.nih.gov/pmc/articles/PMC1203831/ (accessed on 13 August 2019).
  46. Excoffier, L.; Lischer, H.E.L. Arlequin suite ver 3.5: A new series of programs to perform population genetics analyses under Linux and Windows. Mol. Ecol. Resour. 2010, 10, 564–567. [Google Scholar] [CrossRef] [PubMed]
  47. Tamura, K.; Stecher, G.; Peterson, D.; Filipski, A.; Kumar, S. MEGA6: Molecular Evolutionary Genetics Analysis version 6.0. Mol. Biol. Evol. 2013, 30, 2725–2729. [Google Scholar] [CrossRef] [PubMed] [Green Version]
  48. Drummond, A.J.; Rambaut, A. BEAST: Bayesian evolutionary analysis by sampling trees. BMC Evol. Biol. 2007, 7, 214. [Google Scholar] [CrossRef] [PubMed] [Green Version]
  49. Posada, D. Chapter 6. Unit 6.5. Using MODELTEST and PAUP* to select a model of nucleotide substitution. In Current Protocols in Bioinformatics; Bateman, A., Draghici, S., Eds.; John Wiley & Sons, Inc.: Hoboken, NJ, USA, 2003. [Google Scholar] [CrossRef]
  50. David, P. ModelTest Server: A web-based tool for the statistical selection of models of nucleotide substitution online. Nucleic Acids Res. 2006, 34, 700–703. [Google Scholar] [CrossRef]
  51. Stöger, I.; Sigwart, J.D.; Kano, Y.; Knebelsberger, T.; Marshall, B.A.; Schwabe, E.; Schrödl, M. The continuing debate on deep molluscan phylogeny: Evidence for Serialia (Mollusca, Monoplacophora + Polyplacophora). Biomed. Res. Int. 2013, 2013, 407072. [Google Scholar] [CrossRef]
  52. Meyer, C.P.; Paulay, G.G. Fine Scale Endemism on Coral Reefs: Archipelagic Differentiation in Turbinid Gastropods. Evolution 2005, 59, 113–125. [Google Scholar] [CrossRef]
  53. Ronquist, F.; Teslenko, M.; Van der Mark, P.; Ayres, D.L.; Darling, A.; Höhna, S.; Larget, B.; Liu, L.; Suchard, M.A.; Huelsenbeck, J.P. MrBayes 3.2: Efficient Bayesian phylogenetic inference and model choice across a large model space. Syst. Biol. 2012, 61, 539–542. [Google Scholar] [CrossRef] [Green Version]
  54. Guindon, S.; Dufayard, J.F.; Lefort, V.; Anisimova, M.; Hordijk, W.; Gascuel, O. New algorithms and methods to estimate maximum-likelihood phylogenies: Assessing the performance of PhyML 3.0. Syst. Biol. 2010, 59, 307–321. [Google Scholar] [CrossRef] [Green Version]
  55. Bandelt, H.J.; Forster, P.; Rohl, A. Median-joining networks for inferring intraspecific phylogenies. Mol. Biol. Evol. 1999, 16, 37–48. [Google Scholar] [CrossRef] [PubMed]
  56. Cunha, T.J.; Lemer, S.; Bouchet, P.; Kano, Y.; Giribet, G. Putting keyhole limpets on the map: Phylogeny and biogeography of the globally distributed marine family Fissurellidae (Vetigastropoda, Mollusca). Mol. Phylogenet. Evol. 2019, 135, 249–269. [Google Scholar] [CrossRef] [PubMed]
  57. Schulze, A. Phylogeny and Genetic Diversity of Palolo Worms (Palola, Eunicidae) from the Tropical North Pacific and the Caribbean. Biol. Bull. 2006, 210, 25–37. [Google Scholar] [CrossRef]
  58. Li, H.; Zhang, J.; Yuan, X.; Zhang, A.; Liu, G.; Shao, K.; Wang, L. Genetic diversity and differentiation of seven geographical populations of hard clam (Meretrix, meretrix) assessed by COI and microsatellite markers. Acta Ecol. Sin. 2016, 36, 499–507. [Google Scholar] [CrossRef]
  59. Wu, X.; Zhang, H.; Yu, H.; Peng, X.; Zhang, Y. Genetic polymorphisms of Liolophura japonica among the southern of Zhejiang Province based on DNA barcoding. Mar. Fish. 2018, 40, 265–278. [Google Scholar] [CrossRef]
  60. Hupalo, K.; Teixeira, M.A.L.; Rewicz, T.; Sezgin, M.; Iannilli, V.; Karaman, G.S.; Grabowski, M.; Costa, F.O. Persistence of phylogeographic footprints helps to understand cryptic diversity detected in two marine amphipods widespread in the Mediterranean basin. Mol. Phylogenet. Evol. 2018, 132, 53–66. [Google Scholar] [CrossRef]
  61. Rumisha, C.; Mdegela, R.H.; Gwakisa, P.S.; Kochzius, M. Genetic diversity and gene flow among the giant mud crabs (Scylla serrata) in anthropogenic-polluted mangroves of mainland Tanzania: Implications for conservation. Fish. Res. 2018, 205, 96–104. [Google Scholar] [CrossRef]
  62. Wright, S. Evolution and the genetics of populations. Vol. 1. Genetic and biométrie foundations. Biometrics 1968, 25. [Google Scholar] [CrossRef]
  63. Wright, S. A Second Installment. (Book Reviews: Evolution and the Genetics of Populations. Vol. 2, The Theory of Gene Frequencies). J. Biosoc. Sci. 1970, 168, 722–723. [Google Scholar] [CrossRef]
  64. Wright, S. Evolution and the genetics of populations. Volume 3. Experimental results and evolutionary deductions. Syst. Bot. 1977, 59, 815–826. [Google Scholar] [CrossRef]
  65. Todt, C.; Okusu, A.; Schander, C.; Schwabe, E. Chapter 4. Solenogastres, Caudofoveata, and Polyplacophroa. In Phylogeny and Evolution of the Mollusca; Ponder, W.F., Lindberg, D.R., Eds.; University of California Press: Berkeley, CA, USA, 2008; pp. 71–96. [Google Scholar]
  66. Buckland-Nicks, J.; Gibson, G. Chapter 13. Phylum Mollusca: Polyplacophora, Aplacophora, and Scaphopoda. In Atlas of Marine Invertebrate Larvae; Yong, C.M., Sewell, M.A., Rice, M.E., Eds.; Academic Press: New York, NY, USA, 2001; pp. 245–260. [Google Scholar]
  67. Eernisse, D.; Reynolds, P. Chapter 3. Polyplacophora. In Microscopic Anatomy of Invertebrates; Harrison, F.W., Kohn, A.J., Eds.; Wiley-Liss: New York, NY, USA, 1994; pp. 56–110. [Google Scholar]
  68. Pearse, J. Polyplacophora. In Reproduction in Marine Invertebrates; Giese, A.C., Pearse, J.S., Eds.; Pelecypods and Lesser Classes; Academic Press, Inc.: New York, NY, USA, 1979; pp. 27–85. [Google Scholar]
  69. Wang, P. The ice-age China sea—Status and problems. Quat. Sci. 1990, 2, 111–124. [Google Scholar]
  70. ECCBR. China Bay Records; Ocean Press: Beijing, China, 1993. [Google Scholar]
  71. Zhang, X.; Qi, Z.; Zhang, S.; Ma, X. A preliminary study of the demarcation of marine molluscan faunal regions of China and its adjacent waters. Oceanol. Limnol. Sin. 1963, 5, 124–138. [Google Scholar]
  72. O’Connor, M.I. Warming strengthens an herbivore–plant interaction. Ecology 2009, 90, 388–398. [Google Scholar] [CrossRef] [PubMed]
  73. Beniash, E.; Ivanina, A.; Lieb, N.S.; Kurochkin, I.; Sokolova, I.M. Elevated level of carbon dioxide affects metabolism and shell formation in oysters Crassostrea virginica (Gmelin). Mar. Ecol. Prog. 2010, 419, 95–108. [Google Scholar] [CrossRef]
  74. Avise, J.C.; Neigel, J.E.; Arnold, J. Demographic influences on mitochondrial DNA lineage survivorship in animal population. J. Mol. Evol. 1984, 20, 99–105. [Google Scholar] [CrossRef]
  75. Fu, Y.X. Statistical tests of neutrality of mutations against population growth, hitchhiking and background selection. Genetics 1997, 147, 915–925. [Google Scholar] [CrossRef]
  76. Zhang, R.; Leng, P.; Wang, X.; Zhang, Z. Molecular analysis and genetic diversity of Aedes albopictus (Diptera, Culicidae) from China. Mitochondrial DNA Part A 2017, 29, 1–6. [Google Scholar] [CrossRef]
  77. Jing, C.; Liu, H. On the glacial and interglacial stages in quaternary of China. J. Chengdu Univ. Technol. 1999, 26. [Google Scholar] [CrossRef]
  78. Kong, L.; Li, Q. Genetic evidence for the existence of cryptic species in an endangered clam Coelomactra antiquata. Mar. Biol. 2009, 156, 1507–1515. [Google Scholar] [CrossRef]
  79. Xu, J.; Chan, T.Y.; Tsang, L.M.; Chu, K.H. Phylogeography of the mitten crab Eriocheir sensu stricto in East Asia: Pleistocene isolation, population expansion and secondary contact. Mol. Phylogenet. Evol. 2009, 52, 45–56. [Google Scholar] [CrossRef]
  80. Liu, H.; Liu, M.; Ge, S.; Wang, Q.; Yu, D.; Guan, S. Population structuring and historical demography of a common clam worm Perinereris aibuhitensis near the coasts of Shandong Peninsula. Biochem. Syst. Ecol. 2012, 44, 70–78. [Google Scholar] [CrossRef]
  81. Ni, G. Phylogeography of four marine bivalves along China’ coastline with views into the evolutionary processes and mechanisms. Ph.D. Thesis, Ocean University of China, Qingdao, China, 2013. [Google Scholar] [CrossRef]
  82. Zhao, L.; Chen, M. Risk zoning of economic loss caused by storm surge in coastal provinces and cities of China. J. Nat. Disasters 2011, 20, 100–104. [Google Scholar] [CrossRef]
Figure 1. Sampling localities of A. rubrolineatus included in our analyses.
Diversity 12 00159 g001
Figure 2. Phylogenetic tree based on combined sequences of COI and 16S rRNA segments of A. rubrolineatus. The posterior probability values of the Bayesian method (before the slash) and the bootstrap values of the ML method (after the slash) were showed.
Diversity 12 00159 g002
Figure 3. Median-joining haplotype network based on combined sequences of COI and 16S rRNA segments of A. rubrolineatus. Colors of localities correspond to those in Figure 1, and circle size is proportional to the number of individuals with the same haplotype. The distribution of all haplotypes was also given in Table S2.
Diversity 12 00159 g003
Figure 4. Bayesian tree based on 28S-rRNA sequences of A. rubrolineatus. The posterior probability values were showed.
Diversity 12 00159 g004
Table 1. Sample information in this paper.
LocalityAbbreviationNumbersLongitude and Latitude
DalianDL3038°86′N, 121°56′E
YantaiYT3037°53′N, 121°43′E
WeihaiWH3036°88′N, 122°44′E
QingdaoQD3036°06′N, 120°32′E
LianyungangLYG3034°70′N, 119°49′E
ZhoushanZS3029°92′N, 122°41′E
YuhuanYH3028°07′N, 121°29′E
XiamenXM2824°43′N, 118°16′E
Table 2. Genetic diversity parameters based on COI and 16S rRNA sequences of A. rubrolineatus.
LocalityhSHdπTajima’ DFu’s Fs
Northern groupDL20430.9590.009870.00822−3.477
YT21370.9430.00743−0.59889−6.558
WH17440.9220.00742−0.96299−2.432
QD191360.9080.01059−2.61845 ***−2.368 **
LYG13370.6480.00389−2.08043 *−2.388 *
Southern groupZS18190.8900.00152−2.24605 **−18.181 **
YH17160.8410.00171−2.01532 *−14.609
XM131300.7200.00980−2.76645 ***0.813 **
Northern group581770.8580.00871−2.34182 **−28.505 **
Southern group341400.6390.00379−2.93430 ***−21.671 **
All922490.8890.03310−1.01579−8.042 **
Number of haplotype (h), number of segregating sites (S), haplotype diversity (Hd), nucleotide diversity (π), * p < 0.05, ** p < 0.02, *** p < 0.001.
Table 3. Kimura 2-parameter model distance (above diagonal) and fixation index (FST) (below diagonal) between localities based on the combined sequences of COI and 16S rRNA segments of A. rubrolineatus. Values in the diagonal with a bold font are average K2P distances within geographic populations.
LocalityDLYTWHQDLYGZSYHXM
DL0.010960.011620.011820.014890.012230.061420.061060.06339
YT0.062410.007330.007490.008850.006040.064630.064230.06651
WH0.07094−0.020710.008040.009180.006370.064400.064010.06631
QD0.139110.016590.048930.009880.006920.068380.067970.07025
LYG0.119150.000160.010290.037330.004140.065720.065310.06761
ZS0.678270.714710.736690.693320.727980.001010.001050.00577
YH0.689570.725690.748350.702490.73939−0.023320.001070.00579
XM0.594670.632000.649870.618160.64653−0.01641−0.007910.01050

