Abstract
Dynamic loss is significant for evaluating the performance of type-II high-temperature superconductor (HTS) coated conductors (CC), especially when used in electric machines. Although analytical expressions of dynamic loss have been proposed and verified for HTS CCs exposed to low external magnetic fields with a low current load rate, the non-linearity of dynamic loss at high current load ratios and simultaneous high magnetic fields is still unclear and cannot be predicted by the existing analytical equations. This paper proposes a completely new formulation to characterize the non-linearity of dynamic loss taking into account the Jc(B) dependence of CCs, which can be used for full ranges of both magnetic fields and current load ratios. The proposed analytical formulas have been verified by a T-formulation based numerical model and experiments. This paper comprehensively demonstrates the variation of dynamic loss and provides a meaningful reference of loss controlling for HTS CCs, which is vital for HTS machine windings to avoid quench.
Export citation and abstract BibTeX RIS

Original content from this work may be used under the terms of the Creative Commons Attribution 4.0 licence. Any further distribution of this work must maintain attribution to the author(s) and the title of the work, journal citation and DOI.
1. Introduction
Dynamic loss has prompted widespread concern recently in the domains related to second generation (2G) high-temperature superconductor (HTS) coated conductors (CC) [1–5]. It is generated when HTS CCs carry a direct current (DC) in an alternating current (AC) magnetic field, which is tightly relevant for machine windings and other power applications. The widely adopted analytical expression for dynamic loss per unit time, Qdyn,l, can be written as [4]

where w is the half-width of the HTS CC, f is the frequency of the AC magnetic field, L is the length of the CC, It represents the transport current, and i denotes the load ratio between It and the self-field critical current, Ic0. Bext is the amplitude of the external AC magnetic field, and Bth is the threshold field, defined by [6]

where μ0 is the free space permeability, h is the thickness of the HTS thin film, and Jc0 is the critical current density in self-field, determined by Ic0/(2wh).
The linearity of dynamic loss with respect to Bext, as shown in (1), has been well verified by many studies [7–9]. However, recent experimental measurements have shown that, when the HTS CC with a high i is exposed to a high external magnetic field, the dynamic loss exhibits a non-linearity with the augmentation of field intensity and the CC is under the risk of quench [10–12]. A critical-state model for dynamic resistance has been proposed to describe this non-linearity in [8]. When Bext is far greater than Bth, dynamic loss can be written as [8]

where B0 is a constant depending on the material property.
However, it appears that the measured dynamic resistance rises much faster than the analytical results obtained by (3) [8]. Therefore, for now, the existing analytical expressions are inapplicable to characterize the non-linearity of dynamic loss, and the magnetic field and current load ratio causing the sudden rise in loss are still unclear. In [9], a time-averaged DC flux flow resistance has been introduced to explain the non-linear fast rise of dynamic resistance, which provides a good description of the deviation from linearity at high currents. On the basis of this work, we have studied the current density and magnetic flux density distributions inside the HTS CC in detail, and propose a new formulation for dynamic loss, which considers a full-range of magnetic fields and load ratios. This paper helps better understand the variation properties of dynamic loss from the perspective of theoretical fundamentals and determine its influencing factors, which is significant for avoiding quench in HTS machine windings, etc.
2. New formulation of dynamic loss
When a HTS CC carries a DC transport current under an AC magnetic field, the transport current occupies the superconducting layer with width 2iw in the center of the CC (named dynamic region), leaving the rest with width 2(1−i)w free on both sides [10]. Therefore, the dynamic loss per unit time can be formulated by

where E represents the electric field, and J is the current density along the width of the coated conductor.
Considering the field dependence of the critical current density Jc (B) [8]

and the E-J power law

(4) can be transformed to

with

where E0 = 10−4 V m−1, B⊥ is the local magnetic field perpendicular to the wide surface of the CC. B⊥ is decided by both Bext and the self-field Bs. The negative sign indicates the direction of the field vector.
Although the current density and magnetic distribution along the width of the CC has been studied by Brandt, it is not feasible to calculate the integration in (7) directly by analytical methods [13]. However, the non-linear fast rise of dynamic loss occurs when the real load ratio It/Ic(B) is approaching 1, i.e., when the CC is in a critical state. In this case, we can simplify (7) by investigating the current density and magnetic flux density characteristics in the dynamic region.
Firstly, the J properties need to be studied. According to the Bean Model, when the superconductor is in a critical state, the current density distribution along the width of the HTS CC should be characterized by the critical current ±Jc. Here, concerning dynamic loss, we assume that the dynamic region is fully occupied by It. To verify this assumption, the T-formulation based numerical modeling method has been adopted here [14, 15]. We define the average current density during one cycle T in the dynamic region, Javg, as

During the simulation, the transport current It has been fixed as 60 A. When Ic0 decreases from 160 A to 80 A (i.e. i increases from 0.375 to 0.75), the relationship between i and Javg/Jt under different Bext is presented in figure 1. Here, Jt is the average current density determined by the transport current, with Jt = It/(2wh). It can be seen that with the increase of i, Javg will get close to Jt. In other words, the dynamic region with the width of 2iw is the effective region to carry transport current and in the critical state, the dynamic region has been filled with It. Therefore, the current density distribution in the dynamic region should be decided by Jt.
Figure 1. The relationship between Javg/Jt and i under different Bext varying from 60 to 140 mT. Transport current It = 60 A.
Download figure:
Standard image High-resolution imageNext, the magnetic flux density properties in the dynamic region need to be explored. In (8), Bs at any position inside the dynamic region, y0, is decided by

with (1−i)w ≤ y0 ≤ (1 + i)w.
Based on the above analysis, J(y) is determined by Jt, so (10) can be simplified as

Then the average self-field flux density in the dynamic region can be calculated by

According to (2), it is evident that Bth decreases with i. Therefore, at a high load rate, Bs becomes much smaller compared to Bext, i.e. B⊥ will be dominated by the external field. In this case, we have

Based on the above formulas, (7) can be transformed to

with the average of f (B) defined as


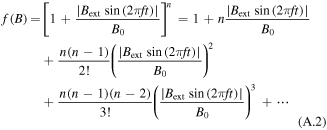
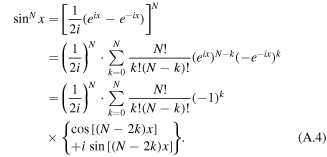
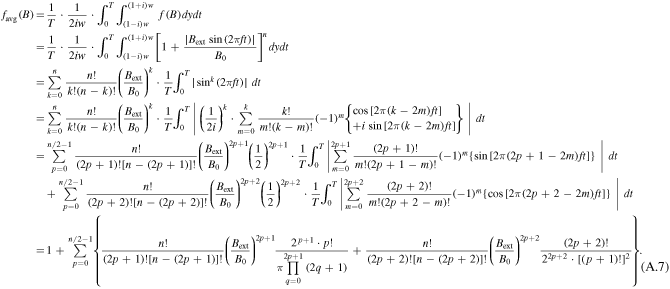
Based on binomial theorem and Euler's formula, through a series of derivations, the details of which can be found in appendix, (14) can be written as (16). It should be emphasized that Qdyn,nl in (16) is derived on the basis that the HTS CC is at relatively high i and simultaneous high Bext, which can only be used to characterize the non-linearly fast-rising part of the Qdyn(Bext) curve. In (1), Qdyn,l is used to describe the linear correlation between dynamic loss and Bext. There will be a cross point between the Qdyn,l(Bext) and Qdyn,nl(Bext) curves as at low external magnetic field, Bext is much smaller than B0, thus the n-value does not play an important role and Qdyn,nl will approach 0. However, at high external field, Bext becomes comparable to B0, then under the influence of the n-value, Qdyn will increase rapidly in the form of a power function. In short, before the cross point, Qdyn,l is far greater than Qdyn,nl, and vice versa. On the basis of the above analysis, we have proposed a full-range analytical equation for calculating dynamic loss, as (17). It should be noted that, in (17) n is even. When n is odd, we need to modify the upper bound of summation accordingly. To verify the correctness of (17), both numerical modeling and experimental methods have been adopted. In addition, based on the time-averaged DC flux-flow resistance term mentioned in [9], Qdyn can also be fitted by

3. Validation methods
3.1. Numerical modelling
The numerical model of the HTS CC was developed by use of finite element method based on the T-formulation [14, 15]. The diagram of the modelled HTS CC is shown as figure 2. The governing equation can be written as [4]

where len is the width of each element, Tene is the current vector potential in each element, ren is the distance between the current source element and the calculation point, nʹ is the normal vector at the current source element, n is the normal vector at the calculation point, and σ is the equivalent conductivity determined by the E-J power law, σ = J/E.
Figure 2. Diagram of the modelling of a HTS CC based on T-formulation by use of finite element method.
Download figure:
Standard image High-resolution image3.2. Experiment
Two measurement systems were used for the experimental results [3, 9]. One of the experimental setups for measuring Qdyn is shown in figure 3. It is composed of a custom-built AC magnet, which can produce a flux density up to 100 mT, a DC power supply which provides It varying between 0–240 A, a nano-voltage meter for averaged voltage measuremnt across the voltage taps attached on the middle of the sample conductor, and a cryostat containing liquid nitrogen. Qdyn is obtained by multiplying the measured voltage across the sample with the transport current.
Figure 3. Schematic of the experimental setup to measure the dynamic loss of a HTS CC.
Download figure:
Standard image High-resolution imageTwo different YBCO CCs have been tested, of which the specifications are shown in table 1.
Table 1. Specifications for tested HTS CCS.
| Value | |||
|---|---|---|---|
| Symbols | Parameters | Sample 1 | Sample 2 |
| w | half width of the CC | 2 mm | 2 mm |
| hHTS | YBCO film thickness | 1 μm | 1 μm |
| Ic0 | critical current in self-field | 105.3 A | 87.67 A |
| It | transport current | 95 A | 79 A |
| n | n-value | 23 | 22 |
| f | frequency of the AC field | 26.62 Hz | 67.89 Hz |
| B0 | magnetic field constant | 0.135 T | 0.17 T |
| To | operating temperature | 77 K | |
| E0 | characteristic E-field | 10−4 V m−1 | |
| μ0 | free space permeability | 4π × 10−7 H m−1 | |
4. Results and analyses
For the HTS CCs with different Ic0 varying from 80 to 160 A while carrying It = 60 A, they are exposed to AC external magnetic fields with increasing amplitude between 10–500 mT. The simulated Qdyn (solid symbols) and the analytical results calculated by (1) (short dash lines), (16) (dash-dot lines), (17) (solid lines) as well as (18) (dash lines) are depicted together in figure 4.
Figure 4. Dynamic loss of HTS CCs with different Ic0 when changing Bext from 0–500 mT, at 50 Hz.
Download figure:
Standard image High-resolution imageIt shows that there exists a cross-field between the Qdyn,l(Bext) and Qdyn,nl(Bext) curves, as mentioned above. Before the cross-field, Qdyn(Bext) agrees well with (1), which shows a linear correlation. After the cross-field, Qdyn(Bext) is in good accordance with (16), which is in the form of a summation of power functions. In general, the simulated Qdyn(Bext) agrees well with (17) in the full magnetic field range. Although (18) also describes the non-linearity of Qdyn, it appears to be much larger in terms of value. (17) has been derived through a rigorous process, providing a more accurate result. Furthermore, (18) is given based on the estimation of the time-average DC flux flow resistance, which cannot intuitively account for the non-linearity of Qdyn in the form of a summation of power functions. With regard to the cross-field, it increases inversely with i. In fact, for a lower i the CC has a larger capacity to withstand the induced current by the external magnetic field, thus it will be harder for It to go beyond the real critical current Ic(B). Therefore, the cross-field increases with Ic0 for a fixed It, which complies with the Jc(B) dependence and the conclusions drawn in [4].
The simulated Qdyn based on T-formulation, the measured experimental data, and the analytical results obtained by (1), (3), (16) and (17) for the two tested CC samples are presented together in figure 5. It can be found that the experimental data is in good agreement with the simulation results and the proposed equation (17). The Qdyn(Bext) curve exhibits an evident non-linearity with the increase of the external magnetic field, which is significantly different from the previously widely-adopted analytical equations (1) and (3). It should be pointed out that the relatively poor agreement between the simulation and experiment at low magnetic fields for the CC sample with Ic0 = 87.67 A is due to its effective width, which is different from its physical width [3]. However, it does not affect the validity of (17), in that it describes well the non-linearity of Qdyn under high magnetic fields.
Figure 5. Simulated, measured and analytical dynamic loss of two different HTS CCs. The results in red are for the CC with Ic0 = 105.3 A, and those in blue are for the CC with Ic0 = 87.67 A. According to [3], the effective width of the CC with Ic0 = 87.67 A has been chosen as 2w = 3.51 mm.
Download figure:
Standard image High-resolution imageWith respect to computational complexity, analytical methods generally require far less computing time and resources than the finite element method (FEM) based numerical modelling. In our case, (17) can be simply calculated in a few seconds using MATLAB. However, it requires more time and effort to build and run a FEM model. For example, the computational time to obtain Qdyn of a single HTS layer with the T-formulation based numerical model is tens of seconds or longer, depending on the solving accuracy and number of mesh elements. Therefore, the proposed formulation (17) is a more efficient and convenient way to calculate dynamic loss compared with numerical models.
5. Conclusion
Based on the Jc(B) dependence and E-J power law, through investigation of the characteristics of current density and magnetic flux density distributions in the dynamic region of HTS CCs, a new analytical expression for dynamic loss has been proposed. This expression considers a full-range of magnetic fields and load ratios. At low external fields and simultaneous low load ratios, dynamic loss is in a linear correlation with the external magnetic field. At both high magnetic fields and high load ratios, it is in the form of a summation of power functions. This new formulation can be used to characterize the non-linear variation of dynamic loss, which cannot be accurately predicted and explained by the existing analytical methods. The proposed formulas have been well verified by the T-formulation based numerical modeling method and experiments, which can be achieved in MATLAB and dramatically save computational effort compared with numerical modelling methods. The cross-field has also been studied, of which the variation complies well with the Jc(B) dependence. This paper comprehensively demonstrates the variation of dynamic loss at different load ratios and magnetic fields. It can serve as a guide for loss controlling and avoiding quench in the application of HTS CCs, especially with regards to machine windings.
Acknowledgments
This work was supported by the joint scholarship from the University of Edinburgh and China Scholarship Council (CSC) under Grant [2018] 3101.


