


1. Introduction
Black carbon (BC) is mainly produced by the incomplete combustion of fossil fuels and biomass. It can strongly absorb solar radiation at visible wavelengths and reduce albedo, thus causing warming effects (Ramanathan and Carmichael, Reference Ramanathan and Carmichael2008; Bond and others, Reference Bond2013). Mineral dust (MD) is the main constituent of light-absorbing impurities (LAIs) that can also increase the absorption of solar radiation and induce the albedo reduction (Wang and others, Reference Wang, Doherty and Huang2013; Di Mauro and others, Reference Di Mauro2015). Once these LAIs are deposited on the snow/ice surface of a glacier they can reduce the albedo, accelerate snow/ice melt, and trigger an albedo feedback (Flanner and others, Reference Flanner, Zender, Randerson and Rasch2007; Xu and others, Reference Xu2009; Bond and others, Reference Bond2013; Kaspari and others, Reference Kaspari, Painter, Gysel, Skiles and Schwikowski2014; Gertler and others, Reference Gertler, Puppala, Panday, Stumm and Shea2016). A reduction in albedo increases the absorption of shortwave radiation, which accelerates melt rates, reduces snow cover duration, alters glacier mass balance and contributes to the retreat of mountain glaciers (Xu and others, Reference Xu2009; Yasunari and others, Reference Yasunari2010; Jacobi and others, Reference Jacobi2015).
The Tibetan Plateau is a unique geographical region, where a large proportion of glaciers have been undergoing extensive melting and shrinking (Xu and others, Reference Xu2009; Kang and others, Reference Kang2010; Bolch and others, Reference Bolch2012; Yao and others, Reference Yao2012a). This shrinkage may have severe consequences for runoff from Tibetan Plateau glaciers, which are the headwaters of major rivers in Asia (Fig. 1). The glaciers in the region are also known as water towers because they play an essential role on the regional climate feedback, hydrological cycle and fresh water supply to downstream populations (Immerzeel and others, Reference Immerzeel, van Beek and Bierkens2010; Yao and others, Reference Yao2012b; Tripathee and others, Reference Tripathee2016). Studies on the Tibetan Plateau and its surroundings have shown that relatively small concentrations of BC can exert radiative forcing efficiently through albedo reduction, resulting in glacier melt (Ming and others, Reference Ming, Xiao, Du and Yang2013, Reference Ming2015; Yang and others, Reference Yang, Xu, Cao, Zender and Wang2015; Gertler and others, Reference Gertler, Puppala, Panday, Stumm and Shea2016; Schmale and others, Reference Schmale2017). The spatial distribution and concentration of BC and MD on glaciers is a function of emission sources, the distance and travel time, and deposition processes (Ming and others, Reference Ming2009). Despite the importance of BC and MD to climate forcing, estimates of the albedo reduction/glacier melt caused by BC and MD remain uncertain because of the sparse in situ observations and the complex interactions of BC and MD on albedo (Flanner and others, Reference Flanner, Zender, Randerson and Rasch2007; Yasunari and others, Reference Yasunari2010; Kaspari and others, Reference Kaspari, Painter, Gysel, Skiles and Schwikowski2014; Qian and others, Reference Qian2015; Gertler and others, Reference Gertler, Puppala, Panday, Stumm and Shea2016).
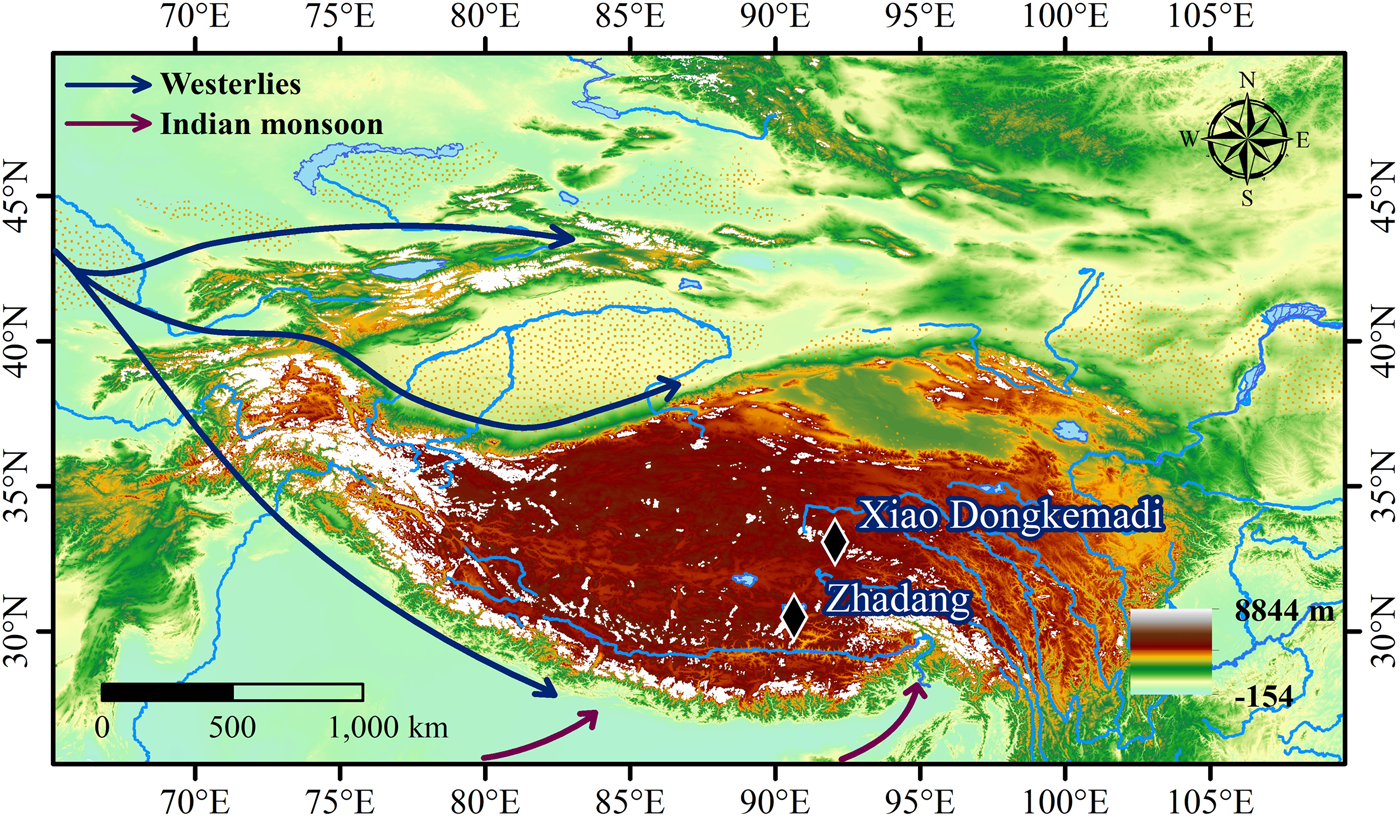
Fig. 1. Location map of studied glaciers on the central Tibetan Plateau.
To our knowledge, only a few studies have focused on how LAIs affect and alter the glacier surface albedo, radiative forcing, and glacier melt. Furthermore, uncertainties exist on how BC and MD affect glacier melt, also due to the limited or lack of in situ observations from the glacier melting conditions at high altitudes. Therefore, extensive in situ observations are urgently needed to better understand the impact of the BC and MD on glacier melt. In this study, (1) BC and MD concentrations are measured from snow and ice samples collected at Xiao Dongkemadi and Zhadang glaciers on the central Tibetan Plateau; (2) changes in surface albedo and radiative forcing are estimated from observed BC and MD using the SNow ICe Aerosol Radiative (SNICAR) model; (3) a melt model based on prescribed albedo changes and in situ radiation data are used to quantify the potential impact of BC and MD on snow and ice melt; and (4) the origins of BC and MD are traced using backward airmass trajectories and Lagrangian footprint analysis.
2. Materials and methods
2.1. Description of research sites
The Xiao Dongkemadi Glacier (33°04′N, 92°04′E) is located on the northern slope of the Tanggula Mountains, on the central Tibetan Plateau. Xiao Dongkemadi Glacier is a south-west facing glacier, with an area of ~1.6 km2 (Gao and others, Reference Gao, He, Ye and Pu2012). The elevations of the summit and the terminus of the glacier are 5926 and 5420 m a.s.l., respectively, and the equilibrium line altitude (ELA) is ~5620 m a.s.l. (Li and others, Reference Li2017). The surface of the glacier is very smooth, with only a few crevasses and no icefall (Fig. S1a).
The Zhadang Glacier (30°48′N, 90°65′E), with an area of 2.0 km2 and length of 2.2 km (Zhang and others, Reference Zhang2013), is located on the northeastern slope of the Nyainqêntanglha mountain range on the central Tibetan Plateau. It is a small valley-type glacier. The glacier faces north-northwest and spans an elevation range of 5515–6090 m a.s.l. It is debris-free, with a fan-shaped terminus (Chen and others, Reference Chen, Kang, Zhang and You2009) (Fig. S1c).
Both glaciers are influenced by the Indian monsoon and mid-latitude westerlies (Gao and others, Reference Gao, He, Ye and Pu2012; Mölg and others, Reference Mölg, Maussion, Yang and Scherer2012) (Fig. 1). A pronounced precipitation maximum in summer and minimum in November and December is a characteristic feature of the central Tibetan Plateau (Maussion and others, Reference Maussion2013). Both accumulation and ablation seasons coincide in summer, thus making the albedo feedback crucial for the glacier mass balance (Fujita and others, Reference Fujita, Ohta and Ageta2007; Fujita, Reference Fujita2008a, Reference Fujita2008b).
2.2. Samples collection and laboratory analysis
During the summer ablation season, three types of samples, such as fresh snow (fine grains), aged snow (medium grains) and granular ice (coarse grains) (Fig. S2), which represent different melting conditions, were collected from the mainstream line of the Xiao Dongkemadi and Zhadang glaciers between May and October 2015 (Figs S1b, d).
Samples were collected facing the wind, and a dust-proof garment with a head-and-mouth mask and gloves were used during sample collection. For surface snow, 1–2 L (nonmelted) samples were collected from 0 to 5 cm below the surface. Samples were collected with a stainless steel spoon and stored in Whirl-pak® bags (B01323WA, NASCO, USA) (Li and others, Reference Li2017). Granular ice samples were excavated using a cleaned ice axe from the upper 0–5 cm granular ice surface, and then stored in Whirl-pak® bags by using a stainless-steel spoon. All samples were transported in the frozen state to the State Key Laboratory of Cryospheric Sciences, Northwest Institute of Eco-Environment and Resources in Lanzhou and kept frozen until laboratory analysis. Information on the sampling sites is listed in Table S1.
In the laboratory, the snow and ice samples were melted (~1000 mL) at room temperature and immediately filtered through 47 mm diameter pre-combusted (550°C, 6 h) quartz fiber filters (QM/A, Whatman, UK) using a vacuum pump (Li and others, Reference Li2018). Before analysis, the filters were dried in the oven at 50°C for 24 h to eliminate the water vapor. OC and BC on the filters were measured using a Desert Research Institute Model 2001A Thermal/Optical Carbon analyzer following the IMPROVE TOR protocol (Chow and others, Reference Chow1993; Cao and others, Reference Cao2003). The mass of insoluble MD in the snow samples was calculated by weighing the filter before and after filtration using a microbalance (accuracy: 0.1 mg). The measured concentrations of BC and MD are listed in Tables S2, S3, respectively.
2.3. Aerosol optical depth
Aerosol optical depth (AOD) at 550 nm between May and October 2015 over the Tibetan Plateau and its surroundings were obtained by the Moderate Resolution Imaging Spectroradiometer (MODIS) that operates from the Terra satellite. MODIS AOD fields were derived using dark target algorithms, whereby the temporal and spatial resolution are monthly and one-degree, respectively. The data were obtained from http://giovanni.sci.gsfc.nasa.gov.
2.4. Determining reflectance and radiative forcing
The SNICAR model can be used to simulate the hemisphere albedo of snow and ice for unique combinations of impurity contents (e.g. BC, MD, volcanic ash), snow grain size and incident solar flux characteristics (Flanner and others, Reference Flanner, Zender, Randerson and Rasch2007). In a series of sensitivity analyses, the albedo variation at different melting conditions (fresh snow, aged snow and granular ice) on these glaciers were determined by entering different BC and MD concentrations and snow parameters into the SNICAR model. Additionally, based on the layer-specific snow types, effective grain sizes and snow density were specified for low, medium and high scenarios in the model run (Table 1). Details concerning the simulations of the surface albedo have been introduced in previous work (Li and others, Reference Li2017, Reference Li2018).
Table 1. Snow effective grain sizes and snow density used for the albedo sensitivity analysis with the SNICAR model on the central Tibetan Plateau glaciers

Note: Snow effective grain sizes and snow density data were cited from Judson and Doesken (Reference Judson and Doesken2000), Sjögren and others (Reference Sjögren2007), Zhang and others (Reference Zhang2017a), and based on a series observation in the Tibetan Plateau.
Based on the albedo calculation, radiative forcing induced by BC and MD can be obtained by Eqn (1) (Kaspari and others, Reference Kaspari, Painter, Gysel, Skiles and Schwikowski2014; Yang and others, Reference Yang, Xu, Cao, Zender and Wang2015):

where, α is the modeled snow/ice spectral albedo with/without the impurities (imp) of BC and/or MD; E is the spectral irradiance; r is the snow optical grain size; λ is the wavelength (μm), and θ is the solar zenith angle for irradiance.
2.5. Glacier melt estimation
To estimate the glacier melt due to BC and MD, a model (Schmale and others, Reference Schmale2017) was applied in which the absorptivity of the snow was multiplied by the daily average incoming short-wave radiation recorded at the automatic weather station (AWS) installed at the glaciers (Fig. S3). Additional factors derived from AWS data include:
(i) The number of days per month with an average temperature of ≥0°C, as a proxy for the number of days with snowmelt.
(ii) The number of days per month with snowfall (complete snow cover was assumed within 0.5 and 1 days depending on the air temperature).
(iii) The daily average solar shortwave insolation (used to calculate the energy flux at the surface).
To calculate the amount of glacier melt based on the enthalpy of fusion of water (Q efw = 334 J g−1), average albedo for each surface type as derived from the SNICAR model was used to calculate melt induced by fresh snow (MeltFresh snow, Eqn (2)), aged snow (MeltAged snow, Eqn (3)) and granular ice (MeltGranular ice, Eqn (4)). Total melt (MeltTotal) was calculated as the sum of melt from each surface type.


with
N Tlt0 = number of days with temperature >0°C on which snowfall occurred (d)
N Tht0 = number of days with temperature >0°C (d)
Δα 1 = albedo reduction by fresh snow (in decimal notation)
Δα 2 = albedo reduction by aged snow (in decimal notation)
Δα 3 = albedo reduction by granular ice (in decimal notation)
Q efw = the enthalpy of fusion of water (J g−1)
SW = shortwave radiation (W m−2)
sca = average snow-covered area (%, in decimal notation)
A range of albedo reduction scenarios, based on varying grain sizes and snow density (Table 1), were used to examine the range of BC and MD impacts on snow and ice melt.
2.6. Footprint analysis
To determine the probable source of the BC deposited on the Xiao Dongkemadi and Zhadang glacier, backward trajectories were calculated from both sites using European Center for Medium-Range Weather Forecasts (ECMWF) analysis wind fields with the Lagrangian analysis tool LAGRANTO (Wernli and Davies, Reference Wernli and Davies1997; Sprenger and Wernli, Reference Sprenger and Wernli2015). The ECMWF fields (horizontal and vertical wind components) were retrieved on 137 model levels and then interpolated onto a 0.25° × 0.25° latitude-longitude grid, while LAGRANTO trajectories were started with a temporal resolution of 6 hours. The 7-day backward trajectories were derived for the Xiao Dongkemadi and Zhadang glacier from May to October 2015. A potential trajectory divergence (uncertainty) was taken into account by varying the release altitude in 50-hPa steps and shifting the starting positions by ±0.5° in the east-west and north-south directions. As a result, the positions of the air parcels along the trajectories are available at a 6-hour temporal resolution.
For BC emissions from fire spots (open fires), the FINN v1.5 global fire emission inventory in 2013, speciated with the GEOS-chem mechanism (Wiedinmyer and others, Reference Wiedinmyer2011), was used to estimate BC emissions attributable to natural fires (Zhang and others, Reference Zhang2017a, Reference Zhang2017b). The fire inventory provides a daily and global fire emission product, and the spatial resolution of the inventory is ~1 km2. To qualitatively estimate whether fire emissions influence an air parcel at the measurement site, fire spots are counted along the backward trajectories. However, because the temporal resolution of the FINN inventory (1 day) does not coincide with that of the trajectories (6 hours), some assumptions have to be made. In particular, it is assumed that the fire emissions (or fire spots) are valid during a whole day and that these fire spots contribute to an air parcel along a trajectory if this parcel passes nearby. Further, it is assumed that fire spots within a certain distance can influence the air parcel. Thus, we tested the sensitivity of our results by applying a range of neighborhood criteria, specifically 50, 100, 150 and 200 km.
3. Results
3.1. Potential sources of BC and MD
3.1.1. Trajectories and BC contributions
Backward trajectories starting below 500 hPa are derived at the Xiao Dongkemadi and Zhadang glaciers from May to October 2015. This offers a simple assessment of source/receptor relationships at these two glaciers (Fig. 2). The back-trajectory analysis demonstrates that the nature of transport (long-range versus local) and the relative impact of fires varies considerably during the study period (May–October). Longer-range trajectories that cross fire activity in Pakistan and northern India occur through most of the study period. Local transport occurs mainly in August (Figs S4, S5).

Fig. 2. Backward trajectories starting at below 500 hPa launched over (a) Xiao Dongkemadi and (b) Zhadang glacier (Blue dots) and fire counts from May to October 2015. Black dots: the air parcels had ‘no contact’ to a fire within 96 hours before arriving at the study glaciers; Green dots: a fire will be passed in the 48 hours arriving at the study glaciers; Magenta dots: the air parcel had a fire contact between 48 and 96 hours before arriving at the study glaciers, but not during the 48 hours immediately before arrival; Yellow dots: air parcels having fire contact in the earlier and later time period; The color code gives the mean number of FINN 1.5 fire counts within a 0.25° × 0.25° gridbox, averaged over the period May–Oct 2015 and spatially smoothed with a 100 km filter radius (FINN 1.5 fire spots km−2).
Next, we determined for both glaciers the overall contributions from biomass (mainly from natural fires and straw burning) and nonbiomass (mainly from anthropogenic activities, such as fossil fuel combustion) sources of BC deposition. To this aim, the LAGRANTO footprints for natural fire BC emissions were calculated based on the FINN fire emission inventory for the period from May to October 2015 (Fig. 3). The attribution to fire is particularly high in May and October and it considerably decreased during August and September (Figs S6, S7). Furthermore, at the Zhadang Glacier, the link seems to be higher than at the Xiao Dongkemadi Glacier. During the May–October ablation season, between 20 and 30% of the calculated back-trajectories cross within 200 km of a recent (<96 h) fire. This suggests that fossil fuel combustion may represent a more important source of BC than biomass burning. However, our analysis is qualitative and subject to a number of uncertainties that have not been quantified here.

Fig. 3. Contributions of fire spots sourced BC emissions deposited at (a) Xiao Dongkemadi and (b) Zhadang glacier from May to October 2015. The different times correspond to the time in hours before the air parcels arrive at the measurement site, and the differently colored bars to the distance in km below which the fire has to be relative to the trajectory position. Fire crossing (%) represented the percentage of parcel trajectories that crossing at least one fire spot over a certain time period.
Figure 4 presents the wind speed (in colors) and the geopotential height (in lines) at 500 hPa from May to October 2015, based on ECMWF analysis data; The dots mark the position of the air parcels at 24, 60 and 96 h before arrival at the Xiao Dongkemadi and Zhadang glacier, whereby only air parcels arriving at 500 hPa at the glacier sites are included (as already discussed above). The mid-latitude jet stream is situated over the Tibetan Plateau in May and October (Figs S8, S9), which results in westerly air mass transport from the Middle East and Central Asia. From June to September, the Indian monsoon brings air from the south Asian subcontinent. However, back-trajectory analysis suggests that Siberian/northern China air masses may occasionally be brought into the region by northerly flows.

Fig. 4. Maps of wind speed, and the geopotential heights in the study region based on ECMWF analysis data from May to October 2015. The dots mark the position of the air parcels at 24, 60 and 96 hours before arrival at the measurement site. Only air parcels arriving at 500 hPa at the (a) Xiao Dongkemadi and (b) Zhadang glacier sites (Black dots) are included. Color bar represents the wind speed (m s−1), lines represent the geopotential heights (m2 s−2).
Based on the airmass trajectories and a large-scale atmospheric circulation, we concluded that dust aerosols (MD) primarily influenced the impurities deposited on the Xiao Dongkemadi and Zhadang glacier transported from the arid regions of the Middle East, Central Asia, and North China, while BC parcels were mainly transported to the Tibetan Plateau from South Asian countries. In summary, the regional atmospheric environment and large-scale circulation exerted a considerable impact on the glacier deposition of BC and MD (Dong and others, Reference Dong2016).
3.1.2. Implications for the central Tibetan Plateau glaciers
Bc and MD on the glaciers can darken the surface (reduce the albedo) and cause accelerated melting, threatening the survival of the glaciers (Ramanathan and Carmichael, Reference Ramanathan and Carmichael2008; Xu and others, Reference Xu2009). Previous studies (Wake and others, Reference Wake, Mayewski, Li, Han and Qin1994; Xu and others, Reference Xu, Yao, Liu and Wang2006; Kaspari and others, Reference Kaspari, Painter, Gysel, Skiles and Schwikowski2014; Yang and others, Reference Yang, Xu, Cao, Zender and Wang2015; Ming and others, Reference Ming, Xiao, Wang, Li and Li2016; Li and others, Reference Li2016b; Niu and others, Reference Niu2017) revealed the significant range of BC and MD concentrations among different glaciers in the Tibetan Plateau and its surrounding areas (Tables S4, S5). Concentrations of BC and MD in surface snow/ice on central Tibetan Plateau glaciers are typically higher than those on the southern Tibetan Plateau, but lower than those on the northern Tibetan Plateau (Fig. S10).
MODIS AOD data during May and October indicated that the aerosol depth in Central Asia and South Asia were much higher than in the other regions likely due to high concentrations of atmospheric pollutants (Fig. S11). The Middle East, Central Asia and northern China are characterized by arid and semi-arid climates with numerous deserts (Dong and others, Reference Dong2014). On the other hand, South Asia is a strong BC-emitting region (Bond and others, Reference Bond2004), where biomass burning and fossil fuel combustion are major sources of atmospheric pollutants (Li and others, Reference Li2016a). With the monsoon circulation and midlatitude westerlies, BC and MD emissions from the above regions could have significant impacts on the atmospheric environment on the central Tibetan Plateau through long-range transport and deposition (Fujita, Reference Fujita2007; Ming and others, Reference Ming2009).
3.2. Glacier melt caused by BC and MD
3.2.1. Estimation of albedo and radiative forcing caused by BC and MD
Reductions in snow and ice albedo and changes in radiative forcing due to BC and MD are shown in Figure 5. At Xiao Dongkemadi Glacier, albedo reductions due to mineral dust ranged from 0 to 37%, reductions due to BC ranged between 0 and 59%, and the combination of MD and BC reduced albedo between 0 and 58%. At the Zhadang Glacier, albedo reductions due to mineral dust ranged from 0 to 36%, reductions due to BC ranged between 0 and 33%, and the combination of MD and BC reduced albedo between 0 and 36%. For the medium scenario (as defined in Table 1), the average albedo reduction was 5 ± 6% caused by MD, 12 ± 13% caused by BC and 13 ± 13% caused by MD and BC together at the Xiao Dongkemadi Glacier; While at the Zhadang Glacier, the average albedo reduction was 4 ± 4% for the effect of MD, 10 ± 9% for the effect of BC, and 12 ± 10% for the combined effect of MD and BC.

Fig. 5. Effects of BC and MD on albedo and radiative forcing relative to the fresh snow, aged snow and granular ice at the (a) Xiao Dongkemadi and (b) Zhadang glacier.
Albedo reductions due to BC and MD were greatest for bare ice (Fig. 5). While BC appears to play a larger role than MD in albedo reductions over all surfaces, there remain significant uncertainties in this conclusion. The magnitude of albedo reduction is dependent on the surface types and properties (grain size and density). The timing of BC and MD deposition in relation to the ablation season is thus another important but unquantified factor.
Based on albedo change, radiative forcing was calculated by using Eqn (1) for different scenarios and different melting conditions. The results showed that the radiative forcing induced by MD spanned from 1 W m–2 in fresh snow to more than 80 W m−2 in granular ice at the Xiao Dongkemadi and Zhadang glaciers (Table 2). In the case of the medium scenario at the Xiao Dongkemadi Glacier, the estimate of BC forcing was 13 ± 8 W m−2 in fresh snow, 61 ± 35 W m−2 in aged snow and 97 ± 84 W m−2 in granular ice, respectively. While in case of the medium scenario at Zhadang Glacier, the radiative forcing induced by BC was 11 ± 7 W m−2 in fresh snow, 156 ± 81 W m−2 in aged snow, 74 ± 47 W m−2 in granular ice, respectively. For comparison, at Mera glacier on the southern side of the Himalaya, the radiative forcing induced by BC was 75–120 W m−2 (Kaspari and others, Reference Kaspari, Painter, Gysel, Skiles and Schwikowski2014), which was consistent with our results of the aged snow/granular ice. The estimate of BC forcing in fresh snow on the central Tibetan Plateau glaciers were higher than that of Muji glacier in the western Tibetan Plateau (2 W m−2 in fresh snow) (Yang and others, Reference Yang, Xu, Cao, Zender and Wang2015). For the medium scenario on the central Tibetan Plateau glaciers, radiative forcing was comparable to that estimated for Urumqi glacier No.1 in the Tienshan mountains (180 W m−2) (Ming and others, Reference Ming, Xiao, Wang, Li and Li2016). The results suggested that radiative forcing in snow/ice induced by MD were relatively lower than that of BC-induced at both the Xiao Dongkemadi and Zhadang glacier. Such a result indicated that radiative forcing caused by BC was considerably higher than MD in snow/ice on the central Tibetan Plateau glaciers.
Table 2. Estimates of albedo reductions and radiative forcing for different melting conditions at low, medium and high scenarios (identified according to Table 1) on the central Tibetan Plateau glaciers

Note: SA represents the simulated albedo, RF represents the radiative forcing. MD (%), BC (%), MD&BC (%) are the concentrations of MD, BC, MD and BC combined to the albedo reduction on the glaciers. RF + MD, RF + BC, RF + MD&BC represent the radiative forcing caused by MD, BC, MD and BC combined, respectively.
3.2.2. Contributions of BC and MD on the glacier melt
Based on the albedo changes, glacier melt induced by BC and MD in different scenarios was simulated based on Eqns (2–5). Daily temperature, daily precipitation, and shortwave radiation were measured by the AWS setup at the Xiao Dongkemadi and Zhadang glacier in 2015. The average snow/ice cover percentage was set as an in situ observation. Thus, a series of sensitive analysis of glacier melting during May–October for Xiao Dongkemadi and Zhadang glacier were calculated individually under different surface types at different scenarios (Fig. 6, Table 3 and Table S6).

Fig. 6. Effects of BC and MD on glacier melt during May–October relative to the fresh snow, aged snow and granular ice at the (a) Xiao Dongkemadi and (b) Zhadang glacier.
Table 3. Contributions of BC and MD to the glacier melt during May–October at the different scenarios on the central Tibetan Plateau glaciers

Note: Different scenarios depend on the albedo reduction relative to Xiao Dongkemadi Glacier and Zhadang Glacier. MD (%), BC (%), MD&BC (%) are the concentrations of MD, BC, MD and BC combined to the total glacier melt. While the actual ablation of Xiao Dongkemadi Glacier and Zhadang Glacier were supplied by Tanggula Cryosphere and Environment Observation Station, Northwest Institute of Eco-Environment and Resources, Chinese Academy of Sciences and Nam Co Station for Multisphere Observation and Research, Institute of Tibetan Plateau Research, Chinese Academy of Sciences, respectively, which calculated based on the glacier mass balance, precipitation and evaporation.
Total simulated melt, based on the medium scenario of albedo reduction and radiative forcing due to BC and MD, was 888 ± 176 mm w.e. at Xiao Dongkemadi Glacier, and 1637 ± 527 mm w.e. at Zhadang Glacier (Table 3). These estimates are within the margin of error for the reported total glacier ablation at each site. Between May and October, ~100 and 118 mm w.e. were caused by MD and BC at Xiao Dongkemadi Glacier, and 364 and 412 mm w.e. at Zhadang Glacier, respectively. The contributions of BC and MD combined with the total glacier melt were ~12 ± 5% at Xiao Dongkemadi Glacier and 22 ± 15% at Zhadang Glacier. A previous study at Mera glacier on the southern slope of the Himalaya suggested that the impact of BC represents <16% of potential annual melting, while the combined contribution of BC and MD to surface melting represents a maximum of 26% (Ginot and others, Reference Ginot2014). At Claridenfirn Glacier in the Swiss Alps (Gabbi and others, Reference Gabbi, Huss, Bauder, Cao and Schwikowski2015), the combined effect of BC and MD was shown to increase total annual glacier melt by between 282 and 485 mm w.e., which represents 15–19% of the total melt. Therefore, the current simulation results of the glacier melting caused by BC and MD at our studied glaciers are consistent with other studies. Note also that, during the melting season, glacier melting could be accelerated due to the exposure (enrichment) of BC and MD on the surface (Kaspari and others, Reference Kaspari, Painter, Gysel, Skiles and Schwikowski2014). This process could be further strengthened if melt leads to the re-exposure of impurities at the glacier surface, or if the melt season is expanded due to a warming climate or macroscale atmospheric circulations (Fujita and Nuimura, Reference Fujita and Nuimura2011; Yang and others, Reference Yang, Guo, Yao, Zhu and Wang2016).
4. Discussion
4.1. Uncertainties with regard to BC sources
The airmass trajectory's uncertainty can be attributed to several factors: (i) the numerical methods of the calculation (e.g. interpolation and time-stepping method); (ii) the accuracy of the underlying wind fields, which are representative for a gridbox (0.25° × 0.25°) but cannot, or only in an approximate way, take into account the small-scale fluctuation of the winds within the box; (iii) the chaotic nature of the atmosphere, which makes the calculation of exact trajectories impossible. A detailed discussion of these effects and their implication on the reliability of kinematic trajectories can be found in Stohl (Reference Stohl1998).
Although the FINN inventory provides emission rates for many gaseous and particulate species, this study only relies on basic pieces of information of the inventory: the longitude and latitude, as well as the date and time of a fire spot. In particular, we do not consider the burnt area and the estimated emission of BC. This approach is consistent with the rather qualitative nature of the association between fires as BC sources and the airmass trajectories. For instance, no attempt is made to take all the processes into account that potentially happen during the air mass transport from the fire region to the target region. The study also does not quantify the amount of the air parcels' BC that is actually deposited on the glaciers.
In particular, the BC fluxes of all fires along a backward trajectory are assumed to be of similar magnitude, which certainly is not the case. Further, BC emissions are assumed to influence a relatively large area, especially if the neighborhood radius is 200 km. Finally, the vertical extent of a fire's BC emission is neglected. It is, however, not completely clear which levels these emissions reach, also because a fire of significant size itself affects the thermodynamic stability of the atmospheric layers above and thus might induce substantial vertical transport of BC to mid-tropospheric levels.
In summary, the quantitative attribution of BC emissions in fires to air parcels and their subsequent transport along kinematic trajectories to the measurement site is subject to substantial uncertainty. In this study, we rely on a rather qualitative approach, which still can adequately determine if BC influence from fires is likely or not. A quantitative approach would have to employ refined particle dispersion models that incorporate all complexities in BC emissions, transport and deposition at a measurement site (Lin and others, Reference Lin2003; Stohl and others, Reference Stohl, Forster, Frank, Seibert and Wotawa2005).
4.2. Uncertainties with regard to albedo and radiative forcing
Modeling studies of the albedo reduction and effects on radiative forcing induced by BC and MD have been conducted in and around the Tibetan Plateau glaciers, however, there exist significant uncertainties regarding how BC and MD affect the albedo and radiative forcing of snow/ice.
BC size, morphology and coating (Flanner and others, Reference Flanner, Zender, Randerson and Rasch2007; Schwarz and others, Reference Schwarz, Gao, Perring, Spackman and Fahey2013), mixed types and mixed materials (Liou and others, Reference Liou, Takano and Yang2011; He and others, Reference He2014) in snow and ice are the dominant sources of uncertainty in BC's absorption properties, which can affect the albedo and radiative forcing induced by BC. The difference in BC's size range and morphology can cause a reduction of BC MAC in the snow because larger BC particles tend to absorb light less efficiently per unit mass than smaller particles (Liou and others, Reference Liou, Takano and Yang2011; Schwarz and others, Reference Schwarz, Gao, Perring, Spackman and Fahey2013; Peng and others, Reference Peng2016). Studies indicated that BC coated with OC and other impurities had an absorption that was enhanced by a factor of 2.4 relative to BC in fresh emissions (Gustafsson and Ramanathan, Reference Gustafsson and Ramanathan2016; Peng and others, Reference Peng2016). Further, BC particles can be internally and externally mixed with other organic aerosol or nonabsorbing materials, different types of mixing states that can exhibit significantly different absorption properties for BC, which affects the efficiency of its absorption, as determined by its mass absorption cross section (Liou and others, Reference Liou, Takano and Yang2011; Gustafsson and Ramanathan, Reference Gustafsson and Ramanathan2016).
MD sources (Kaspari and others, Reference Kaspari, Painter, Gysel, Skiles and Schwikowski2014) and optical properties (Zhang and others, Reference Zhang, Wu, Zhang, Xu and Zhou2015) in snow/ice also limit the estimation of the absorption. The optical properties used for MD was from general sources and not from the specific source region, the proportion of MD that originated from localized, regional or long-range sources had not been constrained and the contribution from natural sources (as opposed to anthropogenic sources) is not well known, will lead to uncertainties in modeling (Kaspari and others, Reference Kaspari, Painter, Gysel, Skiles and Schwikowski2014). The real role of iron oxides in the dust absorption properties in the snow was also the dominant source of uncertainty for estimation (Zhang and others, Reference Zhang, Wu, Zhang, Xu and Zhou2015).
Such uncertainties may have caused bias in the estimations of radiative forcing (underestimate or overestimate). Therefore, additional long-term detailed studies are still needed focusing on BC and MD absorption properties in snow/ice to assess albedo reduction and radiative forcing more precisely.
5. Conclusions
This study addresses the observational data of BC and MD concentrations in snow/ice from the central Tibetan Plateau glaciers and quantifies their effects on glacier melt. SNICAR model based on the medium scenario simulations showed that BC and MD combined may account for 19 ± 2% of the albedo reduction for granular ice, 13 ± 7% of the albedo reduction for aged snow and <2% of the albedo reduction for fresh snow at two study sites on the central Tibetan Plateau. Furthermore, the contribution of MD to the albedo reduction was 4 ± 0%, and 11 ± 1% for BC on these glaciers.
Radiative forcing due to MD and BC varied between 1 and 89 and 11–196 W m−2, respectively, and radiative forcing is dependent on the assumed surface properties. Such a result indicated that the effect of BC on albedo and radiative forcing was considerably higher than MD in snow/ice of the central Tibetan Plateau glaciers. Based on these estimations, the results suggested that BC and MD had a significant potential to enhance glacier melt during the melting season (May–October). For the medium scenarios, the estimated contributions of MD, BC, MD and BC combined to the total glacier melt on Xiao Dongkemadi and Zhadang glaciers were 6 ± 3, 15 ± 6 and 17 ± 7%, respectively. BC contribution played a pivotal role in the total glacier melt on the central Tibetan Plateau. Hence, reducing BC emitting sources could substantially help to mitigate the glacier melt on the central Tibetan Plateau.
Analysis of the large-scale atmospheric circulation, in addition to air mass backward trajectories, indicate that impurities deposited on Xiao Dongkemadi and Zhadang glacier are influenced by the Westerlies, Siberian anticyclone, and the Indian monsoon during May–October. The study region was primarily impacted by dust aerosols transported from the arid regions of the Middle East, Central Asia and North China, while BC parcels mainly impacted by South Asian transportation. Between 20 and 30% of the calculated back-trajectories passed with 200 km of identified fire locations. A potentially large fraction of BC may thus be coming from local and regional fossil fuel combustion, and this result may guide regional BC mitigation and adaption actions.
Acknowledgements
This study was supported by the National Natural Science Foundation of China (41801048), and China Postdoctoral Science Foundation (2018M631215). We thank Mark Flanner for facilitating our understanding of the SNICAR model and its application. We also thank the Associate Editor in Chief Hester Jiskoot, the Scientific Editor Joseph Shea, and the two anonymous reviewers for their comments and suggestions, which greatly helped us in improving our paper.
Supplementary material
The supplementary material for this article can be found at https://doi.org/10.1017/jog.2019.100.


 Open access