
Abstract
The residential building typology of Stone in Mud Mortar (SMM) masonry contributed significantly to the seismic losses caused by the 2015 Nepalese seismic sequence, also known as the 2015 Gorkha earthquake. SMM masonry is the most common construction type in Nepal, and notwithstanding the extensive damage, this has persisted in the post-earthquake reconstruction. This paper provides first an overview of the extent of damage and typical failure modes suffered by this typology. Some pressing issues in the ongoing post-earthquake reconstruction, such as building usability, construction quality are then discussed. The results of seismic analyses on both the pre-earthquake (PRE-SMM) and post-earthquake built (POST-SMM) typologies, using the applied element method employing a modelling strategy that accounts for the random shape of stone units, are then presented and discussed in terms of capacity curves and failure mechanisms. As per the seismic design code of Nepal, seismic performance assessment is conducted to understand the seismic design levels of these constructions. Finally, seismic fragility and vulnerability functions for both the PRE-SMM and POST-SMM typologies, considering the uncertainty in ground motions and material quality, are presented and discussed. Considering the seismic hazard in Nepal, the PRE-SMM typology is found to be highly vulnerable and seismic strengthening of these buildings is urgent. On the other hand, the POST-SMM typology has adequate seismic capacity and performs within the serviceability limit, given the quality of both the construction materials and workmanship are not compromised.
1 Introduction
Nepal is one of the most earthquake prone countries in the world and has experienced several devastating earthquakes of magnitude exceeding Mw7.5 (Thapa and Wang 2013). The most recent of these, of Mw7.8, occurred in the central region of Nepal on April 25, 2015 with the epicentre located in Barpak village, Gorkha district, approximately 78 km northwest of Kathmandu with a focal depth of 15 km (USGS 2015). Hundreds of aftershocks with Mw ≥ 4.0 were recorded for more than a year after the first shock, with some significant seismic events having Mw6.7 and Mw7.3 on April 26, 2015 and May 12, 2015, respectively (Bhagat et al. 2018). The seismic sequence resulted in a Maximum Modified Mercalli Intensity of IX (Violent) causing 8790 deaths and nearly 22,300 injuries (NPC 2015). About 8 million people were left homeless and the disaster related economic loss is estimated at $7 billion (NPC 2015).
Residential properties were hit hard by the seismic sequence resulting in about half a million houses destroyed and more than 250,000 houses partially damaged (NPC 2015). According to the damage survey by the National Reconstruction Authority (NRA) (NRA 2016a), buildings afected by damage grade 5 (EMS-98 Scale, Grünthal 1998) were mostly concentrated in rural mountainous districts where masonry typologies with low strength, due to mud mortar binders, were most common. Among the damaged buildings in all the affected districts, as high as 96% were of load bearing masonry constructions (NPC 2015). Most of the post-earthquake damage survey studies (e.g. Goda et al. 2015; Parajuli and Kiyono 2015; Bhagat et al. 2018; Wilkinson et al. 2019) reported that the significant damage suffered by these traditional load bearing masonry typologies was due to the lack of seismic resistant features such as seismic band, through-thickness stones, diaphragm actions.
With such extensive damage to dwellings, the process of post-earthquake reconstruction is not simply a technical issue, but has important social, political and economic dimensions (NPC 2015). Sharma et al. (2018) have discussed the challenges of reconstruction such as the political issues, lack of coordination, shortage of manpower and materials etc. HRRP (2018) presented several examples of newly built houses of different typologies in the affected districts reporting the status of construction, technical issues such as code-compliance and level of technical assistance received by the house-owners. Some key issues, which need attention and remedial actions from NRA, households and other stakeholders, such as the qualityand workmanship of the reconstruction, functional aspects of newly built houses etc. are discussed in this paper in Sect. 3.
Despite being the highest contributor to damage, the SMM typology remains the most commonly used typology in the reconstruction effort. According to a survey conducted on about 500 households from the affected districts, about 63% of the newly built houses are found to be of SMM construction (HRRP 2018). In Sindhupalchowk, one of the hard-hit districts, as high as 46% of the post-earthquake built houses are of SMM typology (NRA 2019a). The reasons for many household choosing the SMM typology can be summarised as: the difficulty of transportation of bricks, cement or steel to rural areas; readily available stone, mud and timber in these locations; available skill-set of masons and carpenters trained in traditional construction and the resulting lower cost compared to other typologies (see also Bothara et al. 2018a; HRRP 2018). Being the cheapest solution, the decision of rebuilding SMM dwellings can be closely linked to both the economic status of the households and the size of the financial grant provided by the government for house reconstruction.
In the context of Nepal, the construction characteristics, seismic capacity and strengthening needs of urban typologies such as Reinforced Concrete (RC) construction and Newari construction in Kathmandu valley have already received attention (e.g. D’Ayala and Bajracharya 2003; D’Ayala 2004; Chaulagain et al. 2013; Gautam et al. 2016). However, although being most widely present, the construction characteristics and seismic capacity of rural vernacular dwellings such as the SMM typologies practiced for centuries, have not been studied in detail. Although it is known that these vernacular SMM typologies are seismically vulnerable, it is essential to quantify their seismic capacity, understand the deficiency and possible failure mechanisms so that the construction practice of these typologies can be improved in order to ensure their seismic resistance.
Some experimental studies exploring the effective strengthening methods for SMM buildings are reported in literature (e.g. Pun 2015; Wang et al. 2018; Bothara et al. 2019). These tests, done either on single walls or on scaled models of 3-D buildings, have confirmed that the application of simple and low-cost strengthening techniques such as timber/RC bands, steel wire mesh etc. can significantly improve the stiffness, strength, integrity and ductility of SMM constructions. While studies such as Guragain (2015) and Bothara et al. (2018a, b) have investigated the global seismic behaviour of Nepalese SMM typology by using numerical analyses, due to the lack of well characterised material properties in these studies, the reliability of their results is limited.
Based on the above discussion, this study presents a detailed evaluation of the seismic capacity, collapse mechanisms and reliable fragility functions for the PRE-SMM (SMM buildings built previous to the 2015 event) typology as well as the POST-SMM (built in the reconstruction effort after the 2015 event) typology, which are currently lacking in literature. As the material properties are key inputs in the numerical modelling, the results of recent experimental tests on Nepalese SMM masonry conducted by Build Change (2019) are used. Furthermore, advanced non-linear analyses, using the applied element method (AEM) employing a 3-D element-by-element modelling technique, are conducted to account for the randomness of the units in the masonry fabric. The outcomes of this study allow to quantify current seismic design levels, to understand the seismic vulnerability and failure mechanisms, to develop effective strengthening measures and to improve the construction practice of SMM typologies so that rural Nepalese communities can be made more resilient to seismic hazard.
The paper is organized as follows. First, the extent of damage sustained by the PRE-SMM buildings, hit by the 2015 Nepal earthquake sequence is presented in Sect. 2. Some emerging issues in the ongoing post-earthquake reconstruction such as building usability/functionality, code-compliance etc. are then discussed in Sect. 3. Next, the construction characteristics of both the PRE-SMM and POST-SMM typologies are discussed in detail in order to characterize the representative Index Buildings (IBs). In Sect. 5, the results of advanced non-linear seismic analyses on the PRE- and POST SMM IBs are presented and discussed in terms of their capacity curves and failure mechanisms. As per the seismic design code of Nepal (NBC 105: 2019), site specific seismic performance assessment is conducted to understand the seismic design levels of these IBs and the results are presented in Sect. 6. Moreover, the same section also presents the results and discussion on the fragility analysis of both the PRE- and POST SMM IBs, under a number of ground motions, in order to derive seismic fragility and vulnerability functions, which are prerequisites for seismic risk assessment studies. Finally in Sect. 7, in relation to the seismic damage suffered by the SMM typology in the 2015 Gorkha earthquake as well as the ongoing post-earthquake reconstruction, some conclusions are drawn from the results and discussions presented in this paper.
2 Damage to SMM buildings in the 2015 Gorkha earthquake
Being the most common construction typology in the country, the damage suffered by the PRE-SMM typology during the 2015 earthquake was extensive and contributed significantly to economic and human losses. In the severely affected remote mountainous districts such as Dolakha and Sindhupalchowk, the contribution of PRE-SMM typology to the total damage was more than 60% (HRRP 2018). Typical damage patterns sustained by the PRE-SMM buildings in the 2015 Nepal earthquake, as also reported in literature (Dizhur et al. 2016; Parajuli and Kiyono 2015, etc.), are: vertical separation of walls, complete collapse of short walls, gable collapse, shear damage in the in-plane walls with openings and out-of-plane delamination as shown in Fig. 1. Similar failure modes were reported for stone masonry buildings by Spence and D’Ayala (1999) after the 1997 Umbria-Marche Earthquakes in Italy.

Main failure mechanisms of PRE-SMM typology observed in the 2015 Nepal earthquake (Images b and c reproduced with kind permission of Build Change Nepal)
The inconsistent application of seismic resistant features and poor implementation of seismic design codes (most of the PRE-SMM buildings were built before the drafting of the seismic design codes in Nepal e.g. NBC 203: 1994) are the main reasons of the poor seismic performance of the residential building stock in the 2015 seismic sequence. In the reconstruction effort, the country is aiming to increase the seismic resilience of the built infrastructure by adopting the build back better principle with the provision of cash assistance, training, supervision and social facilitation (NRA 2016b). The build back better concept came to prominence after the 2004 Indian Ocean tsunami and forms one of the four pillars of the Sendai Framework for Disaster Risk Reduction 2015–2030 (UNISDR 2015a). It suggests a holistic and sustainable approach to restoring, rehabilitating and improving housing, infrastructure, services, economies, livelihoods and living conditions in a way that makes communities and societies less vulnerable to future shocks (UNISDR 2015b). In relation to the build back better principle, some pressing issues in the ongoing reconstruction of residential buildings in Nepal are reported in Sect. 3.
3 Some issues in the post-earthquake reconstruction
While an in-depth analysis of the socio-cultural and economic implications of the reconstruction policies and processes are beyond the scope of this paper, it is important to highlight some issues that are essential to understand the context which produced the structural typologies analysed in this study. The post-earthquake reconstruction in Nepal can be considered as an opportunity for two reasons: at household level, it is an opportunity to upgrade changing functional needs as well as the seismic design level of dwellings; at country level, it is an opportunity to increase the overall seismic resilience via awareness campaigns, trainings and stricter implementation of seismic design codes, not only in the affected regions but throughout the country.
Almost a year after the devastating earthquake sequence, NRA started the implementation of a Post Disaster Recovery Framework (PDRF) (NRA 2016b) based on the findings of the Post Disaster Needs Assessment (NPC 2015). One of the key objectives of the PDRF is the reconstruction of disaster resilient residential houses in the affected areas. According to the PDRF, affected households are being provided with financial assistance (total of $3000 approx.) in tranches, supported by timely provision of technical assistance, training and facilitation, so that people can rebuild their own house as soon as possible. As of February 2020, about 60% of the identified housing grant beneficiaries have completed the construction of their new houses (NRA 2019b). This indicates that almost 5 years after the first shock, about 40% of beneficiaries have not received the full pay-off. The reasons for such situation are diverse: government change, transition into federalism, economic hardships, coordination issues between stakeholders, issues related to the availability of construction materials and skilled labour etc. (see also Sharma et al. 2018).
The following sub-sections discuss the functional and the construction quality issues of the newly built houses. These discussions are based on the survey and interview conducted by the first author during his field trip in 2018 in Sindhupalchowk district and relevant published literature.
3.1 Usability/functional aspects of reconstruction
The main purpose of a house is to serve its basic functions and daily needs of the occupiers, as totally integrated to the culture and traditions of the communities, well beyond the need to withstand strong earthquakes. In the rural mountainous and peri-urban areas, POST-SMM masonry and brick in cement mortar masonry (named POST-BCM hereafter) constructions are the most common typologies in the reconstruction effort. Many of the newly built POST-SMM and POST-BCM houses are substantially under dimensioned, with respect to the needs of their occupiers. Figure 2 compares the typical pre-earthquake and post-earthquake load-bearing masonry typologies in rural mountainous district and the footprints of both typologies are comparable at about 36 m2. However, while the PRE-SMM houses were mostly two storeyed plus an attic resulting in an available gross floor area of about 108 m2, most of the newly built houses (both POST-SMM and POST-BCM typologies) have only the usable ground floor area of about 36 m2 with substantial functional drawbacks. Further examples of single-storeyed POST-SMM houses, with just a single room, can be found in Adhikari and D’Ayala (2019a). Thus, it appears that many of the new rural residential houses have been built without planning the current and future space requirements and these houses do not respond to the socio-cultural reality of these communities. These houses also lack typical layouts such as separate spaces for living rooms, bedrooms, bathrooms and kitchen; although the design catalogue published by NRA (2015) includes such provisions in the suggested layouts. Furthermore, as most of the rural mountainous households are farmers, no provisions for storage spaces for harvests, overhangs for drying of crops, livestock sheds etc. can be seen in most of the new constructions. Similar issues are also discussed by Sharma et al. (2018), in a study covering observations in five districts affected by the 2015 seismic sequence.

Photographs of typical load bearing masonry constructions: a PRE-SMM; b POST-SMM and c POST-BCM construction (photos from Sindhupalchowk district, Nepal)
From the interviews with the affected communities conducted by the first author during field visits, it emerged that there are several reasons behind the selection of such small houses by the households:
-
Economic hardships Some of the house owners mentioned that this was the only size of house they could build with the financial assistance provided. The median cost of construction for different house's typology can be seen in Fig. 3, based on a survey of several hundred households in the affected districts (HRRP 2018).
Fig. 3 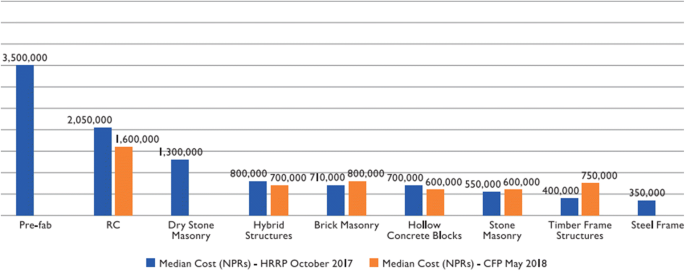
Median construction cost for different typologies of newly built houses in Nepal after the 2015 seismic sequence (HRRP 2018). HRRP Housing Recovery and Reconstruction Platform, CFP Common Feedback Project (Figure reproduced with kind permission of HRRP Nepal)
-
Lack of adequate technical information and assistance Some of the owners were informed that small plan and single-storeyed houses were seismically stronger than larger and multi-storeyed houses, which is true but there should be a balance between the functional needs and the seismic resistance. Furthermore, the NRA engineers are not well trained for providing technical support for multi-storey SMM constructions, as reported by several households (see HRRP 2018).
-
Temporary solution Some of the households replied that they constructed these houses as temporary solutions and will build another house in the near future after saving enough money.
-
Monetary interest A minority of the interviewees mentioned that the house owners built these small houses compromising further on the quality/workmanship only to get the financial assistance from the government. Furthermore, there have been several cases where the beneficiaries ended up erecting single-room sheds to claim tranches by the deadlines set by NRA (see Nepali Times 2018).

Did the affected communities forget to build ‘homes’ by being encircled inside the ring of ‘seismic resistant designs’ resulting in small and inadequate houses? Whatever be the reasons behind, the construction of such houses with inadequate space is not a sensible policy. During the planning and construction phase, NRA should have had stricter regulations for assessing the size/type of houses being constructed against the housing space requirements of each households.
3.2 Quality/workmanship/non-compliance issues
There are several cases where use of poor-quality material, poor workmanship and non-compliance issues have been identified in the newly built houses (see also HRRP 2018). Although NRA issued a correction/exception manual in 2017 (NRA 2017), its implementation in the field doesn’t seem to be effective. The workmanship in several newly built houses is found to be poor, particularly in relation to the implementation of RC bands, whereby rebars can be seen exposed (Fig. 4) and cross-sections at some locations hardly reach 50 mm (Fig. 4b) against the minimum requirement of 75 mm (NRA 2016c). In spite of these defects, such houses have passed the inspections by NRA engineers. Furthermore, due to the lack of quality control measures on site for mortar preparation, concrete mixing etc., the uncertainty in the material properties and hence in the lateral capacity of the walls is substantial. However, these issues are hard to overcome in rural areas. The non-compliance issues are more frequent in multi-storeyed constructions with large plans, built by economically able households with limited financial/technical assistance from the NRA engineers as they themselves lacked relevant trainings (see Fig. 5).

Examples of poor quality workmanship of the RC seismic bands in the POST-SMM constructions

Photographs of multi-storeyed non-compliant SMM houses built with limited (or without) NRA technical assistance: a photo from Sindhuli and b photo from Solukhumbu (HRRP 2018). In these houses, the seismic bands are not placed at the recommended spacings (Images reproduced with kind permission of HRRP Nepal)
It is interesting to note that, after the heavy damage sustained by the traditional SMM typology in the 2015 seismic sequence, a misbelief has spread among the affected communities that the use of modern construction materials such as concrete and steel makes houses seismic resistant. However, with engineering-based minimal improvements of the local crafts practiced and developed over centuries, seismic resistant structures can be built with traditional materials such as stone and timber (see D’Ayala 2013 and Fig. 6a for example). The well-built PRE-SMM house shown in Fig. 6a has traditional seismic resistant features of timber elements: seismic bands (two per storey), lacings, vertical posts and timber roofing system that includes keys and compression struts. Hence, improving the construction practice of traditional vernacular constructions, with which the masons are familiar, should have been promoted in the reconstruction. Indeed, there is evidence of timber elements in the POST-SMM construction (Fig. 6b) being used in some rural houses where transportation of cement and reinforcement bars is difficult. Further discussions on the issue of loss of rural vernacular architecture after the 2015 seismic sequence is available in Adhikari and D’Ayala (2019a).

(HRRP 2018) (Images reproduced with kind permission of HRRP Nepal)
SMM houses with seismic resistant features of timber elements: a an 80 years old PRE-SMM house in Syangja district that has survived three major earthquakes including the recent 2015 Gorkha earthquake and b a newly built POST-SMM house
4 Construction characteristics of SMM buildings
In order to understand the seismic resistant features as well as to characterize the IBs for carrying out numerical modelling and detailed seismic vulnerability analysis, careful inspection of the construction characteristics at wall level as well as at building level is crucial. This includes the detailed information and knowledge of masonry bond pattern, cross-wall connections, floor and roof structures and their connections, plan and opening layouts, geometric dimensions etc.
Before presenting the construction characteristics of PRE-SMM and POST-SMM typologies at building level (in Sects. 4.2, 4.3), the masonry bond pattern of Nepalese SMM walls is discussed in Sect. 4.1.
4.1 SMM wall bond pattern
The stone units used in the SMM walls are from various nearby sources such as river (fairly round shaped), naturally fractured rocks or from quarry sites. The mud mortar used in the SMM wall construction is prepared from locally available soil. These SMM walls are made up of two to three wythes of mostly uncoursed random stones, the shape of stone varying from highly irregular to semi-dressed flat stone depending on the source, workability of the stone and workmanship skills of the mason. The void between the wythes are filled with rubbles and through stones are used to connect the wythes. Figure 7 presents photographs of the SMM bond pattern from 4 different buildings in Sindhupalchowk district. In some buildings the stones are flat and tend to form horizontal courses along the height while in others the shape is random, and no distinct horizontal courses can be identified. Similarly, the stone size also varies from building to building and within the same wall to fill in gaps among larger stones. These irregularities affect the amount of mortar used in the walls to fill up void and even out irregular stone units. Consequently, the corresponding mechanical properties and hence the lateral seismic resistance of these constructions are highly variable (e.g. see Milosevic et al. 2013; Malomo et al. 2019a, b; Vasconcelos and Lourenço 2009). More detailed discussions on types of SMM wall constructions found in South Asia including Nepal can be found in Bothara and Brzev (2011) and Pun (2015).

Masonry bond pattern from 4 different Nepalese SMM buildings
4.2 PRE-SMM typology
Most of the PRE-SMM buildings, traditionally constructed by local masons, are unreinforced and often built with uncoursed random rubble stone in mud mortar thus displaying poor tensile and shear strength. The SMM walls are usually thick (400–600 mm) and the wythes are not properly inter-connected using adequate amount of through thickness stones (see also Bothara et al. 2018a). The number of stories varies from one to three and the storey height is typically low at about 2 m.
Figure 8 presents photographs of a typical PRE-SMM house in rural mountainous districts, which is used as an IB representative of this typology for carrying out its seismic vulnerability assessment in the present study (Sects. 5, 6). It is a two-storeyed building with an attic floor covered in a multi-pitched timber roof structure. The cross-wall connections in these constructions are built with fairly rectangular shaped corner stones (Fig. 8b). Besides the SMM wall load bearing system, a timber frame centrally placed along the longitudinal direction also supports the floor structure, see Fig. 8c. The longitudinal girder at each floor level, resting through the whole thickness of the short walls, supports several transverse joists resting over the whole thickness of the long walls, forming the mud-topped timber floor structure. The unique timber roof structure, supported by a system of compression struts locked to the masonry by timber keys as seen in Fig. 8d, confines all the walls thus promoting the global box-like behaviour. It is worth noting that the IB is non-symmetric in the longitudinal direction due to the typical distribution of opening only on the front wall.

Construction characteristics of a typical PRE-SMM building: a 3-D view; b view of a corner connection; c timber frame and floor structure and d timber roof system with timber keys and compression struts
4.3 POST-SMM typology
The POST-SMM buildings also have 400-600 mm thick uncoursed random rubble stone masonry walls as in the PRE-SMM construction. Most of the POST-SMM constructions are single storeyed with one to two rooms only, as already discussed in Sect. 3.1, although the NBC 203: 2015 code allows multi-storeyed construction of up to two storeys plus an attic floor. The storey height is typically low at about 2 m. The seismic-resistant measures applied in these buildings follow the prescriptions in the NBC 203: 2015 and are highlighted in the photograph of a newly built house shown in Fig. 9, which is used as an IB representative of the single-storeyed POST-SMM typology in the numerical analysis and seismic performance assessment (Sects. 5, 6). The RC seismic bands are typically 75 to 100 mm deep and extend through the whole thickness of the SMM walls. The roof is mostly gable type and is made of a timber structure with light roofing material (corrugated iron sheet).

Construction characteristics of typical POST-SMM buildings (photo from Sindhupalchowk district)
5 Seismic analysis of SMM IBs
Due to the complexity of conducting full-scale experimental tests to characterize the seismic behaviour of buildings (e.g. Bothara et al. 2010), numerical seismic assessment methods are increasingly and widely used within the engineering community (e.g. D’Ayala and Speranza 2003; Lagomarsino et al. 2013; D’Ayala et al. 2015). Reliability and efficiency of numerical analysis have increased in recent years with the advancement of modelling approaches, software tools and computational capabilities. Furthermore, numerical models afford the flexibility of conducting extensive parametric analysis, too expensive and unfeasible for experimental tests. This section presents a discussion on the numerical modelling approach, results of validation and calibration studies for SMM masonry (Sect. 5.1) and the results of non-linear pushover analyses conducted on the PRE-SMM and POST-SMM IBs (Sects. 5.2, 5.3).
5.1 Applied element modelling of SMM masonry: validation and calibration
Modelling of masonry is complex because of its heterogenous nature due to the presence of units and mortar having different elastic and non-linear properties. Several methods have been used for studying the structural behaviour of masonry: e.g. limit-analysis based methods (e.g. D’Ayala and Speranza 2003) and numerical methods such as finite element based methods (e.g. Bothara et al. 2018b), discrete element based method (e.g. Lemos and Campos Costa 2017) and applied element based methods (e.g. Karbassi and Nollet 2013). Three approaches can be followed for numerical modelling and analysis of masonry: micro-modelling, simplified micro-modelling and macro-modelling (Lourenço and Rots 1997). In the simplified micro-modelling approach, the mortar layer and the two unit-mortar interfaces are lumped into a zero-thickness joint while the units are slightly expanded on all sides to accommodate the mortar thickness. The joints represent all the deformability and non-linearity of the masonry material while the units are considered as rigid elements. Such modelling strategy is appropriate for the Nepalese SMM construction where the mortar joints have poor stiffness and strength properties compared to the stone units. Furthermore, this approach is a balanced option in terms of the computational cost/time as well as the accuracy of the results compared to the detailed micro-modelling or macro-modelling approaches (Lourenço and Rots 1997). A detailed overview of the modelling strategies and analysis options currently available in the literature for the analysis of masonry structures can be found in D’Altri et al. (2019). Simplified micro-modelling approach using AEM has been chosen for this study as the complete non-linear lateral behaviour of masonry, from the initiation of cracking to the ultimate collapse state, can be studied with this approach (e.g. see Karbassi and Nollet 2013; Malomo et al. 2018).
The version of AEM commercialised in Extreme Loading for Structures (ELS) software (ASI 2018) is used in the present study. In AEM, the masonry is discretized in 3D-elements whose surfaces are connected by a number of deformable springs that simulate the interaction among the blocks with force–deformation laws representing the elastic and post-elastic behaviour of the material as a whole. Two types of springs are used for modelling masonry, ‘unit’ springs connecting the 3D elements of the units, and ‘interface’ springs connecting the individual applied elements to represent the equivalent properties of the mortar and unit-mortar interfaces. A detailed overview of the formulation, constitutive laws, failure criteria etc. for masonry modelling in AEM can be found in ASI (2018) and Malomo et al. (2018).
In this study, to account for the random irregular shape of rubble stone, a triangular 3-D mesh is first created, and then random shaped units are generated by clustering these triangular applied elements (each with 6 degrees of freedom) by means of the ‘unit’ springs. Figure 10 is self-explanatory: different coloured clusters represent stone units which are connected at their faces by the ‘interface’ springs. It should be noted that such modelling technique inherently presents some uncertainty as the wall construction itself presents great variability in terms of shape and size of units and the resulting bond pattern (also refer to Fig. 7).

Schematic of simplified micro-modelling of random rubble stone masonry using AEM
For the validation and calibration of the proposed numerical modelling strategy, numerically obtained compressive and lateral behaviour of SMM walls are compared against three distinct experimental tests: uniaxial compression behaviour, in-plane shear-compression behaviour and out-of-plane bending behaviour.
5.1.1 Uniaxial compression behaviour
The uniaxial compression test on SMM wallettes conducted by Build Change (2019) in Nepal is numerically reproduced. The test specimens of size 400 mm × 470 mm × 540 mm (thickness × width × height)) were built by local masons using local stone and mud mortar from rural districts and hence are well representative of the constructions considered in this study (Sect. 4). Key material properties from the accompanied mechanical characterization tests are presented in Table 1 and the same set of material properties is used for the numerical analysis in the present study. It is interesting to note that some studies have used an elastic modulus for the Nepalese SMM constructions as high as 850 MPa in their numerical studies (e.g. Bothara et al. 2018b) which is an order of magnitude higher than the recent test results (Table 1).
Figure 11 compares the numerical crack patterns and the stress–strain diagram to the experimental results for the SMM wallete subjected to uniaxial compression. Vertical and inclined cracks are observed which mainly pass through the mud mortar joints, both in the experiment and numerical analysis result. In terms of stress–strain curve, apart from a slight discrepancy in the initial stiffness, the average Young’s modulus as well as peak strength and strain are well predicted by the numerical analysis. The slight difference in the initial stiffness is most probably due to the fact that the test specimen presented some voids and hence showed non-linearity at the beginning of the test.

Comparisons of experimental and numerical behaviour: a crack pattern and b stress–strain curve (Leftmost image reproduced with kind permission of Build Change Nepal)
5.1.2 Lateral shear–compression behaviour
For the validation of the lateral in-plane behaviour of SMM wall, the cyclic shear–compression test conducted by Build Change (2019) is modelled. The wall specimen has a size of 1.2 m (length) × 1.2 m (height) × 0.45 m (thickness) and is built by local masons. Since this test is also from the same test campaign, the material properties listed in Table 1 are applicable. The wall is subjected to a cyclic (loading–unloading) displacement history up to a maximum lateral displacement of 48 mm under a vertical pre-compression of 0.011 MPa.
Figure 12 shows the comparison of ultimate crack pattern under cyclic shear–compression loading. As the cyclic displacement level increases, the cracks become widely distributed all over the wall surface, passing mostly through the mud mortar joint/interfaces. Figure 13 presents the comparison of hysteretic load–deformation behaviour from the AEM analysis and the experiment. Overall, the lateral loading and unloading stiffnesses, peak capacity as well as the ductility are well reproduced by the AEM analysis, although the numerical cycles have a larger hysteresis.

Crack patterns comparison under cyclic shear–compression loading: a experimental and b AEM analysis (maximum crack opening is 20 mm) (Image a reproduced with kind permission of Build Change Nepal)

Comparison of cyclic hysteretic response from experimental and AEM analysis under shear–compression loading
5.1.3 Lateral bending behaviour
In order to validate the bending behaviour of mud mortar masonry walls, the experimental test on a semi-dressed stone masonry pier of dimensions 1400 mm × 500 mm × 350 mm (height × length × thickness) conducted by Pun (2015) is considered. The location of crack at ultimate stage (which was at a height of 925 mm from the bottom in the experimental test, see Fig. 14a) as well as the load–deformation behaviour (Fig. 14b) are well reproduced by AEM analysis.

Comparison of location of crack at ultimate stage: a experimental and b AEM analysis results
Thus, the validation and calibration studies presented in Sects. 5.1.1–5.1.3 confirm that AEM can be effectively used for the gravity and lateral load analysis of SMM structures. In all the validation and calibration studies, the AEM numerical models consisted of 3 × 3 pairs of interface springs per shared face and the failure criterion was defined by specifying a separation strain of these interface springs equal to 0.025. These parameters are used in the numerical modelling of the SMM IBs in Sect. 5.2. Once the separation strain limit is exceeded in an interface spring, it has no further tensile capacity, however frictional contact can occur between the adjacent applied elements depending on the loading condition. As the values of the shear modulus and the friction coefficient were not provided by the experimental tests by Build Change (2019), they were obtained as results of the calibration analysis. An average shear modulus of 0.35 times the elastic modulus is found for Nepalese SMM construction, which is in close correlation with codes' recommended relationships (EN 1996-1-1, MSJC 2011). Similarly, a friction coefficient of 0.4 is found from the numerical calibration study. These values of the shear modulus and the friction coefficient are used in the numerical models of the SMM IBs in Sect. 5.2.

Numerical models of the IBs: a PRE-SMM typology and b POST-SMM typology
For computational efficiency stone units are modelled as rigid elements i.e. the cracks are assumed to develop through the mortar joints only. This assumption is justifiable from the damage results presented in this section, whereby cracks largely develop through the mortar joint and interfaces, due to the substantially lower stiffness and strength properties of the mud mortar compared to that of the stone units.
5.2 Numerical modelling and pushover analysis of the SMM IBs
Three dimensional numerical models (Fig. 15) of the PRE-SMM and POST-SMM IBs are created using the modelling strategy discussed in Sect. 5.1 for the SMM walls. Corner stones are created as rectangular elements at all corners and through stones are provided in the wall at an average spacing of 1.2 m in both horizontal and vertical directions, respectively, as per field observations.
For the PRE-SMM IB model, all timber members (floor members, roof members, lintels above the openings, as well as the frames around the openings) are explicitly modelled, as elastic elements, to represent their stiffness contribution to the seismic behaviour of the building. These members are all meshed so that the mesh size is comparable to the size of stone units. The timber-wall interface is represented by the properties of the mud mortar, to represent the actual situation in these constructions.
For the POST-SMM model, the RC seismic bands, confining elements around the openings and the corner reinforcements are all explicitly modelled so that their contribution in improving the global seismic behaviour can be reproduced. The RC elements are meshed such that the size of meshing is comparable to the size of stone units. For this IB model as well, the interfaces between the RC members and the SMM walls are modelled with the properties of mud mortar. The concrete material is assumed to be M15 grade and the reinforcement bars have a yield strength of 415 MPa (NRA 2016c). Although, depending on the level of connection to the load bearing walls, it could add some benefits to the global behaviour of the building, the light timber roof structure is not modelled. Instead, the equivalent mass of the roof structure is applied on the top of masonry walls as lumped mass so as to include its effect on the gravity and lateral loading.
In both the PRE-SMM and POST-SMM IB models, the SMM walls including the cross-wall connections are characterized by the material properties listed in Table 1. Considering that these constructions have stepped strip type foundations with depth greater than 0.5 m, the IB models are assumed to be fixed at the ground level.
Conventional pushover analysis of masonry structures modelled using the element-by-element modelling technique, with discontinuous joint represented by finite-strength springs, is complex as the application of pushover forces or displacements imposed on the structure often cause stress concentration on particular elements or regions thereby causing local failure without affecting the rest of the structure. Thus, the analysis is conducted by simulating the seismic action by a linearly increasing ground acceleration, resulting in an increasing effective earthquake force on the structure which is mass proportional. More details on this pushover loading approach can be found in Adhikari and D’Ayala (2019b).
Although the coefficient of variation (CoV) for different masonry properties in the test results (Build Change 2019) is low because of the small number of samples (three) from one district, the properties of masonry can vary greatly from one building to the next depending on the variation of materials used (stone type, size, shape etc. and the soil used for mortar preparation) as well as the workmanship quality (see also Sect. 4.1). Thus, a sensitivity analysis is conducted by considering the cases of a good material quality (assumed 50% better than the average values reported in Table 1) and a poor material quality (assumed 50% lower than the average material properties) in order to study the effect of variation of material properties in the seismic capacity and fragility/vulnerability functions of the SMM typologies. Such range is chosen based on the CoV reported in literature for rubble stone masonry (see Milosevic et al. 2013).
An Intel Core i7-7600U processor with a speed of 2.80 GHz was used for the modelling and computational analysis and the details of the modelling and the computational effort for the numerical models of the PRE- and POST-SMM IBs are given in Table 2. Although the number of applied elements in the POST-SMM IB model is significantly lower than the same in case of the PRE-SMM IB model, since the same loading steps size and number were used for both models, the analysis time is similar, at about one hour.
5.3 Capacity curves and failure mechanisms
5.3.1 PRE-SMM IB
Figure 16a compares the capacity curves for the PRE-SMM IB in the longitudinal and transverse directions. The FEMA 356 (FEMA 2000) performance level scale with four distinct performance levels (i.e. operational, immediate occupancy, life safety and collapse prevention) is used in this study. In Fig. 16, the base shear coefficient (also known as the lateral capacity) represents the ratio of the total base shear resisted to the seismic weight of the building. The peak lateral capacity attained by the PRE-SMM IB is very low, i.e. 0.12 g and 0.08 g in the longitudinal and transverse direction, respectively. Due to the poor strength of mortar as well as the random shape of the stone units, the non-linear response starts at a drift as low as 0.05% and the ultimate drift capacity is only about 0.4% in both principal directions. The ultimate drift is selected as the collapse prevention limit when a collapse mechanism is formed, and the cracks' width is greater than 15 mm; triggering a substantial rate of increase of the roof displacement (more than 5 mm), as observed in the capacity curve. Figure 16 also shows the roof drift thresholds representative of the four different performance levels which are used in the seismic performance assessment and fragility analyses in Sect. 6.2.

Capacity curves for the PRE-SMM typology: a in two principal directions and b effect of material quality on the capacity curve (note that the capacity curves in the transverse i.e. weakest direction are compared)
Figure 16b compares the capacity curves for the PRE-SMM typology for the three different material quality cases, showing substantial change in the ultimate capacity. An analytical study by D’Ayala and Kishali (2012) also found typically low lateral capacity with significant dispersion i.e. 0.07–0.19 g for two-storey Turkish SMM buildings which is comparable to the range for the PRE-SMM typology i.e. 0.02–0.13 g (Fig. 16b) in terms of the dispersion. It is thus important to improve the practice of material preparation as well as workmanship in the wall construction since both of these affect the resulting masonry fabric and hence the material properties. The poor quality case has more severe reduction (about 75%) in the ultimate capacity than the increment (about 60%) in the good quality case. However, in terms of ductility and the drift limits at different performance levels, only slight changes (± 10%) are observed. This is due to the fact that the roof drift is controlled by the crack patterns and crack width which are not affected substantially by the material quality in case of rubble stone masonry with inherently poor interlocking between the units, unless there is an introduction of ductile structural elements.
Figure 17 presents the ultimate collapse mechanisms of the PRE-SMM typology when loaded in the longitudinal and transverse directions. In the case of longitudinal direction loading, the building suffers torsional action due to the irregular distribution of openings and hence the damage starts at the weakest corner triggering the overturning collapse of the corner (Fig. 17a). The long wall with openings also suffers in-plane shear damage which ultimately activates the delamination in the transverse direction. In the case of transverse direction loading, diagonal shear crack originates at the corners of the openings in the short wall and in-plane shear failure including the corner collapse occurs (Fig. 17b). In both cases, the ultimate collapse mechanism involves the collapse of the short walls. These damage patterns are comparable to those observed on these buildings in the 2015 earthquake (see Fig. 1). It is important to notice the crucial function of the longitudinal internal timber structure, which prevents the floor and roof from collapsing, hence reducing the risk of injuries and fatalities, and allowing safe evacuation. The damage levels at the limit of different performance levels are shown and explained in Fig. 18.

Ultimate collapse mechanisms of the PRE-SMM IB when loaded along: a longitudinal and b transverse direction

Damage levels in the PRE-SMM IB at the limits of different performance levels
Figure 19 shows the actual damage state of the case study IB after the 2015 Gorkha earthquake which was surveyed by the first author during his field trip. Major vertical separation cracks (maximum crack width of about 20 mm) in both direction walls can be seen suggesting that the building was subjected to bi-directional effect of ground motion. Minor diagonal cracks (less than 5 mm) are also present in both long and short walls. Although the building suffered severe vertical separation cracks, it survived collapse.

Actual damage due to the 2015 earthquake in the case study PRE-SMM building from Sindhupalchowk district (vertical separation cracks have a maximum width of about 20 mm)
Both in the numerical analysis as well as in the observed damage (Figs. 18d, 19), excessive out-of-plane overturning of the walls is prevented, and the ultimate collapse mechanisms involves the corner failure and damage of short walls. This also indicates that the timber floor and the roof system promote the global box-type action.
5.3.2 POST-SMM IB
Figure 20a compare the capacity curves of an IB of the POST-SMM typology in the longitudinal and transverse directions. The capacity curves in both longitudinal and transverse direction are similar reaching a peak lateral capacity of 0.6 g. Figure 20 also shows the roof drift thresholds representative of the four different performance levels. These are used in the seismic performance assessment and fragility analyses in Sect. 6.2. Figure 20b compares the capacity curves for the POST-SMM typology for different material quality cases. There is again a considerable dispersion in the lateral capacity (± 30%), ductility (± 20%), and the thresholds life safety and collapse prevention performance levels (± 30%) due to the different quality of materials.

Capacity curves for the POST-SMM typology: a in two principal directions and b effect of material quality on the capacity curve (note that the capacity curves in the transverse direction are compared)
A recent study by Bothara et al. (2018b) also found typically high lateral capacity (about 1.0 g) for single-storeyed SMM school buildings from Nepal (Fig. 21). Slightly higher initial stiffness in the present study is observed, although a one order of magnitude higher elastic modulus is used in the school building analysis. This is justified by the difference in the layout of openings in the two construction typologies, i.e. the school building has several openings on the back wall as well (see Bothara et al. 2018b). In contrast, due to the higher values of tensile strength and shear modulus (and possibly higher value of friction coefficient, although not reported) in the analysis by Bothara et al. (2018b), the yield as well as ultimate strength capacities are considerably higher than the same from the present study.

Comparison of capacity curve for the POST-SMM IB in the long direction: this study and literature
Figure 22 presents the damage levels at the limits of different performance levels under the pushover analysis in the transverse direction. The seismic bands and the confining elements around the openings successfully contain and prevent the propagation of diagonal shear failure of the wall panels. The final collapse mechanism in POST-SMM buildings is shear sliding failure of masonry portions at the wall-band horizontal interfaces resulting in the compression failure at the corner (see Fig. 22d). Such shear-sliding failure modes are typical when there is low vertical pre-compression and low-strength mortar (Tomazevic 1999).

Damage levels in the POST-SMM IB at the limits of different performance levels
6 Seismic performance assessment and derivation of fragility/vulnerability functions
To conduct a quantitative comparison of the existing and newly built SMM buildings, the seismic capacity of the PRE-SMM and POST-SMM IBs are first assessed against the seismic demand set out by the Nepalese seismic design code (Sect 6.1). Considering a number of natural ground motion records, seismic fragility and vulnerability functions for both IBs are then presented and discussed in Sect 6.2.
6.1 Seismic performance assessment against the NBC 105: 2019
Since the PRE-SMM buildings follow a vernacular design, their compliance to the code can only be verified by seismic assessment. In Nepal, a seismic design code was drafted initially in 1994, and has been revised recently to produce NBC 105: 2019 (draft) by incorporating the approach of limit states and performance based design. Table 3 shows the design parameters chosen for characterizing the elastic spectrum, presented in Fig. 23.

Elastic site spectrum as per NBC 105: 2019 for a site in Sindhupalchowk district, Nepal
The performance points are obtained by applying the N2 method (Fajfar 2000) to the NBC 105: 2019 elastic site spectrum (Fig. 23) and determining the intersection point between the equivalent Single Degree of Freedom System (SDoF) capacity curve of each building to the inelastic spectrum. Note that for both typologies, the capacity curves in the transverse (weakest) direction are used for seismic performance assessment. The graphical presentation of the application of the N2 method for the PRE-SMM and POST-SMM IB, with average material quality are shown in Fig. 24 and the performance assessment results for all different material quality are summarized in Table 4. The performance levels listed in Table 4 are based on the position of performance point on the capacity curves with respect to the thresholds of performance levels identified in Figs. 16 and 20.

Graphical application of N2 method for seismic performance assessment of a PRE-SMM IB and b POST-SMM IB, both with average quality mortar, under the action of NBC 105: 2019 site spectrum
For the PRE-SMM typology, the seismic demand is far beyond the collapse prevention limit (Table 4), irrespective of the material quality, hence the seismic design level of PRE-SMM typology as per NBC 105: 2019 code can be said to be poor. On the other hand, the POST-SMM IB, which is designed as per the seismic design code (NBC 203: 2015), performs well within the immediate occupancy limit for average and good material quality cases while, the performance point lies in the life safety performance range for the poor material quality case. This confirms the importance of the quality of construction materials as well as the workmanship of the SMM constructions on their seismic performance.
6.2 Seismic fragility and vulnerability evaluation
Seismic fragility and vulnerability functions for a typology based on representative IBs are vital inputs in probabilistic seismic risk assessment studies at regional scale (e.g. see D’Ayala et al. 2015; Yamin et al. 2014). Mainly three approaches have been in use for deriving fragility and vulnerability functions: empirical, analytical and hybrid methods, each one with inherent pros and cons (see Calvi et al. 2006). Although for the 2015 Nepal earthquake a very detailed record of damage is available, spatially located and for a fairly uniform building stock, the derivation of empirical fragility and vulnerability functions is impaired by the poor network of seismic recording stations in the country such that the distribution of the intensity of ground shaking is not known with adequate reliability. Thus, the analytical approach outlined in D’Ayala et al. (2015) is followed in this study which takes into account the uncertainties in both hazard quantification and response capacity of the building (Silva et al. 2019). The uncertainty associated with material characterisation and modelling strategy have already been discussed in Sect. 4 and 5. For the hazard description, as there are very limited ground motion records available from seismic events in Nepal (Goda et al. 2015; Takai et al. 2016), a suite of 22 ground motions suggested in FEMA P695 (FEMA 2009) is used, in order to consider the effect of record-to-record variability. This ground motion suite contains a considerable dispersion in the ground motion characteristics such as the total time of shaking, PGA, frequency content, energy content etc.
For the statistical fitting of fragility functions, numerous performance points under several ground motions are required so that enough data points for each performance level can be obtained. Hence the use of Incremental Dynamic Analysis (IDA) (Vamvatsikos and Cornell 2002) requiring numerous non-linear time history analyses (NLTHA) would be highly resource and time consuming, particularly for the modelling approach adopted in this study. Hence the simplified but validated N2 method (Fajfar 2000; D’Ayala et al. 2015) also recommended by Eurocode 8 (EN 1998-1), is employed for the seismic performance assessment with the suite of the FEMA P695 scaled ground motions . While concerns are often expressed about the validity of the performance points obtained by the scaling of ground motions , although common in research and practice, Vamvatsikos and Cornell (2002) have discussed the legitimacy of scaling.
Figure 25 presents the cloud of performance points for PRE-SMM and POST-SMM typologies, for the average quality case, obtained with the application of N2 method. Several hundred performance points are generated such that enough points are available for the entire range of performance levels. Also shown in these figures are the drift thresholds for different performance levels so that the median PGA and dispersion at each performance level resulting from the record-to-record variability can be appreciated. While it is recognised that the 5% damped spectral acceleration at first-mode, Sa(T1) is a more efficient intensity measure (IM) for first-mode dominated structures (Shome et al. 1998; Silva et al. 2019), the use of PGA as the IM in this study is dictated by the fact that these are low-period structures while the comparison of fragility/vulnerability functions for two buildings with substantially different fundamental period and strength capacity, becomes meaningful when using the PGA as IM. It is also worth mentioning that because of very low tensile strength and cohesion values, SMM buildings develop highly non-linear behaviour even with modest level of deformations , causing the lengthening of the first-mode period of the structure, making Sa(T1) less reliable (e.g. see Ebrahimian et al. 2014).

Cloud of performance points for: a PRE-SMM typology and b POST-SMM typology (with average quality mortar) under a suite of FEMA P695 set of 22 ground motions
Based on the performance point distribution and the thresholds of performance levels presented in Fig. 25, the derivation of fragility functions is performed statistically using the least square regression method, as detailed in D’Ayala et al. (2015). Tables 5 and 6 present the median and dispersion of the PGA capacity for different performance levels for the PRE-SMM and POST-SMM IBs with different material quality cases. The same information is presented in terms of fragility curves in Fig. 26. The immediate occupancy limit is exceeded for the PRE-SMM IB at a median PGA of as low as 0.05 g, even with good material quality while the same limit is exceeded for the POST-SMM IB only at a median PGA of about 0.17 g, even with poor material quality. Similarly, for the PRE-SMM IB, the median PGA for exceeding the collapse prevention limit is about 0.30 g, even with good material quality while the same for POST-SMM IB is exceeded at a median PGA of about 0.80 g, even with poor material quality. For both IBs, the fragility functions, particularly for the life safety and collapse prevention performance levels, present significant dispersion.

Seismic fragility functions for: a PRE-SMM IB and b POST-SMM IB. Dispersion due to the material quality is also shown
In Fig. 27, the fragility functions for the PRE-SMM IB are compared against the fragility functions from the studies conducted by Guragain (2015). It should be noted that the fragility curves reported in Guragain (2015) represents a broader class of PRE-SMM typology (i.e. single and two-storeyed) hence the median PGA exceeding each damage state is generally higher in their study. Moreover, the dispersion in the fragility functions for each performance level is also higher in Guragain (2015) study except for the collapse prevention performance level.

Comparison of fragility curves for PRE-SMM typology from this study and from Guragain (2015)
From the fragility functions (Fig. 26), vulnerability functions for the PRE-SMM and POST-SMM IBs are generated by computing the damage probabilities for each damage states at a given IM (i.e. PGA) level and then convoluting with a consequence model (see Yamin et al. 2014; D’Ayala et al. 2015). HAZUS (FEMA 2012) consequence model for residential building class are used in this study, as a country-specific damage to loss functions for Nepalese SMM buildings has not been developed yet and the loss functions would be dependent on factors whose quantification is beyond the scopes of this study, such as the cost of materials, labour cost, policies etc. (see Hill and Rossetto 2008; Bal et al. 2008; D’Ayala et al. 2015 etc.). While the authors are aware of the limitations of such choice, the HAZUS consequence model has been used by other researchers for seismic loss assessment in developing countries, e.g. Pakistan (Ahmad et al. 2014), and can be used for comparison of relative vulnerability within the same scenario. The resulting seismic vulnerability functions for the PRE-SMM and POST-SMM IBs are presented in Fig. 28. The Mean Damage Ratio (MDR) represents the ratio of the building repair cost to the replacement cost. It is noteworthy that due to the different material quality, the PGA for 50% MDR has a dispersion of more than ± 50% in both cases which is very high and shows that the global vulnerability can be substantially reduced using good quality materials as well as with proper workmanship in the SMM construction. The vulnerability curves for both PRE- and POST-SMM IBs are compared in Fig. 29. For the PRE-SMM IB, a ground motion with PGA of as low as 0.11 g can cause 50% MDR while for the POST-SMM IB, a similar level of loss is reached at a PGA level of about 1.00 g. Thus, on average, it can be said that the PRE-SMM typologies are one order of magnitude more vulnerable than the POST-SMM typology.

Seismic vulnerability functions for: a PRE-SMM IB and b POST-SMM IB. Dispersion due to the material quality is also shown

Comparison of seismic vulnerability functions for the PRE- and POST-SMM typologies with average material quality
The shake map from the 2015 Nepal earthquake (USGS 2015) estimated a PGA range of 0.30–0.80 g in the most affected districts which is far more than 0.11 g (i.e. the average PGA level causing 50% MDR for the PRE-SMM IB), hence the heavy damage to the PRE-SMM typology was inevitable. For a similar intensity level, the MDR for the POST-SMM buildings would be less than 30%, meaning that only repairable damage can be expected.
7 Conclusions
The main reason of the widespread damage sustained by the residential buildings in the 2015 Nepal earthquake sequence is the poor seismic performance of the most common traditionally built SMM construction, which lacked adequate seismic resistant features. Although the construction practice and seismic design level of residential buildings in Nepal have noticeably improved after the 2015 Gorkha earthquake and the country is aiming to improve the seismic resilience of communities in the post-earthquake reconstruction, there are several pressing issues such as: small sized houses affecting the livelihood of the communities, poor inspection of workmanship defects and code-compliance in the reconstruction. NRA needs to implement timely and effective remedial policies to improve the seismic resilience and social-cultural aspects of the post-earthquake reconstruction.
As proven by the results of the validation and calibration studies, as well as by the comparison of actual and numerical failure modes presented in this study, applied element method can be used as an effective tool to model and study the seismic behaviour of SMM constructions. In particular, the use of triangular meshing and clustering to generate irregular elements that represent the random shape of rubble stone units seems an appropriate strategy to account for the randomness of the units in such masonry fabrics.
From the analysis results and discussions presented in this paper, it is found that the seismic capacity of the PRE-SMM typology is very low in both principal directions, the shorter direction being the weakest. The median PGA capacity for collapse prevention performance level for the PRE-SMM typology is low at about 0.17 g, against the PGA distribution of 0.25 g to 0.35 g in the mountainous district as per the NBC 105: 2019. Vertical separation cracks and corner failure triggering the collapse of short walls is the main failure mode in the PRE-SMM buildings, as confirmed by the observed damage as well as the results of numerical analyses. Thus, the seismic strengthening of the PRE-SMM buildings is urgent, and the strengthening strategy should aim at increasing the overall stiffness, ultimate strength as well as the ductility of these buildings.
On the other hand, being single-storeyed and designed as per the NBC 203: 2015, the POST-SMM construction has adequate stiffness and strength, thus performing within the life safety performance level against the seismic demand as per NBC 105: 2019. The median PGA capacity for life safety performance level is about 0.95 g against the PGA distribution of 0.25 g to 0.35 g in the mountainous district as per the NBC 105: 2019. Due to the presence of seismic bands at different levels along the height, the diagonal shear failure of walls is restricted and the main failure mode in the POST-SMM buildings is the shear-sliding of masonry walls along the wall-band interfaces.
Sensitivity analysis on the uncertainty related to the material quality shows that the lateral capacity can vary significantly from one building to next, due to the lack of quality control in SMM constructions. Therefore, material preparation and workmanship should be given importance in the construction of these buildings.
As the seismic retrofitting of the PRE-SMM buildings (both partially damaged and undamaged) is currently ongoing in Nepal, the future work will focus on the study of comparative improvement in the seismic capacity of these buildings due to different retrofitting interventions currently being employed.
References
Adhikari RK, D’Ayala D (2019a) 2015 Nepal earthquake: seismic performance and post-earthquake reconstruction of stone masonry buildings. EEFIT report, Institution of Structural Engineers, UK
Adhikari RK, D’Ayala D (2019b) Applied element modelling and pushover analysis of unreinforced masonry buildings with flexible roof diaphragm. In: 7th international conference on computational methods in structural dynamics and earthquake engineering, Crete, Greece
Bothara JK, Ahmad, N, Ingham J, Dizhur D (2019) Experimental seismic testing of semi-reinforced stone masonry building in mud mortar. In: 2019 Pacific conference on earthquake engineering and annual NZSEE conference, Auckland, New Zealand
Ahmad N, Ali Q, Crowley H, Pinho R (2014) Earthquake loss estimation of residential buildings in Pakistan. Nat Hazards 73(3):1889–1955
ASI (2018) Extreme loading for structures V6. Applied Science International LLC, Durham
Bal İE, Crowley H, Pinho R, Gülay FG (2008) Detailed assessment of structural characteristics of Turkish RC building stock for loss assessment models. Soil Dyn Earthq Eng 28(10–11):914–932. https://doi.org/10.1016/j.soildyn.2007.10.005
Bhagat S, Samith Buddika HAD, Adhikari RK, Shrestha A, Bajracharya S, Joshi R, Maharjan R, Wijeyewickrema AC (2018) Damage to cultural heritage structures and buildings due to the 2015 Nepal Gorkha earthquake. J Earthq Eng 22(10):1861–1880
Bothara J, Brzev S (2011) A tutorial: improving the seismic performance of stone masonry buildings. Earthquake Engineering Research Institute, Oakland
Bothara JK, Dhakal RP, Mander JB (2010) Seismic performance of an unreinforced masonry building: an experimental investigation. Earthq Eng Struct Dynam 39(1):45–68
Bothara JK, Giongo I, Ingham J, Dizhur D (2018a) Masonry building design for earthquake-affected remote areas of Nepal. In: 10th Australian masonry conference, Sydney, Australia
Bothara JK, Giongo I, Ingham J, Dizhur D (2018b) Numerical study on partially-reinforced semi-dressed stone masonry for build-back-better in Nepal. In: 10th international masonry conference, Milan, Italy
Build Change (2019) Laboratory test report on stone masonry in mud mortar. Build Change report
Calvi GM, Pinho R, Magenes G, Bommer JJ, Restrepo-Vélez LF, Crowley H (2006) Development of seismic vulnerability assessment methodologies over the past 30 years. ISET J Earthq Technol 43(3):75–104
Chaulagain H, Rodrigues H, Jara J et al (2013) Seismic response of current RC buildings in Nepal: a comparative analysis of different design/construction. Eng Struct 49:284–294
D’Altri AM, Sarhosis V, Milani G, Rots J, Cattari S, Lagomarsino S, Sacco E, Tralli A, Castellazzi G, de Miranda S (2019) Modeling strategies for the computational analysis of unreinforced masonry structures: review and classification. Arch Comput Methods Eng 6:1–33
D’Ayala D (2004) Correlation of fragility curves for vernacular building types: houses in Lalitpur, Nepal and in Istanbul, Turkey. In: 13th world conference of earthquake engineering, Vancouver, Canada
D’Ayala D (2013) Assessing the seismic vulnerability of masonry buildings. In: Goda K, Tesfamariam S (eds) Handbook of seismic risk analysis and management of civil infrastructure systems. Woodhead Publishing, Hoboken, pp 334–365
D’Ayala D, Bajracharya SSR (2003) Housing report: traditional Nawari house in Kathmandu valley. World Housing Encyclopedia
D’Ayala D, Kishali E (2012) Analytically derived fragility curves for unreinforced masonry buildings in urban contexts. In: 15th world conference of earthquake engineering, Lisbon, Portugal
D’Ayala D, Speranza E (2003) Definition of collapse mechanisms and seismic vulnerability of historic masonry buildings. Earthq Spectra 19:479–509
D’Ayala D, Meslem A, Vamvatsikos D, Porter K, Rossetto T, Silva V (2015) Guidelines for analytical vulnerability assessment of low/mid-rise buildings. Technical report, GEM Foundation, Pavia, Italy. https://doi.org/10.13117/GEM.VULN-MOD.TR2014.12
Dizhur D, Dhakal RP, Bothara J, Ingham J (2016) Building typologies and failure modes observed in the 2015 Gorkha (Nepal) earthquake. Bull N Z Soc Earthq Eng 49:211–232. https://doi.org/10.5459/bnzsee.49.2.211-232
Ebrahimian H, Jalayer F, Lucchini A, Mollaioli F, de Dominicis R (2014) Case studies on relative sufficiency of alternative intensity measures of ground shaking. In: Second European conference on earthquake engineering and seismology (2ECEES), Istanbul, Turkey
EN 1996-1-1: Eurocode 6—design of masonry structures—part 1-1: general rules for reinforced and unreinforced masonry structures
EN 1998-1: Eurocode 8—design of structures for earthquake resistance—part 1: general rules, seismic actions and rules for buildings
Fajfar P (2000) A nonlinear analysis method for performance-based seismic design. Earthq Spectra 16(3):573–592
FEMA (2000) FEMA 356: pre-standard and commentary for the seismic rehabilitation of buildings. Federal Emergency Management Agency, Washington, D.C., USA
FEMA (2009) FEMA P695: quantification of building seismic performance factors. Federal Emergency Management Agency, Washington, D.C., USA
FEMA (2012) Multi-hazard loss estimation methodology, earthquake model, HAZUS®–MH 2.1 technical manual, Federal Emergency Management Agency, Washington, D.C., USA
Gautam D, Rodrigues H, Bhetwal KK, Neupane P, Sanada Y (2016) Common structural and construction deficiencies of Nepalese buildings. Innov Infrastruct Solut 1:1
Goda K, Kiyota T, Pokhrel RM et al (2015) The 2015 Gorkha Nepal earthquake: insights from earthquake damage survey. Front Built Environ 1:8
Grünthal G (1998) European macroseismic scale 1998. European Seismological Commission, Luxemburg
Guragain R (2015) Development of earthquake risk assessment system for Nepal. Dissertation, University of Tokyo
Hill MP, Rossetto T (2008) Do existing damage scales meet the needs of seismic loss estimation. In: 14th world conference on earthquake engineering, Beijing, China
HRRP (2018) Housing typologies: earthquake affected districts. Housing Recovery and Reconstruction Platform (HRRP), Nepal
Karbassi A, Nollet MJ (2013) Performance-based seismic vulnerability evaluation of masonry buildings using applied element method in a nonlinear dynamic-based analytical procedure. Earthq Spectra 29(2):399–426
Lagomarsino S, Penna A, Galasco A, Cattari S (2013) TREMURI program: an equivalent frame model for the nonlinear seismic analysis of masonry buildings. Eng Struct 56:1787–1799
Lemos JV, Campos Costa A (2017) Simulation of shake table tests on out-of-plane masonry buildings. Part (V): discrete element approach. Int J Archit Herit 1:117–124. https://doi.org/10.1080/15583058.2016.1237587
Lourenço PB, Rots JG (1997) Multisurface interface model for analysis of masonry structures. J Eng Mech 123(7):660–668
Malomo D, Pinho R, Penna A (2018) Using the applied element method for modelling calcium silicate brick masonry subjected to in-plane cyclic loading. Earthq Eng Struct Dyn 47:1610–1630. https://doi.org/10.1002/eqe.3032
Malomo D, Pinho R, Penna A (2019a) Applied element modelling of the dynamic response of a full-scale clay brick masonry building specimen with flexible diaphragms. Int J Archit Herit 25:1–8
Malomo D, DeJong MJ, Penna A (2019b) Influence of bond pattern on the in-plane behavior of URM piers. Int J Archit Herit 14:1–20
Milosevic J, Lopes M, Gago AS, Bento R (2013) Testing and modeling the diagonal tension strength of rubble stone masonry panels. Eng Struct 52:581–591
MSJC (2011) Building code requirements and specification for masonry structures. Masonry Standards Joint Committee
NBC 203 (1994) Guidelines for earthquake resistant building construction: low strength masonry. Nepal National Building Code, Government of Nepal
NBC 203 (2015) Guidelines for earthquake resistant building construction: low strength masonry. Nepal National Building Code, Government of Nepal
NBC 105 (2019) Seismic design of buildings in Nepal, Nepal National Building Code, Government of Nepal
Nepali Times (2018) Building homes on a deadline. https://www.nepalitimes.com/here-now/building-homes-on-a-deadline/. Accessed 10 Oct 2019
NPC (2015) Nepal earthquake 2015: post disaster needs assessment, volume A: key findings, National Planning Commission, Government of Nepal
NRA (2015) Design catalogue for reconstruction of earthquake resistant houses: volume I. Notational Reconstruction Authority, Nepal
NRA (2016a) Structures damage grade at 14 earthquake affected districts. National Reconstruction Authority, Nepal. http://nra.gov.np/uploads/map/Dst4eN4cZh170222093518.pdf. Accessed 10 Oct 2019
NRA (2016b) Nepal earthquake 2015: post disaster recovery framework (2016–2020). National Reconstruction Authority, Government of Nepal
NRA (2016c) Inspection manual for houses that has been built under housing reconstruction programme. National Reconstruction Authority, Government of Nepal
NRA (2017) Correction/exception manual for masonry structure for houses that have been built under the housing reconstruction programme. National Reconstruction Authority, Nepal
NRA (2019a) Statistics of reconstruction in Sindhupalchowk district. Central Level Project Implementation Unit, National Reconstruction Authority, Nepal
NRA (2019b) Central Level Project Implementation Unit Official Website. http://202.45.144.197/nfdnfis/clpiu/index.htm. Accessed 10 Oct 2019
Parajuli RR, Kiyono J (2015) Ground motion characteristics of the 2015 Gorkha earthquake, survey of damage to stone masonry structures and structural field tests. Front Built Environ. https://doi.org/10.3389/fbuil.2015.00023
Pun R (2015) Improvement in seismic performance of stone masonry using galvanized steel wire. Dissertation, University of Technology Sydney
Sharma K, Apil KC, Subedi M, Pokharel B (2018) Post disaster reconstruction after 2015 Gorkha earthquake: challenges and influencing factors. J Inst Eng 14:52–63
Shome N, Cornell CA, Bazzurro P, Carballo JE (1998) Earthquakes, records, and nonlinear responses. Earthq Spectra 14(3):469–500
Silva V, Akkar S, Baker J et al (2019) Current challenges and future trends in analytical fragility and vulnerability modelling. Earthq Spectra. https://doi.org/10.1193/042418eqs101o
Spence R, D’Ayala D (1999) Damage assessment and analysis of the 1997 Umbria-Marche earthquakes. Struct Eng Int 9(3):229–233
Takai N, Shigefuji M, Rajaure S, Bijukchhen S, Ichiyanagi M, Dhital MR, Sasatani T (2016) Strong ground motion in the Kathmandu Valley during the 2015 Gorkha, Nepal, earthquake. Earth Planets Space 68(1):10
Thapa DR, Wang G (2013) Probabilistic seismic hazard analysis in Nepal. Earthq Eng Eng Vib 12:577–586
Tomazevic M (1999) Earthquake-resistant design of masonry buildings. Imperial College Press, London
UNISDR (2015a) Sendai framework for disaster risk reduction 2015–2030. United Nations International Strategy for Disaster Reduction, Geneva, Switzerland
UNISDR (2015b) Reconstructing after disasters: build back better. Ministerial Roundtable, UN World Conference on Disaster Risk Reduction, Sendai, Japan
USGS (2015) M 7.8–36 km E of Khudi, Nepal. U.S. Geological Survey Official Website. http://earthquake.usgs.gov/earthquakes/eventpage/us20002926#general. Accessed 10 Oct 2019
Vamvatsikos D, Cornell CA (2002) Incremental dynamic analysis. Earthq Eng Struct Dyn 31(3):491–514
Vasconcelos G, Lourenço PB (2009) In-plane experimental behavior of stone masonry walls under cyclic loading. J Struct Eng 135(10):1269–1277
Wang M, Liu K, Lu H et al (2018) In-plane cyclic tests of seismic retrofits of rubble-stone masonry walls. Bull Earthq Eng 16:1941. https://doi.org/10.1007/s10518-017-0262-z
Wilkinson S, DeJong M, Novelli V et al (2019) The Mw 7.8 Gorkha, Nepal earthquake of the 25th April 2015: a field report By EEFIT, Institution of Structural Engineers
Yamin LE, Hurtado AI, Barbat AH, Cardona OD (2014) Seismic and wind vulnerability assessment for the GAR-13 global risk assessment. Int J Disaster Risk Reduct 10:452–460
Acknowledgements
The funding provided by the Institution of Structural Engineers, UK through ‘2018 EEFIT Research Grant Scheme’ for the field visit and research work presented herein is gratefully acknowledged. We also want to acknowledge the funding provided by the UK Government’s Global Challenges Research Fund through the UK Natural Environment Research Council for ‘Promoting Safer Buildings (PSB)’ project, as some of the data and information presented in this report were collected during the field mission in early 2018 as part of the PSB project. The authors are grateful to Prof Prem Nath Maskey and Dr Ramesh Guragain for having fruitful discussions on the construction characteristics of masonry buildings and ongoing reconstruction in Nepal.
Author information
Authors and Affiliations
Corresponding author
Additional information
Publisher's Note
Springer Nature remains neutral with regard to jurisdictional claims in published maps and institutional affiliations.
Rights and permissions
Open Access This article is licensed under a Creative Commons Attribution 4.0 International License, which permits use, sharing, adaptation, distribution and reproduction in any medium or format, as long as you give appropriate credit to the original author(s) and the source, provide a link to the Creative Commons licence, and indicate if changes were made. The images or other third party material in this article are included in the article's Creative Commons licence, unless indicated otherwise in a credit line to the material. If material is not included in the article's Creative Commons licence and your intended use is not permitted by statutory regulation or exceeds the permitted use, you will need to obtain permission directly from the copyright holder. To view a copy of this licence, visit http://creativecommons.org/licenses/by/4.0/.
About this article

Cite this article
Adhikari, R.K., D’Ayala, D. 2015 Nepal earthquake: seismic performance and post-earthquake reconstruction of stone in mud mortar masonry buildings. Bull Earthquake Eng 18, 3863–3896 (2020). https://doi.org/10.1007/s10518-020-00834-y
Received:
Accepted:
Published:
Issue Date:
DOI: https://doi.org/10.1007/s10518-020-00834-y