Novel Anthraquinone Compounds Inhibit Colon Cancer Cell Proliferation via the Reactive Oxygen Species/JNK Pathway

 , ,
, ,
Abstract
:
1. Introduction
2. Results
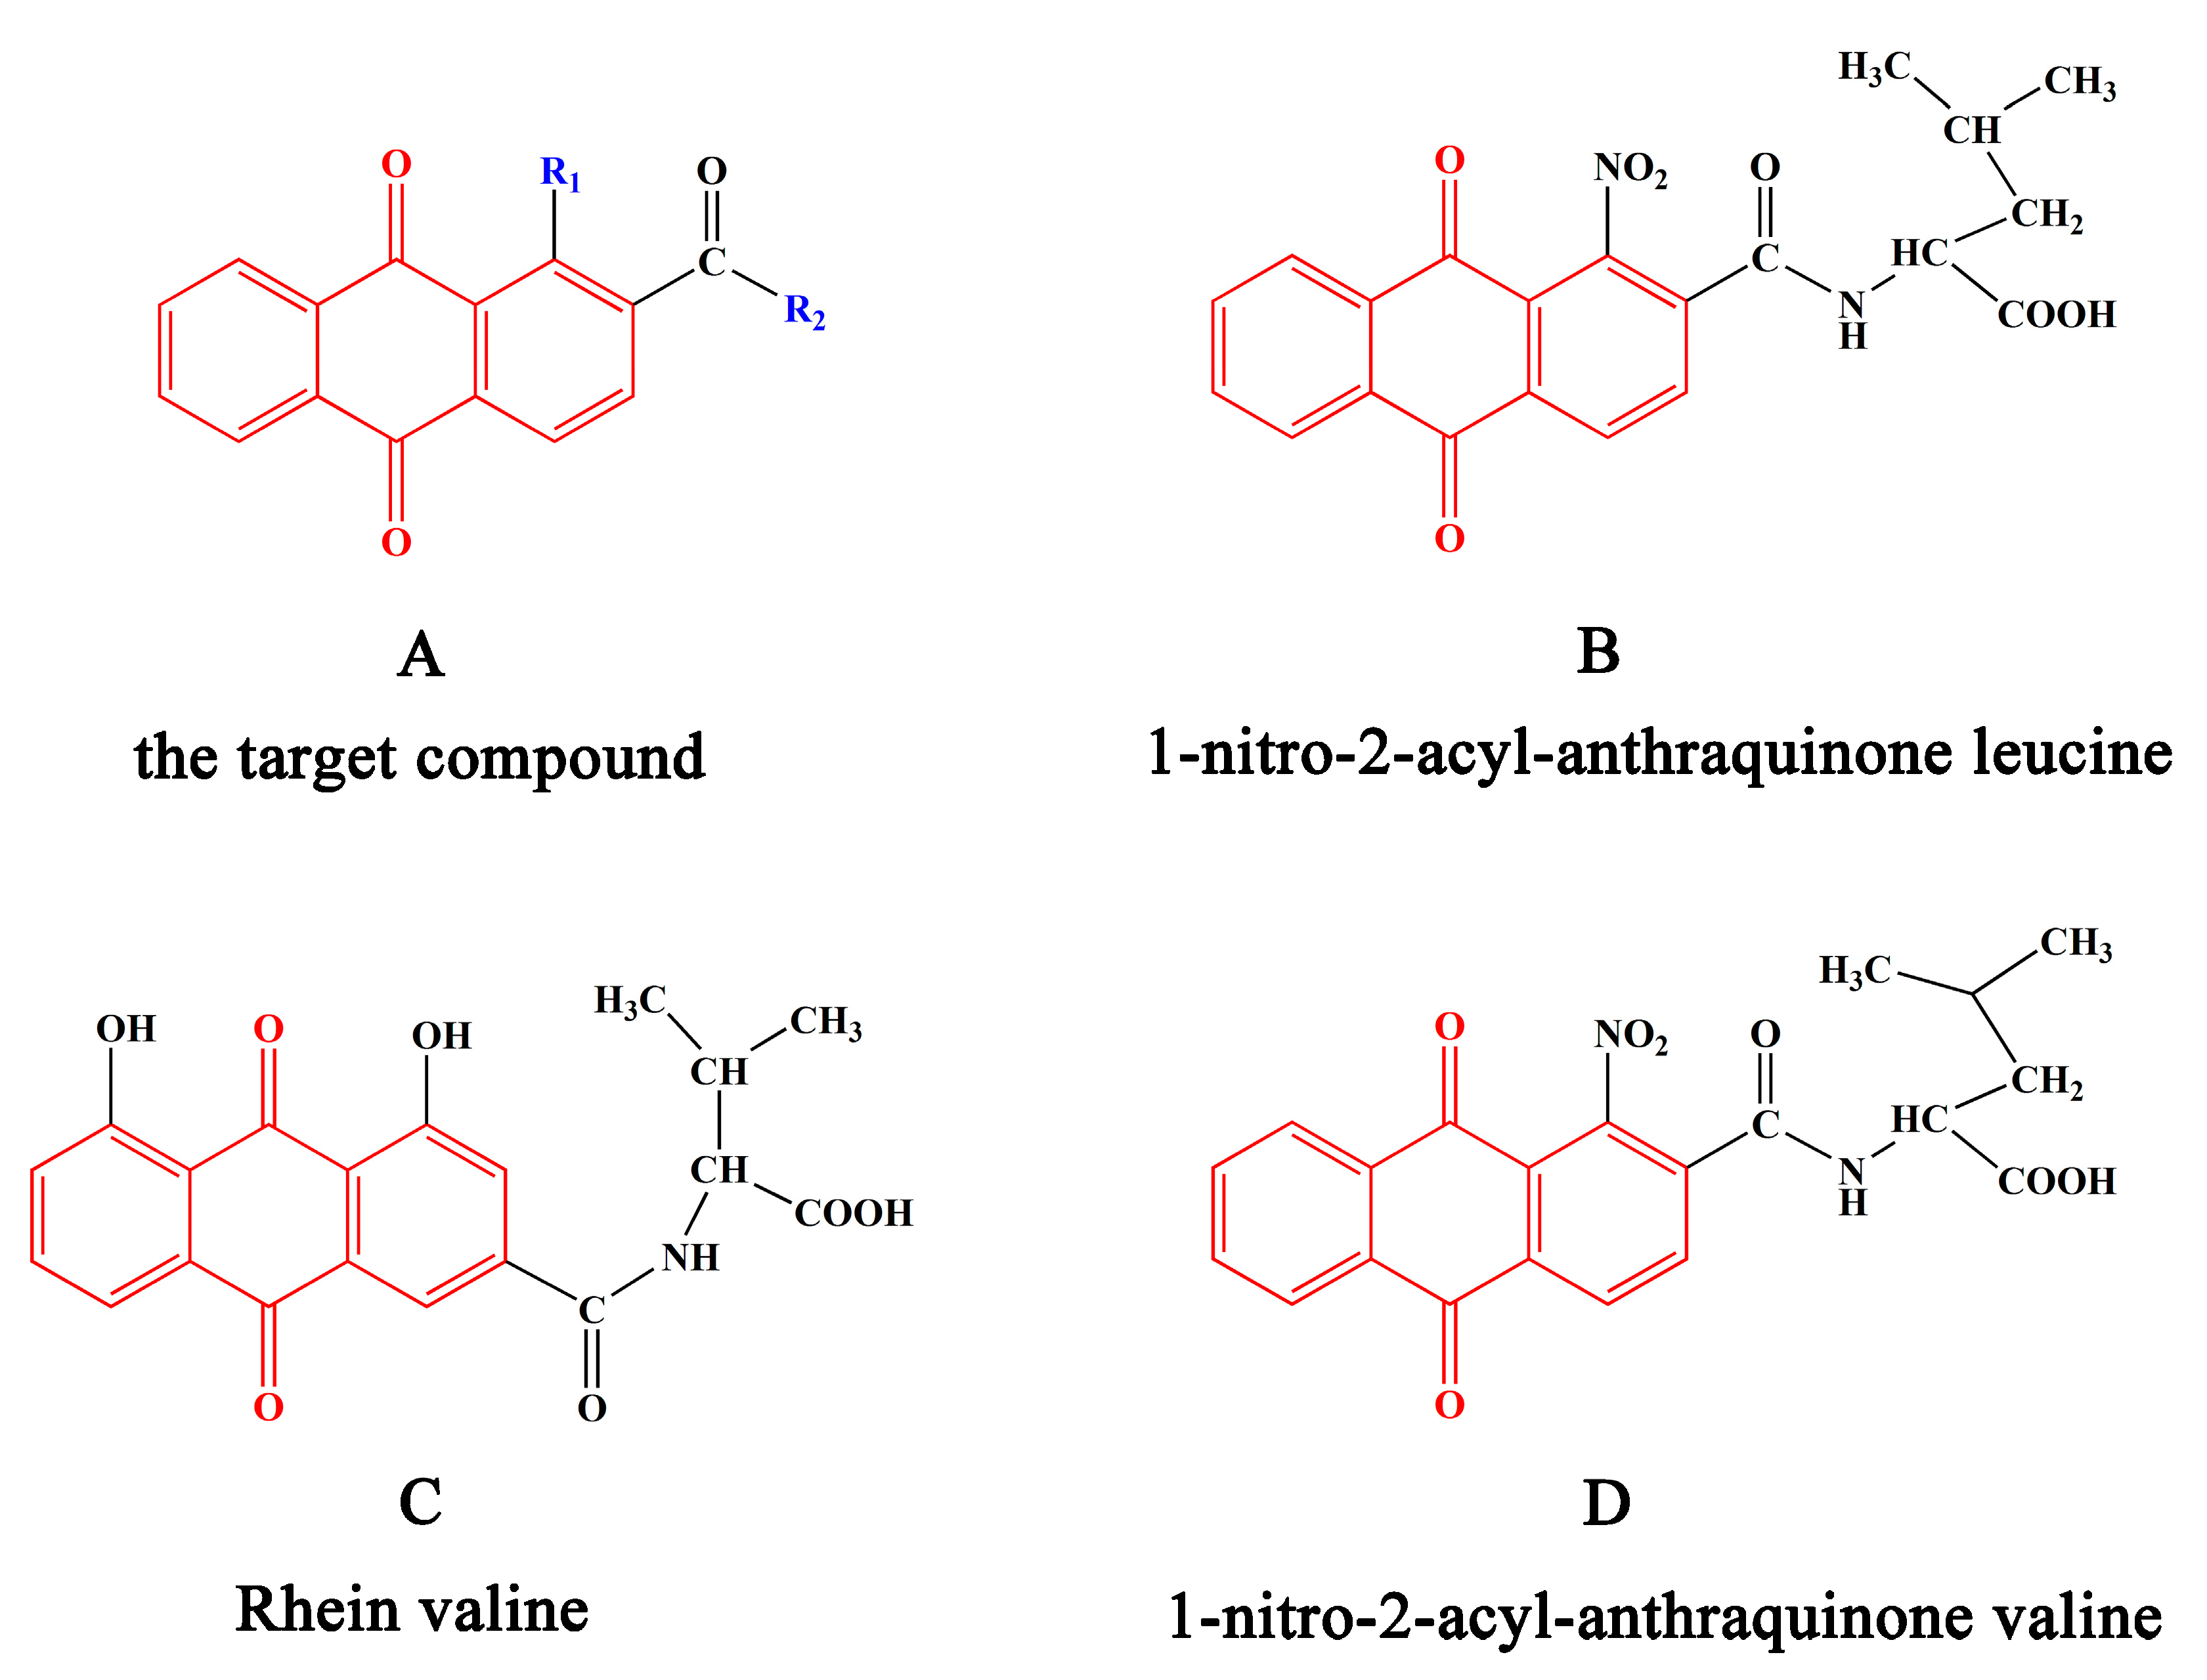
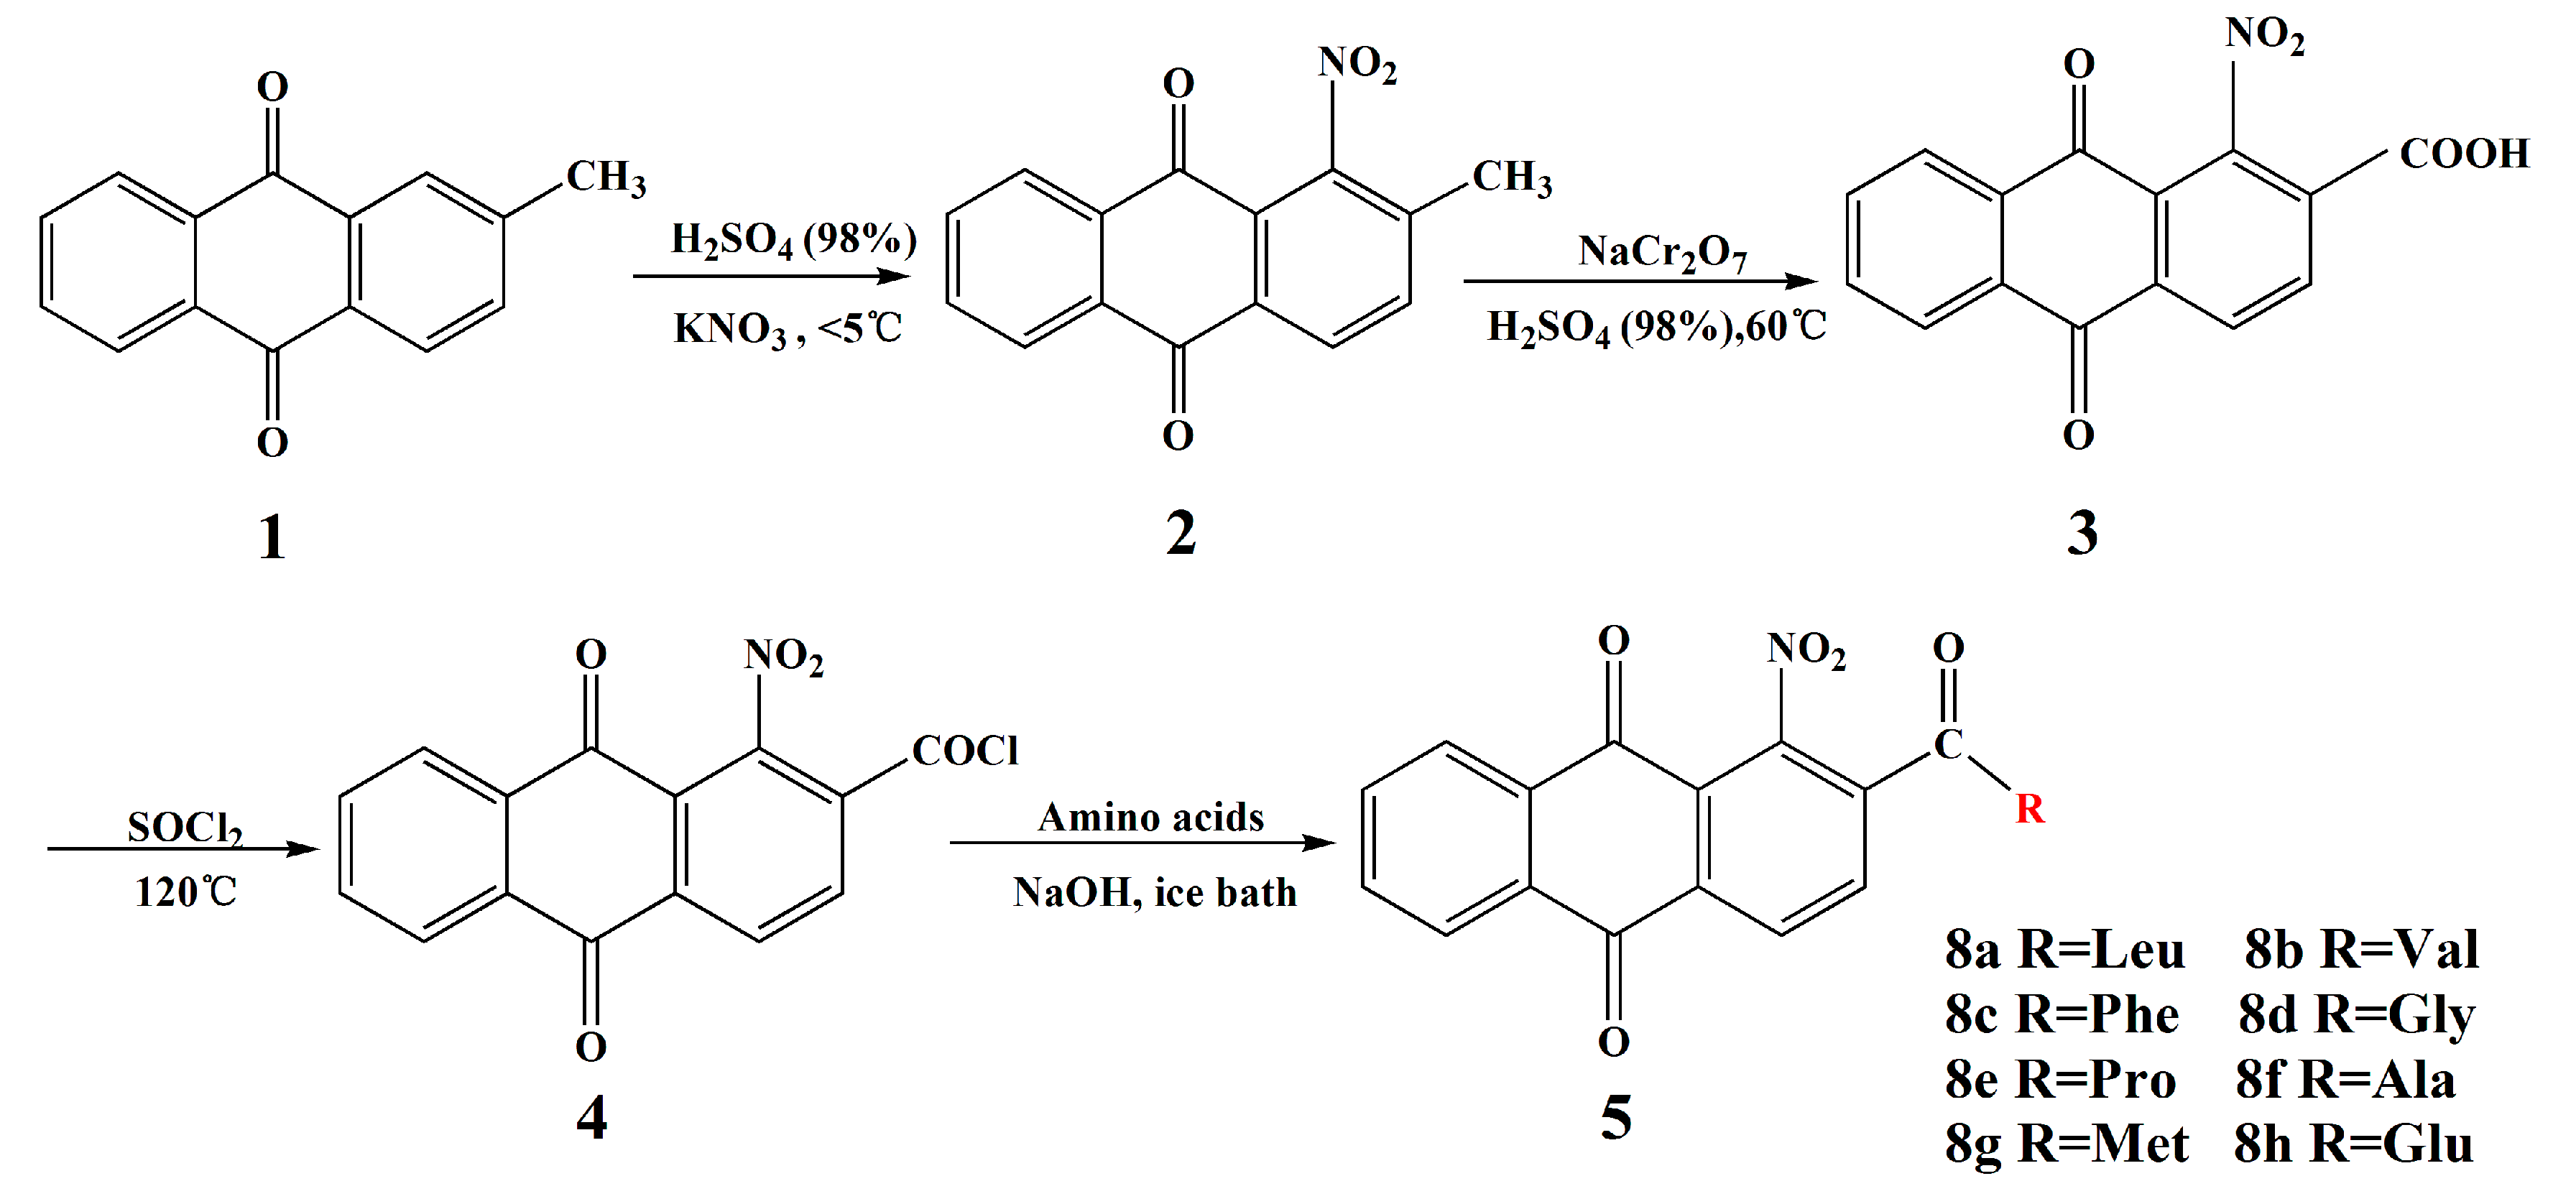
2.1. Chemistry
2.2. Compound 8a Inhibits Tumor Cell Proliferation But Does Not Affect Normal Cells
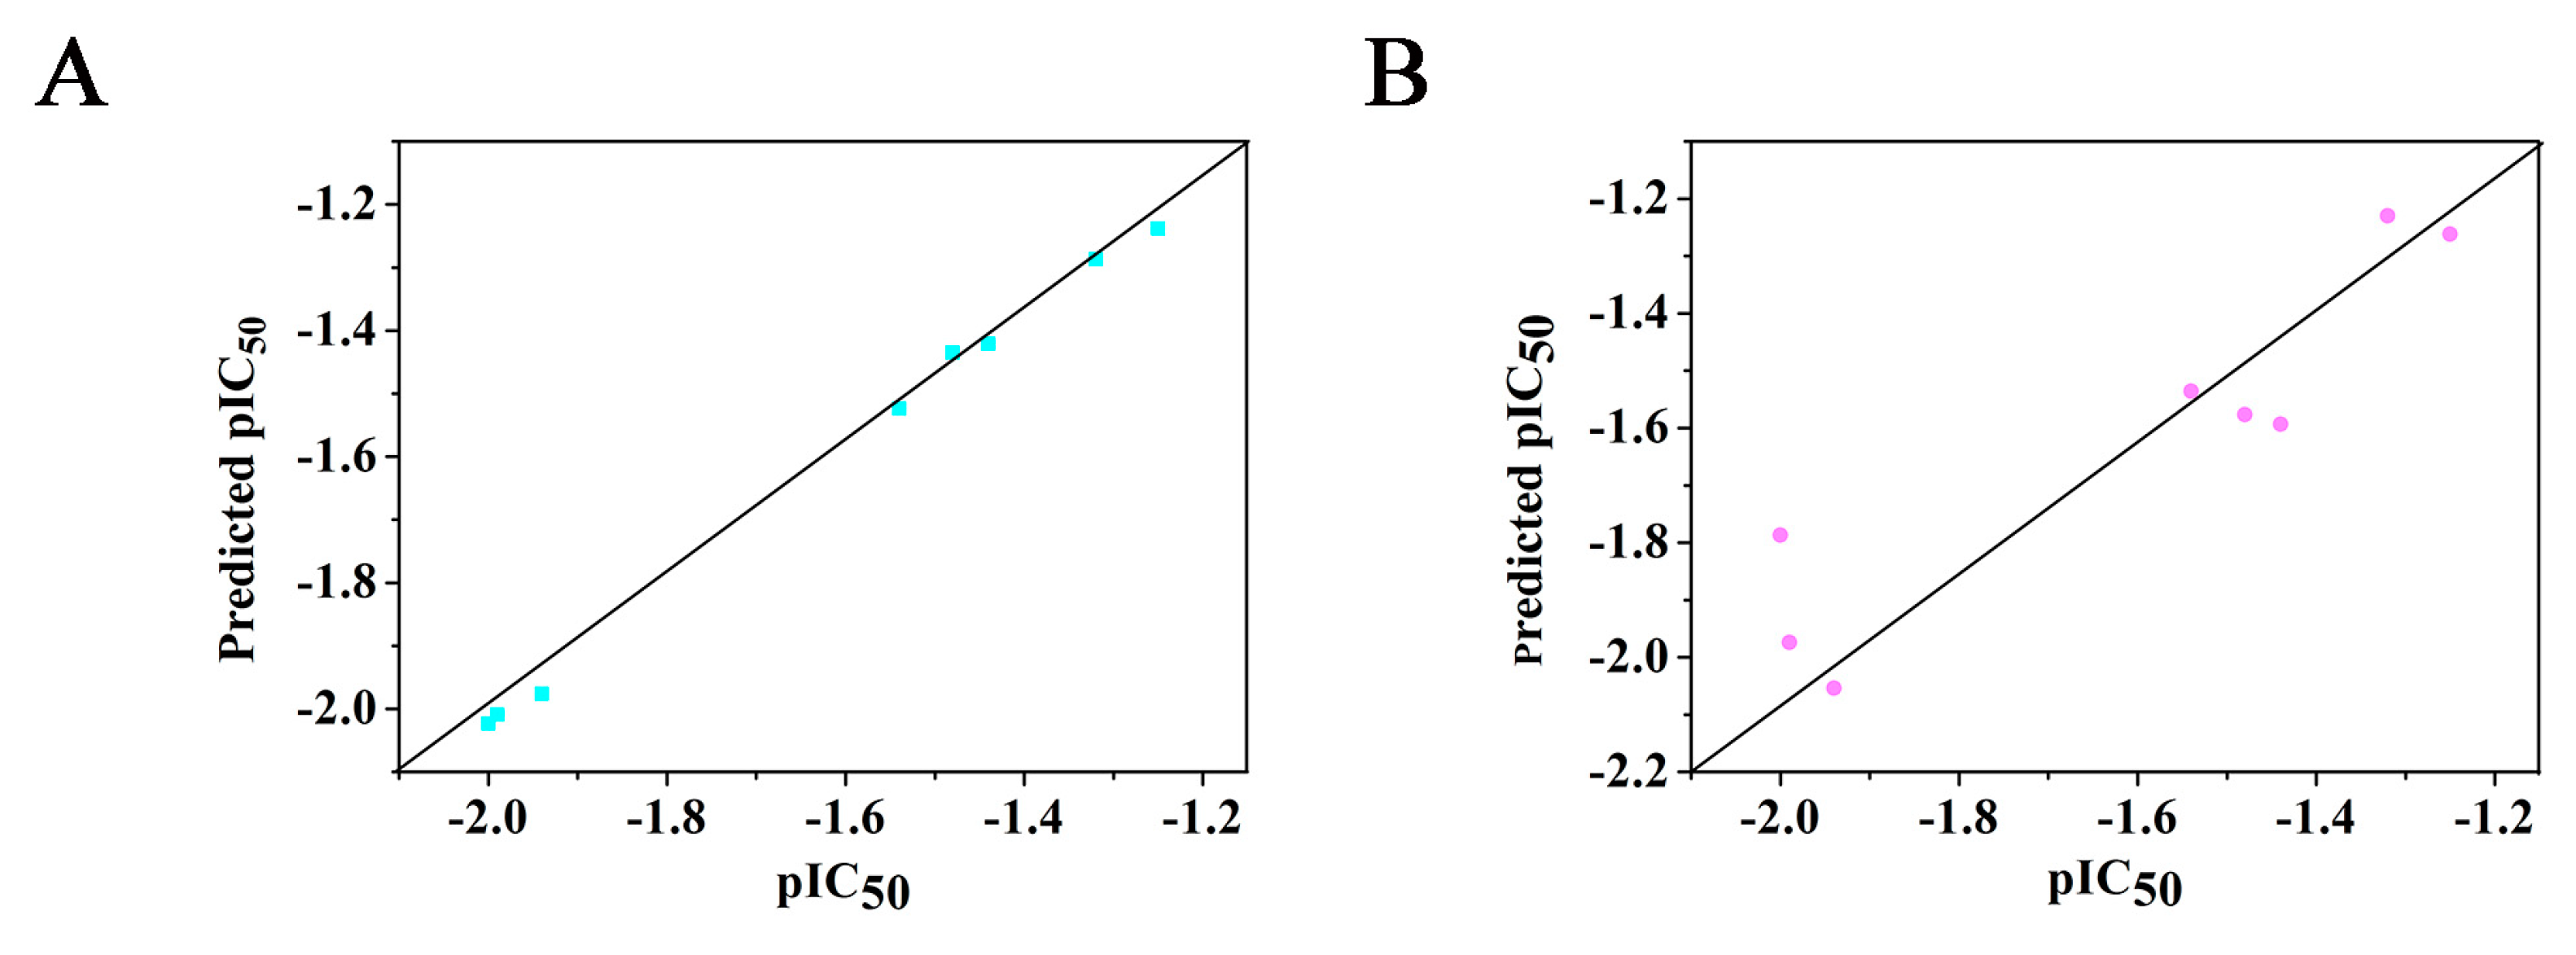
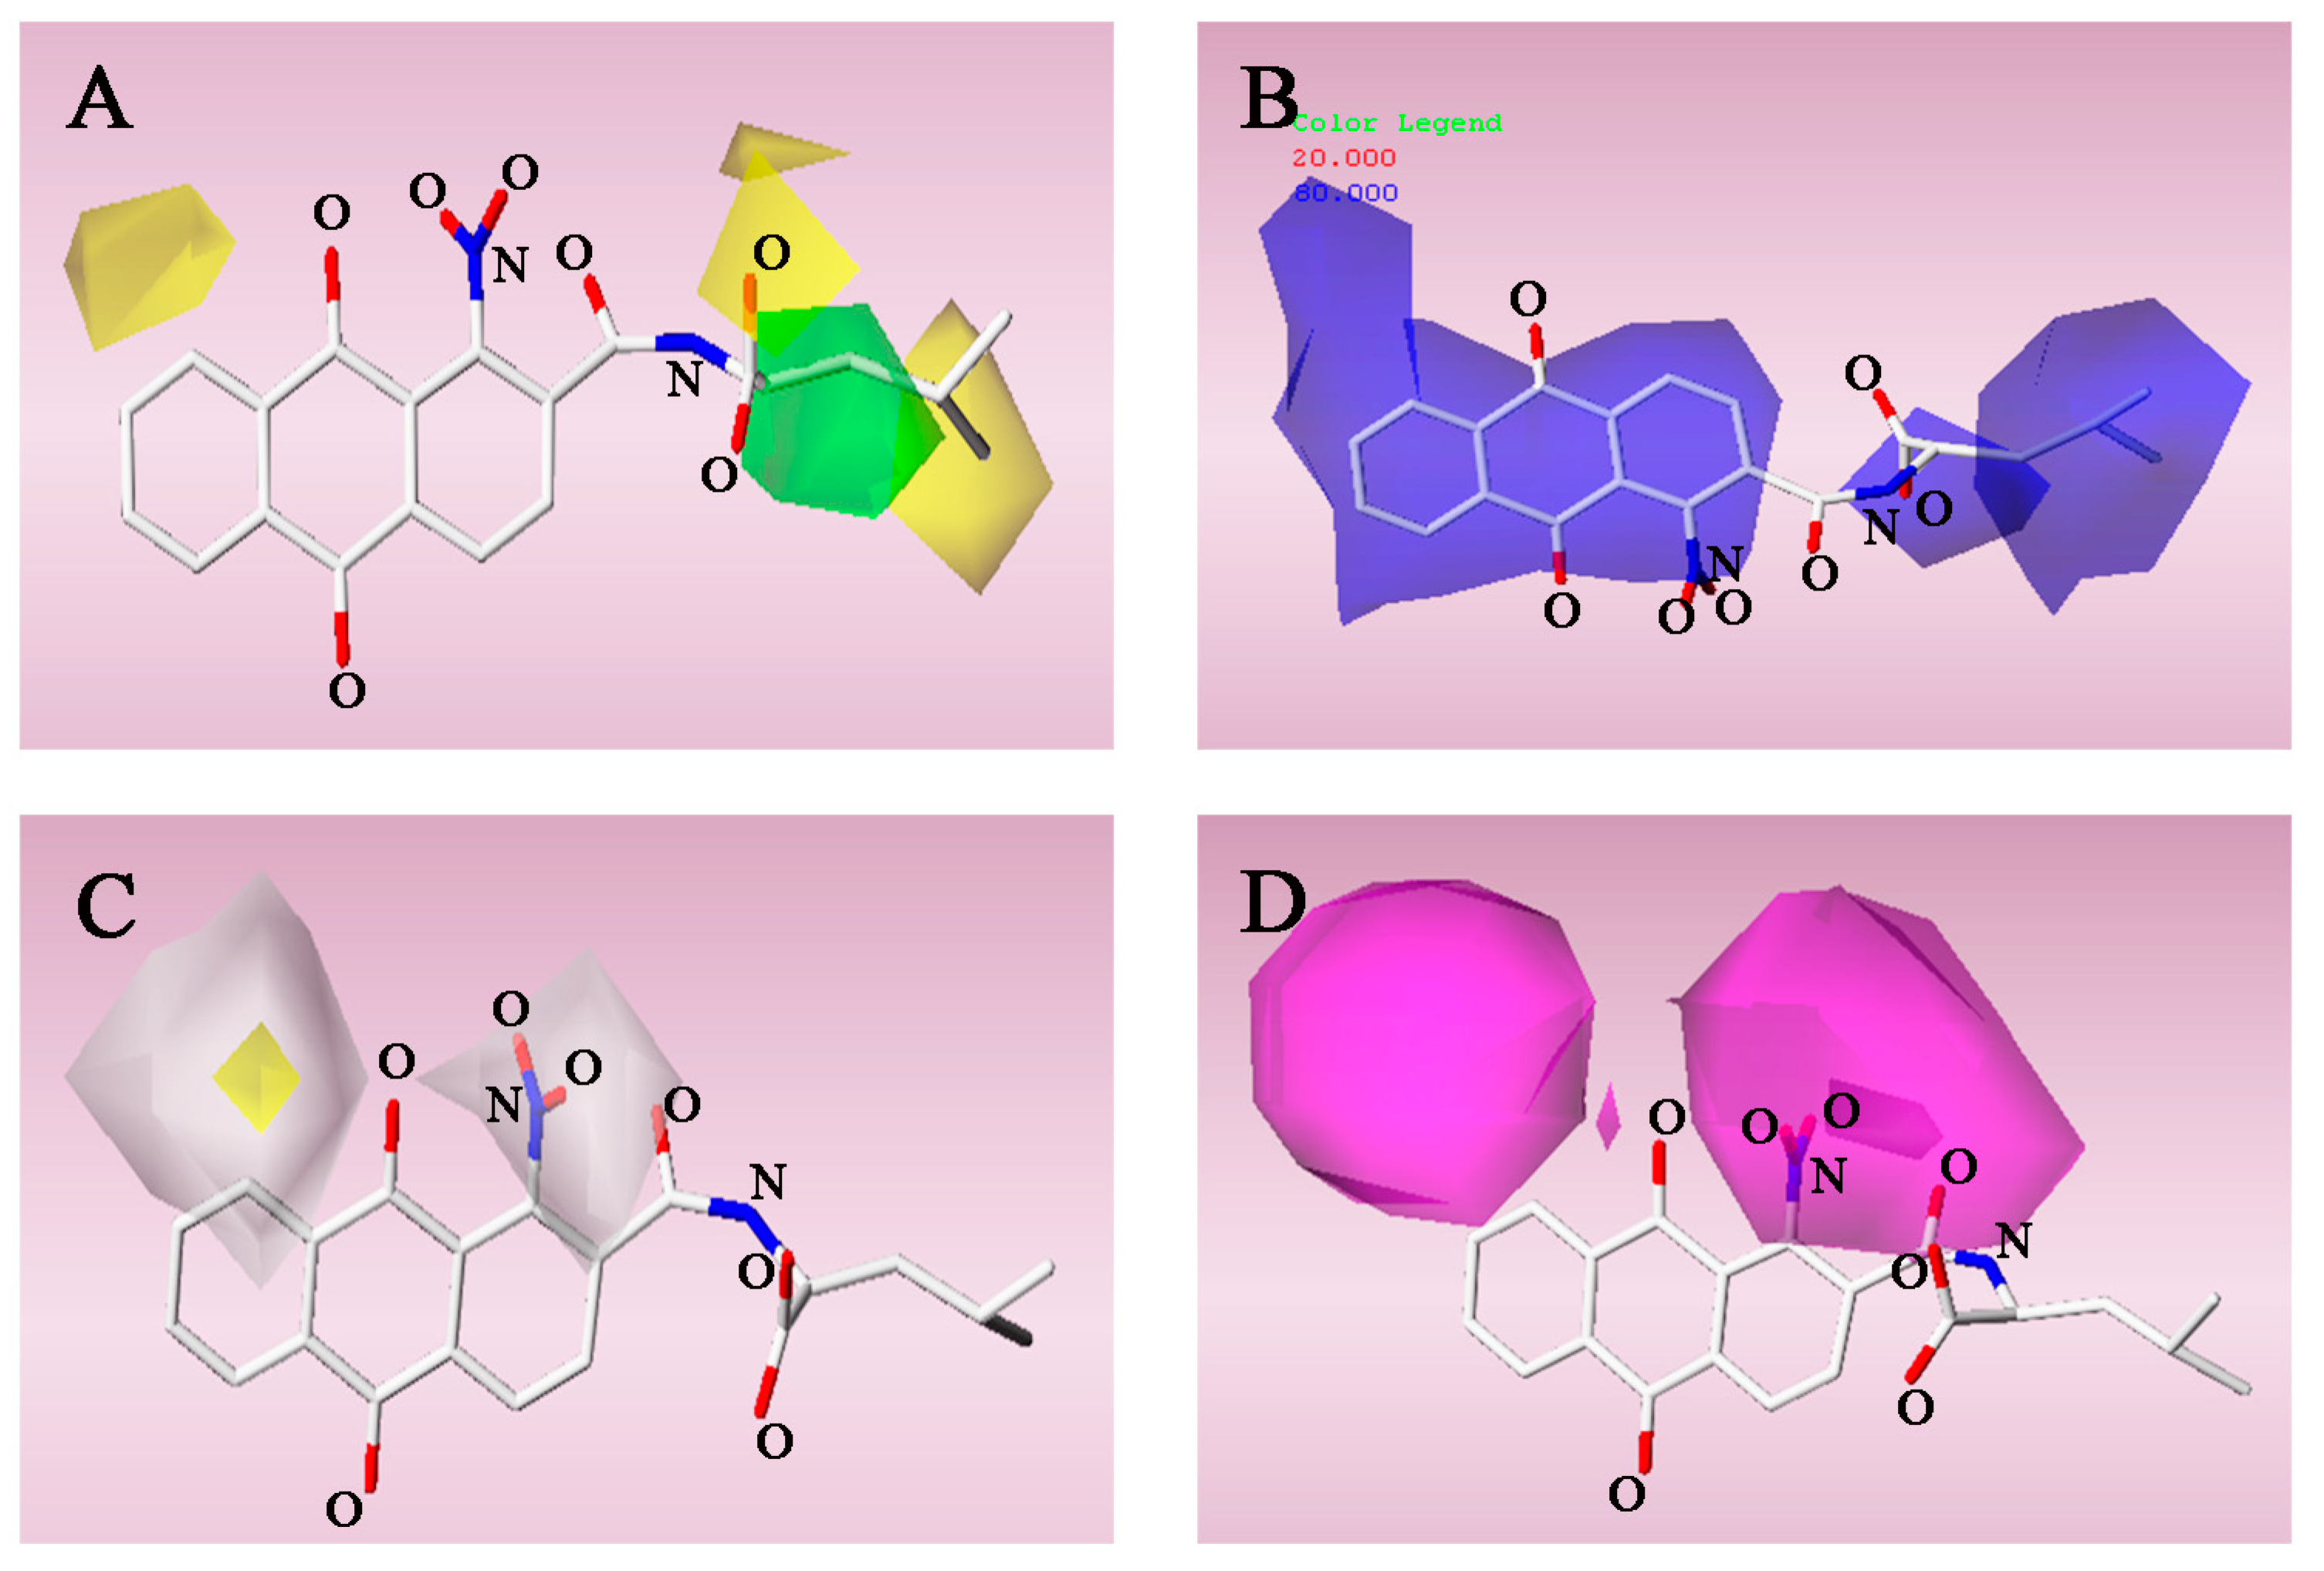
2.3. 3D-QSAR
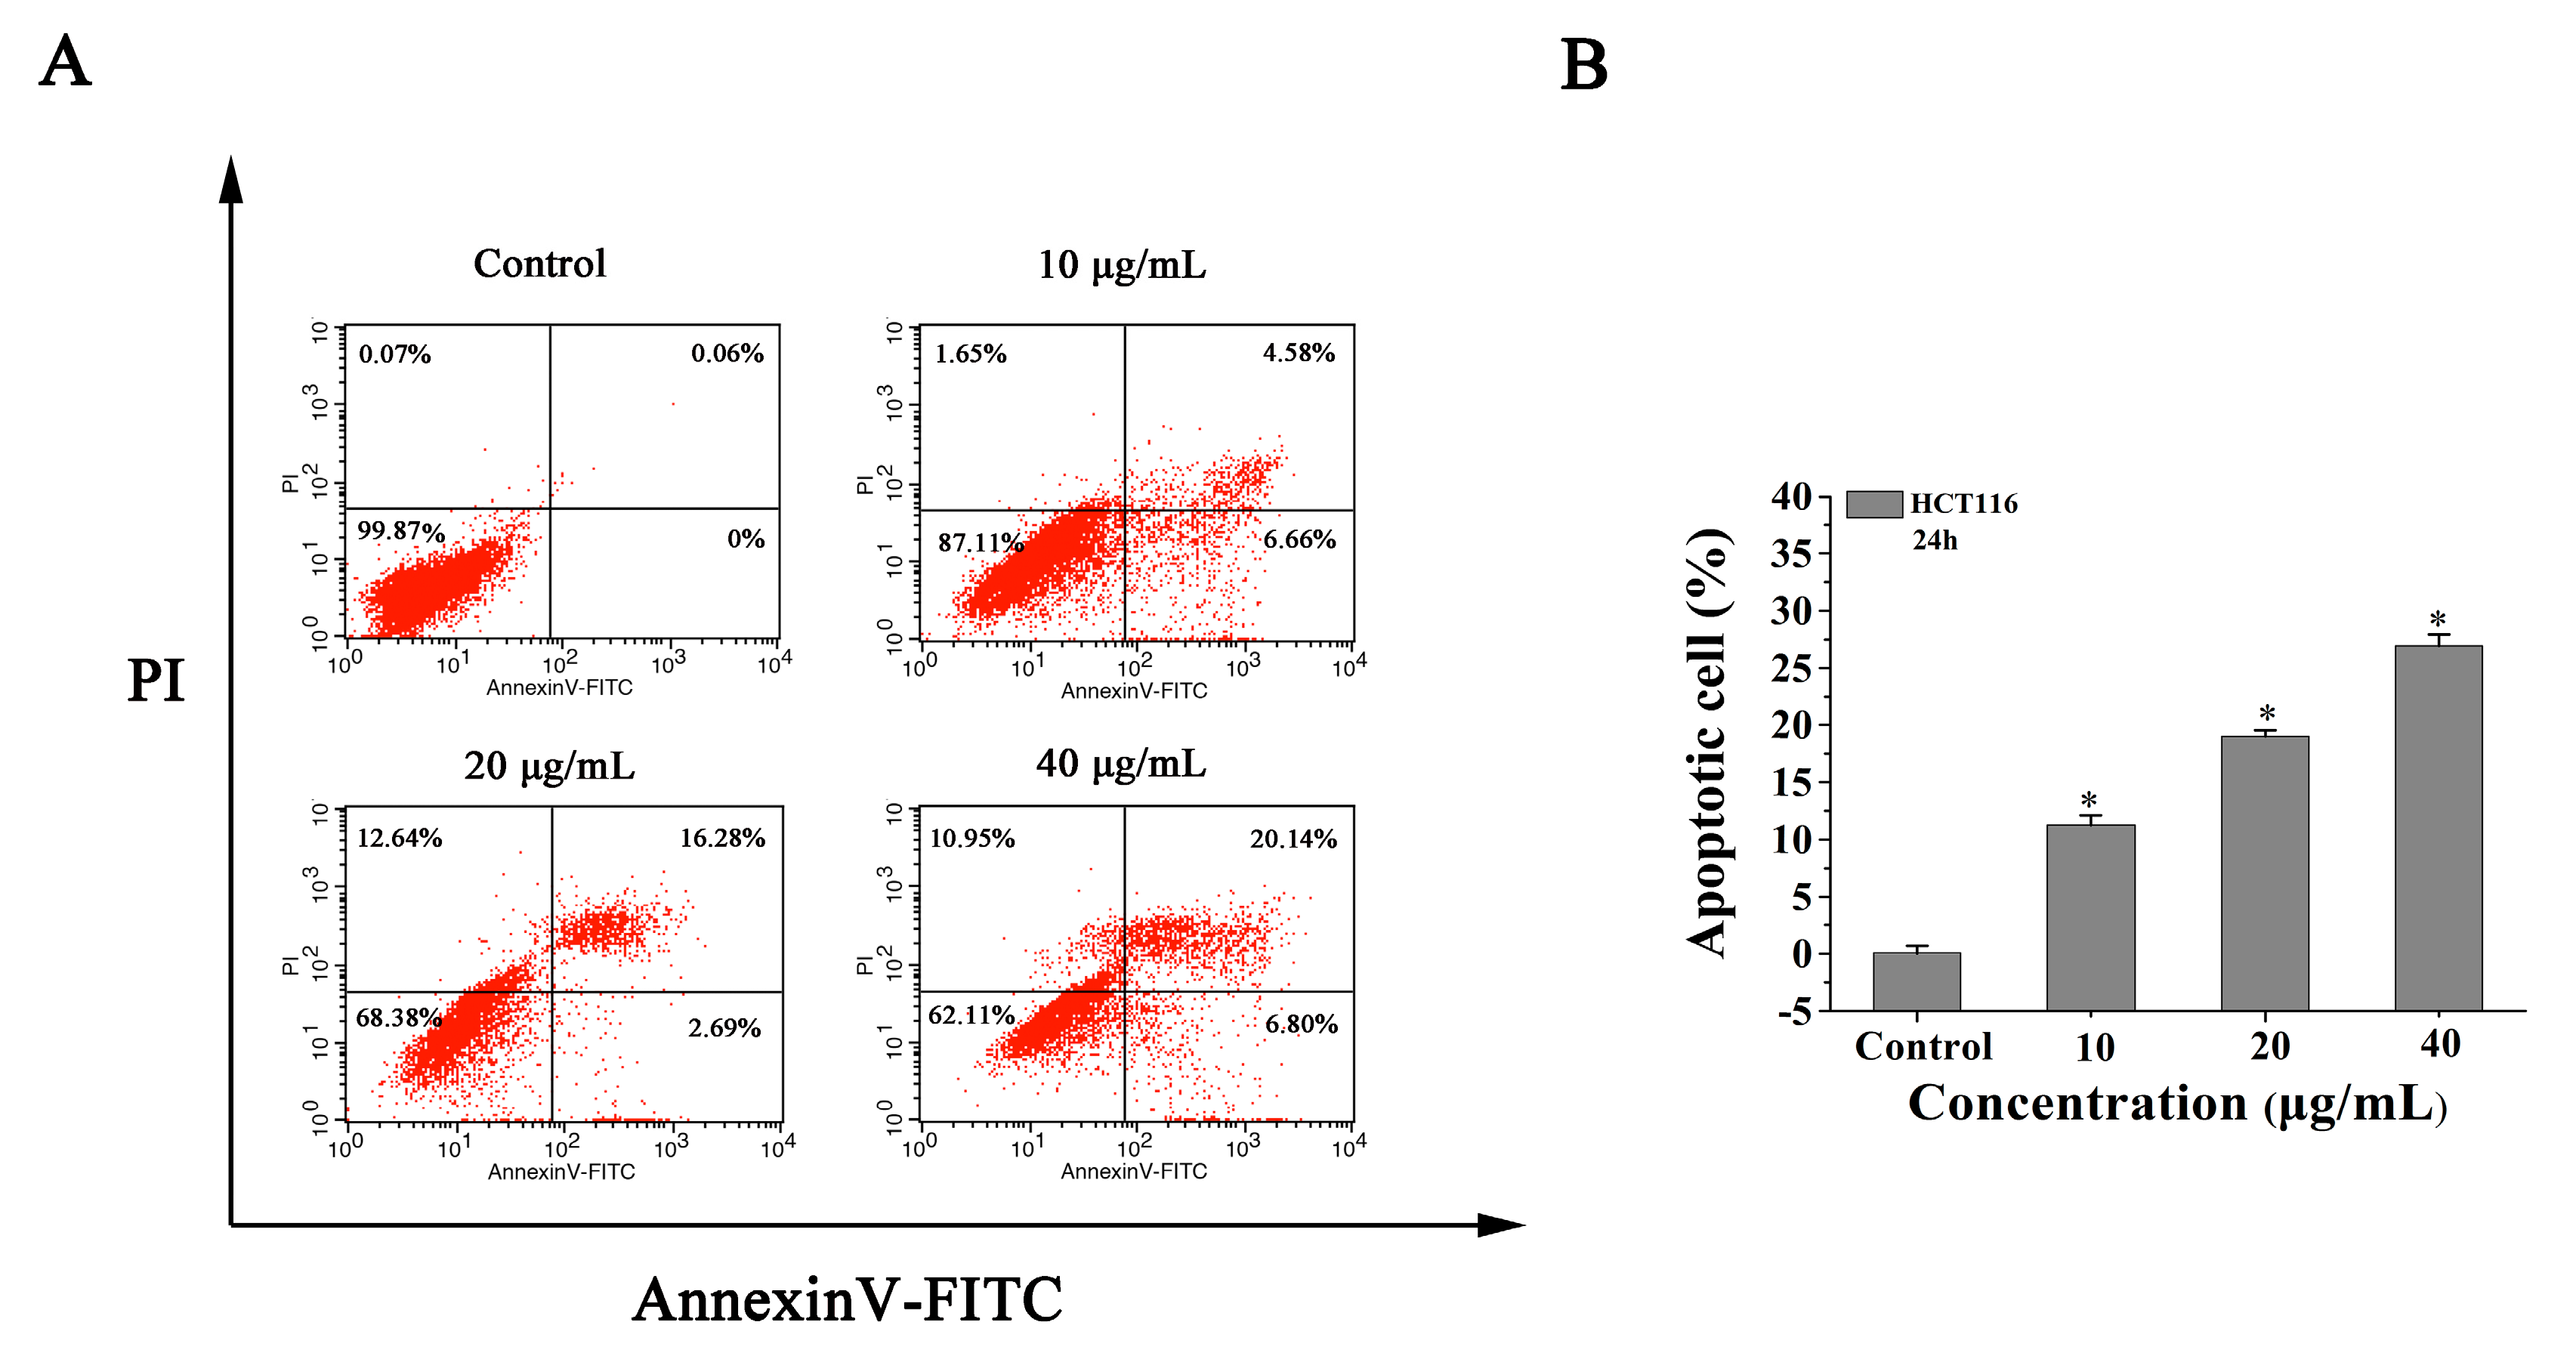
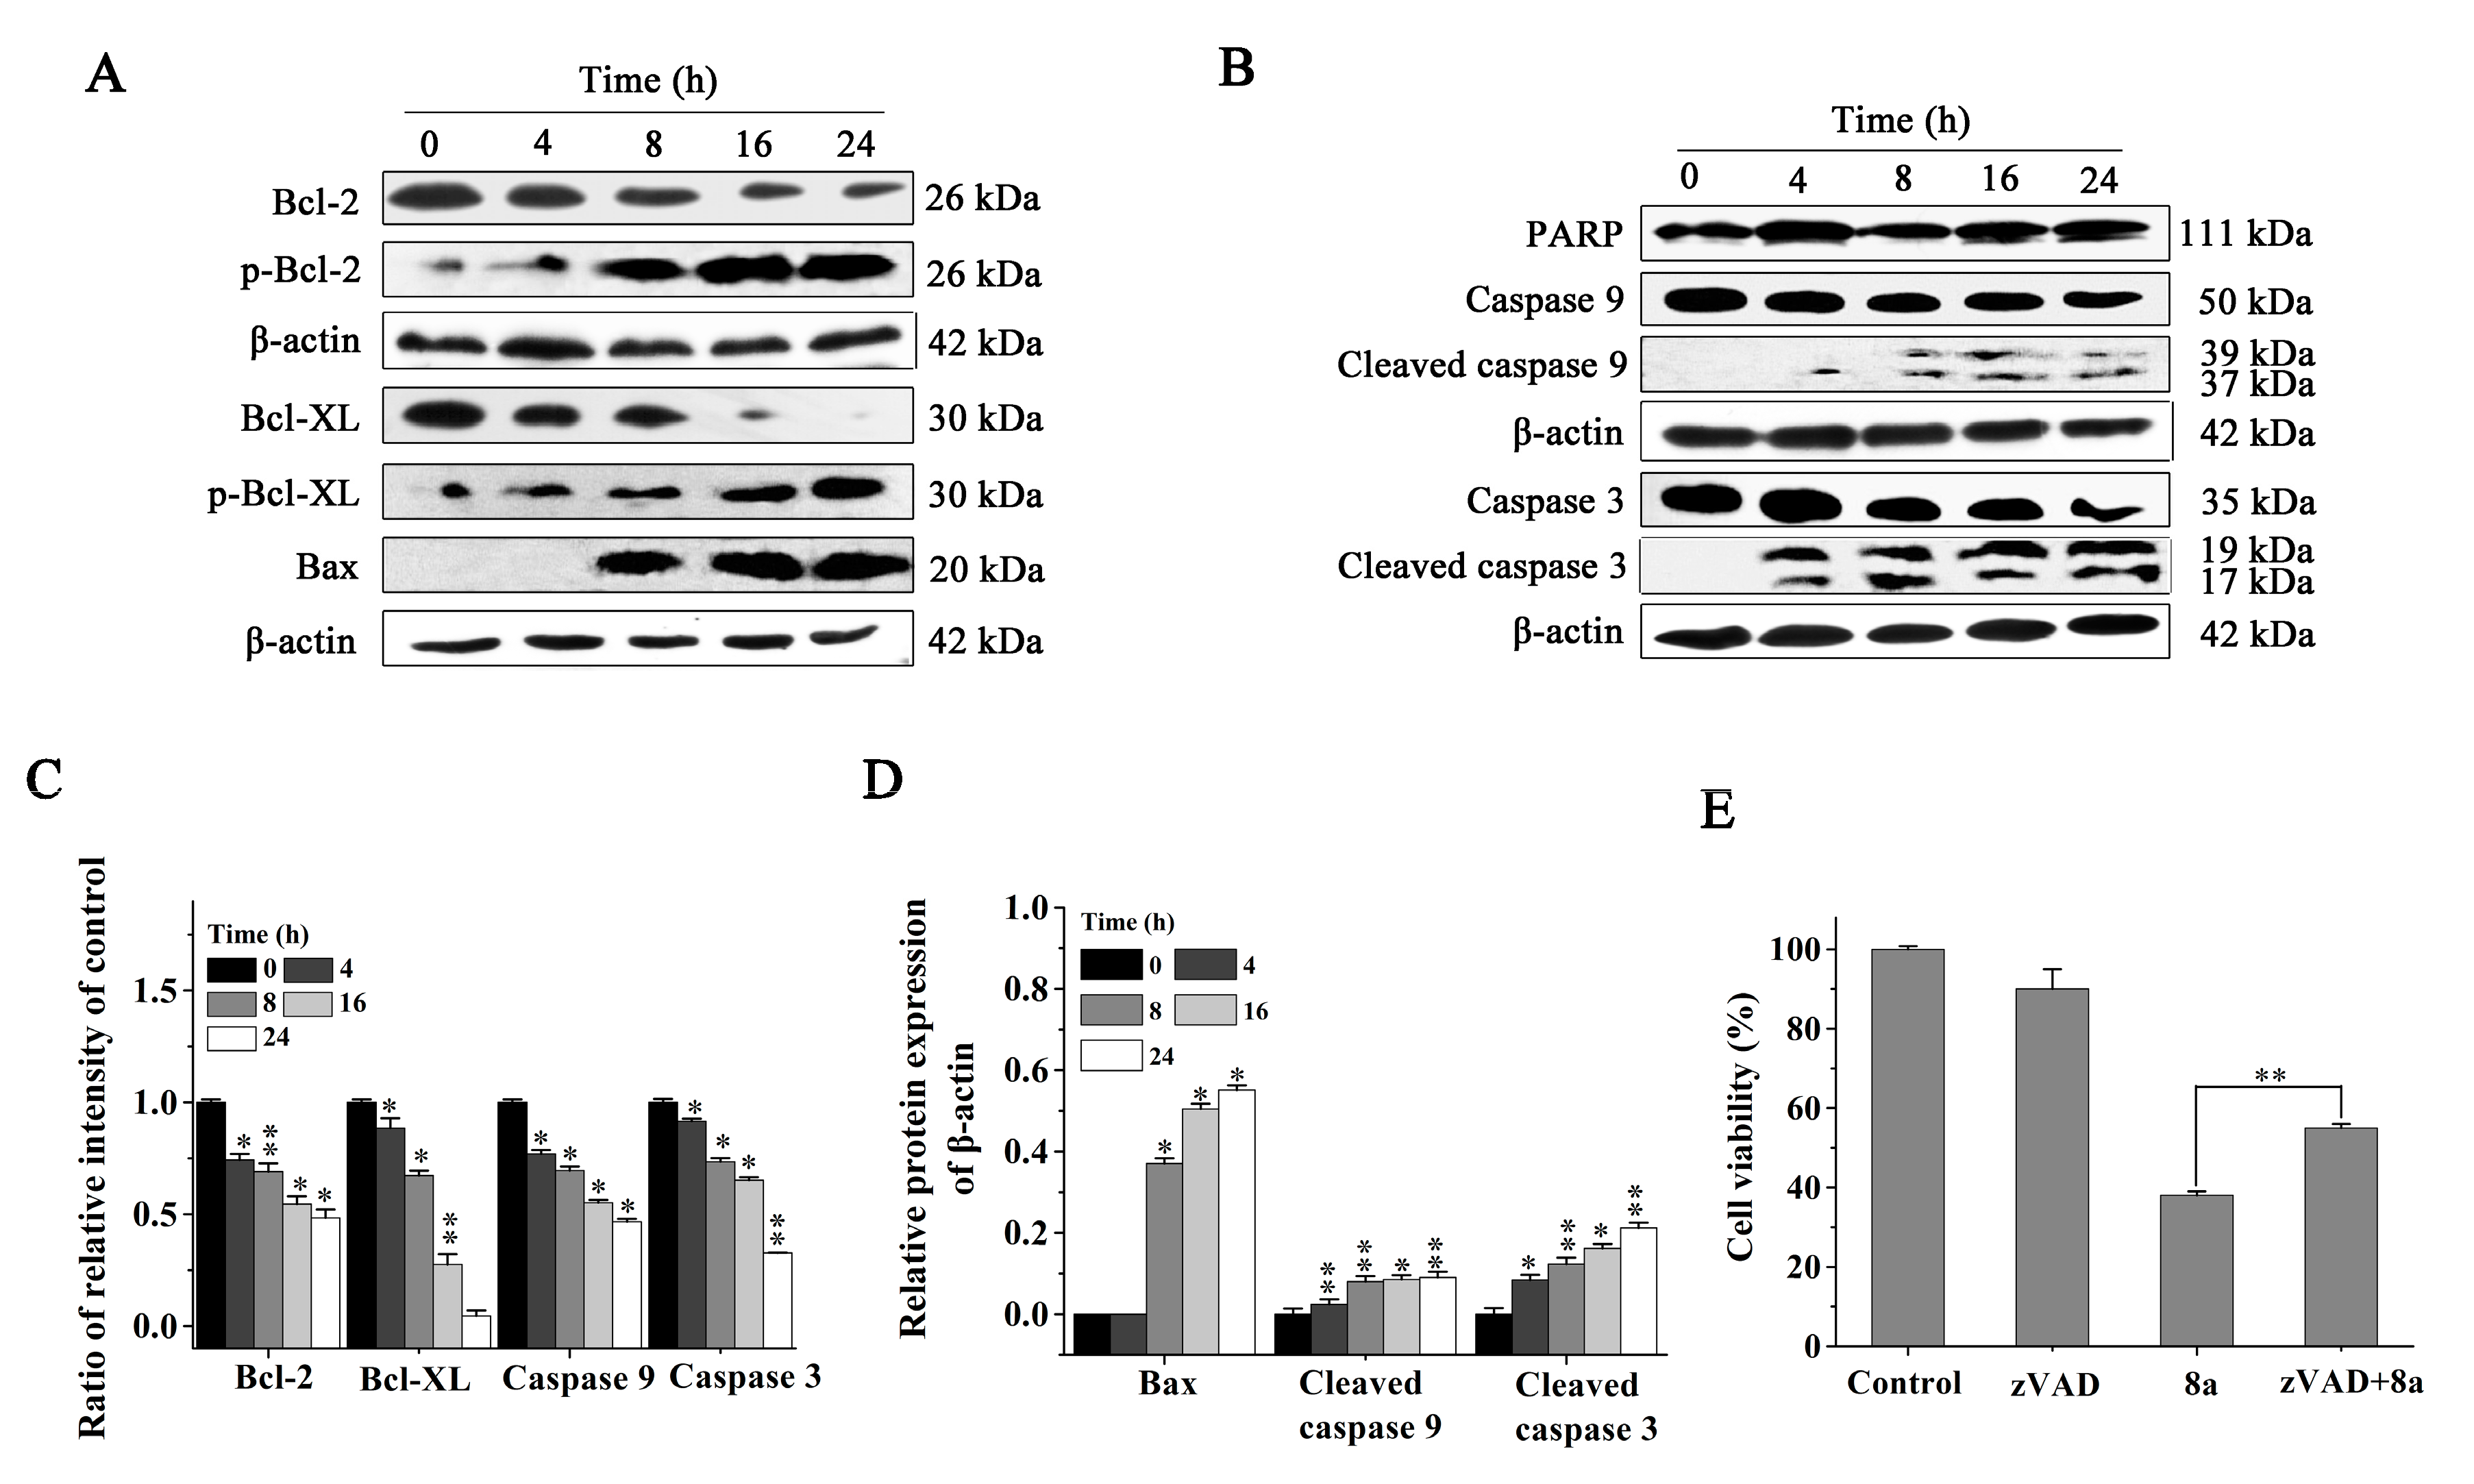
2.4. 8a Induces Apoptosis in HCT116 Cells
2.5. Compound 8a Induces Generation of ROS and Affects Mitochondrial Membrane Potential
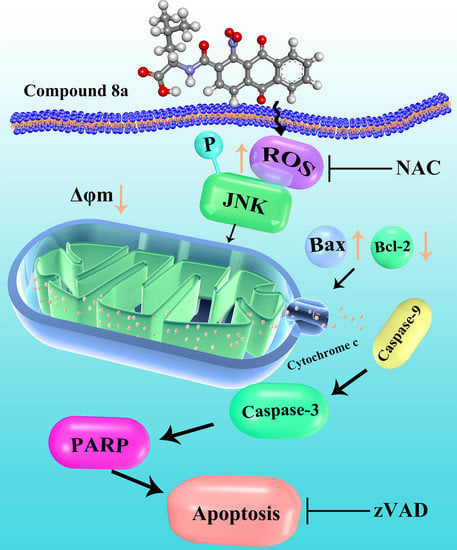
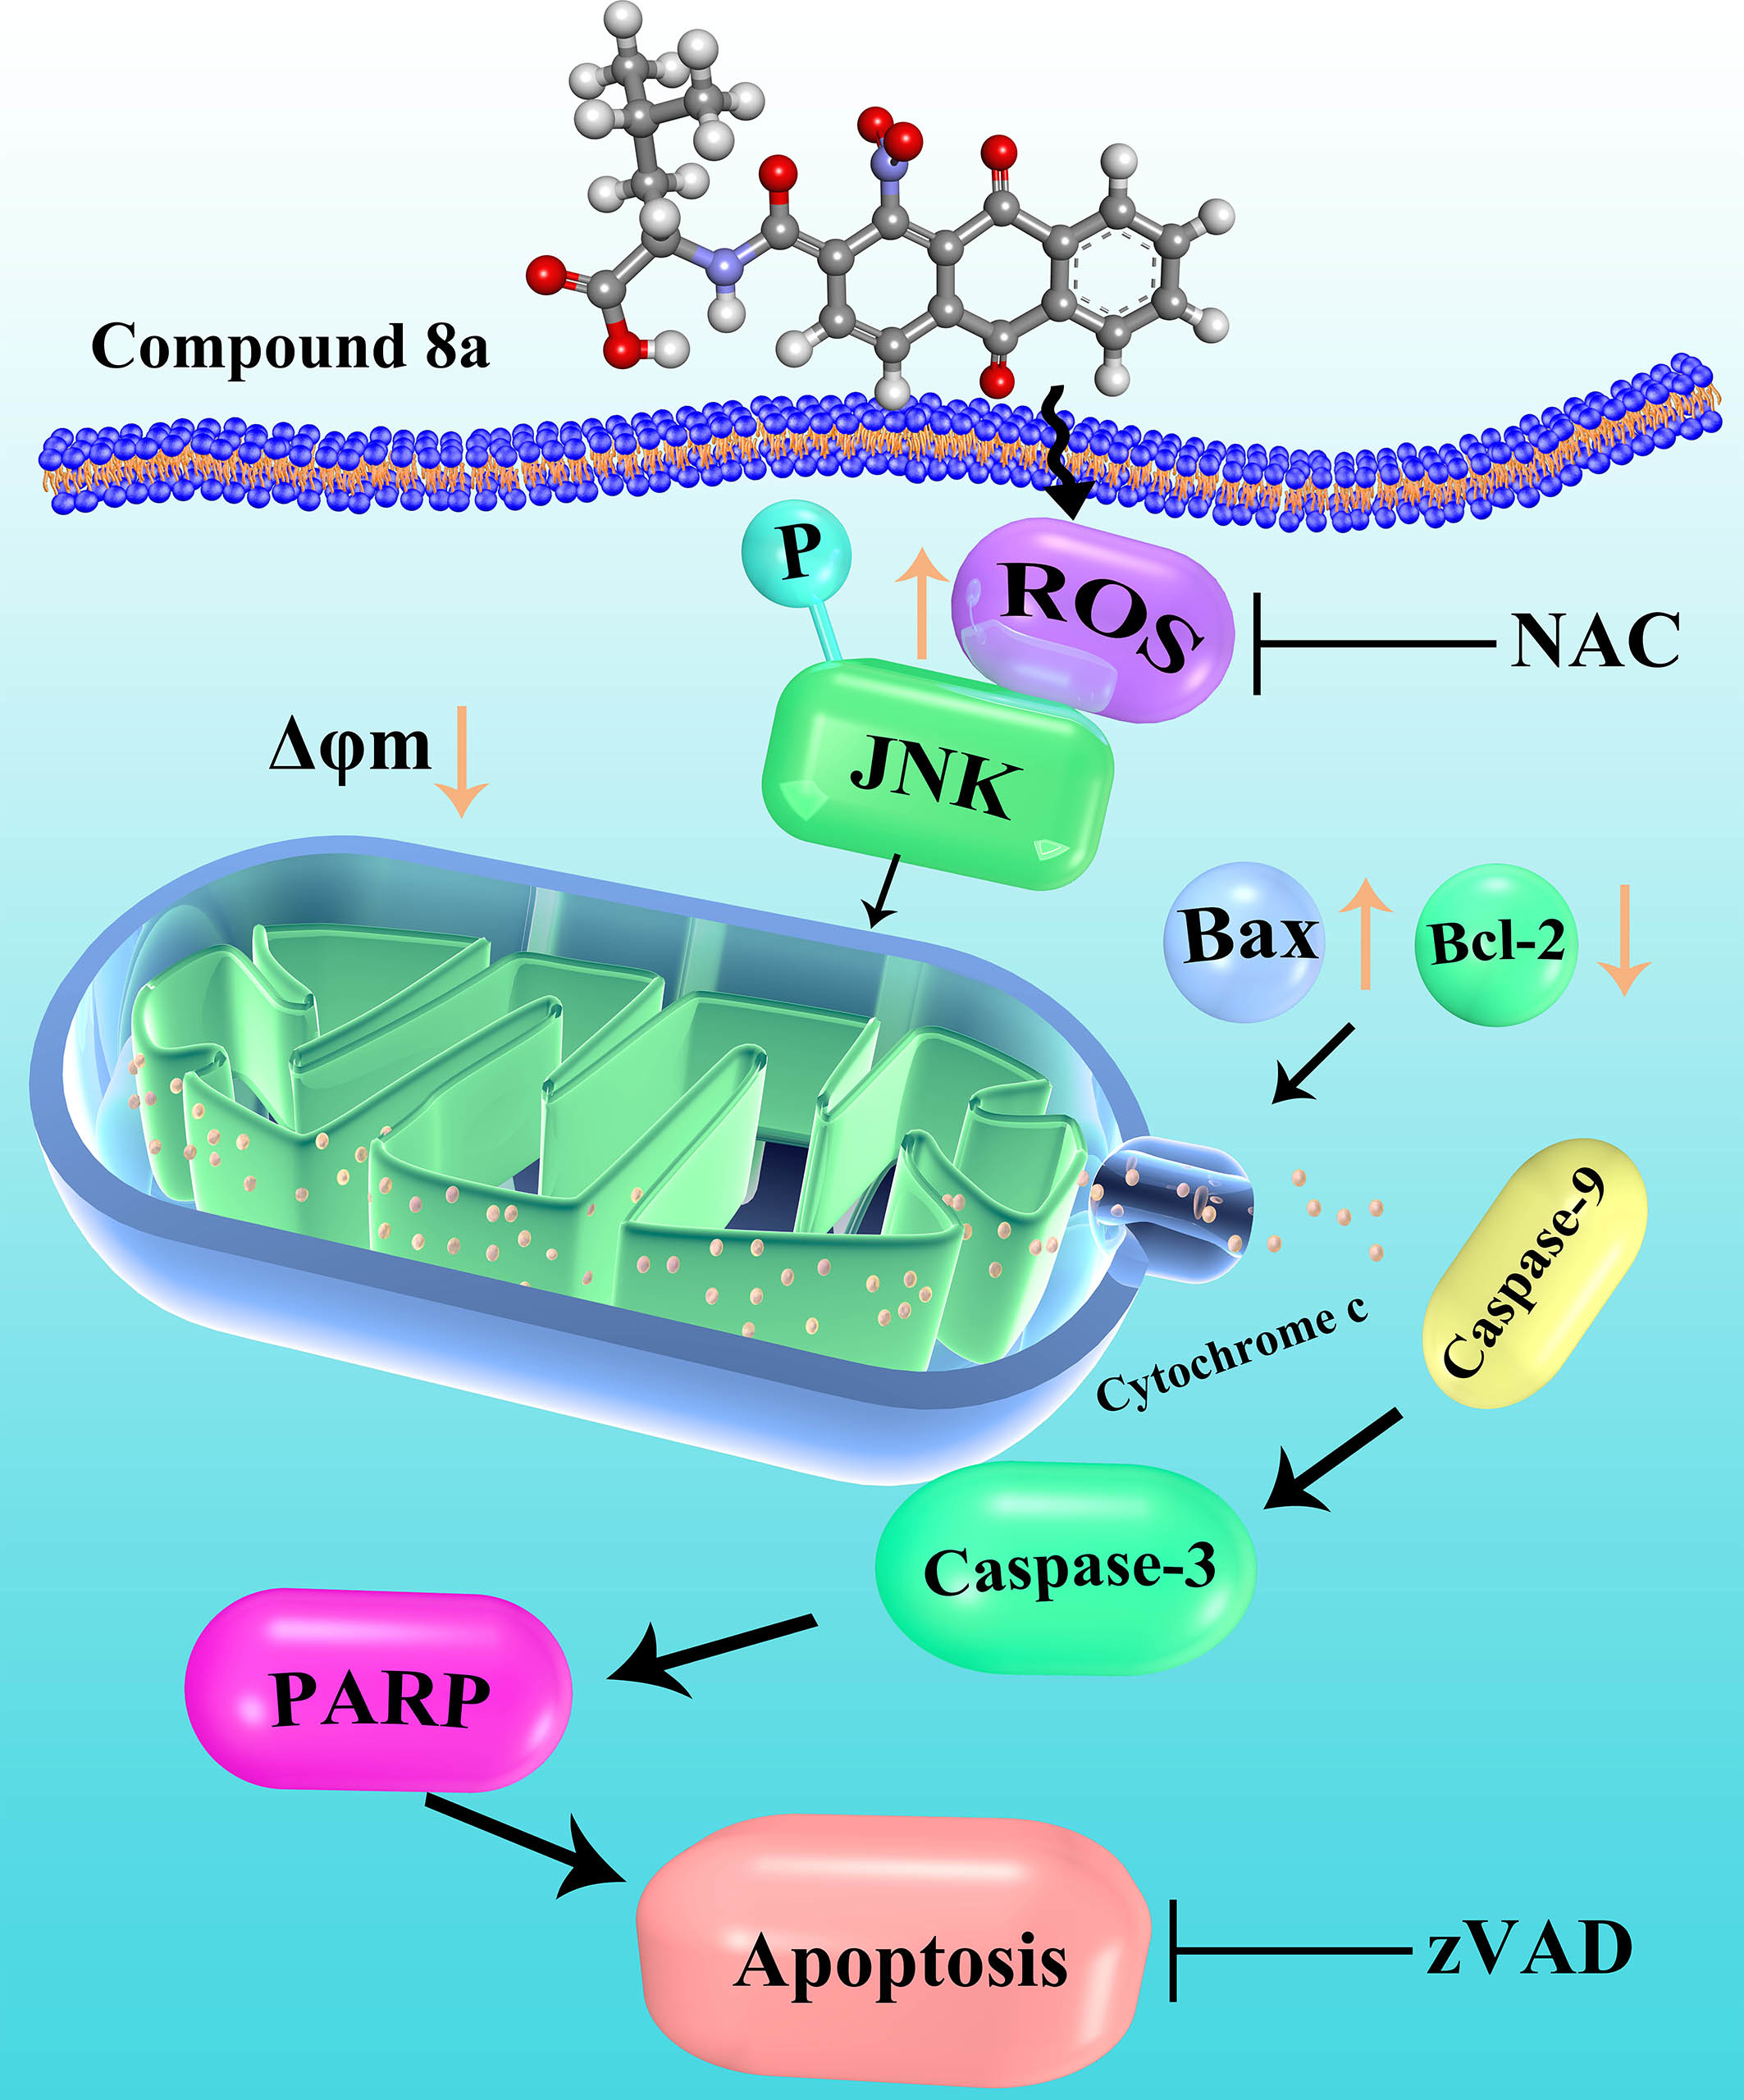
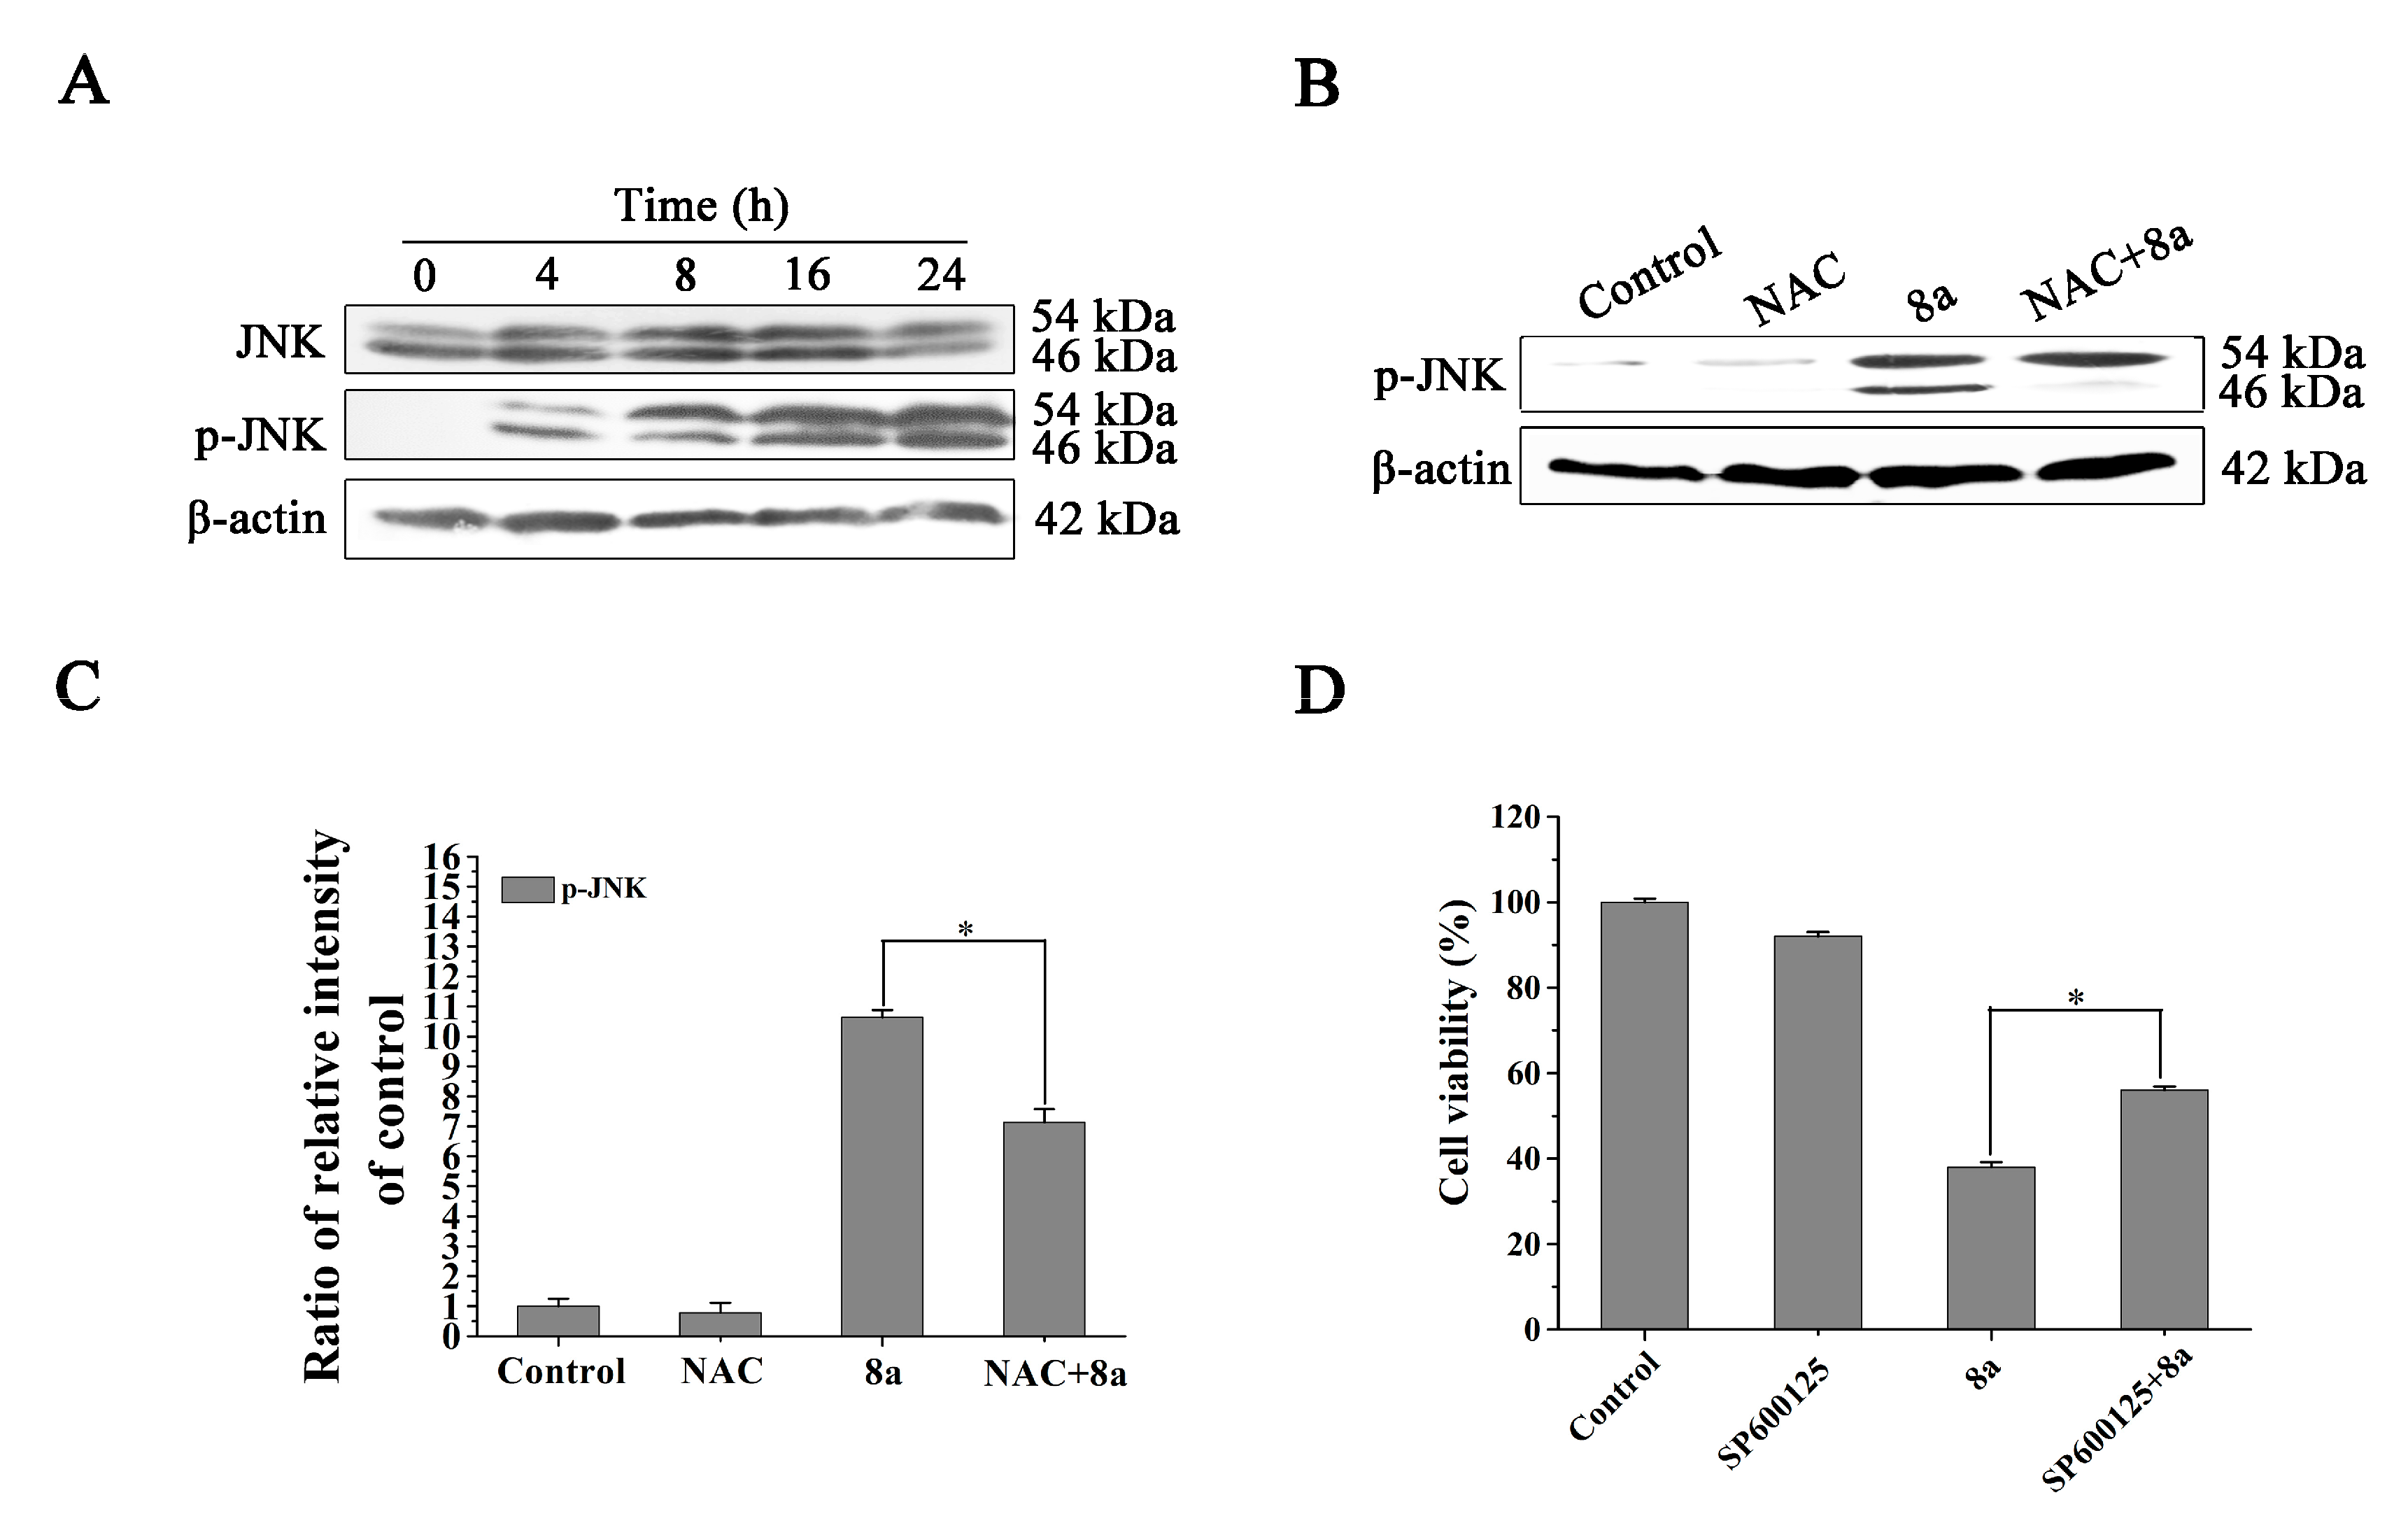
2.6. Compound 8a-induced ROS Production Is Associated with JNK Activation
3. Discussion
4. Materials and Methods
4.1. Reagents
4.2. Compounds
4.3. Cell Culture
4.4. In Vitro Cell Proliferation Assays
4.5. 3D-QSAR Study
4.6. Apoptotic Assay
4.7. Detection of ROS by DCFH-DA
4.8. Determination of Mitochondrial Membrane Potential
4.9. Western Blot Analysis
4.10. Statistical Analysis
5. Conclusions
Supplementary Materials
Author Contributions
Funding
Conflicts of Interest
References
- Siegel, R.L.; Miller, K.D.; Jemal, A. Cancer statistics. CA Cancer J. Clin. 2017, 67, 7–30. [Google Scholar] [CrossRef] [PubMed] [Green Version]
- Ramirez-Prada, J.; Robledo, S.M.; Velez, I.D.; Crespo, M.D.P.; Quiroga, J.; Abonia, R.; Montoya, A.; Svetaz, L.; Zacchino, S.; Insuasty, B. Synthesis of novel quinoline-based 4,5-dihydro -1H-pyrazoles as potential anticancer, antifungal, antibacterial and antiprotozoal agents. Eur. J. Med. Chem. 2017, 131, 237–254. [Google Scholar] [CrossRef] [PubMed]
- Kwon, S.; Lee, Y.; Jung, Y.; Kim, J.H.; Baek, B.; Lim, B.; Lee, J.; Kim, I.; Lee, J. Mitochondria-targeting indolizino[3,2-c]quinolines as novel class of photosensitizers for photodynamic anticancer activity. Eur. J. Med. Chem. 2018, 148, 116–127. [Google Scholar] [CrossRef] [PubMed]
- El-Naggar, A.M.; Abou-El-Regal, M.M.; El-Metwally, S.A.; Sherbiny, F.F.; Eissa, I.H. Synthesis, characterization and molecular docking studies of thiouracil derivatives as potent thymidylate synthase inhibitors and potential anticancer agents. Mol. Divers. 2017, 21, 967–983. [Google Scholar] [CrossRef]
- Wang, B.; Li, Q.; Shi, W.; Chen, L.; Sun, J. Design, synthesis, and cytotoxic evaluation of novel furo[2,3-b]quinoline derivatives. Chem. Biol. Drug Des. 2018, 91, 957–961. [Google Scholar] [CrossRef]
- Jafari, F.; Baghayi, H.; Lavaee, P.; Hadizadeh, F.; Soltani, F.; Moallemzadeh, H.; Mirzaei, S.; Aboutorabzadeh, S.M.; Ghodsi, R. Design, synthesis and biological evaluation of novel benzo- and tetrahydrobenzo-[h]quinoline derivatives as potential DNA-intercalating antitumor agents. Eur. J. Med. Chem. 2019, 164, 292–303. [Google Scholar] [CrossRef]
- Opoku-Temeng, C.; Dayal, N.; Sooreshjani, M.A.; Sintim, H.O. 3H-pyrazolo[4,3-f]quinoline haspin kinase inhibitors and anticancer properties. Bioorg. Chem. 2016, 78, 418–426. [Google Scholar] [CrossRef]
- Malik, E.M.; Müller, C.E. Anthraquinones as pharmacological tools and drugs. Med. Res. Rev. 2016, 36, 705–748. [Google Scholar] [CrossRef]
- Chen, K.; Chu, B.Z.; Liu, F.; Li, B.; Gao, C.M.; Li, L.L.; Sun, Q.S.; Shen, Z.F.; Jiang, Y.Y. New benzimidazole acridine derivative induces human colon cancer cell apoptosis in vitro via the ROS-JNK signaling pathway. Acta Pharmacol. Sin. 2015, 36, 1074–1084. [Google Scholar] [CrossRef] [Green Version]
- Duan, F.; Yu, Y.; Guan, R.; Xu, Z.; Liang, H.; Hong, L. Vitamin K2 induces mitochondria-related apoptosis in human bladder cancer cells via ROS and JNK/ p38 MAPK signal pathways. PLoS ONE 2016, 11, e0161886. [Google Scholar] [CrossRef]
- Szwed, M. Mitoxantrone-an anthraquinone antibiotic with antitumor activity applied for the treatment of multiple sclerosis. Postepy Hig. Med. Dosw. 2014, 68, 198–208. [Google Scholar] [CrossRef] [PubMed]
- Rossato, L.G.; Costa, V.M.; Dallegrave, E.; Arbo, M.; Silva, R.; Ferreira, R.; Amado, F.; Dinis-Oliveira, R.J.; Duarte, J.A.; De Lourdes Bastos, M.; et al. Mitochondrial Cumulative Damage Induced by Mitoxantrone: Late Onset Cardiac Energetic Impairment. Cardiovasc. Toxicol. 2014, 14, 30–40. [Google Scholar] [CrossRef] [PubMed] [Green Version]
- Björkholm, M.; Andersson, T.; Ahlbom, A.; Ösby, E. CNOP (mitoxantrone) chemotherapy is inferior to CHOP (doxorubicin) in the treatment ofpatients with aggressive non-Hodgkin lymphoma (meta-analysis). Eur. J. Haematol. 2008, 6, 477–482. [Google Scholar]
- Zhu, Y.; Li, T.; Ramos da Silva, S.; Lee, J.J.; Lu, C.; Eoh, H.; Jung, J.U.; Gao, S.J. A Critical Role of Glutamine and Asparagine γ-Nitrogen in Nucleotide Biosynthesis in Cancer Cells Hijacked by an Oncogenic Virus. mBio 2017, 8, e01179-17. [Google Scholar] [CrossRef] [Green Version]
- Hsin, L.W.; Wang, H.P.; Kao, P.H.; Lee, O.; Chen, W.R.; Chen, H.W.; Guh, J.H.; Chan, Y.L.; His, C.P.; Yang, M.S.; et al. Synthesis, DNA binding, and cytotoxicity of 1,4-bis(2-amino-ethylamino)anthraquinone-amino acid conjugates. Bioorg. Med. Chem. 2008, 16, 1006–1014. [Google Scholar] [CrossRef]
- Xu, B.; Yan, W.Q.; Xu, X.; Wu, G.R.; Zhang, C.Z.; Han, Y.T.; Chu, F.H.; Zhao, R.; Wang, P.L.; Lei, H.M. Combination of amino acid/dipeptide with ligustrazine-betulinic acid as antitumor agents. Eur. J. Med. Chem. 2017, 130, 26–38. [Google Scholar] [CrossRef]
- Zhang, L.; Zhou, L.; Du, J.; Li, M.; Qian, C.; Cheng, Y.; Peng, Y.; Xie, J.; Wang, D. Induction of Apoptosis in Human Multiple Myeloma Cell Lines by Ebselen via Enhancing the Endogenous Reactive Oxygen Species Production. Biomed. Res. Int. 2014, 2014, 696107. [Google Scholar] [CrossRef]
- Tian, W.; Li, J.; Su, Z.; Lan, F.; Li, Z.; Liang, D.; Wang, C.; Li, D.; Hou, H. Novel anthraquinone compounds induce cancer death through paraptosis. ACS Med. Chem. Lett. 2019, 10, 732–736. [Google Scholar] [CrossRef]
- Giuseppa, P.; Daniela, T.; Claudia, C.; Alessia, G.; Gabriella, D. Apoptosis as anticancer mechanism: Function and dysfunction of its modulators and targeted therapeutic strategies. Aging 2016, 8, 603–619. [Google Scholar]
- Hseu, Y.C.; Huang, Y.C.; Thiyagarajan, V.; Mathew, D.C.; Lin, K.Y.; Chen, S.C.; Liu, J.Y.; Hsu, L.S.; Li, M.L.; Yang, H.L. Anticancer activities of chalcone flavokawain B from alpinia pricei hayata in human lung adenocarcinoma (A549) cells via induction of reactive oxygen species-mediated apoptotic and autophagic cell death. J. Cell. Physiol. 2019, 234, 17514–17526. [Google Scholar] [CrossRef]
- Scherz-Shouval, R.; Elazar, Z. Regulation of antophagy by ROS: Physiology and pathology. Biochem. Sci. 2011, 36, 30–38. [Google Scholar] [CrossRef] [PubMed]
- Kim, S.Y.; Song, X.; Zhang, L.; Bartlett, D.L.; Lee, Y.J. Role of Bcl-Xl/Beclin-1 in interplay between apoptosis and autophagy in oxaliplatin and bortezomib-induced cell death. Biochem. Pharmacol. 2014, 88, 178–188. [Google Scholar] [CrossRef] [PubMed] [Green Version]
- Kim, A.D.; Kang, K.A.; Kim, H.S.; Kim, D.H.; Choi, Y.H.; Lee, S.J.; Kim, H.S.; Hyun, J.W. A ginseng metabolite, compound K, induces autophagy and apoptosis via generation of reactive oxygen species and activation of JNK in human colon cancer cells. Cell Death Dis. 2013, 4, 273–284. [Google Scholar] [CrossRef] [PubMed] [Green Version]
- Li, R.F. Structural Modification and Studies on Radiosensitization of Emodin-type Anthraquinone Compounds. Master’s Thesis, Chinese Academy of Medical Sciences & Peking Union Medical College, Beijing, China, 2011. [Google Scholar]
- Rumie Vittar, N.B.; Comini, L.; Fernadez, I.M.; Agostini, E.; Nuñez-Montoya, S.; Cabrera, J.L.; Rivarola, V.A. Photochemotherapy using natural anthraquinone: Rubiadin and soranjidiol sensitize human cancer cell to die by apoptosis. Photodiagn. Photodyn. Ther. 2014, 11, 182–192. [Google Scholar] [CrossRef] [PubMed] [Green Version]
- Pang, M.J.; Yang, Z.; Zhang, X.L.; Liu, Z.F.; Fan, J.; Zhang, H.Y. Physcion, a naturally occurring anthraquinone derivative, induces apoptosis and autophagy in human nasopharyngeal carcinoma. Acta Pharmacol. Sin. 2016, 37, 1623–1640. [Google Scholar] [CrossRef] [PubMed] [Green Version]
- Yang, K.; Jin, M.J.; Quan, Z.S.; Piao, H.R. Design and synthesis of novel anti-proliferative emodin derivatives and studies on their cell cycle arrest, apoptosis pathway and migration. Molecules 2019, 24, 884. [Google Scholar] [CrossRef] [Green Version]
- Zhang, Z.Y.; Teruya, K.; Eto, H.; Shirahata, S. Fucoidan extract induces apoptosis in MCF-7 cells via a mechanism involving the ROS-dependent JNK activation and mitochondria-mediated pathways. PLoS ONE 2011, 6, e27441. [Google Scholar] [CrossRef]
- Fuchs, Y.; Steller, H. Programmed cell death in animal development and disease. Cell 2011, 147, 742–758. [Google Scholar] [CrossRef] [Green Version]
- Kim, K.Y.; Yu, S.N.; Lee, S.Y.; Chun, S.S.; Choi, Y.L.; Park, Y.M.; Song, C.S.; Chatterjee, B.; Ahn, S.C. Salinomycin-induced apoptosis of human prostate cancer cells due to accumulated reactive oxygen species and mitochondrial membrane depolarization. Biochem. Biophys. Res. Commun. 2011, 413, 80–86. [Google Scholar] [CrossRef]
- Yuan, D.T.; Huang, S.; Berger, E.; Liu, L.; Gross, N.; Heinzmann, F. Kupffer cell-derived Tnf triggers Cholangiocellular tumorigenesis through JNK due to chronic mitochondrial dysfunction and ROS. Cancer Cell. 2017, 31, 771–789. [Google Scholar] [CrossRef] [Green Version]
- Sui, X.; Kong, N.; Ye, L.; Han, W.; Zhou, J.; Zhang, Q.; He, C.; Pan, H. p38 and JNK MAPK pathways control the balance of apoptosis and autophagy in response to chemotherapeutic agents. Cancer Lett. 2014, 344, 174–179. [Google Scholar] [CrossRef] [PubMed]
- Schattauer, S.S.; Bedini, A.; Summers, F.; Reilly-Treat, A.; Andrews, M.M.; Land, B.B.; Chavkin, C. Reactive oxygen species (ROS) generation is stimulated by κ opioid receptor activation through phosphorylated c-Jun N-terminal kinase and inhibited by p38 mitogen-activated protein kinase (MAPK) activation. J. Biol. Chem. 2019, 45, 16884–16896. [Google Scholar] [CrossRef] [PubMed]
- Luo, J.; Xiang, Y.; Xu, X.; Fang, D.; Li, D.; Ni, F.; Zhu, X.; Chen, B.; Zhou, M. High Glucose-Induced ROS Production Stimulates Proliferatin of Pancreatic Cancer via Inactivating the JNK Pathway. Oxid. Med. Cell. Longev. 2018, 10, 1155. [Google Scholar]
- Lu, Z.; Miao, Y.; Muhammad, I.; Tian, E.; Hu, W.; Wang, J.; Wang, B.; Li, R.; Li, J. Colistin-induced autophagy and apoptosis involves the JNK-Bcl2-Bax signaling pathway and JNK-p53-ROS positive feedback loop in PC-12 cells. Chem. Biol. Interact. 2017, 277, 62–73. [Google Scholar] [CrossRef] [PubMed]
- Maiko, S.; Cheryl, B.; John, D.B. Fluoride induces oxidative damage and SIRT1/autophagy through ROS-mediated JNK signaling. Free Radic. Biol. Med. 2015, 89, 369–378. [Google Scholar]
- Feng, S.X.; Guan, Q.N.; Chen, T.; Du, C.G. In vitro activities of 3-hydroxy-1,5,6-trimethoxy-2-methyl-9,10-anthraquinone against non-small cell lung carcinoma. Arch. Pharmacal Res. 2012, 35, 1251–1258. [Google Scholar] [CrossRef]
- Zhu, X.; Wang, K.; Zhang, K.; Zhu, L.; Zhou, F. Ziyuglycoside II induces cell cycle arrest and apoptosis through activation of ROS/JNK pathway in human breast cancer cells. Toxicol. Lett. 2014, 227, 65–73. [Google Scholar] [CrossRef]
- Yeap, S.; Akhtar, M.N.; Lim, K.; Abu, N.; Ho, W.; Zareen, S. Synthesis of an anthraquinone derivative (DHAQC) and its effect on induction of G2/M arrest and apoptosis in breast cancer MCF-7 cell line. Drug Des. Dev. Ther. 2015, 9, 983–991. [Google Scholar]
- Pooja, T.; Karunagaran, D. Emodin suppresses Wnt signaling in human colorectal cancer cells SW480 and SW620. Eur. J. Pharm. 2014, 742, 55–64. [Google Scholar] [CrossRef]
- Xie, M.J.; Ma, Y.H.; Miao, L.; Wang, Y.; Wang, H.Z.; Xing, Y.Y.; Xi, T.; Lu, Y.Y. Emodin-provoked oxidative stress induces apoptosis in Human Colon Cancer HCT116 cells through a p53-mitochondrial apoptotic pathway. Asian Pac. J. Cancer Prev. 2014, 15, 5201–5205. [Google Scholar] [CrossRef] [Green Version]
- Satoh, M.; Takemura, Y.; Hamada, H.; Sekido, Y.; Kubota, S. EGCG induces human mesothelioma cell death by inducing reactive oxygen species and autophagy. Cancer Cell Int. 2013, 13, 19–27. [Google Scholar] [CrossRef] [PubMed] [Green Version]
- Priault, M.; Hue, E.; Marhuenda, F.; Pilet, P.; Oliver, L.; Vallette, F. Differential dependence on Beclin 1 for the regulation of Pro-survival autophagy by Bcl-2 and Bcl-xL in HCT116 colorectal cancer cells. PLoS ONE 2010, 5, 8755–8767. [Google Scholar] [CrossRef] [PubMed] [Green Version]
- Song, Y.; Shi, Y.; Hu, Y. p,p′-Dichlorodiphenoxydichloroethylene induced apoptosis of Sertoli cells through oxidative stress-mediated p38 MAPK and mitochondrial pathway. Toxicol. Lett. 2011, 202, 55–60. [Google Scholar] [CrossRef] [PubMed]
- Chang, L.; Karin, M. Mammalian MAP kinase signalling cascades. Nature 2001, 410, 37–40. [Google Scholar] [CrossRef]
- Raj, L.; Ide, T.; Gurkar, A.U.; Foley, M.; Schenone, M.; Li, X. Selective killing of cancer cells by a small molecule targeting the stress response to ROS. Nature 2011, 475, 231–234. [Google Scholar] [CrossRef] [PubMed]
- Zhu, C.; Hu, W.; Wu, H.; Hu, X. No evident dose–response relationship between cellular ROS level and its cytotoxicity–a paradoxical issue in ROS-based cancer therapy. Sci. Rep. 2014, 4, 5029. [Google Scholar] [CrossRef]
- Luo, S.; Rubinsztein, D.C. Apoptosis blocks Beclin 1-dependent autophagosome synthesis: An effect rescued by Bcl-xL. Cell Death Differ. 2010, 17, 268–277. [Google Scholar] [CrossRef] [Green Version]
- Song, X.X.; Dilly, A.K.; Choudry, H.A.; Bartlett, D.L.; Kwon, Y.T.; Lee, Y.J. Hypoxia Promotes Synergy between Mitomycin C and Bortezomib through a Coordinated Process of Bcl-xL Phosphorylation and Mitochondrial Translocation of p53. Mol. Cancer Res. 2015, 13, 1533–1543. [Google Scholar] [CrossRef] [Green Version]
Sample Availability: Samples of the compounds 8a and 8d are available from the authors. |


| Compounds | IC50 (μg/mL) | |||||||
|---|---|---|---|---|---|---|---|---|
| 8a | 8b | 8c | 8d | 8e | 8f | 8g | 8h | |
| HCT116[b] | 17.80 ± 0.03 | 21.01 ± 0.38 | 30.12 ± 0.02 | 27.75 ± 0.11 | 35.03 ± 0.25 | 98.43 ± 0.13 | 86.49 ± 0.02 | 100.38 ± 0.04 |
| MCF-7[c] | 33.34 ± 0.28 | 30.81 ± 0.05 | 28.26 ± 0.13 | 26.87 ± 0.06 | 31.31 ± 0.13 | 342.19 ± 0.22 | 275.52 ± 0.07 | 546.68 ± 0.31 |
| EC9708[d] | 44.00 ± 0.61 | 38.94 ± 0.02 | 30.24 ± 0.23 | 41.47 ± 0.14 | 47.35 ± 0.21 | 257.31 ± 0.20 | 300.18 ± 0.11 | 112.41 ± 0.03 |
| QBC939[e] | 43.13 ± 0.05 | 72.88 ± 0.16 | 34.25 ± 0.42 | 36.71 ± 0.04 | 37.73 ± 0.23 | 357.52 ± 0.08 | 290.94 ± 0.05 | 112.02 ± 0.03 |
| SGC-7901[f] | 55.82 ± 0.16 | 67.98 ± 0.18 | 61.60 ± 0.14 | 60.83 ± 0.12 | 72.31 ± 0.33 | 165.34 ± 0.21 | 235.81 ± 0.02 | 200.35 ± 0.05 |
| HeLa[g] | 29.75 ± 0.15 | 27.87 ± 0.22 | 25.94 ± 0.22 | 28.70 ± 0.17 | 48.82 ± 0.13 | 241.31 ± 0.13 | 122.52 ± 0.05 | 334.28 ± 0.04 |
| SW480[h] | 31.09 ± 0.10 | 42.36 ± 0.68 | 39.50 ± 0.31 | 43.08 ± 0.05 | 60.49 ± 0.07 | 155.38 ± 0.14 | 158.37 ± 0.04 | 119.93 ± 0.03 |
| HepG2[i] | 44.65 ± 0.03 | 43.96 ± 0.53 | 58.34 ± 0.22 | 40.11 ± 0.02 | 49.07 ± 0.08 | 296.42 ± 0.21 | 520.52 ± 0.22 | 467.74 ± 0.06 |
| HL-7702[j] | >1000 | >1000 | >1000 | >1000 | >1000 | >1000 | >1000 | >1000 |
| FHC[k] | >1000 | >1000 | >1000 | >1000 | >1000 | >1000 | >1000 | >1000 |
| Compound | QSAR Set | IC50 μg/mL | Experimental pIC50 | CoMFA Model | CoMSIA Model | ||
|---|---|---|---|---|---|---|---|
| Predicted pIC50 | Residual | Predicted pIC50 | Residual | ||||
| 8a | training | 17.80 | −1.25 | −1.283 | 0.033 | −1.262 | 0.033 |
| 8b | training | 21.01 | −1.32 | −1.287 | −0.033 | −1.230 | −0.033 |
| 8c | training | 30.12 | −1.48 | −1.435 | −0.045 | −1.577 | 0.097 |
| 8d | training | 27.75 | −1.44 | −1.421 | 0.019 | −1.593 | 0.153 |
| 8e | training | 35.03 | −1.54 | −1.524 | −0.016 | −1.536 | −0.004 |
| 8f | training | 98.43 | −1.99 | −2.009 | 0.019 | −1.974 | 0.019 |
| 8g | training | 86.49 | −1.94 | −1.976 | 0.036 | −2.054 | 0.036 |
| 8h | training | 100.38 | −2.00 | −2.023 | 0.023 | −1.787 | 0.023 |
© 2020 by the authors. Licensee MDPI, Basel, Switzerland. This article is an open access article distributed under the terms and conditions of the Creative Commons Attribution (CC BY) license (http://creativecommons.org/licenses/by/4.0/).
Share and Cite
Li, Y.; Guo, F.; Guan, Y.; Chen, T.; Ma, K.; Zhang, L.; Wang, Z.; Su, Q.; Feng, L.; Liu, Y.; et al. Novel Anthraquinone Compounds Inhibit Colon Cancer Cell Proliferation via the Reactive Oxygen Species/JNK Pathway. Molecules 2020, 25, 1672. https://doi.org/10.3390/molecules25071672
Li Y, Guo F, Guan Y, Chen T, Ma K, Zhang L, Wang Z, Su Q, Feng L, Liu Y, et al. Novel Anthraquinone Compounds Inhibit Colon Cancer Cell Proliferation via the Reactive Oxygen Species/JNK Pathway. Molecules. 2020; 25(7):1672. https://doi.org/10.3390/molecules25071672
Chicago/Turabian StyleLi, Yuying, Fang Guo, Yingying Guan, Tinggui Chen, Kaiqing Ma, Liwei Zhang, Zhuanhua Wang, Qiang Su, Liheng Feng, Yaoming Liu, and et al. 2020. "Novel Anthraquinone Compounds Inhibit Colon Cancer Cell Proliferation via the Reactive Oxygen Species/JNK Pathway" Molecules 25, no. 7: 1672. https://doi.org/10.3390/molecules25071672