Change Detection and Land Suitability Analysis for Extension of Potential Forest Areas in Indonesia Using Satellite Remote Sensing and GIS


1
Graduate School of Life and Environmental Sciences University of Tsukuba, Tsukuba 305-8572, Japan
2
Faculty of Life and Environmental Sciences University of Tsukuba, Tsukuba 305-8572, Japan
*
Author to whom correspondence should be addressed.
Forests 2020, 11(4), 398; https://doi.org/10.3390/f11040398
Submission received: 5 March 2020
/
Revised: 24 March 2020
/
Accepted: 31 March 2020
/
Published: 2 April 2020
(This article belongs to the Section Forest Inventory, Modeling and Remote Sensing)
Abstract
:The objective of this research was to detect changes in forest areas and, subsequently, the potential forest area that can be extended in the South Sumatra province of Indonesia, according to the Indonesian forest resilience classification zones. At first, multispectral satellite remote sensing datasets from Landsat 7 ETM+ and Landsat 8 OLI were classified into four classes, namely urban, vegetation, forest and waterbody to develop Land Use/Land Cover (LULC) maps for the year 2003 and 2018. Secondly, criteria, namely distance from rivers, distance from roads, elevation, LULC and settlements were selected and the reclassified maps were produced from each of the criteria for the land suitability analysis for forest extension. Thirdly, the Analytical Hierarchy Process (AHP) was incorporated to add expert opinions to prioritize the criteria referring to potential areas for forest extension. In the change detection analysis, Tourism Recreation Forest (TRF), Convertible Protection Forest (CPF) and Permanent Production Forest (PPF) forest zones had a decrease of 20%, 13% and 40% in area, respectively, in the forest class from 2003 to 2018. The Limited Production Forest (LPF) zone had large changes and decreased by 72% according to the LULC map. In the AHP method, the influential criteria had higher weights and ranked as settlements, elevation, distance from roads and distance from rivers. CPF, PPF and LPF have an opportunity for extension in the highly suitable classification (30%) and moderately suitable classification (41%) areas, to increase coverage of production forests. Wildlife Reserve Forests (WRFs) have potential for expansion in the highly suitable classification (30%) and moderately suitable classification (52%) areas, to keep biodiversity and ecosystems for wildlife resources. Nature Reserve Forests (NRFs) have an opportunity for extension in the highly suitable classification (39%) and moderately suitable classification (48%) areas, to keep the forests for nature and biodiversity. In case of TRF, there is limited scope to propose a further extension and is required to be managed with collaboration between the government and the community.
1. Introduction
Indonesia has been losing up to 2 million hectares of land annually, mainly due to illegal cutting and land conversion [1]. Due to a faster growing population, the land conversion takes place to support the infrastructure expansion investment in agriculture and the establishment of cash-crop plantations [2]. Indonesia’s urbanization and growth are covered for economic security through conversion of millions of hectares of forest to palm oil plantations [3]. Deforestation rates have increased throughout Indonesia due to urbanization and palm oil plantations covering 5,418,413 ha [4]. In addition, forest fires, poor forest management practices and an increasing demand for forest products and agriculture contribute to the damage of forests, which are more severe in the South Sumatra province of Indonesia. Many forests in South Sumatra have recently experienced high rates of deforestation due to human migration and the expansion of agriculture or industry. Land-use planning has not taken place over time to align the changes in forest resources according to the Indonesian forest resilience classification. It is also necessary to increase the growth of the economy and, on the other hand, the sustainability of forests through improving the resilience of forest coverage. Forest coverage must be estimated periodically to detect these changes. The change detection analysis has the advantage to visualize the dynamics of changes in forest and deforestation processes. Though the forest is a gift of nature, to maintain the carbon cycle, stocking and sequestration processes in vulnerable areas, further expansion of forest areas needs to be extended by locating such potential areas in time. Production and convertible type forests have the opportunity to expand into these potential areas, which can support the Indonesian forest management system through community support [5]. In Indonesia, there are six types of forest classification zones, defined by the Indonesian forest resilience system: Tourism Recreation Forest (TRF), Convertible Protection Forest (CPF), Permanent Production Forest (PPF), Limited Production Forest (LPF), Wildlife Reserve Forest (WRF) and Nature Reserve Forest (NRF) [6]. A TRF is a forest used for tourism, research, education and cultural activities. CPFs are spatially reserved for use in the development of transmigration, agricultural and plantation settlements. A PPF is a forest exploited for the treatment of selective logging or by clear-cutting. An LPF is allocated to produce wood on a small scale and is located in mountainous areas. A WRF is the natural reserve zone for wild animals and other natural ecosystems. In turn, an NRF consists of natural forest and has the function of protecting the forest, controlling soil erosion, preventing seawater intrusion and maintaining soil fertility. In each type of forest change detection could help to project the changes in the ecosystem, carbon stocking and sequestration.
The change detection analysis can be mapped using satellite remote sensing datasets for the coverage and changes in the spatial and time scales. Remote sensing techniques provide a source of data that updates land cover information to monitor ecosystem changes over time [7,8,9]. The change detection analysis has the advantages of determining the nature, biodiversity, extent, and rate of land-cover changes, as well as aiding future planning and land management, such as plantation, urbanization, water management and extending the land [10,11,12]. Monitoring and analysis for change detection is the most adopted application of the satellite data [13,14,15]. Among them, Landsat satellite datasets have been used for change detection analysis [11,14,16,17]. Change detection analysis can enhance the land-use planning within a framework of laws and policies to guide forest zone allocation. The change detection assessment has become central to diverse facets of the natural environment [18,19,20]. The changed information is highly needed to encourage forest management and to inform appropriate expansion. It is thus important to detect when, where and why change occurs, as well as study the patterns of the changes for the future [21].
In the change detection analysis, remote sensing and GIS help to drive and integrate the present land-use planning criteria, including important factors such as elevation, settlements, distance from roads and distance from rivers. These factors govern the possibility of expansion. However, land encroachment for forest expansion is a critical problem in many countries. Land encroachment and conversion need the opinions of the government and local stakeholders [22]. In the stakeholder opinion, the population and settlement factors are very much significant when considering the potential expansion of production forests. Both expert opinion and government policy maker participation are very important to enable successful forest expansion. Analytical Hierarchy Process (AHP) has the potential to include expert opinion into GIS and remote sensing datasets [23,24,25]. Expert opinion and stakeholder participation are required to minimize the adverse effect due to deforestation, and to confirm the change detection for the classified forest areas. Once the classified forest changes are largely identified, it is necessary to propose further extended areas that have the potential to extend new plantations as production forest. Therefore, the objective of this research is to perform a change detection analysis for the classified forest zones and a suitability analysis to locate potential areas for extension.
2. Materials and Methods
2.1. Geographical Extent and Forest Coverage in Study Area
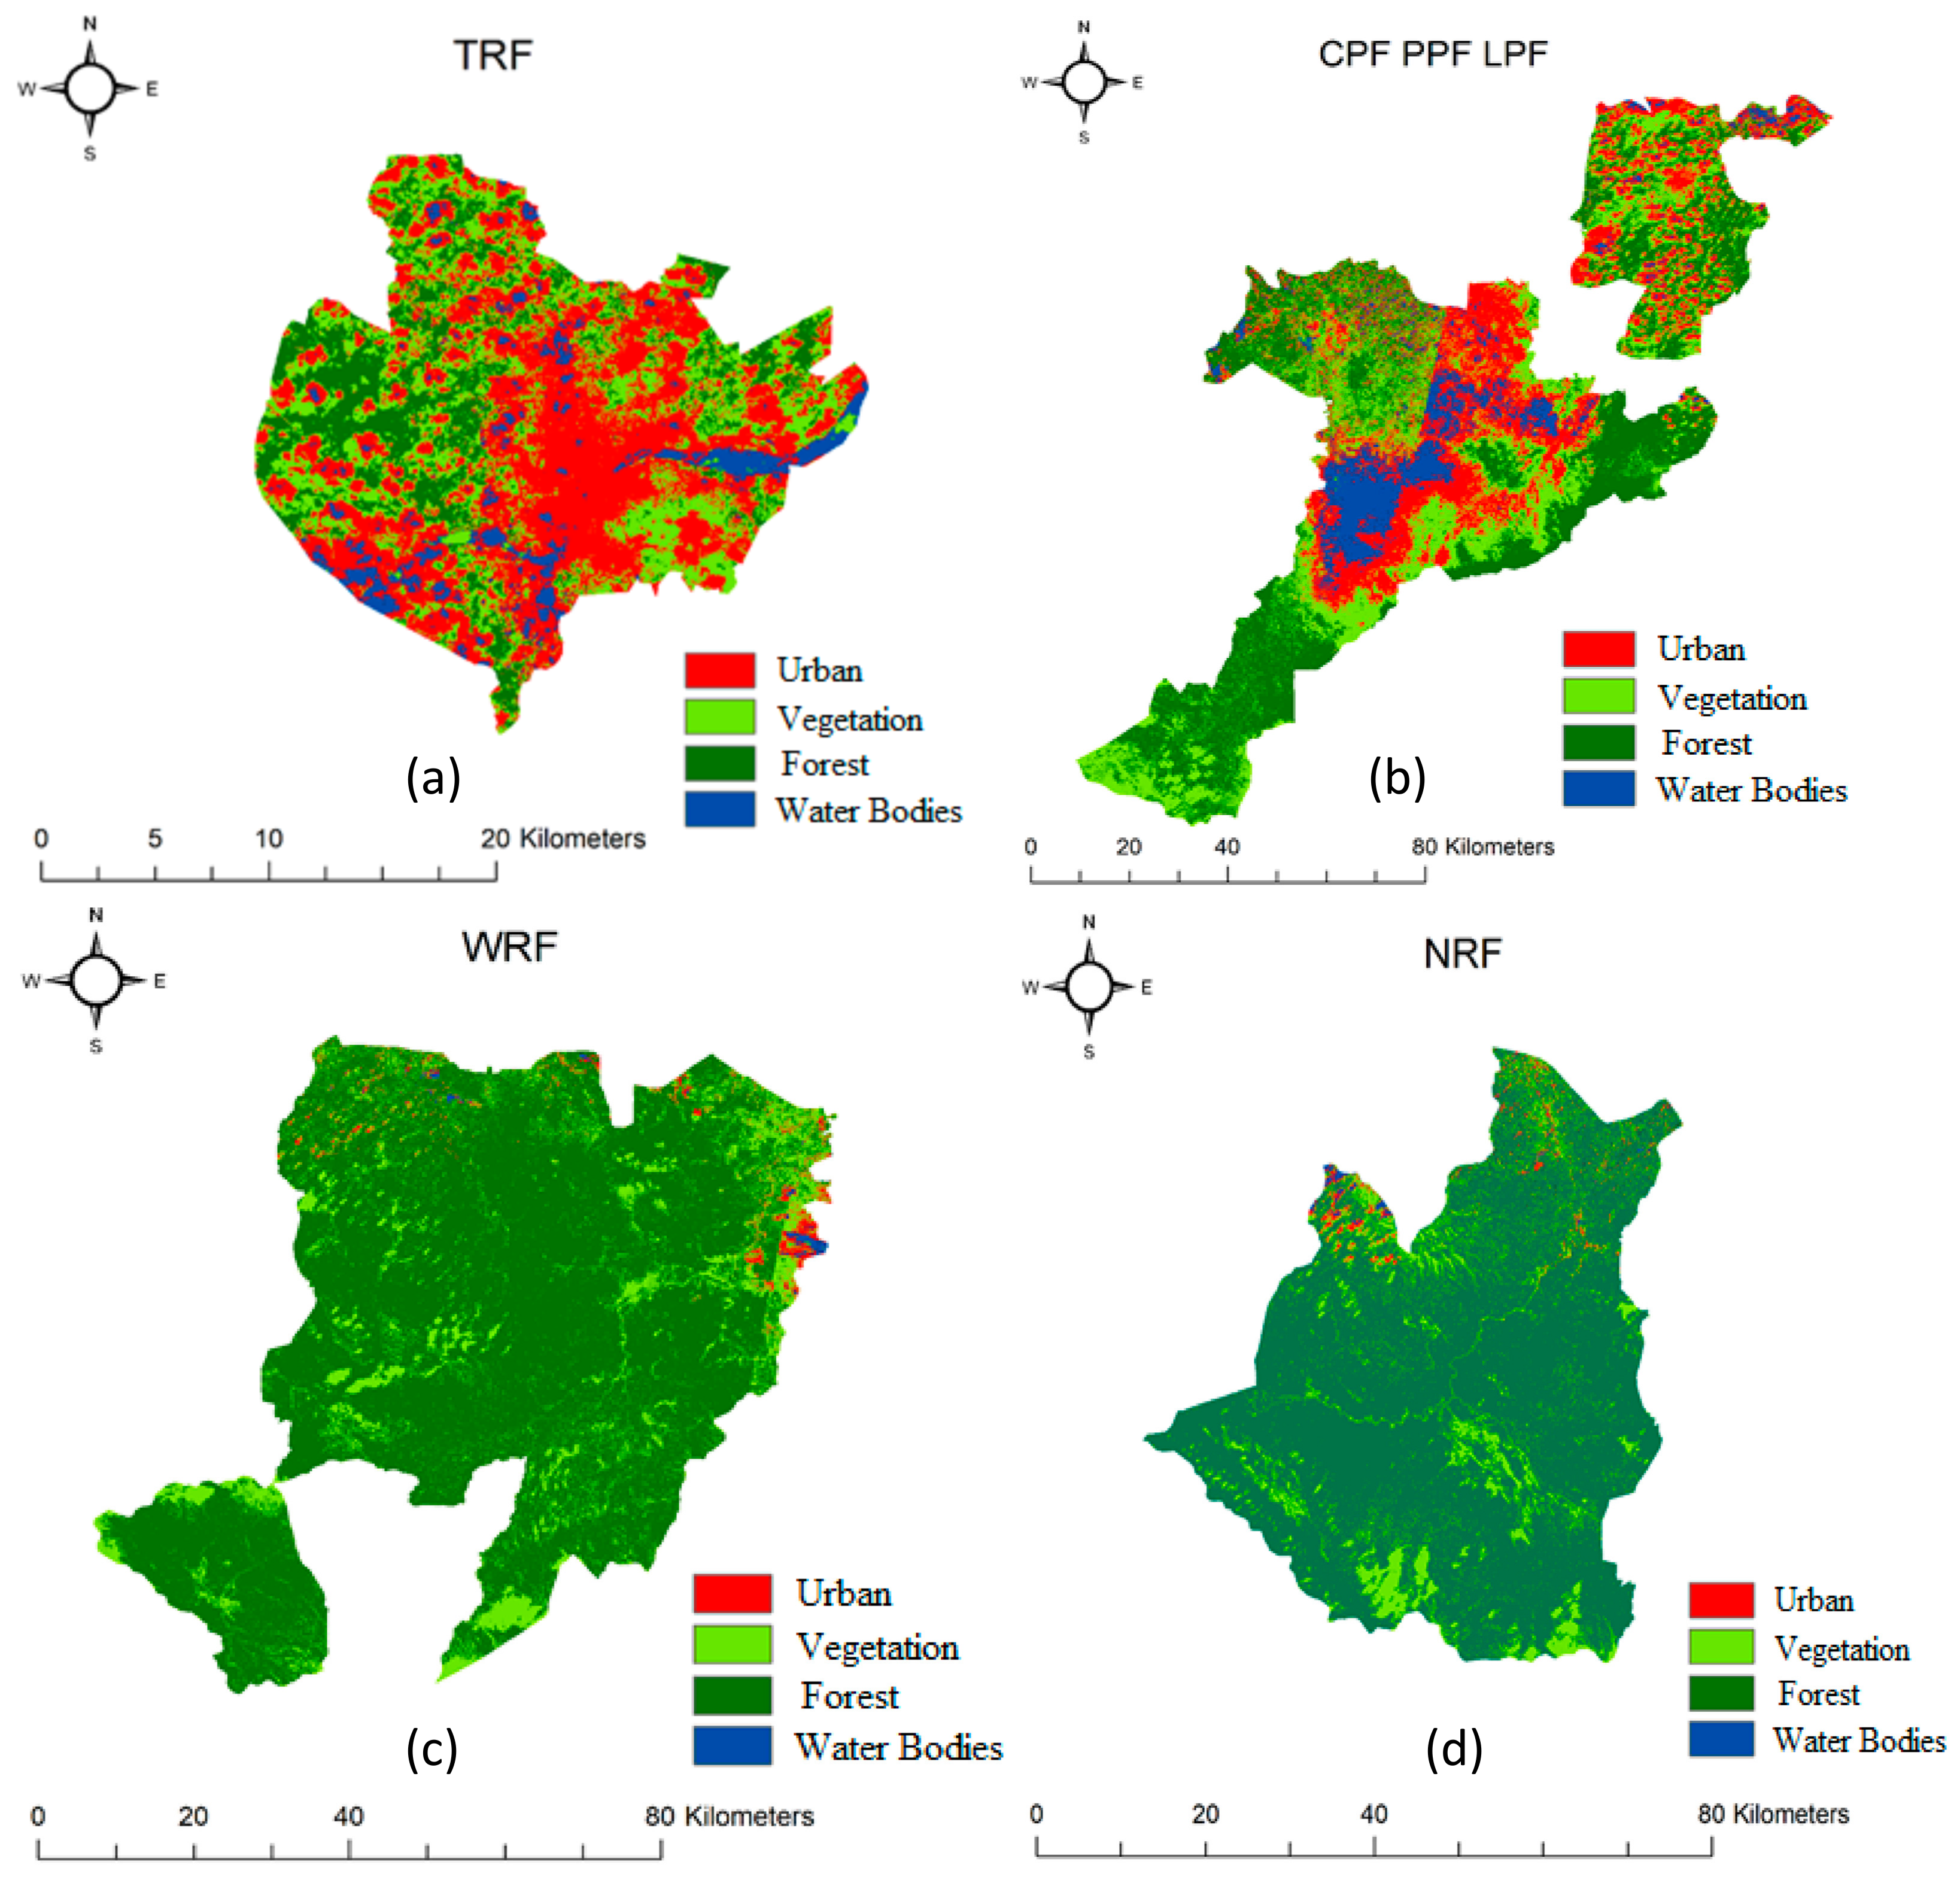
The study area is located in South Sumatra covered with TRF, CPF, PPF, LPF, WRF and NRF declared by the local government in the forest management system (Figure 1). The six forest zones are located in the four different locations were taken spatially to analyze the changes in those zones. Three types of forest zones are located in the same area of South Sumatra (Figure 1c). TRF is located in the Palembang city, the capital of the province of South Sumatra with an area of 40 ha, inside the city area of 3,585,500 ha. CPF, PPF and LPF are located in the agricultural area covered with 81,581,400 ha in the middle of South Sumatra. CPF covers only 819.84 ha of land, which is used for the production of forest products and reserved for the development of transmigration, agriculture and plantations. PPF has an area of 172.75 ha and can be used through selective logging or clear-cutting of wood products. LPF covers 312.33 ha of forest land that is allocated for the production of wood on a small scale. WRF covers 989 ha with a total area of 407,600 ha as a reserve zone for wild animals and other natural ecosystems. NRF covers 305 ha with a total area of 22,565,100 ha [6]. NRF has the function of protecting the forest, controlling soil erosion, preventing seawater intrusion and maintaining soil fertility (Figure 1).
2.2. Change Detection Analysis
Change detection of forest land is important to understand the trends of changes in the past, currently and projections for the future. This study considered the time scale of 2003 to 2018 to assess the trend of changes over the last 15 years. The post-classification method was employed for change detection to provide the matrix table of “from–to” change for the two date images on the base pixel comparison [26]. The change area is the area of the target vegetation cover type at the beginning (2003) and the end (2018) of the study period, respectively. Since it is a large forest area, the continuing years of change may not have as much of a significant difference compared to the highly urbanized areas where land-use changes are very frequent and yearly reporting is very important.
2.2.1. Data Acquisition and Sources
The change detection analysis was conducted using two-year series of multispectral datasets for South Sumatra, using Landsat 7 for 2003 and Landsat 8 OLI for 2018. Data were collected from the USGS satellite remote sensing datasets resources and Indonesia Geospatial Agency (BIG). Selected criteria were taken into account in the GIS analysis to map the potential areas for further extension of forests (Table 1).
2.2.2. Image Processing for Land Use/Land Cover (LULC)
Satellite datasets from Landsat 7 ETM+(2003) and Landsat 8 OLI (2018) were used to develop the LULCs The imagery was visually interpreted to prepare the change detection maps using a knowledge-based supervised and maximum likelihood classification in the ArcMap environment. The maximum-likelihood classifier was adopted from a parametric classification algorithm [27,28,29,30] and divided into four classes: urban, vegetation, forest and waterbodies (Table 2). The classes that were involved in the selection of the training sites were used as a reference in the user-guided approach [17,31,32,33,34]. For each of the predetermined change detection types, training samples were selected by delimiting the polygons in the study area. Spectral signatures from the satellite imagery were chosen by pixels. A satisfactory spectral signature was ensured for the land cover map [35] (Figure 2a).
2.2.3. Accuracy Assessment
The accuracy assessment was conducted using reference data points from the base map used to validate the LULC. A stratified random sampling method was employed for selecting 200 points on the map with each class of 50 points (Figure 2a). The accuracy was evaluated using the Producer’s Accuracy (PA), User’s Accuracy (UA) and Overall Accuracy (OA) [36,37,38] for consideration of the nearest results to accept as true. PA is the map accuracy from the point of the mapmaker (the producer) to represent how well the reference pixels of the ground cover type are classified. The PA refers to the number of correctly classified pixels in each category (on the major diagonal) by the number of reference pixels “known” to be of that category (the column total). While, the UA was computed by dividing the number of correctly classified pixels in each category by the total number of pixels that were classified in that category (the row total). The UA represents the probability that a pixel classified into a given category actually represents that category on the ground, referred to as reliability. In addition, to measure the agreement, we used the Kappa coefficient (Figure 2a). Kappa measures the percentage of data values in the main diagonal of the table and then adjusts these values for the amount of agreement that could be expected due to chance alone. The Kappa needs to calculate the observed level of agreement and then compares it to the value that is expected. The value of Kappa is defined as
where is the Kappa coefficient; r is the number of rows in error matrix; is the total number of observations (pixels) in the matrix; is the number of observations in row i, column i is the total number of observations in row I; and is the total number of observations in column I. To interpret the Kappa coefficient following the formula is more useful:
where is the accuracy of the observed agreement, ; and is the estimate of chance agreement, . The coefficient of agreement Kappa is −1 ≤ k ≤ 1. Interpretation of Kappa is referred to as a poor agreement if it is less than 0.20; a fair agreement is from 0.20 to 0.40; a moderate agreement ranges between 0.40 and 0.60; a good agreement ranges from 0.60 to 0.80; and a very good agreement ranges from 0.80 to 1.00. An accuracy assessment provides the information for estimating the uncertainty of map classes and the construction of confidence intervals. Accuracy assessment is performed by comparing the map created by remote sensing analysis to a reference map based on a different information source. Both of the maps were evaluated and registered geometrically to each other.
2.3. Suitability Analysis for Extension of Potential Forest Area
The suitable potential area refers to the lands that have the opportunity for conversion of forest with economic return over a period of time. In the forest extension planning process, it is important to understand the problem of finding suitable locations for the potential areas. The vegetation land was considered with the timeframe for coverage. Basic land-use change focuses on the land use covered by humans and their habitats (such as agriculture, settlements, industry, etc.), apart from natural disaster factors. The suitable areas for forest potential extension was computed using the weighted overlay procedure in ArcGIS® (ESRI, Redlands, NY, USA). In this research, five criteria were selected: settlements, LULC, elevation, rivers and roads. The description of the criteria and reclassification are described in the following section.
2.3.1. Criteria for Suitability Analysis
The criteria for suitability analysis were settlements, LULC, elevation, distance from rivers and distance from roads (Table 3 and Figure 3).
Settlements
Settlements include buildings for residences or for industrial activity that has that land-use component [39,40]. Settlements are areas of human habitation with buildings, civil facilities (hospitals, schools, places of worship and sports areas. The forest loss corresponded with an increase in human settlement. Settlements are driven to overexploit natural resources in forest areas and accelerate land degradation [41]. A settlements map was produced from Landsat 8 OLI satellite images that were verified using Google Earth Pro and confirmed with an overlay process using Indonesian geospatial datasets (Figure 3a).
LULC
LULC was built using satellite remote sensing from Landsat 7 ETM+ and Landsat 8 OLI. Landsat 7 was used to develop the classifier for the study area in 2003 and Landsat 8 OLI was used for the classifier in 2018. Both Landsat images were processed using supervised maximum likelihood classification. Land-cover classes were defined by a string of classifiers with the aim of achieving a logical and functional hierarchical arrangement of the classifiers; certain criteria were applied. The four categories urban, waterbody, vegetation and forest were used in the LULC for 2018 (Figure 3b).
Elevation
The study area is comprised of lowlands, although there were no peatlands in the forest zones. However, South Sumatra had deforestation due to plantation potential and agriculture. In addition, this area has a tropical rainforest heritage. Tropical elevation areas have high biodiversity and rich ecosystem services [42,43] (Figure 3c).
Distance from Rivers
The unavailability of water strongly constrains the distribution of plants on the Earth’s surface [44,45], ecosystems and forests [46,47,48,49]. Therefore, rivers are a source of water to get potential area for extensions. The data for distance from rivers were collected from the Indonesian geospatial agency (Figure 3d). It is worth mentioning that the rivers are important in supporting regional biodiversity and provides important services for people, such as food, fodder, shelter, construction materials and medicine [50]. The ecology in forests refers to the relationships that living organisms have with each other and with their environment. In that case, access to water sources (rivers) is required for new forestation. Consider supporting potential forest areas: The distance to a river has a direct impact on the importance of the relationship between forests and water: The location of the rivers needs to be close to the vegetation and the dependent animal life. To protect a variety of forest ecological processes, distance from rivers is one of the factors. There are several types of forest ecological processes that depend on dry areas (distance from rivers is far) or wet areas (distance from rivers is close) [51]. The rivers have been highlighted as a priority for scientists, policymakers and managers [52].
Distance from Roads
The availability of roads in forest areas was considered in order to increase the forest plantation area to facilitate the extension of some plantation forest. The potential extension might be difficult when the road is unavailable in forest zones (except, of course, the roads that were built for the plantation system) (Figure 3e).
Furthermore, the masking of areas in each forest type was done to understand the changes that occurred in each forest (Figure 4).
2.3.2. Reclassification of Criteria
The selected criteria were reclassified to understand the importance of each of the criteria and their suitability assessment. The reclassification was performed using the criteria to classify the vector and raster data by replacing a new value in the four classifications based on FAO recommendations. The classification was suggested based on the following levels of suitability: highly suitable (S1), moderately suitable (S2), marginally suitable (S3) and not suitable (N). The classification of the spatial data, such as vector datasets, were translated into raster layers and were processed using ArcGIS ®10.4 (Table 4).
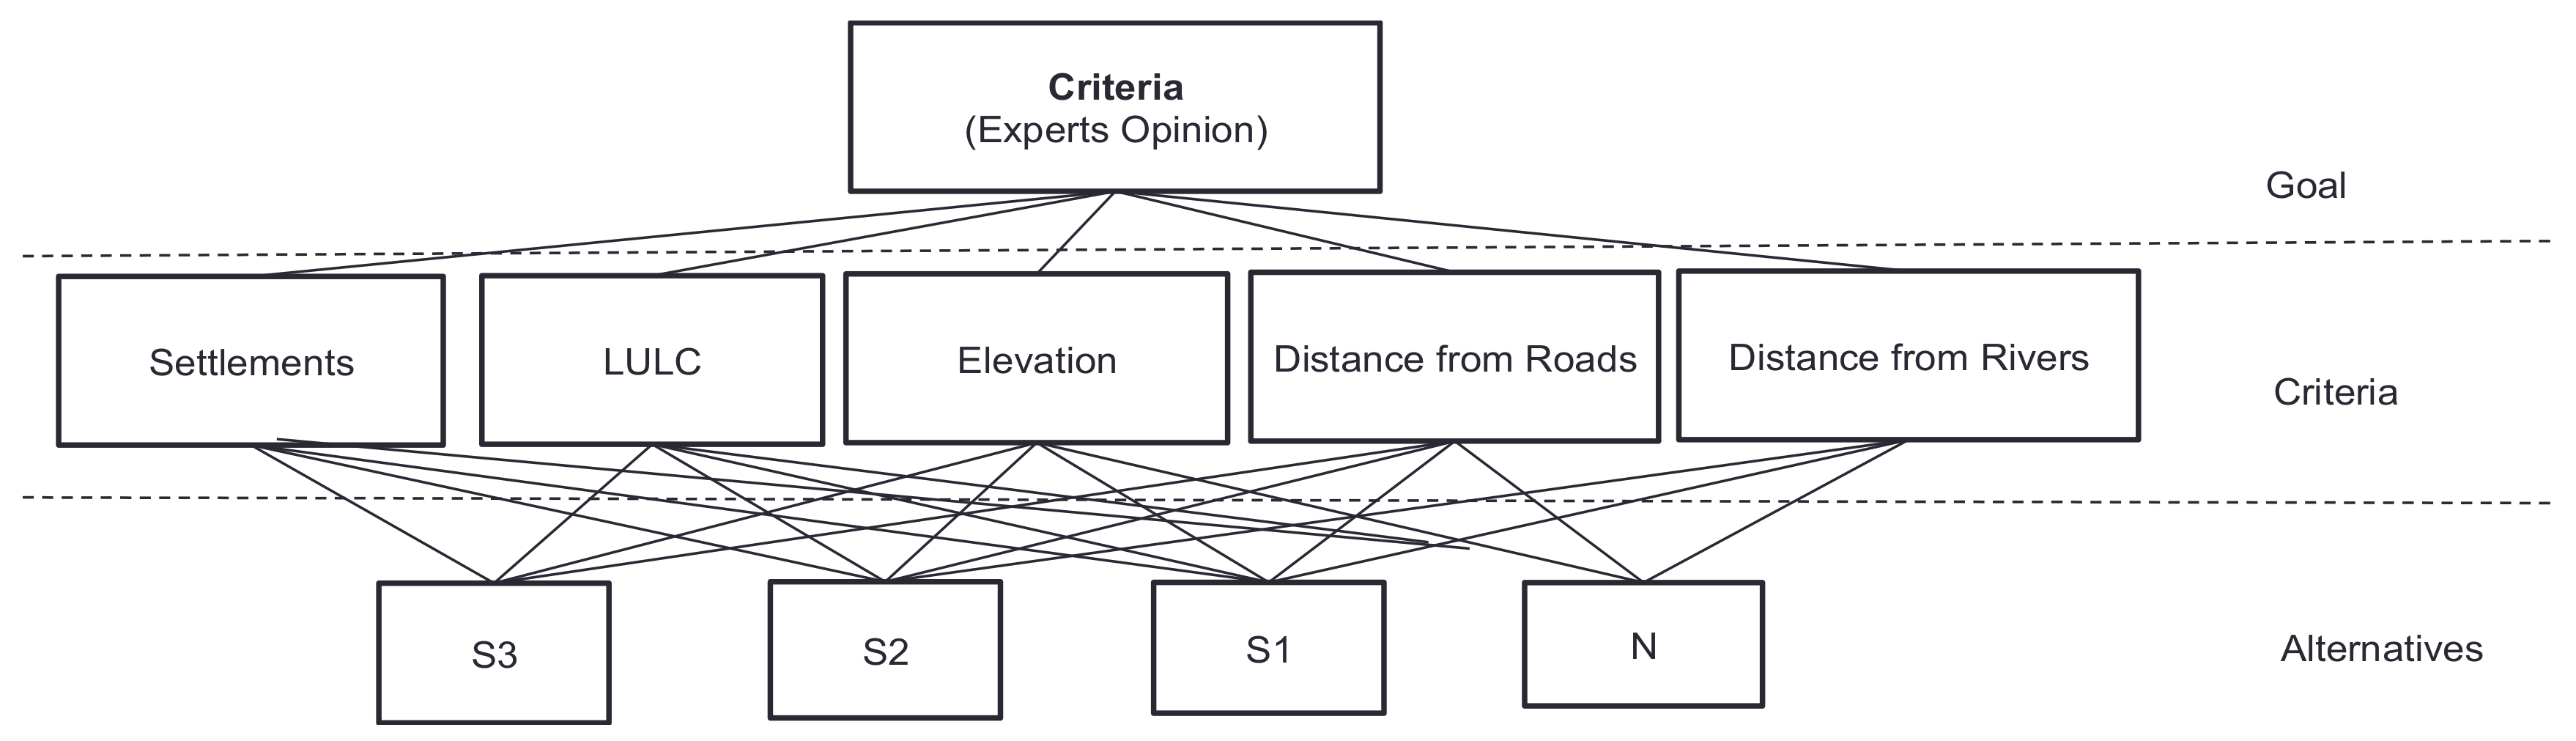
2.4. AHP
AHP is a mathematical method that uses several criteria to analyze complex decisions [56,57]. This method has been successfully applied to forestry applications [57,58,59,60,61,62]. In this AHP analysis, weighting of several criteria was used to conduct the pairwise comparison of two criteria at a time. Each weight was determined by experts to choose for the pairwise comparison matrix. In our research framework, the top class was to determine the potential forest extension areas (goal), the middle class being the criteria and bottom class the alternative. The middle class of the hierarchy was considered the rules or criteria of the goal. The bottom class was considered alternative decisions (Figure 5). Questionnaires were used to gather expert opinions on the relative importance of the criteria and factors. Comparative results (for each factor pair) were described as integer values of 1 (equal value) to 9 (extremely different), where a higher number indicated that the chosen factor was more important than the other factors to which it was compared (Table 5). In the AHP analysis, first, five criteria were selected based on a literature review and expert opinion. All scores were assembled in a pairwise comparison matrix, with diagonal and reciprocal scores located in the lower left-hand triangle. Reciprocal values (1/3, 1/5, 1/7 and 1/9) were used where the row criterion was found to be less important than the column criterion. Secondly, scoring was involved in the criteria via pairwise comparisons and scales of relative importance. The random indices of Saaty [63] are listed for the observation from 3 to 9 (Table 6). Thirdly, the matrix was calculated and ensured the consistency of the pairwise comparison criteria. The pairwise matrix was calculated with the comparison results, creating a matrix form C with dimensions of m × n by the following expression:
The sum of each column of the pairwise matrix was denoted as follows:
Then the element of the matrix was divided by its column total to generate a normalized pairwise matrix:
The AHP generates a weight for each evaluation criterion according to the expert’s pairwise comparisons of the criteria. The higher weight is more important than the corresponding criteria. Then the AHP combines the weights and the scores to determine the total score for each option and a consequent ranking was used (n) to generate the weighted matrix of the priority criteria (W):
To compute an estimate of the eigenvector for a pairwise comparison matrix, we multiplied the normalized matrix with the priorities vector (principal eigenvector of the matrix). Then we divided the elements in the resulting vector of priorities and took the average. The initial consistency vectors were derived by multiplying the pairwise matrix by the vector of weights:
The number of objectives and alternatives should not exceed seven, respectively, to make the decision process manageable [64]. The principal eigenvector (λmax) was calculated by averaging the values of the consistency vector:
Eigenvalues were calculated by averaging the rows of each matrix. Eigenvalues were also referred to as relative weights. The largest eigenvalue was equal to the number of criteria, and when = n, judgments were consistent. Normalized eigenvalues were generated as the weights of the priority criteria. The consistency index (CI) was calculated following [56], where the deviation from n is a measure of inconsistency:
2.5. Land Suitability for Forest Extension Areas
The land suitability analysis for potential forest extension areas was carried out using various classification categories suggested by the FAO. The reclassified criteria were selected to perform the weighted overlay to develop the land suitability map for forest extension. In the weighted overlay, the AHP weights were used and can be expressed as
where Ci is the criteria (i) that was reclassified, and Wn is the amount of weighted data (n). The classes are noted as highly suitable (S1), moderately suitable (S2), marginally suitable (S3) or not suitable (N) within the FAO land assessment framework. Then these suitability classes can be subdivided further as needed. These three classes, S1, S2 and S3, were used to identify highly suitable, moderately suitable and marginally suitable lands for potential forest extension areas. In the GIS environment, suitability analysis was conducted to find the potential areas for extension of forests.
3. Results
3.1. Change Detection Analysis
Based on the landscape of the study area, change detection analysis was done in four categories: urban, waterbody, vegetation and forest for six types of forest zones (Figure 6 and Table 7). A negative value is presented to show a decrease in change detection while a positive value indicates an increase in the change detection class. In the study area, TRF was observed as an increasing trend in the urban class by 37.03% (14.78 ha). A decreasing trend was observed in the vegetation and forest classes by 21.47% (8.61 ha) and 20.09% (8.06 ha), respectively. CPF, PPF and LPF had an increased rate in the urban land-use class. The highest percentage of increased area was observed in the LPF area of 48.75% (1514.34 ha). The CPF and PPF were 4.56% (372.16 ha) and 9.52% (163.72 ha). An increasing trend was observed in the vegetation class with the highest percentage in the PPF area of 31.16% (535.7 ha). In the case of the LPF and CPF, vegetation class was increased by 23.63% (733.92 ha) and 10.09% (823.49 ha), respectively. CPF, PPF and LPF had a decreasing trend in the percentage of forest classes by 72% (2236.62 ha), 40.21% (691.12 ha) and 13.56% (1105.72 ha). Waterbodies were decreased by 1.09% (88.66 ha) for CPF and 0.37% (11.65 ha) for LPF. WRF was increased in urban and forest classes by 3% (29.56 ha) and 33.44% (329.7 ha). Waterbody classes were decreased by 6.2% (61.15 ha). NRF had an increasing trend in the forest class by 33.05% (92.26 ha). However, the declining trend was also observed in urban and waterbody classes by 19.78% (55.22 ha) and 0.99% (2.75 ha), respectively (Table 7).
3.2. Accuracy Assessment
The accuracy assessment was referred to by the producer’s accuracy of 86% and 96% for the urban class in 2003 and 2018 in the six types of forest zones. The vegetation class had a producer’s accuracy of 86% and 100% for both the years in 2003 and 2018. The forest class also had a producer’s accuracy of 90% and 96% in 2003 and 2018. The waterbody class had a producer’s accuracy of 80%–96%. The Kappa coefficient of agreement was more than 0.60 (Table 8). The interpretation of Kappa showed a good agreement for all types of forests.
3.3. Land Suitability Analysis for Extension of Potential Forest Area
Reclassification of Criteria
The reclassifications of criteria were categorized into four classifications, namely highly suitable, moderately suitable, marginally suitable and not suitable, according to a land suitability analysis (FAO 1976). The settlements criteria showed that 57.47% of the areas were highly suitable (1310 ha) and 23.48% of the areas were moderately suitable (535 ha). In the case of the LULC reclassification, 57.6% of the areas had forest and were highly suitable (790,712 ha). On the other hand, 24.2% of the areas were observed as vegetation and were reported as moderately suitable (333,020 ha). From the reclassification of elevation criteria, 53.28% of the areas were noted as highly suitable (495,989 ha) and 25.56% were moderately suitable (237,940 ha). The roads were measured using the Euclidean distance and a reclassification of this criteria showed that 85.77% of the areas were highly suitable (1,163,759 ha) and 9.77% were moderately suitable (132,494 ha). Evaluating the distance from rivers in a similar way, the reclassification refereed that 97.96% of the areas were highly suitable (1,339,701 ha) and 1.38% were moderately suitable (18,856 ha) (Table 4, Figure 7).
3.4. AHP
In the AHP, the expert’s opinions were considered using a comparison of the scale matrix for each criterion, whose expert judgment for the ranking of the criteria affected the area of land suitability. A pairwise matrix was used in the AHP for the expert opinion using five criteria. The AHP weight results indicated that the settlements weight was scored first, LULC second, elevation third, distance from road fourth and distance from a river fifth (Table 9). In ArcGIS®, the criteria were reclassified as raster-based data layers and integrated with a weighted overlay according to the weight rank given by the experts. The rank was given to prioritize the influence of the criteria for the extension of potential areas of forest in the land suitability analysis.
3.5. Land Suitability Analysis for Extension of Potential Forest Area
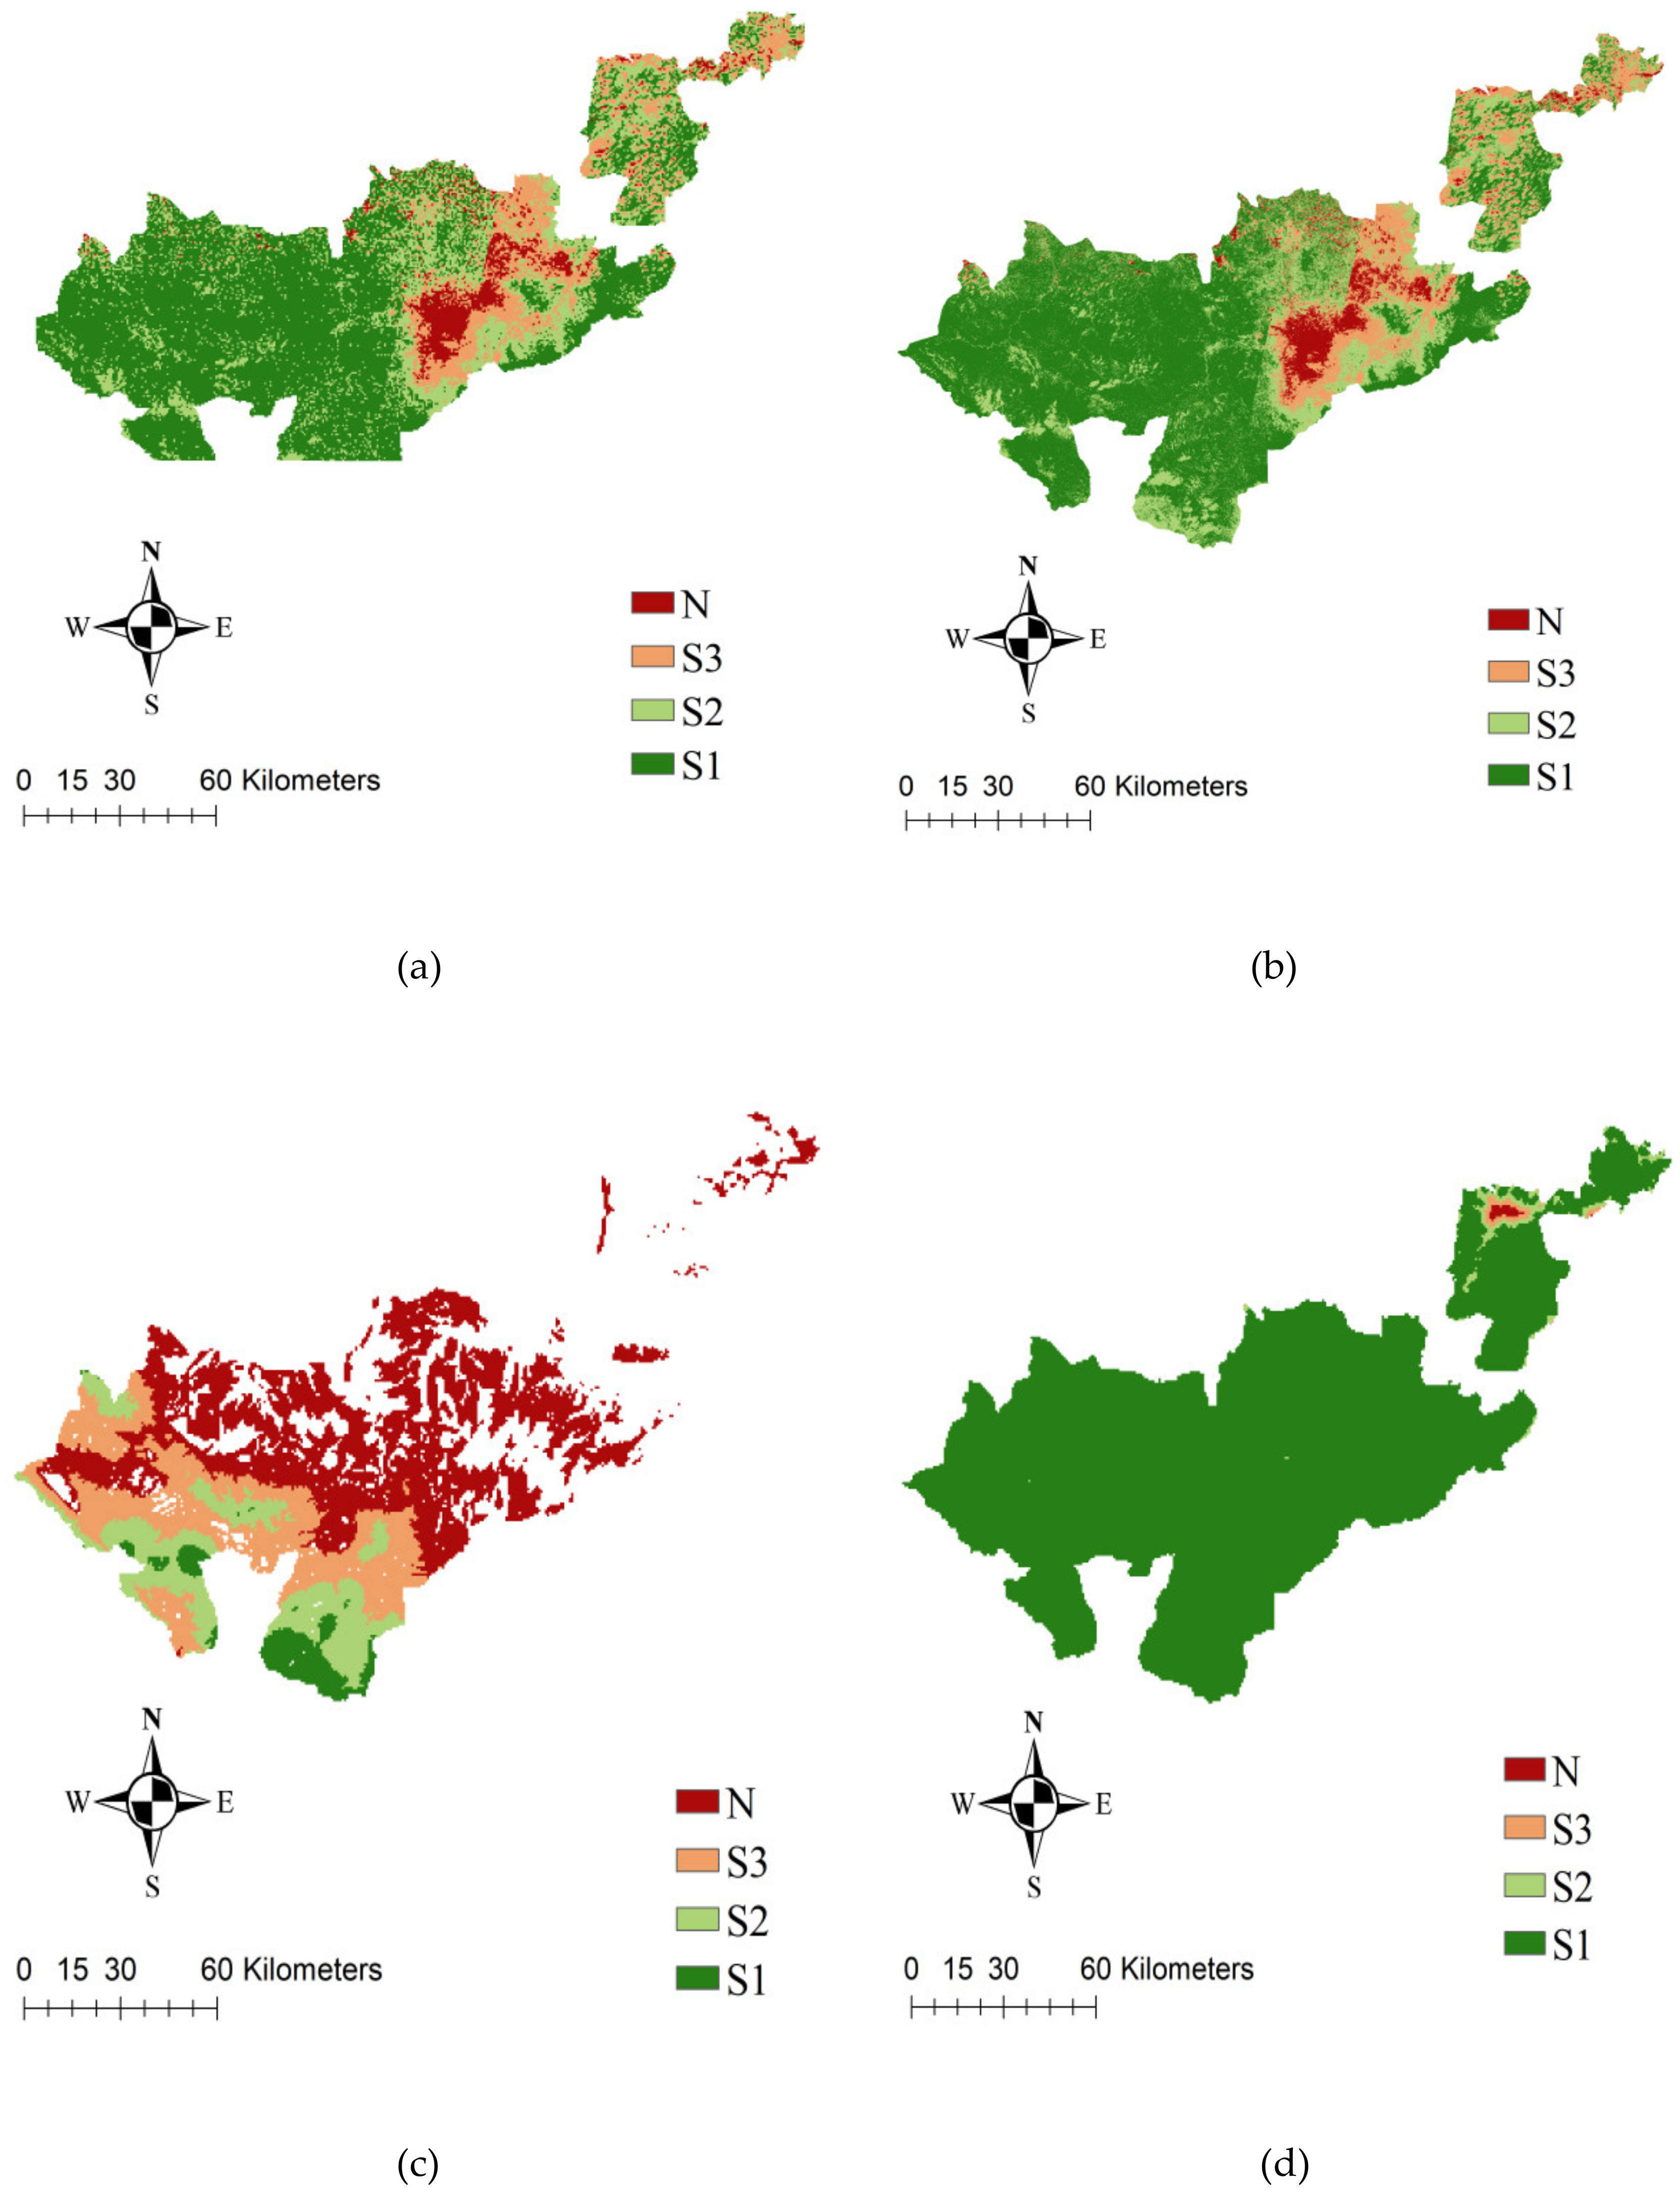
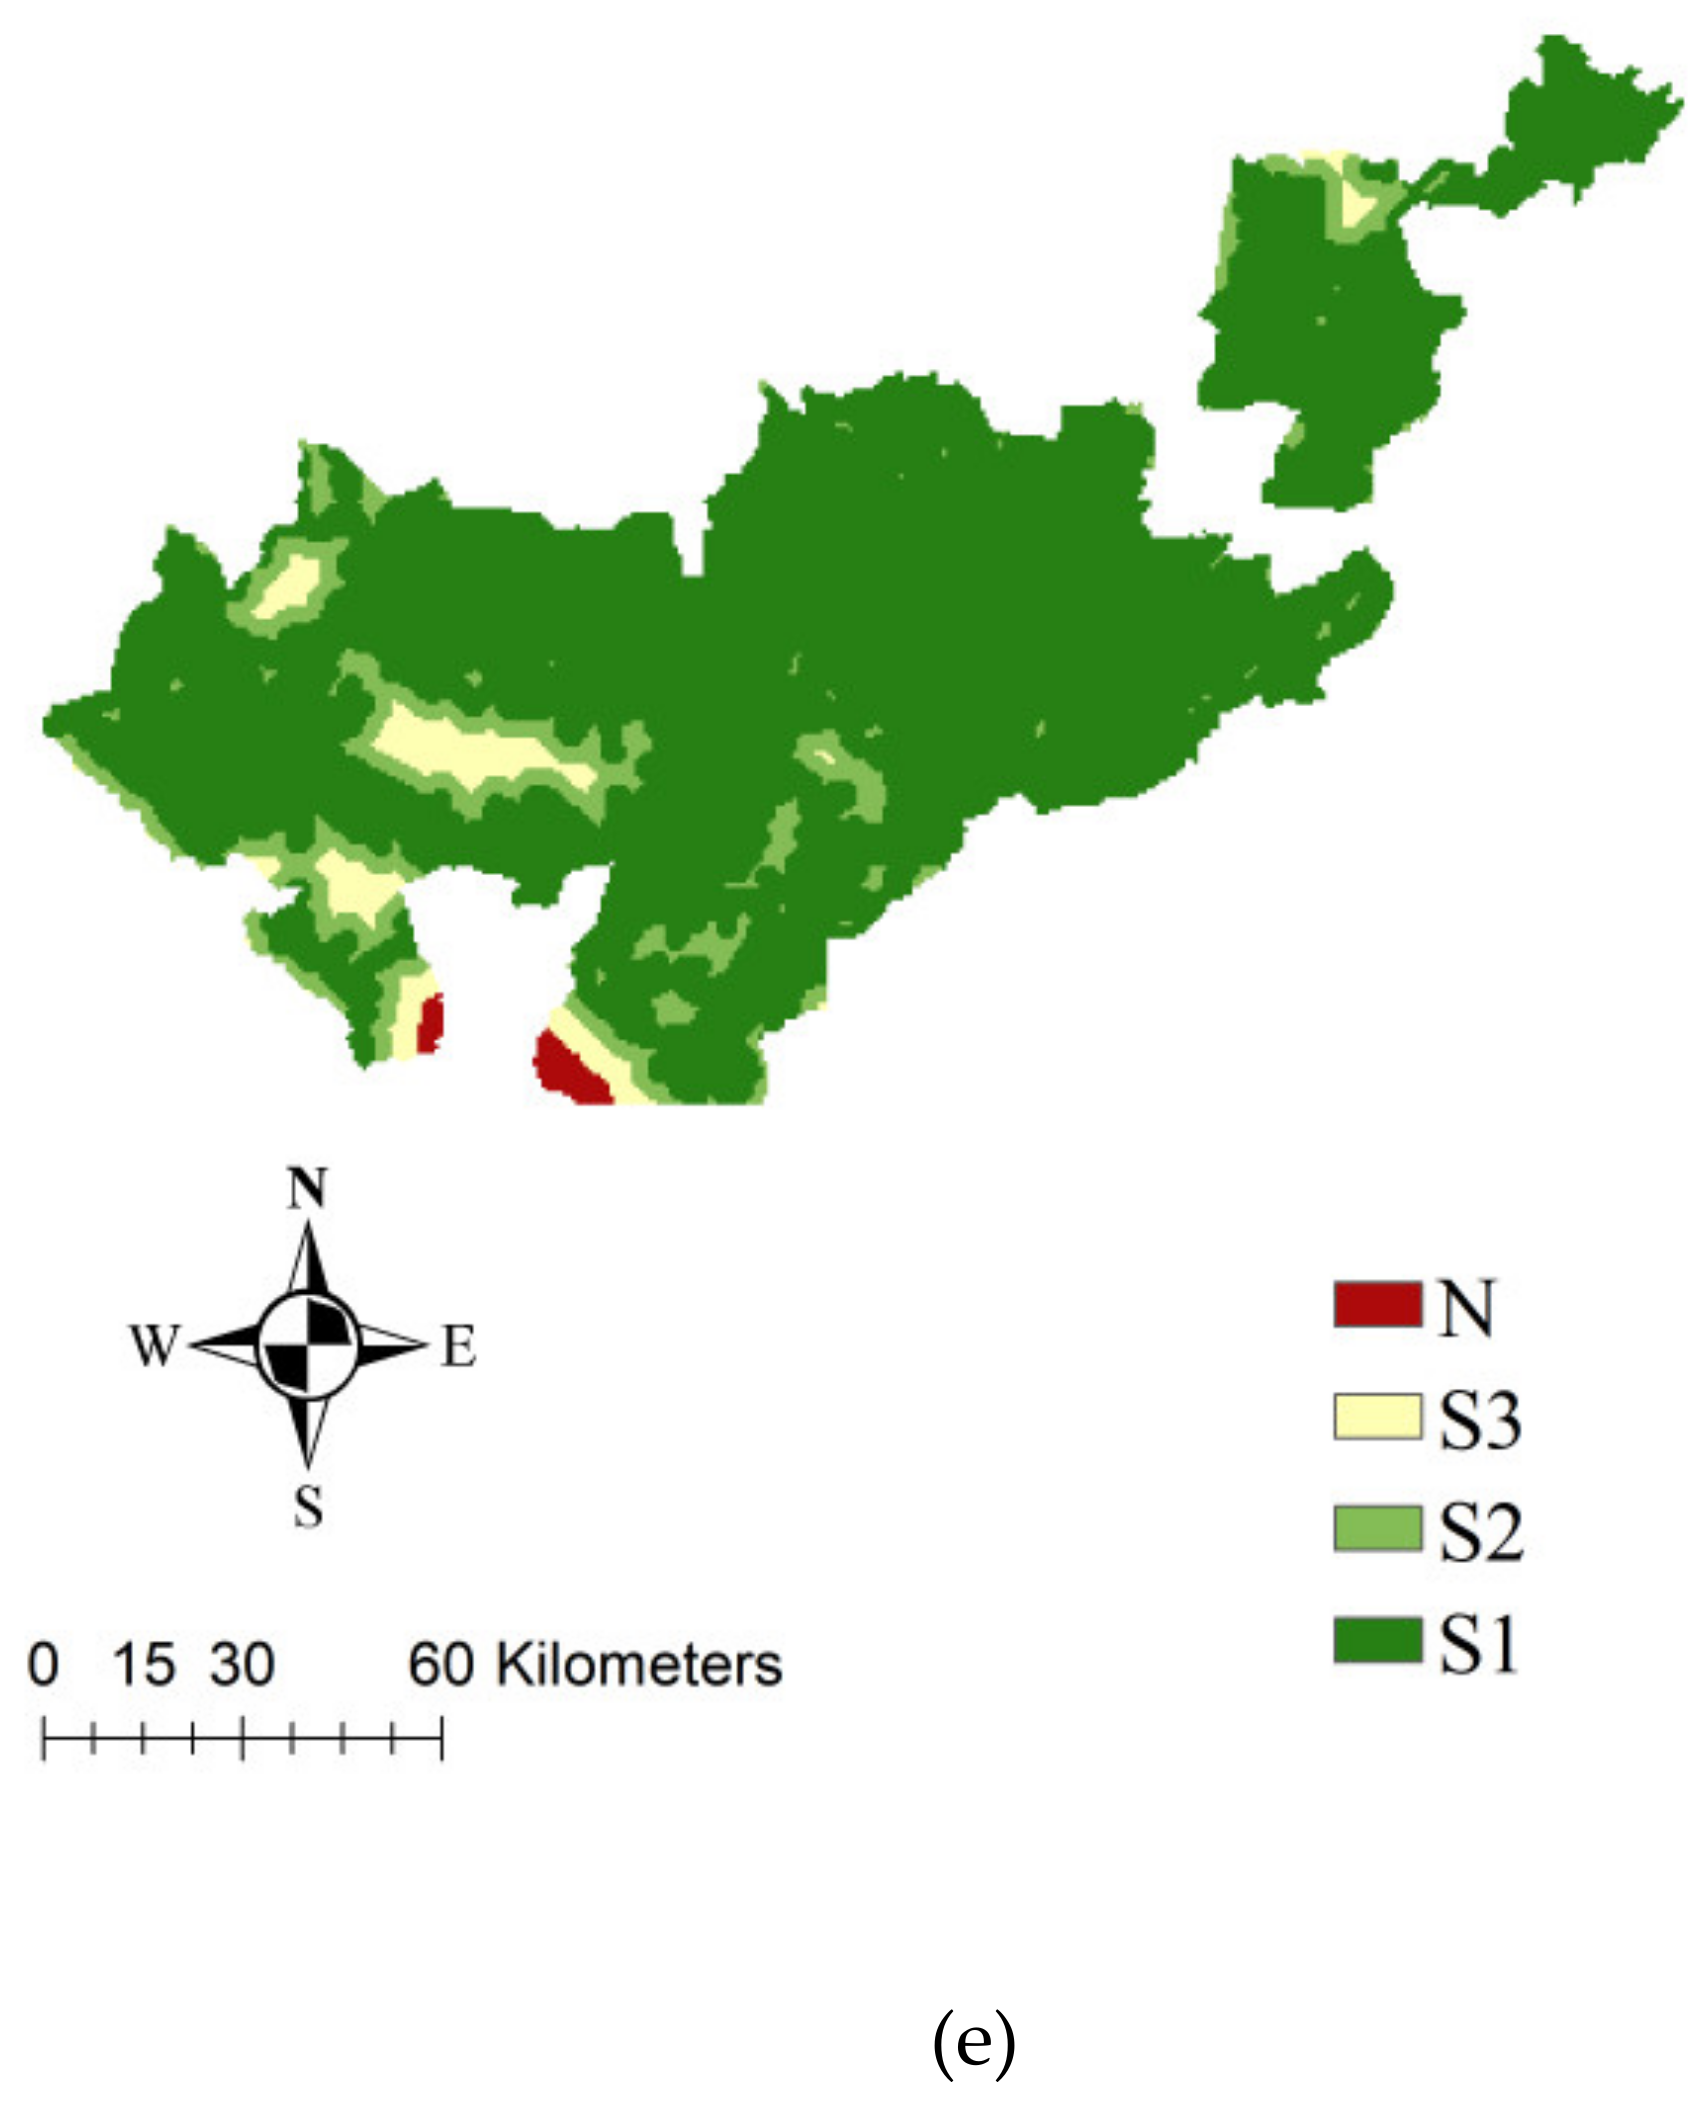
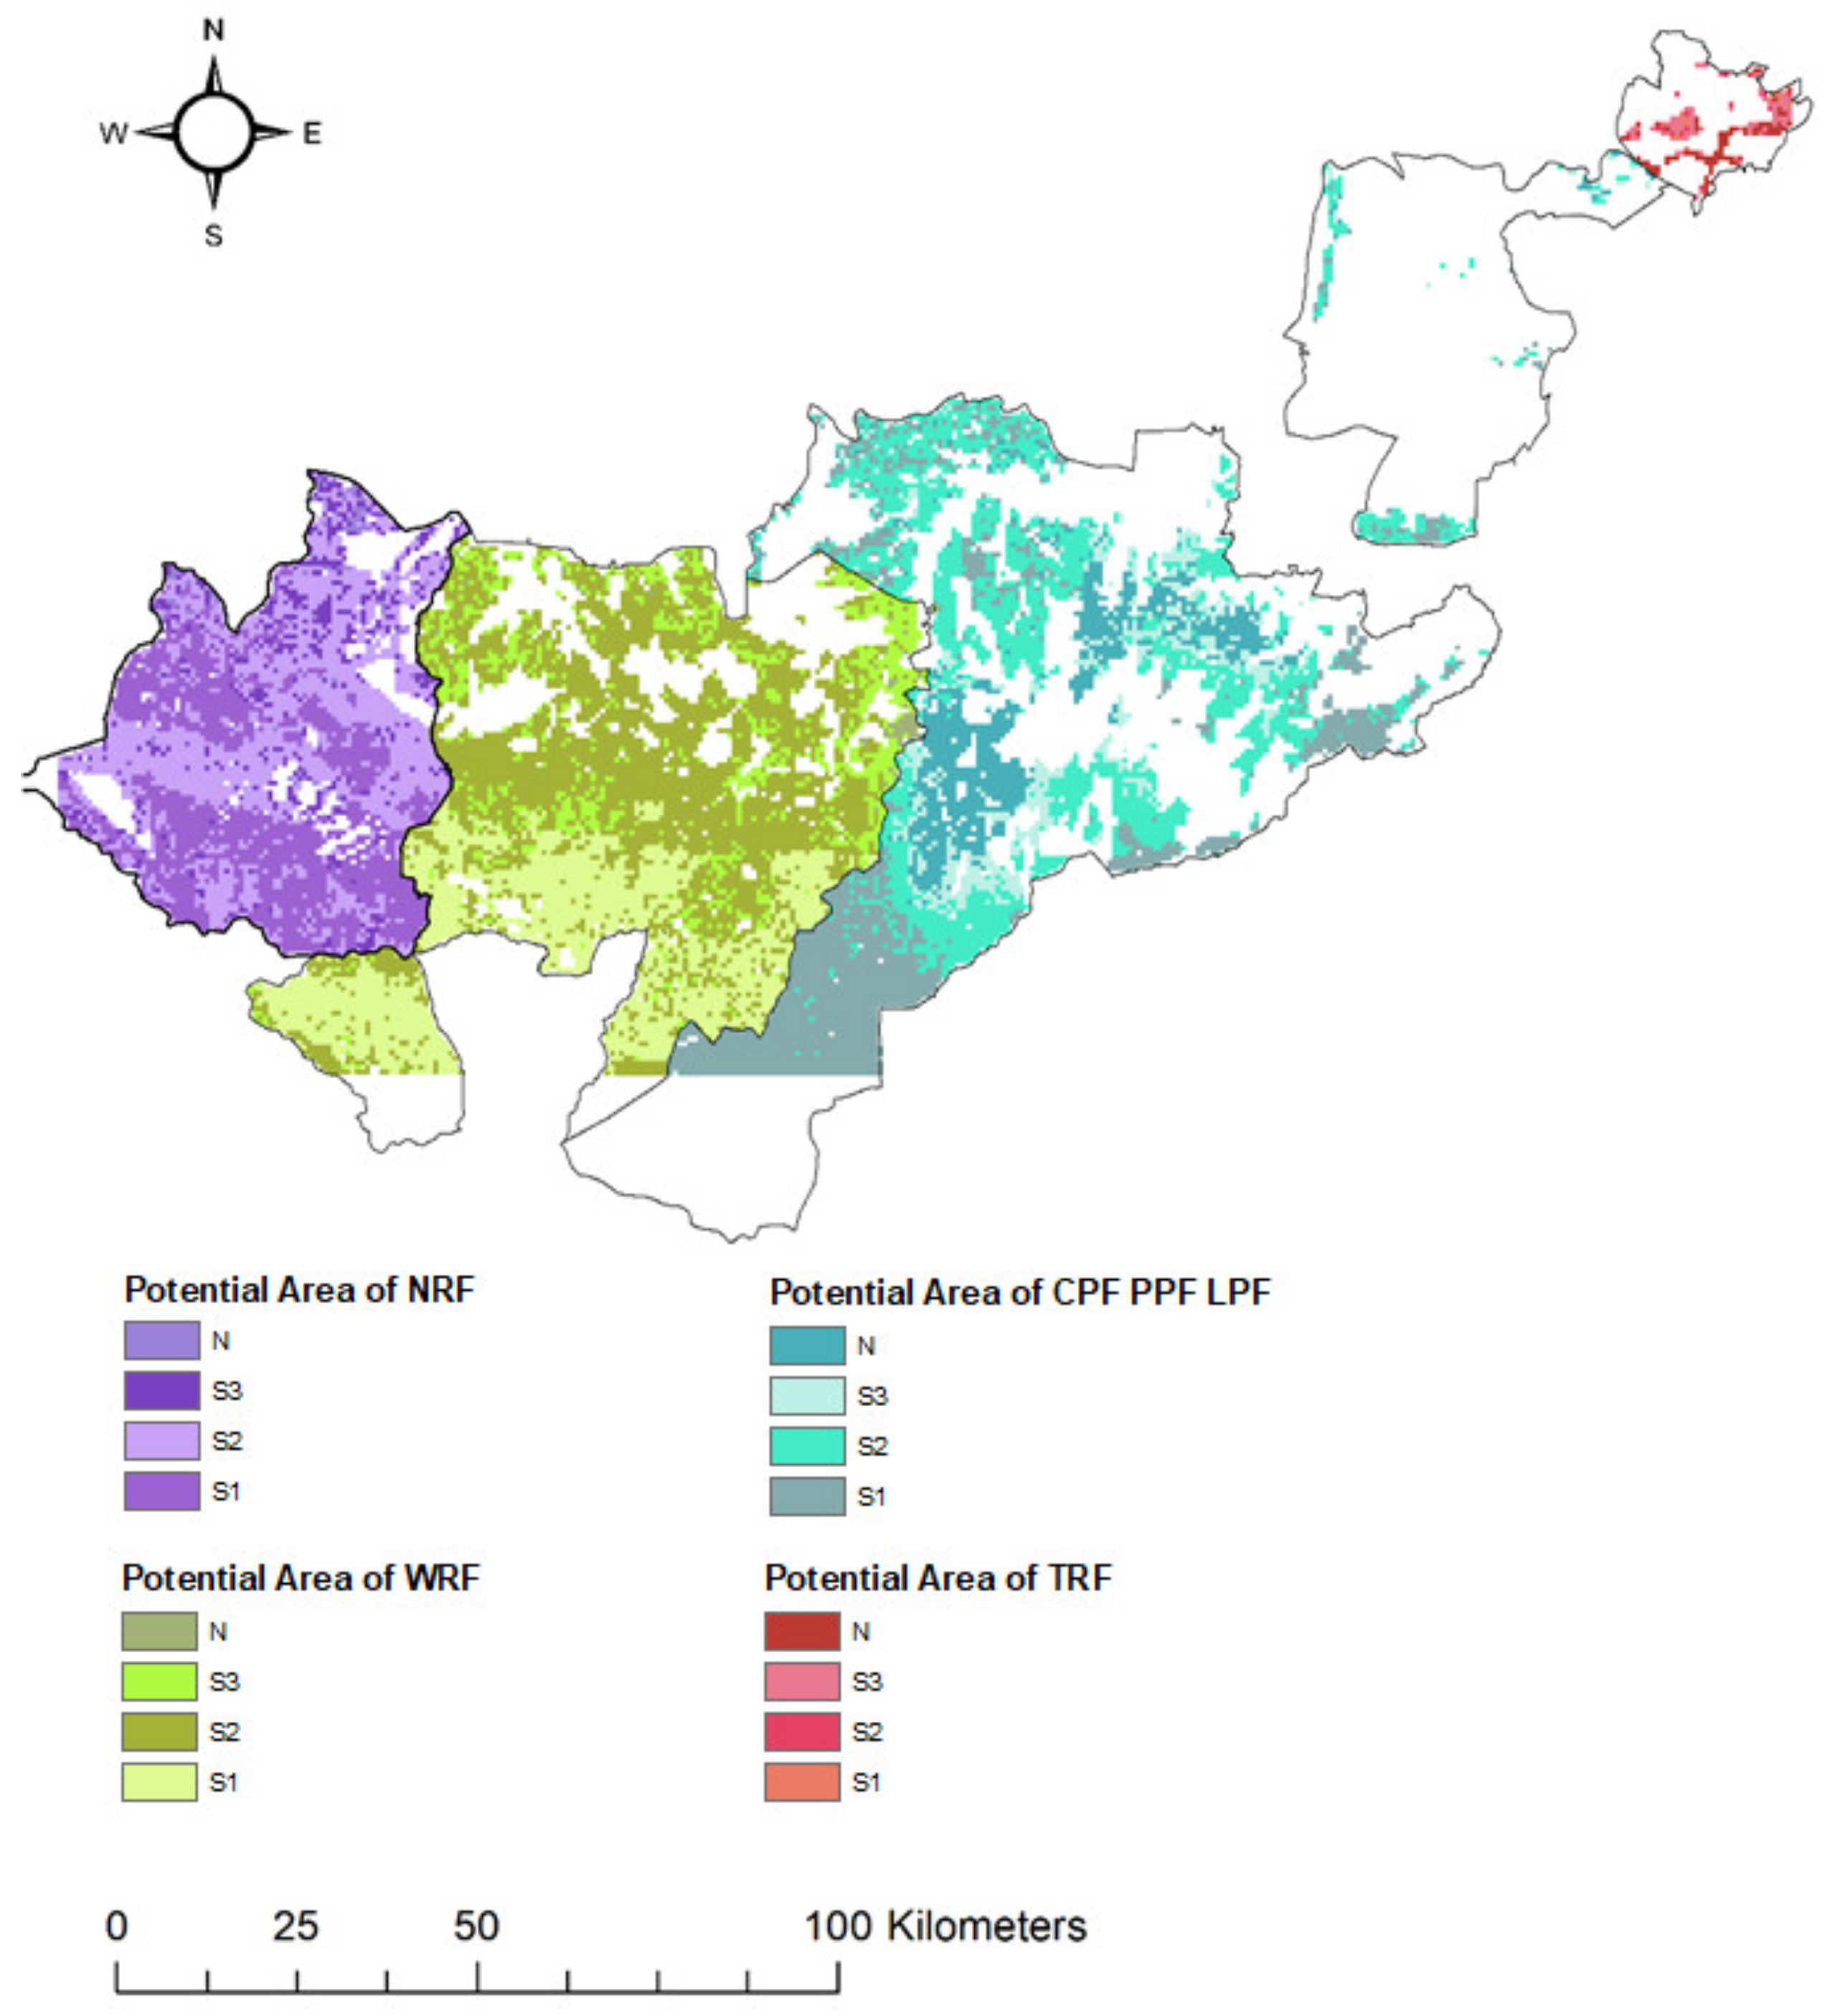
Change detection analysis was performed not only to detect changes that occurred in the forest but also to identify the potential areas for further extension of production forest. In the land suitability analysis, five criteria were used in the TRF, CPF, LPF, PPF, WRF and NRF zones to find out the potential areas for forest extension (Figure 8). In these types of forest zones, a highly suitable classification had the highest preferences followed by the moderately suitable classification. In the TRF, forest extension could possible in 7% and 8% of the limited areas belonging to the highly suitable class and moderately suitable class (Table 10). There were highly and moderately suitable classes in the CPF, LPF and PPF areas of 30% (81,663.91 ha) and 41% (112,191.20 ha), respectively. In the case of a WRF, there is the possibility of extension in 30% (98,133.18 ha) in highly suitable areas and 52% in areas (167,012.93 ha) in the moderately suitable class. The potential areas for an NRF forest zone was 39% (79,798.61 ha) in the highly suitable class and 48% of areas (99,498.03 ha) in the moderately suitable class (Table 10).
4. Discussion
South Sumatra is one of the most important provinces for conservation of biodiversity and forest resources in Indonesia. The stewardship and use of forest land must be managed for their biological diversity, productivity, regeneration capacity, vitality and potential to fulfil the current and future needs relevant to ecological, economic and social functions at the local, national and global levels [67]. Potential forests area extension strategies can be targeted with creating sustainable forestry market opportunities, such as oil palm plantations and agricultural lands [68,69,70]. In this research, CPF, PPF and LPF are referred to as community forestry [6]. Potential land can be set up for new forest generation to promote plantations that bring benefits to the environment and surrounding communities [70,71,72,73]. Protecting and restoring forests could provide the best decision with the local communities to get the benefit and restore the environmental and economic functions of the forests [74]. The challenges in achieving sustainable forest management and forest conservation need to develop with collaborative solutions between stakeholders and communities [75,76]. CPF, PPF and LPF entail forest production, providing support and opportunities for enhancing the economic benefits through wood and palm oil. In the demographic shift, TRF can play an important role in supporting efforts of urban forestry and urban landscapes to provide ecosystem and natural infrastructure [77,78] and NRF have an important role in maintaining and protecting the biodiversity of wildlife habitat and natural land [75,79]. The proposed potential areas can be extended by forest classifications to balance the deforestation with production forests, such as plantations. Therefore, the change detection analysis and periodic determination of potential forest extension areas could help to create a new policy space for plantation forests and ecosystems to be present in designing national and sub-national policies.
5. Conclusions
In this research, remotely sensed data were used to monitor the changes in the LULC and quantify the differences in the forest classes in the South Sumatra province of Indonesia from 2003 to 2018. In the LULC analysis, sic types of forest zones: CPF, PPF, LPF, WRF, TRF and NRF were focused upon to find out their changes and locate potential areas for extension of forest. In the change detection analysis, we have observed that the TRF, CPF and PPF forest zones had a decrease of their forest class by 20%, 13% and 40%, respectively, from 2003 to 2018. LPF regions had large changes and decreased by 72% in LULC for its forest class. Palm oil plantations had a significant impact on the LPF forest classification areas. For the extension of forest types that decreased over the time period, the AHP analysis incorporated selected criteria using weights from experts. The weights were used in the GIS analysis to propose the potential areas for extension. The influential criteria had higher weights and ranked as settlements, elevation, distance from roads and rivers. We found CPF, PPF and LPF had an opportunity of extension in the highly suitable classification (30%) and moderately suitable classification (41%) areas, in order to increase coverage of production forests. WRF had a forest potential area in the highly suitable classification of 30% and moderately suitable classification of 52% to keep biodiversity ecosystems for wildlife resources. The potential areas for NRF was 39% (79,798.61 ha) in the highly suitable class and 48% of areas (99,498.03 ha) in the moderately suitable class, to keep the natural ecosystem. TRFs had a very limited scope to propose a further extension and is required to be managed with collaboration between the government and the community.
Author Contributions
Conceptualization N.N. and T.A.; methodology, N.N.; software, N.N.; validation, N.N., T.A. and R.N.; formal analysis, N.N.; investigation, N.N.; resources, T.A.; writing—original draft preparation, N.N.; writing—review and editing, T.A.; visualization, R.N.; supervision, T.A. All authors have read and agreed to the published version of the manuscript.
Funding
This research received no external funding.
Acknowledgments
We would like to thank the University of Tsukuba for supporting this research to develop the Change Detection and Land Suitability Analysis for Extension of Potential Forest Areas in Indonesia Using Satellite Remote Sensing and GIS. We express our sincere thanks to the United States Geological Survey (USGS), Indonesia Geospatial Agency (BIG), Ministry of Environment and Forestry of Indonesia, South Sumatra Forestry Extension and National Resilience Institute of Republic of Indonesia. We also expressed our gratitude to Indonesian and international experts who participated in this research.
Conflicts of Interest
The authors declare no conflict of interest.
References
- World Bank. Sustaining Economic Growth, Rural Livelihoods, and Environmental Benefit: Strategic Options for Forest Assistance in Indonesia; World Bank Office: Jakarta, Indonesia, 2006. [Google Scholar]
- United Nations. Country Factsheet on Food and Agriculture Policy Trends; FAO: Jakarta, Indonesia, 2017; Volume 8, pp. 1–6. [Google Scholar]
- United Nations. The State of food and agriculture. Choice Rev. Online 2009, 3, 1–180. [Google Scholar]
- Ministry of Forestry 2015. Forest Production Map for Use Of Forest Utilization, Directorate General of Forestry Business Forestry Ministry of Forestry, 2015; Forest area and Conservation Area of South Sumatra Province, Forestry Data South Sumatra, 2015 (Peta Indikatif Arahan Pemanfaatan Hutan Pada Kawasan Hutan Produksi Yang Tidak Dibebani Izin Untuk Usaha Pemanfaatan Hasil Hutan Kayu. 2014. Lembar Peta, Sumatera Selatan, Indonesia. Available online: http://appgis.dephut.go.id/appgis/Arahan_Pemanfaatan_2015/Sumsel.pdf (accessed on 12 January 2019).
- Santika, T.; Meijaard, E.; Budiharta, S.; Law, E.A.; Kusworo, A.; Hutabarat, J.A.; Indrawan, T.P.; Struebig, M.J.; Raharjo, S.; Huda, I.; et al. Community forest management in Indonesia: Avoided deforestation in the context of anthropogenic and climate complexities. Glob. Environ. Chang. 2017, 46, 60–71. [Google Scholar] [CrossRef]
- Forest Area and Conservation Area Of South Sumatra Province, Forestry Data South Sumatra. 2016. Available online: http://data.dishut.sumselprov.go.id/layers/geonode:KawasanHutan_AR_2016_SumateraSelatan_PPH_250_ (accessed on 11 February 2019).
- Houghton, R.A. Releases of carbon to the atmosphere from degradation of forests in tropical Asia. Can. J. For. Res. 1991, 21, 132–142. [Google Scholar] [CrossRef]
- Yelwa, S.A. Land Cover Changes across Nigeria as Detected from high Temporal Resolution Meteorological Data. Maid. J. Arts Soc. Sci. 2005, 3, 73–79. [Google Scholar]
- Potter, C.; Genovese, V.; Gross, P.; Boriah, S.; Steinbach, M.; Kumar, V. Revealing land cover change in California with satellite data. Eos 2007, 88, 269–274. [Google Scholar] [CrossRef] [Green Version]
- Rogan, J.; Miller, J. Integrating GIS and Remotely Sensed Data for Mapping Forest Disturbance and Change. In Understanding Forest Disturbance and Spatial Pattern; Wulder, M.A., Franklin, S.E., Eds.; CRC Press: Boca Raton, FL, USA, 2006; pp. 133–171. [Google Scholar] [CrossRef]
- Mancino, G.; Nolè, A.; Ripullone, F.; Ferrara, A. Landsat TM imagery and NDVI differencing to detect vegetation change: Assessing natural forest expansion in Basilicata, southern Italy. iForest Biogeosci. For. 2014, 7, 75–84. [Google Scholar] [CrossRef] [Green Version]
- Rawat, J.S.; Kumar, M. Monitoring land user/cover change using remote sensing and GIS techniques: A case study of Hawalbagh block, district ALmora, Uttarakhand, India. Egypt. J. Rem. Sens. Space Sci. 2015, 18, 77–84. [Google Scholar]
- Mickelson, J.G.; Civco, D.L.; Silander, J.A. Delineating vegetation coverage canopy species in the northeastern United States using multi-temporal TM imagery. Photogramm. Eng. Remote Sens. 1998, 64, 891–904. [Google Scholar]
- Yuan, F.; Sawaya, K.E.; Loeffelholz, B.C.; Bauer, M.E. Land cover classification and change analysis of the Twin Cities (Minnesota) Metropolitan Area by multitemporal Landsat remote sensing. Remote Sens. Environ. 2005, 98, 317–328. [Google Scholar] [CrossRef]
- Li, Q.; Huang, J.; Wang, C.; Lin, H.; Zhang, J.; Jiang, J.; Wang, B. Land Development Suitability Evaluation of Pingtan Island Based on Scenario Analysis and Landscape Ecological Quality Evaluation. Sustainability 2017, 9, 1292. [Google Scholar] [CrossRef] [Green Version]
- Brown, M.E.; Pinzon, J.; Didan, K.; Morisette, J.; Tucker, C. Evaluation of the consistency of long-term NDVI time series derived from AVHRR, SPOT-vegetation, SeaWiFS, MODIS, and Landsat ETM+ sensors. IEEE Trans. Geosci. Remote Sens. 2006, 44, 1787–1793. [Google Scholar] [CrossRef]
- Tarantino, E.; Novelli, A.; Aquilino, M.; Figorito, B.; Fratino, U. Comparing the MLC and JavaNNS Approaches in Classifying Multi-Temporal LANDSAT Satellite Imagery over an Ephemeral River Area. Int. J. Agric. Environ. Inf. Syst. 2015, 6, 83–102. [Google Scholar] [CrossRef]
- Foody, G.M. Status of land cover classification accuracy assessment. Remote Sens. Environ. 2002, 80, 185–201. [Google Scholar] [CrossRef]
- Diallo, Y.; Hu, G.; Wen, X. Applications of remote sensing in land use/land cover change detection in Puer and Simao Counties, Yunnan Province. J. Am. Sci. 2009, 5, 157–166. [Google Scholar]
- Hegazy, I.R.; Kaloop, M.R. Monitoring urban growth and land use change detection with GIS and remote sensing techniques in Daqahlia governorate Egypt. Int. J. Sustain. Built. Environ. 2015, 4, 117–124. [Google Scholar] [CrossRef] [Green Version]
- Brown, D.; Pijanowski, B.; Duh, J. Modeling the relationships between land use and land cover on private lands in the Upper Midwest, USA. J. Environ. Manag. 2000, 59, 247–263. [Google Scholar] [CrossRef] [Green Version]
- Sawathvong, S. Experiences from developing an integrated land-use planning approach for protected areas in the Lao PDR. For. Policy Econ. 2004, 6, 553–566. [Google Scholar] [CrossRef]
- Chen, H.; Kocaoglu, D.F. A sensitivity analysis algorithm for hierarchical decision models. Eur. J. Oper. Res. 2008, 185, 266–288. [Google Scholar] [CrossRef]
- Escobar, M.; Moreno-Jiménez, J.M. Reciprocal distributions in the analytic hierarchy process. Eur. J. Oper. Res. 2000, 123, 154–174. [Google Scholar] [CrossRef]
- Huang, Y.-F. Enhancement on sensitivity analysis of priority in analytic hierarchy process. Int. J. Gen. Syst. 2002, 31, 531–542. [Google Scholar] [CrossRef]
- Badamasi, M.M.; Yelwa, S.A. Change detection and classification of land cover at Falgore game reserve: A Preliminary assessment. BEST J. 2010, 7, 75–83. [Google Scholar]
- Stehman, S.V.; Czaplewski, R.L. Design and Analysis for Thematic Map Accuracy Assessment. Remote Sens. Environ. 1998, 64, 331–344. [Google Scholar] [CrossRef]
- Liu, X.-H.; Skidmore, A.; Van Oosten, H. Integration of classification methods for improvement of land-cover map accuracy. ISPRS J. Photogramm. Remote Sens. 2002, 56, 257–268. [Google Scholar] [CrossRef]
- Currit, N. Development of a remotely sensed, historical land-cover change database for rural Chihuahua, Mexico. Int. J. Appl. Earth Obs. Geoinform. 2005, 7, 232–247. [Google Scholar] [CrossRef]
- Bailly, J.-S.; Arnaud, M.; Puech, C. Boosting: A classification method for remote sensing. Int. J. Remote Sens. 2007, 28, 1687–1710. [Google Scholar] [CrossRef]
- Campbell, J.B. Introduction to remote sensing. Geocarto Int. 1987, 2, 64. [Google Scholar] [CrossRef]
- Wright, J.; Lillesand, T.M.; Kiefer, R.W. Remote Sensing and Image Interpretation. Geogr. J. 1980, 146, 448. [Google Scholar] [CrossRef]
- Olmo, M.C.; Abarca-Hernández, F. Computing geostatistical image texture for remotely sensed data classification. Comput. Geosci. 2000, 26, 373–383. [Google Scholar] [CrossRef] [Green Version]
- Jensen, J.R. Remote Sensing of the Environment, 2nd ed.; Pearson Prentice Hall: Upper Saddle River, NJ, USA, 2007; p. 17. [Google Scholar]
- Gao, J.; Liu, Y.-S. Determination of land degradation causes in Tongyu County, Northeast China via land cover change detection. Int. J. Appl. Earth Obs. Geoinform. 2010, 12, 9–16. [Google Scholar] [CrossRef]
- Teodoro, A.C.; Araújo, R. Comparison of performance of object-based image analysis techniques available in open source software (Spring and Orfeo Toolbox/Monteverdi) considering very high spatial resolution data. J. Appl. Remote Sens. 2016, 10, 16011. [Google Scholar] [CrossRef]
- Thomlinson, J.R.; Bolstad, P.V.; Cohen, W.B. Coordinating methodologies for scaling land cover classifications from site-specific to global: Steps toward validating global map products. Remote Sens. Environ. 1999, 70, 16–28. [Google Scholar] [CrossRef]
- Congalton, R. A review of assessing the accuracy of classifications of remotely sensed data. Remote Sens. Environ. 1991, 37, 35–46. [Google Scholar] [CrossRef]
- Strand, G.H. Settlement Planning with GIS. A Case Study of Thmarpouk, Cambodia. Habitat Int. J. 1993, 17, 75–85. [Google Scholar] [CrossRef]
- Chaudhary, B.S.; Saroha, G.P.; Yadav, M. Human Induced Land Use Land Cover Changes in Northern Part of Gurgaon District, Haryana, India: Natural Resources Census Concept. J. Hum. Ecol. 2008, 23, 243–252. [Google Scholar] [CrossRef]
- Nayak, P.; Oliveira, L.E.; Berkes, F. Resource degradation, marginalization, and poverty in small-scale fisheries: Threats to social-ecological resilience in India and Brazil. Ecol. Soc. 2014, 19, 73. [Google Scholar] [CrossRef] [Green Version]
- Gradstein, R.S.; Homeier, J.; Gansert, D. (Eds.) Tropical Mountain Forest: Patterns and Processes in a Biodiversity Hotspot; University of Akron Press: Akron, OH, USA, 2010; p. 224. [Google Scholar]
- Spracklen, D.V.; Righelato, R. Tropical montane forests are a larger than expected global carbon store. Biogeosciences 2014, 11, 2741–2754. [Google Scholar] [CrossRef] [Green Version]
- Holdridge, L.R.; Hubbert, M.K. Determination of World Plant Formations from Simple Climatic Data. Science 1947, 105, 367–368. [Google Scholar] [CrossRef]
- Major, J. A Climatic Index to Vascular Plant Activity. Ecology 1963, 44, 485–498. [Google Scholar] [CrossRef]
- Churkina, G.; Running, S.W. Contrasting Climatic Controls on the Estimated Productivity of Global Terrestrial Biomes. Ecosystems 1998, 1, 206–215. [Google Scholar] [CrossRef]
- Law, B.E.; Falge, E.; Gu, L.; Baldocchi, D.D.; Bakwin, P.; Berbigier, P.; Davis, K.; Dolman, H.; Falk, M.; Fuentes, J.; et al. Environmental controls over carbon dioxide and water vapor exchange of terrestrial vegetation. Agric. For. Meteorol. 2002, 113, 97–120. [Google Scholar] [CrossRef] [Green Version]
- Schuur, E.A. Productivity and global climate revisited: The sensitivity of tropical forest growth to precipitation. Ecology 2003, 84, 1165–1170. [Google Scholar] [CrossRef]
- Berner, L.T.; Law, B.E. Water limitations on forest carbon cycling and conifer traits along a steep climatic gradient in the Cascade Mountains, Oregon. Biogeosciences 2015, 12, 6617–6635. [Google Scholar] [CrossRef] [Green Version]
- Johnson, J.B.; Omland, K.S. Model selection in ecology and evolution. Trends Ecol. Evol. 2004, 19, 101–108. [Google Scholar] [CrossRef]
- Kirchmair, I. Biogeography of West African Gallery Forests. Ph.D. Thesis, Johann Wolfgang Goethe-Universität, Frankfurt, Germany, 29 September 2017. Available online: http://publikationen.ub.uni-frankfurt.de/frontdoor/index/index/docId/44536 (accessed on 22 March 2019).
- Datry, T.; Larned, S.T.; Tockner, K. Intermittent Rivers: A Challenge for Freshwater Ecology. Bioscience 2014, 64, 229–235. [Google Scholar] [CrossRef] [Green Version]
- Demissie, F.; Yeshitila, K.; Kindu, M.; Schneider, T. Land use/Land cover changes and their causes in Libokemkem District of South Gonder, Ethiopia. Remote Sens. Appl. Soc. Environ. 2017, 8, 224–230. [Google Scholar] [CrossRef]
- Gigovic, L.; Drobnjak, S.; Pamučar, D. The Application of the Hybrid GIS Spatial Multi-Criteria Decision Analysis Best–Worst Methodology for Landslide Susceptibility Mapping. ISPRS Int. J. Geo-Inform. 2019, 8, 79. [Google Scholar] [CrossRef] [Green Version]
- Nigussie, G.; Moges, M.A.; Moges, M.M.; Steenhuis, T.S. Assessment of Suitable Land for Surface Irrigation in Ungauged Catchments: Blue Nile Basin, Ethiopia. Water 2019, 11, 1–17. [Google Scholar] [CrossRef] [Green Version]
- Saaty, T.L. The Analytical Hierarchy Process; McGraw-Hill: New York, NY, USA, 1980; p. 350. [Google Scholar]
- Saaty, T.L. How to make a decision. The analytic hierarchy process. Eur. J. Oper. Res. 1990, 48, 9–26. [Google Scholar] [CrossRef]
- Mendoza, G.A.; Sprouse, W. Forest planning and decision making under fuzzy environments: An overview and illustrations. Forest Sci. 1989, 35, 481–502. [Google Scholar]
- Kangas, J. A method for utility comparison of forest drainage alternatives. Suo 1991, 42, 49–59. [Google Scholar]
- Kangas, J. Choosing the regeneration chain in a forest stand: A decision model based on multi-attribute utility theory. University of Joensuu. Publ. Sci. 1992, 24, 1–230. [Google Scholar]
- Schmoldt, D.L.; Peterson, D.L.; Silsbee, D.G. Developing inventory and monitoring programs based on multiple objectives. Environ. Manag. 1994, 28, 707–727. [Google Scholar] [CrossRef]
- Tarp, P.; Helles, F. Multi-criteria decision making in forest management planning—An overview. J. Forest Econ. 1995, 1, 273–306. [Google Scholar]
- Saaty, T. A scaling method for priorities in hierarchical structures. J. Math. Psychol. 1977, 15, 234–281. [Google Scholar] [CrossRef]
- Saaty, T.; Ozdemir, M. Why the magic number seven plus or minus two. Math. Comput. Model. 2003, 38, 233–244. [Google Scholar] [CrossRef]
- Wedley, W.C. Consistency prediction for incomplete AHP matrices. Math. Comput. Model. 1993, 17, 151–161. [Google Scholar] [CrossRef]
- Lakiãeviã, M.; Srðeviã, B. AHP group decision-making in selecting tree species for urban wet sites. Contemp. Agric. 2012, 61, 8–14. [Google Scholar]
- FAO (2000b). Asia-Pacific Forestry Commission: Development of national-level criteria and indicators for the sustainable management of dry forests of Asia. Workshop Report, RAP Publication 2000/07, Food and Agriculture Organization. Available online: http://www.fao.org/3/x6896e/x6896e00.htm (accessed on 5 February 2019).
- Fitzherbert, E.; Struebig, M.J.; Morel, A.; Danielsen, F.; Brühl, C.; Donald, P.; Phalan, B. How will oil palm expansion affect biodiversity? Trends Ecol. Evol. 2008, 23, 538–545. [Google Scholar] [CrossRef]
- Lawson, S. Consumer Goods and Deforestation: An Analysis of the Extent and Nature of Illegality in Forest Conversion for Agriculture and Timber Plantations; Forest Trends: Washington, DC, USA, 2014; pp. 1–158. Available online: http://www.forest-trends.org/documents/files/doc_4718.pdf (accessed on 11 February 2019).
- Martin, R.M.; Kneeland, D.; Brooks, D.; Matta, R. The State of the World’s Forests in Brief. Forests and Agriculture: Land-use Challenges and Opportunities; FAO: Rome, Italy, 2016; p. 46. ISBN 978-92-5-107292-9. [Google Scholar]
- Cossalter, C.; Pye-Smith, C. Fast-Wood Forestry: Myths and Realities; CIFOR: Bogor, Indonesia, 2003. [Google Scholar]
- Kanowski, J.; Catterall, C.P.; Wardell-Johnson, G. Consequences of broadscale timber plantations for biodiversity in cleared rainforest landscapes of tropical and subtropical Australia. For. Ecol. Manag. 2005, 208, 359–372. [Google Scholar] [CrossRef] [Green Version]
- Weber, N. Afforestation in Europe: Lessons learned, challenges remaining. In Restoration of Boreal and Temperate Forests; CRC Press: Boca Raton, FL, USA, 2005; pp. 121–135. [Google Scholar]
- Sanchirico, J.N.; Siikamaki, J. Natural resource economics and policy in the 21st Century: Conservation of ecosystem services. Resources 2007, 165, 8–10. [Google Scholar]
- Sheil, D.; Puri, R.; Basuki, I.; Van Heist, M.; Wan, M.; Liswanti, N.; Rukmiyati; Sardjono, M.A.; Samsoedin, I.; Sidiyasa, K.; et al. Exploring Biological Diversity, Environment and Local Peoples Perspectives in Forest Landscapes, 2nd ed.; CIFOR: Bogor, Indonesia, 2002. [Google Scholar]
- Gunningham, N. The New Collaborative Environmental Governance: The Localization of Regulation. J. Law Soc. 2009, 36, 145–166. [Google Scholar] [CrossRef]
- Costanza, R.; D’arge, R.; Groot, R.E.; Stephen, F.; Grasso, M.; Hannon, B.; Limburg, K.; Naeem, S.; O’Neill, R.V.; Paruelo, J.; et al. Natural capital. Nature 1997, 387, 253–260. [Google Scholar] [CrossRef]
- Landell-Mills, N. Developing markets for forest environmental services: An opportunity for promoting equity while securing efficiency? Philos. Trans. Ser. 2002, 360, 1817–1825. [Google Scholar] [CrossRef] [PubMed]
- Balmford, A.; Bruner, A.; Cooper, P.; Costanza, R.; Farber, S.; Green, R.E.; Jenkins, M.; Jefferiss, P.; Jessamy, V.; Madden, J.; et al. Ecology: Economic reasons for conserving wild nature. Science 2002, 297, 950–953. [Google Scholar] [CrossRef] [PubMed] [Green Version]
Figure 1.
Geographical extent and forest zones in the South Sumatra province of Indonesia. (a) Indonesia, (b) South Sumatra and (c) the forest zones: Tourism Recreation Forest (TRF), Convertible Protection Forest (CPF), Permanent Production Forest (PPF), Limited Production Forest (LPF), Wildlife Reserve Forest (WRF) and Nature Reserve Forest (NRF).

Figure 2.
Research framework for land suitability analysis to propose the extension of potential forest area. (a) Land use and land cover for change detection analysis from Landsat 7 and Landsat 8 OLI datasets; (b) Analytical Hierarchy Process (AHP) to integrate the expert opinion’s weight in the suitability analysis; and (c) the land suitability analysis.

Figure 3.
Criteria for the land suitability analysis for extension of potential forest areas. (a) Settlements, (b) LULC, (c) elevation, (d) distance from rivers and (e) distance from roads.
Figure 3.
Criteria for the land suitability analysis for extension of potential forest areas. (a) Settlements, (b) LULC, (c) elevation, (d) distance from rivers and (e) distance from roads.


Figure 4.
LULC for each type of forest: (a) TRF; (b) CPF, PPF and LPF; (c) WRF; and (d) NRF.

Figure 5.
The AHP framework to incorporate expert opinion into the land suitability analysis for extension of potential forest areas.
Figure 5.
The AHP framework to incorporate expert opinion into the land suitability analysis for extension of potential forest areas.

Figure 6.
Change detection in the LULC for classified forest areas in South Sumatra. (a) LULC, 2003; and (b) LULC, 2018.
Figure 6.
Change detection in the LULC for classified forest areas in South Sumatra. (a) LULC, 2003; and (b) LULC, 2018.

Figure 7.
Reclassification of the criteria for the land suitability analysis to propose extension of potential forest areas. (a) Settlements, (b) LULC, (c) elevation, (d) distance from rivers, and (e) distance from roads.
Figure 7.
Reclassification of the criteria for the land suitability analysis to propose extension of potential forest areas. (a) Settlements, (b) LULC, (c) elevation, (d) distance from rivers, and (e) distance from roads.


Figure 8.
Land suitability analysis for the extension of potential areas in NRF, CPF, LPF, PPF, WRF and TRF forest zones.
Figure 8.
Land suitability analysis for the extension of potential areas in NRF, CPF, LPF, PPF, WRF and TRF forest zones.


Table 1.
Satellite and GIS datasets for land suitability analysis for extension of potential forest areas.
Table 1.
Satellite and GIS datasets for land suitability analysis for extension of potential forest areas.
| No | Data and Map | Description | Source |
|---|---|---|---|
| 1 | LULC | Extracted from 30 m resolution | 2018, Landsat 8 OLI, Landsat 7 ETM+ |
| 2 | River | Scale 1:25.000 | 2005, Indonesia Geospatial Agency |
| 3 | Road | Scale 1:25.000 | 2005, Indonesia Geospatial Agency |
| 4 | Elevation | Extracted 90 m from Data Elevation Model National SRTM | 2015, USGS |
| 5 | Settlements | Extracted from 30 m resolution | 2018, Landsat 8 |
Table 2.
Selected features for supervised classification in Land Use/Land Cover (LULC) analysis.
| Class Name | Description |
|---|---|
| Urban | Areas designated as urban zone |
| Waterbodies | River, lakes, waterlogged and swamp areas |
| Vegetation | Areas covered by trees, both agriculture and planted |
| Forest | Areas covered by forest |
Table 3.
Criteria of the land suitability analysis for the extension of forest areas.
| Criteria | Suitability Class | Sub-criteria | Reference |
|---|---|---|---|
| Settlements | S1 | <214 | [52] |
| S2 | 264–365 | [52] | |
| S3 | 365–414 | [52] | |
| N | >414 | [52] | |
| LULC | S1 | Forest | [53] |
| S2 | Vegetation | [53] | |
| S3 | Urban | [53] | |
| N | Waterbodies | [53] | |
| Elevation | S1 | <350 m | [15] |
| S2 | 350–900 m | [15] | |
| S3 | 900–1600 m | [15] | |
| N | >1600 m | [15] | |
| Distance from roads | S1 | <10 m | [54] |
| S2 | 10–23 m | [54] | |
| S3 | 23–45 m | [54] | |
| N | >45 m | [54] | |
| Distance from rivers | S1 | <6 m | [55] |
| S2 | 6–13 m | [55] | |
| S3 | 13–21 m | [55] | |
| N | > 29 m | [55] |
Table 4.
Reclassification of the criteria of land suitability for forest extension areas.
| Criteria | Suitability Class | Suitability Range | Percentage Area (%) | Area (Ha) |
|---|---|---|---|---|
| Settlements | S1 | <214 | 57.47 | 1310 |
| S2 | 264–365 | 23.48 | 535 | |
| S3 | 365–414 | 13.72 | 313 | |
| N | >414 | 5.33 | 121 | |
| LULC | S1 | Forest | 57.6 | 790,712 |
| S2 | Vegetation | 24.2 | 333,020 | |
| S3 | Urban | 13.2 | 180,615 | |
| N | Waterbodies | 5 | 68,806 | |
| Elevation | S1 | <350 | 53.28 | 495,989 |
| S2 | 350–900 | 25.56 | 237,940 | |
| S3 | 900–1600 | 15.82 | 147,314 | |
| N | >1600 | 5.34 | 49,681 | |
| Distance from roads | S1 | <10 | 85.77 | 1,163,759 |
| S2 | 10–23 | 9.77 | 132,494 | |
| S3 | 23–45 | 3.73 | 50,577 | |
| N | >45 | 0.74 | 9985 | |
| Distance from rivers | S1 | <6 | 97.96 | 1,339,701 |
| S2 | 6–13 | 1.38 | 18,856 | |
| S3 | 13–21 | 0.44 | 6032 | |
| N | >29 | 0.22 | 2994 |
Table 5.
Saaty scale for pairwise comparison between the criteria in the AHP.
| Index | Definition | Index | Definition |
|---|---|---|---|
| 1 | Equally important | 1/1 | Equally important |
| 2 | Equally or slightly more important | 1/2 | Equally or slightly less important |
| 3 | Slightly more important | 1/3 | Slightly less important |
| 4 | Slightly to much more important | 1/4 | Slightly to way less important |
| 5 | Much more important | 1/5 | Way less important |
| 6 | Much to far more important | 1/6 | Way to far less important |
| 7 | Far more important | 1/7 | Far less important |
| 8 | Far more important to extremely more important | 1/8 | Far less important to extremely less important |
| 9 | Extremely more important | 1/9 | Extremely less important |
Table 6.
Random indices in the AHP.
| n | 3 | 4 | 5 | 6 | 7 | 8 | 9 | 10 |
|---|---|---|---|---|---|---|---|---|
| RI | 0.58 | 0.9 | 1.12 | 1.24 | 1.32 | 1.41 | 1.45 | 1.49 |
Table 7.
Change detection of forest classes from 2003 until 2018.
| Forest Zone | Changing Area (Urban Class) | Changing Area (Vegetation Class) | Changing Area (Forest Class) | Changing Area (Waterbody Class) | ||||
|---|---|---|---|---|---|---|---|---|
| (%) | (ha) | (%) | (ha) | (%) | (ha) | (%) | (ha) | |
| TRF | 37.03 | 14.78 | −21.47 | −8.61 | −20.09 | −8.06 | -- | -- |
| NRF | −19.78 | −55.22 | -- | -- | 33.05 | 92.26 | −0.99 | −2.75 |
| WRF | 3 | 29.56 | -- | -- | 33.44 | 329.7 | −6.2 | −61.15 |
| CPF | 4.56 | 372.16 | 10.09 | 823.49 | −13.56 | −1105.72 | −1.09 | −88.66 |
| PPF | 9.52 | 163.72 | 31.16 | 535.7 | −40.21 | −691.12 | -- | -- |
| LPF | 48.75 | 1514.34 | 23.63 | 733.92 | −72 | −2236.62 | −0.37 | −11.65 |
Table 8.
Accuracy assessments for LULC in 2003 and 2018.
| Accuracy Assessment | Class | TRF | CPF, PPF and LPF | WRF | NRF | ||||
|---|---|---|---|---|---|---|---|---|---|
| (%) | (%) | (%) | (%) | ||||||
| 2003 | 2018 | 2003 | 2018 | 2003 | 2018 | 2003 | 2018 | ||
| Producers Accuracy | Urban | 96 | 90 | 92 | 92 | 88 | 94 | 92 | 86 |
| Vegetation | 90 | 96 | 88 | 100 | 94 | 96 | 86 | 86 | |
| Forest | 92 | 96 | 92 | 90 | 96 | 94 | 96 | 96 | |
| Waterbody | 92 | 80 | 88 | 84 | 96 | 96 | 96 | 90 | |
| User Accuracy | Urban | 96 | 82 | 92 | 85 | 100 | 98 | 90 | 86 |
| Vegetation | 90 | 96 | 88 | 85 | 87 | 87 | 91 | 86 | |
| Forest | 92 | 100 | 92 | 100 | 89 | 96 | 96 | 96 | |
| Waterbody | 92 | 85 | 88 | 100 | 100 | 100 | 92 | 90 | |
| Overall Accuracy | 93 | 91 | 90 | 92 | 94 | 95 | 93 | 90 | |
| Kappa Coefficient | 0.84 | 0.79 | 0.80 | 0.82 | 0.86 | 0.89 | 0.83 | 0.78 | |
Table 9.
Expert opinion weights for prioritizing the criteria in AHP.
| Criteria | Expert A | Expert B | Expert C | Expert D | Expert E | Average Weight | Weight (%) |
|---|---|---|---|---|---|---|---|
| Settlements | 0.190 | 0.354 | 0.160 | 0.245 | 0.102 | 0.210 | 29 |
| LULC | 0.214 | 0.222 | 0.102 | 0.143 | 0.379 | 0.212 | 29 |
| Elevation | 0.086 | 0.066 | 0.379 | 0.119 | 0.160 | 0.162 | 23 |
| Distance from roads | 0.092 | 0.097 | 0.065 | 0.100 | 0.065 | 0.084 | 12 |
| Distance from rivers | 0.074 | 0.049 | 0.043 | 0.033 | 0.043 | 0.048 | 7 |
Table 10.
Land suitability analysis for extension of potential forest areas in the forest zones.
| Land Suitability Classes | TRF | CPF, PPF and LPF | WRF | NRF | ||||
|---|---|---|---|---|---|---|---|---|
| (%) | (ha) | (%) | (ha) | (%) | (ha) | (%) | (ha) | |
| N | 45 | 3730.61 | 16 | 44,994.77 | 1 | 2638.72 | 2 | 4913.48 |
| S3 | 40 | 3275.66 | 13 | 37,215.08 | 17 | 54,503.27 | 11 | 22,793.10 |
| S2 | 8 | 682.43 | 41 | 112,191.20 | 52 | 167,012.93 | 48 | 99,498.03 |
| S1 | 7 | 591.44 | 30 | 81,663.91 | 30 | 98,133.18 | 39 | 79,798.61 |
| Total | 100 | 8280.13 | 100 | 276,064.96 | 100 | 322,288.09 | 100 | 207,003.22 |
© 2020 by the authors. Licensee MDPI, Basel, Switzerland. This article is an open access article distributed under the terms and conditions of the Creative Commons Attribution (CC BY) license (http://creativecommons.org/licenses/by/4.0/).
Share and Cite
MDPI and ACS Style
Nurda, N.; Noguchi, R.; Ahamed, T. Change Detection and Land Suitability Analysis for Extension of Potential Forest Areas in Indonesia Using Satellite Remote Sensing and GIS. Forests 2020, 11, 398. https://doi.org/10.3390/f11040398
AMA Style
Nurda N, Noguchi R, Ahamed T. Change Detection and Land Suitability Analysis for Extension of Potential Forest Areas in Indonesia Using Satellite Remote Sensing and GIS. Forests. 2020; 11(4):398. https://doi.org/10.3390/f11040398
Chicago/Turabian StyleNurda, Nety, Ryozo Noguchi, and Tofael Ahamed. 2020. "Change Detection and Land Suitability Analysis for Extension of Potential Forest Areas in Indonesia Using Satellite Remote Sensing and GIS" Forests 11, no. 4: 398. https://doi.org/10.3390/f11040398
Note that from the first issue of 2016, this journal uses article numbers instead of page numbers. See further details here.