Contingency Plans for the Wood Supply Chain Based on Bottleneck and Queuing Time Analyses of a Discrete Event Simulation


Institute of Production and Logistics, University of Natural Resources and Life Sciences, Vienna, Feistmantelstrasse 4, 1180 Vienna, Austria
*
Author to whom correspondence should be addressed.
Forests 2020, 11(4), 396; https://doi.org/10.3390/f11040396
Submission received: 13 March 2020
/
Revised: 29 March 2020
/
Accepted: 31 March 2020
/
Published: 2 April 2020
(This article belongs to the Special Issue Adaptive Forest Management and Decision Making Models under Climate Change (Risk and Uncertainty))
Abstract
:Wood supply chain performance suffers from risks intensified by more frequent and extreme natural calamities such as windstorms, bark beetle infestations, and ice-break treetops. In order to limit further damage and wood value loss after natural calamities, high volumes of salvage wood have to be rapidly transported out of the forest. In these cases, robust decision support and coordinated management strategies based on advanced contingency planning are needed. Consequently, this study introduces a contingency planning toolbox consisting of a discrete event simulation model setup for analyses on an operational level, strategies to cope with challenging business cases, as well as transport templates to analyze outcomes of decisions before real, costly, and long-lasting changes are made. The toolbox enables wood supply managers to develop contingency plans to prepare for increasing risk events and more frequent natural disturbances due to climate change. Crucial key performance indicators including truck to wagon ratios, truck and wagon utilization, worktime coordination, truck queuing times, terminal transhipment volume, and required stockyard are presented for varying delivery time, transport tonnage, and train pick-up scenarios. The strategy BEST FIT was proven to provide robust solutions which saves truck and train resources, as well as keeps transhipment volume on a high level and stockyard and queuing time on a low level. Permission granted for increased truck transport tonnages was evaluated as a potential means to reduce truck trips, if working times and train pick-ups are coordinated. Furthermore, the practical applicability for contingency planning is demonstrated by highly relevant business cases such as limited wagon or truck availability, defined delivery quota, terminal selection, queuing time reduction, or scheduled stock accumulation. Further research should focus on the modeling and management of log quality deterioration and the resulting wood value loss caused by challenging transport and storage conditions.
1. Introduction
Wood is the only sustainable natural resource available in Austria [1]. Consequently, the forest-based industry is a crucial economic sector profiting from Austria’s abundant forests, well-developed infrastructure, highly skilled workers, and a rich research environment, which enables export rates of 87% in the paper industry [2] and 70% in the wood industry [3]. For every additional 100 m3 of wood harvested, a new green job is added to the 300,000 existing ones (i.e., 1/10 of Austria’s working population: 175,700 forestry, 40,000 joineries, 27,900 wood industry, 23,000 timber trade, 11,400 timber construction, 8100 paper industry, 6000 forest management) [4]. To ensure economic success and sustainability and to secure the existing jobs, the industry is dependent on a stable wood supply. The current challenges of the Austrian wood supply chain include decreasing numbers of both crane-truck drivers and train terminals, rapid market price fluctuations, as well as long lead and queuing times. These challenges are reinforced by supply chain risks that may be technical (e.g., machine and truck breakdowns), managerial (e.g., delivery stops at mills and reliability of rail wagon delivery), or inclement weather (e.g., high snow cover, heavy rain, and low temperature).
Climate change increases the frequency and impact of extreme natural calamities which results in high volumes of salvage wood (more than 50% of the harvested wood in Austria in 2018 [5]) and an intensification of risk in the wood supply chain. The Austrian government in its Forest Strategy 2020+, recognized the risks to productivity and the economic deployment of Austria’s forests and set the strategic goal of building and developing resilient risk management instruments and contingency plans [1]. Natural calamities such as windstorms, bark beetle infestations, and ice break treetops produce high volumes of salvage wood, which have to be quickly transported out of the forest to limit further damage or wood value loss. Train terminals have proven to be effective in securing a stable wood supply to the industry as they provide the high transport capacity of railroads and connected storage areas. In Austria there are 153 active train terminals (i.e., 60 wood industry terminals, 65 wood shipping terminals, seven private terminals, 12 temporary terminals, nine terminals with special status), and a considerable number of inactive but recoverable terminals, where wood can be transhipped from truck to train [6]. The management of such a multimodal wood supply chain is more challenging than that of a unimodal supply by utilizing trucks only. However, it reduces the effects of climate changes (e.g., CO2 emissions), supply chain risks (e.g., buffer capacity to supply industry when harvesting is not possible), and supply chain challenges (e.g., reducing the bottleneck of crane truck capacity by limiting their operation to unavoidable short distance wood transport by trucks to terminals).
To provide decision support for the management of a multimodal supply chain, many companies in the forest-based industry have been trying to digitalize. Concepts such as Industry 4.0 and the internet of things (IoT) have inspired companies to collect large amounts of data, but in most cases they are not analyzed, shared, or used for the decision making process required to mitigate risks. For this reason, industry representatives are considering the development of digital twins of their supply chains. The term digital twin is used as an umbrella term and can be further divided in a wide range of maturity levels. Based on an earlier framework [7] steps for a virtual factory were defined [8], which are also generally appropriate for virtual supply chain models. They define a digital model as a virtual representation that reaches a connected model state (also designated as digital twin), if it is supplied with real-time data. Others define a digital twin as a “virtual representation of a real-world system and its status”, distinguishing it from simple simulation models by “the ability to determine the state of a specific object”, which is “achieved by combining current data from the subject with its simulation model” [9]. Based on these definitions, Austria’s forest-based industry is a long way from creating a real digital twin or virtual supply chain. However, the first step in this direction can be made by creating digital models, which reduce uncertainty at a reasonable cost. This leads companies away from educated guesses and gut decision making based on rule-of-thumb estimates to decision making based on data already collected but not properly analyzed.
In the literature, digital models for multimodal wood supply chains including terminals have been delivered in the form of discrete event simulation (DES) models. DES fits perfectly for modeling the wood supply chain in a dynamic (i.e., variables change over time), discrete (i.e., system changes occur at specific events), and stochastic (i.e., random observations) way [10]. The wood supply chain covers growing, harvesting, extraction, transporting, storing, (pre-)processing, (re)using, and recycling of wood. Wood supply chain management deals with relevant decisions to plan, design, operate, control, and monitor material-, service-, financing-, and information flows within and between various actors [10]. Appropriately, the wood supply chain can be represented by standard DES elements such as entities or resources (e.g., wood, trucks, trains), delays (e.g., processes, tasks, service times), queues (e.g., waiting lines to enter terminal or industry stockyards), or system capacities (e.g., transport or stockyard capacity). Furthermore, DES is appropriate for advanced contingency planning because complex interdependencies can be modeled and visually illustrated in animations to demonstrate model internals to stakeholders. DES models for wood transport were reviewed and the suitability of multimodal DES models for building efficient, resilient, green and socially sustainable wood supply chains was confirmed [10]. Existing multimodal DES models including train terminals [11,12,13,14,15] cover timber, forest chip, or biomass transport at an operational level. They use different supply chain network configurations for regional case studies in Austria or Finland. Other multimodal DES models also consider vessel terminals [16,17,18,19]. These multimodal DES studies are important contributions to obtain a better understanding of the complex interdependencies of multimodal wood supply chains, yet none have focused on risk mitigation and generalizable contingency planning.
Especially after extreme natural calamities, when decisions have to be made quickly, there are neither coordinated plans nor elaborated management strategies available. As a result, supply chain performance suffers and will suffer even more due to risks intensified by more frequent and extreme natural calamities driven by climate change. Consequently, a research gap exists to derive concrete contingency plans for wood transport. To help close the current research gap, this study delivers elaborated contingency planning for train terminals based on DES. In particular, this study sets up a DES model to deliver crucial key performance indicators (KPIs) and develops transportation templates for different delivery time, tonnage, and train pick-up scenarios as a basis for contingency planning. Furthermore, contingency planning is illustrated by practical and highly relevant business cases. Consequently, it answers the research questions “Which parameters are critical for multimodal contingency planning?”, “How many trucks and wagons are needed for short-, medium-, and long delivery times, respectively, with one or two train pick-ups to perform best”, and “How many truck trips can be avoided, if the maximal transport tonnage increases and how would this effect the terminal performance”?
2. Method and Model
Simulation models facilitate understanding of complex systems and their behavior in a variety of scenarios. They provide superior benefits for managerial contingency planning in nonstationary systems under uncertainty in contrast to mental, conceptual, physical, or mathematical models. In simulation modeling, methods such as DES, agent based simulation (ABS), and system dynamics (SD) are general frameworks for mapping a real-world system [20]. DES focuses on manmade systems, where large and complex operations can be broken into a sequence of straightforward tasks or processes, which are often illustrated in flowcharts [21]. Moreover, different model configurations and what-if analyses show the effects of decisions before real, costly, dangerous, inefficient, or long-lasting changes are made and therefore provide valuable decision support for today’s challenges.
The applied DES model is an extension of Kogler and Rauch [15] including a new generic model structure enabling generalizable results for various train terminals. The model was sufficiently validated including expert involvement, appraisals, real life case study data, input (e.g., restrictions, decision variables, case study settings), and output checks (e.g., transportation plans, volumes). Moreover, the identification of critical parameters resulted in the design of new scenario settings taking into consideration different delivery times, transport tonnages, and number of train pick-ups. Additionally, refined parameterizations, as well as an enhanced system logic now enable advanced contingency planning. The parameterizations of Kogler and Rauch [15] included only one broad triangular distribution for delivery times, which, for this study, was split into narrow triangular distributions for short, medium, and long delivery times to provide more appropriate configurations for different train terminals with various delivery times. This approach was also used for the parameterization of low, moderate, and heavy transport tonnages to evaluate permissions granted for higher truck transport tonnages. The implementation of a second train pick-up per day expanded the system logic, but required coordinating truck working times with train pick-ups to ensure a solution quality of both a truck utilization rate over 95% and no empty wagons at the time of train pick-up. Comprehensive sensitivity analyses for the decision variables (i.e., number of trucks and number of wagons) provide advanced multimodal transport plans which outperform the simple expert-based heuristic of Kogler and Rauch [15]. Furthermore, this study defines and calculates new KPIs, which are especially relevant for contingency planning.
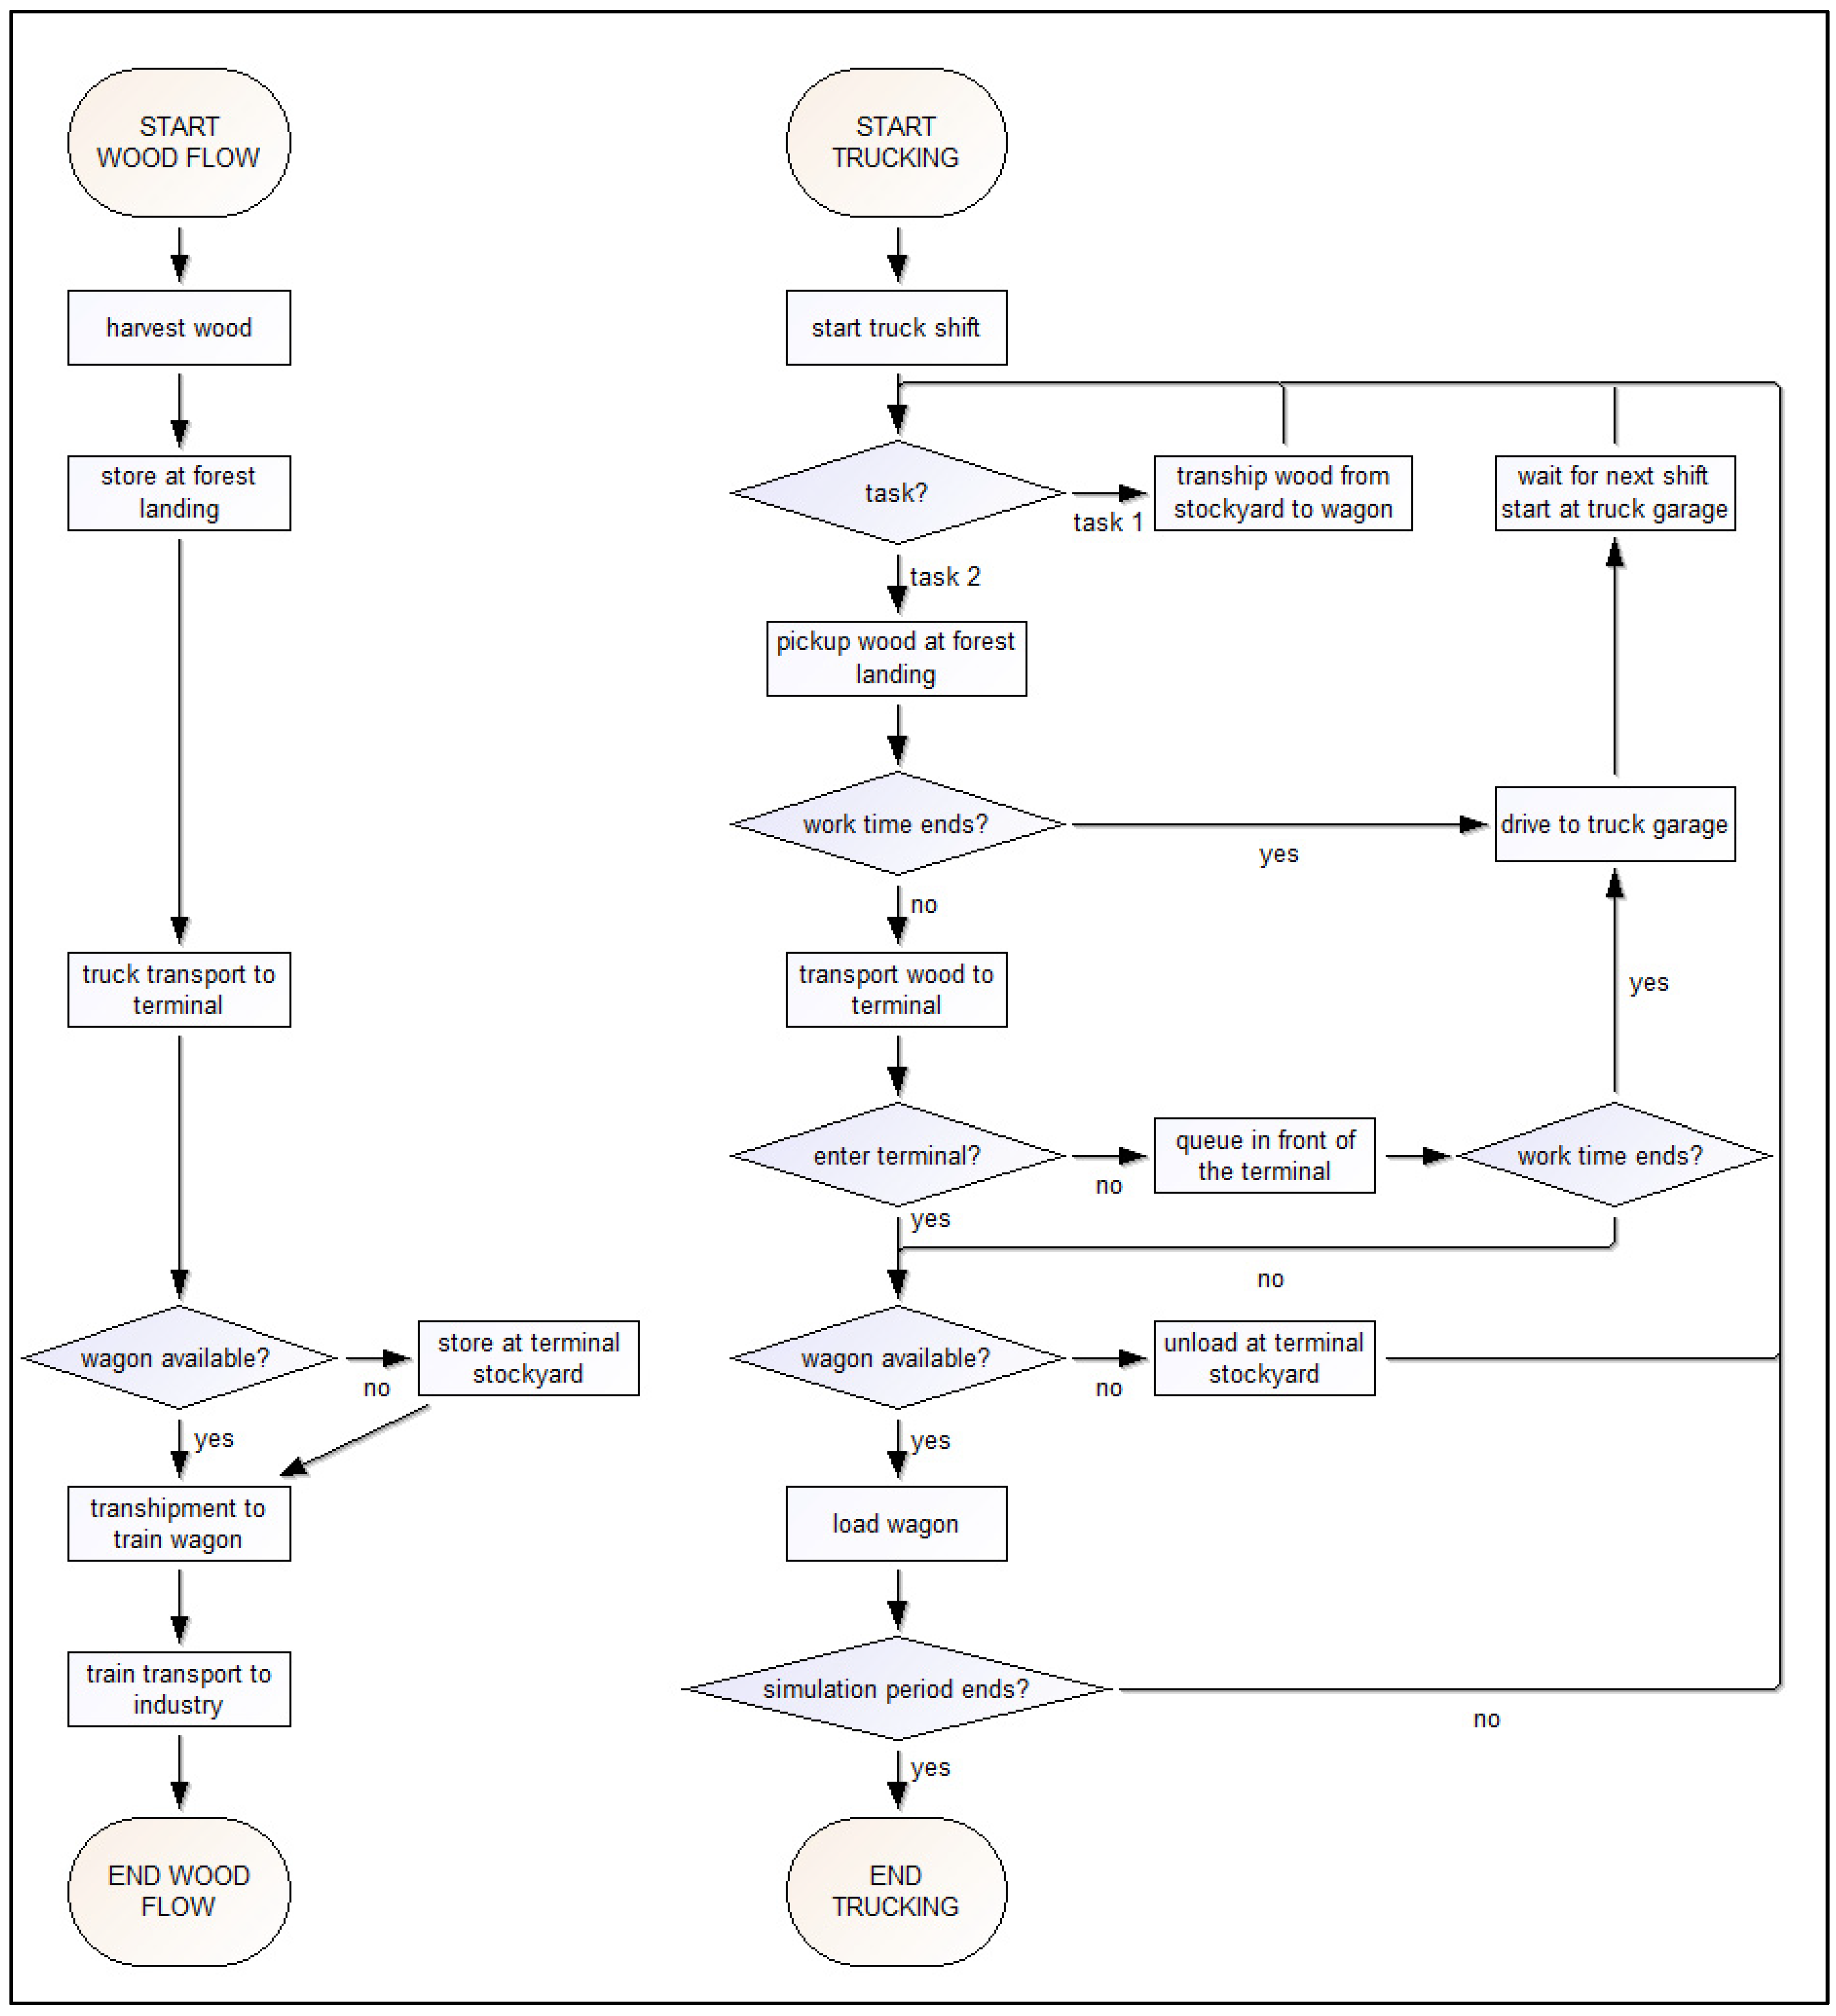
The model maps the flow of wood entities through the supply chain by facilitating processes for wood harvest, storing at forest landings, truck transport to terminal, storing at terminal stockyard, transhipment to wagon, and train transport to industry (Figure 1).
Trains and trucks move the wood during their working hours through the supply chain. Trucks fulfill the tasks of picking up wood at the forest landing and transporting it either directly to wagons or via terminal stockyards. The processes at the terminal are modeled in detail and close to reality, which enables the tracking of truck queuing times. Thus, the following activities are covered: Queuing in front of the terminal, removing safety belts, loading wagon, securing wagon load, unloading at stockyard, cleaning truck platform, and completing delivery documentation. Consequently, a complex logic controls the transhipment process from trucks to stockyard or wagons, as well as the potential truck queuing at the terminal. Trains pick up fully loaded wagons, transport them to industry, leave empty wagons for loading, and sort wagons according to their loading status at the terminal. For a detailed description of the DES model refer to Kogler and Rauch [15].
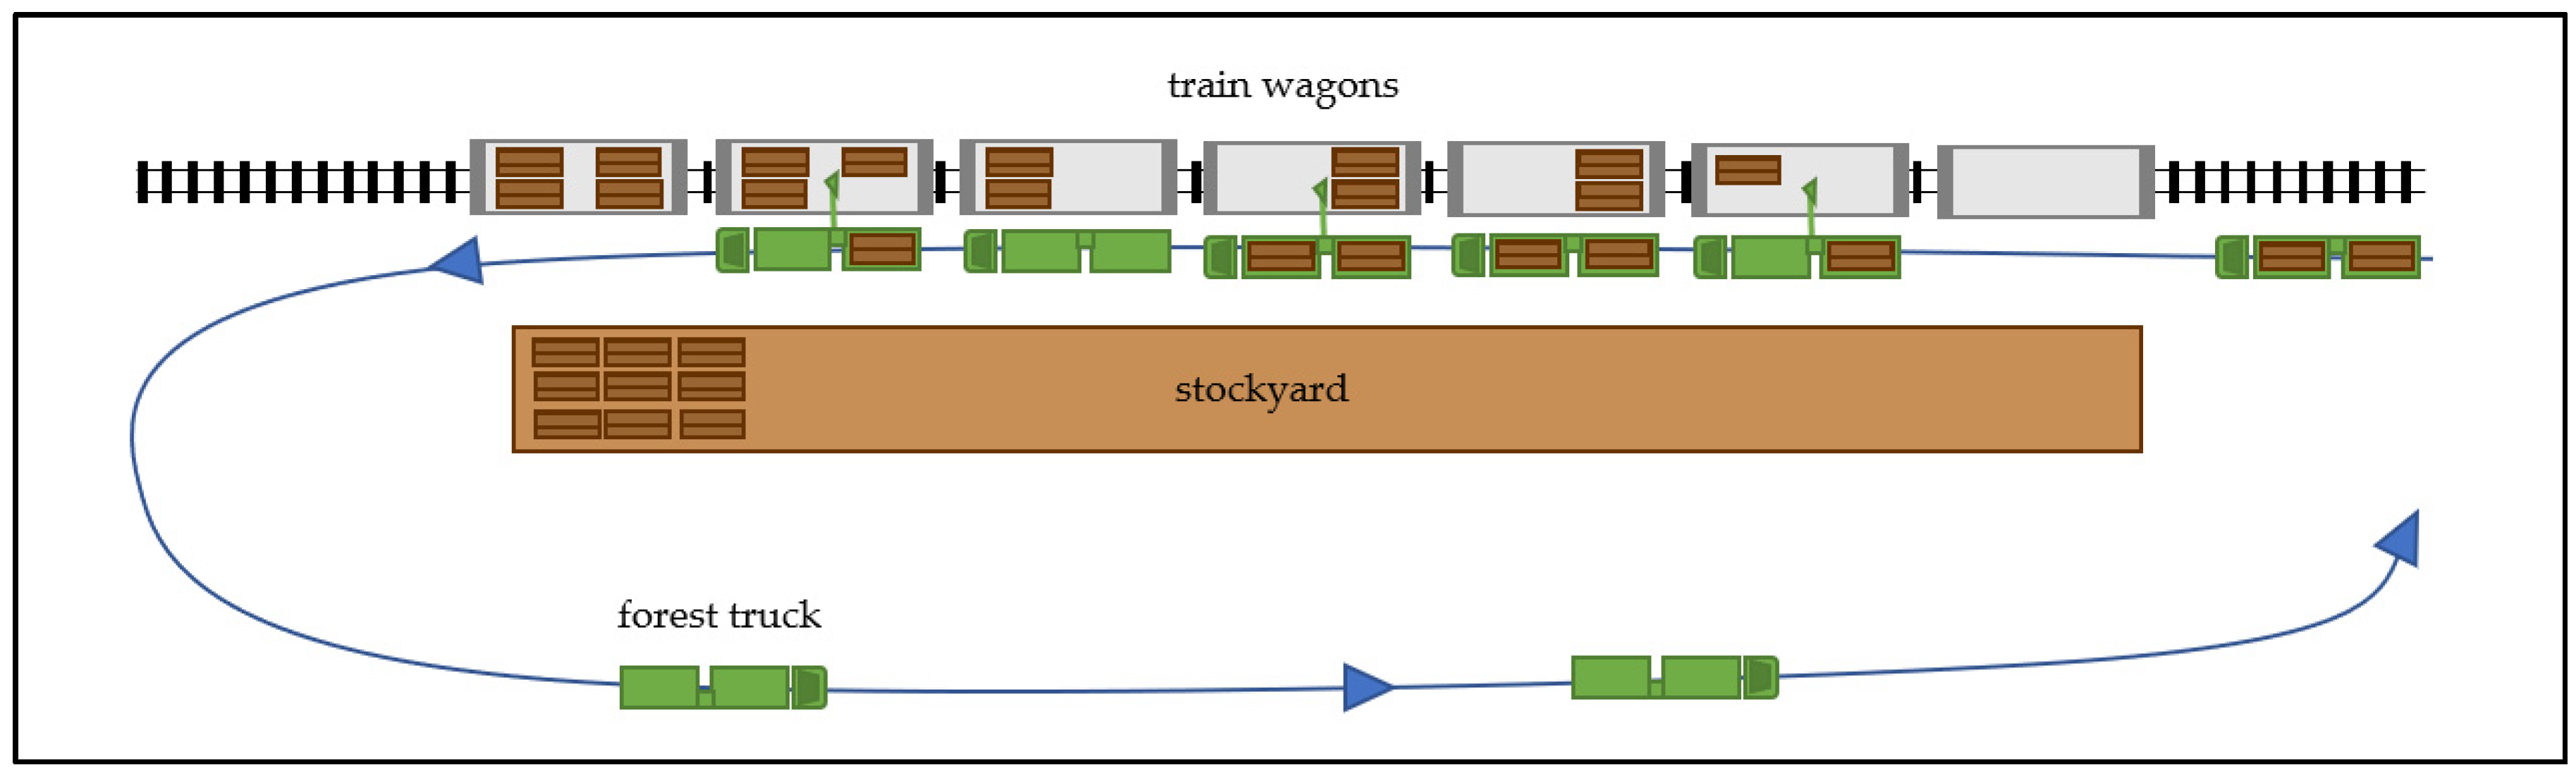
Sensitivity analyses of preliminary simulation runs indicated that results are sensitive to changes in delivery time from forest to terminal, number of train pick-ups at the terminal, and the transport tonnages. Consequently, these parameters were critical for multimodal contingency planning. Based on input data analysis (e.g., process times) of Austrian case studies and consultation with experts (i.e., foresters as well as wood, transport, and logistic managers), realistic parameter settings were specified, which lead to the formulation of scenarios to cover small-scale train terminals with similar layouts: One loading siding, no overtaking at the roughly elliptical inbound truck driving route, loading track length of maximum seven wagons, and two truckloads filling one wagon (Figure 2). This represents the majority of Austria’s train terminals for wood transhipment.
Thus, simulating 18 scenario combinations (Table 1) covers a broad range of potential logistic cases and facilitates the generation of generalizable results as a basis for the development of robust transport strategies for contingency planning.
The truck delivery time covers categories representing regions with short-, medium-, and long delivery times between forest landings and terminal. Triangular distributions were used to take into account different street and traffic conditions and possible process delays (Table 2).
Scenarios for low, moderate, and high truck loads were designed to consider actual weight limits (e.g., 44 t in Austria) for forest trucks equipped with a crane, as well as exemption clauses granted by the authorities after massive windthrows with bark beetle burdens or potential future liberalization. For heavier tonnages one additional minute of loading/unloading time per additional ton was assumed. A truck driver cannot exactly estimate the weight of the loaded wood due to natural variations in bulk density and moisture content, as well as a lack of crane scales in the majority of Austrian forest trucks. Consequently, the variation was implemented applying triangular distribution of tonnages and dependent process times (Table 3). General truck tasks at the terminal such as removing belts (i.e., MIN = 7 min/MODE = 10 min/MAX = 12 min), securing wagon loads (i.e., 5/8/10), cleaning loading platform (i.e., 3/5/10), as well as completion of delivery documentation (i.e., 10/13/15) are the same in all scenarios [15].
Once or twice a day, a locomotive picks up full loaded wagons and provides the number of ordered empty wagons. Train pick-up times are fixed by the train carrier at 9 am and 3 pm (i.e., for two pick-ups). The start of truck shifts was coordinated with delivery times and train pick-ups resulting in a high ratio of fully loaded wagons at the time of a train pick-up. This ensures high truck utilization, as well as high terminal handling volume. Trucks start their shift at 7 am (adjusted to 5 am for medium and long delivery time scenarios with two train pick-ups) giving them enough time to fill the wagons before the first pick-up at 9 am. This approach of working time and train pick-up coordination was validated for its practical usability by terminal managers of the Austrian Federal Forests (i.e., largest forest owner in Austria) and Rail Cargo Austria (i.e., main cargo operator on Austrian railways), who confirmed similar strategies, if high terminal handling volume was needed after natural calamities. In accordance with European law, truck shifts were set to 8 h a day for five days a week.
Extensive test runs were performed to understand the interdependencies of the system and to select and track the most important KPIs for contingency planning. The resolution time was set as minutes and the simulation period as one week in order to both match manager’s requirements and follow common scientific practice [10]. To ensure the predefined solution quality necessary for practical usability, all results that satisfy a truck utilization of over 95%, allow no empty wagons at the time of train pick-up and allow fewer than 20 half loaded wagons per week for one train pick-up (i.e., respectively 40 half loaded wagons for two train pick-ups). The simulations were replicated 52 times for every scenario to cover a full year of observation time. This resulted in 936 single simulation runs consisting of 52 weeks for a total of 18 scenarios.
2.1. KPIs and Transport Strategies
Four KPIs were identified as necessary to provide decision support for contingency planning. The KPI “terminal transhipment volume” defines the maximal amount of wood in solid cubic meters, which can be transhipped at the terminal from truck to wagon per week for a given truck and train wagon configuration. The KPI “required terminal stockyard” shows the amount of wood in solid cubic meters which is stored to guarantee a high truck and wagon utilization, as well as smooth wood flow from forest to the industry. The KPI “average queuing time” reports on the average truck waiting time in minutes at the terminal, which consists of the waiting times to enter the terminal, remove the safety belts, load the wagon or unload at the stockyard, and clean the loading platform. The KPI “maximal queuing time” reveals the longest waiting time in minutes for trucks to pass through the processes at the terminal.
Contingency planning requires the consideration of those KPIs, as well as reflection on the different, often competing objectives. In order to provide decision support for different planning objectives, various sets of KPI rankings were developed with stakeholder participation and analyzed for low tonnages and short, medium, and long delivery times. After extreme natural calamities the contingency planners are challenged to transport the wood out of the forest as fast as possible to avoid wood value loss. Consequently, the first strategy MAX VOLUME solely focuses on the maximal terminal transhipment volume. In cases where beneficial solutions had the same maximal terminal transhipment volume, the solution with the lowest number of wagons and trucks (i.e., decision variables) was selected to save resources. In some cases, contingency planners have to deal with terminals which do not provide space for a stockyard. Thus, the second strategy NO STOCKYARD was developed, which selects a solution where no stockyard is needed (i.e., if there are no solutions with no stockyard availability, the one with the lowest stockyard was chosen). From those solutions with the lowest stockyard, the one with the highest transhipment volume was chosen. The resulting solutions performed well according to their main KPIs, but also showed limitations regarding others. Thus, the MAX VOLUME strategy requires high transport resources. This also holds true in some cases for the NO STOCKYARD strategy, which provided comparatively low transhipment volume. Consequently, a third strategy BEST FIT was developed. In order to save both truck and train resources and to simultaneously keep transhipment volume on a high level, solutions with an up to 10% lower maximal transhipment volume were considered. Among all feasible solutions the one with the lowest number of wagons and trucks was selected, and if these were equal the solution with the lowest required stockyard was chosen.
2.2. Business Cases for Evaluating Managerial Impact
In order to evaluate the practicability of simulation results provided as tables as a basis for operational transport planning, three different business cases are formulated: (1) Restricted wagon availability, (2) restricted truck availability, and (3) defined delivery quotas. The first business case discusses the handling of restricted wagon availability. The terminal size limits the number of wagons for simultaneous transhipment and rail carriers define the maximal number of train pick-ups a day. However, after natural calamities or capacity planning errors (e.g., misjudgment of demand), as well as during harvesting periods of other train shipped goods such as beets, the number of available wagons can further decrease and fluctuate on a weekly basis. The transport templates should be used to find the appropriate number of trucks for a given number of train pick-ups, wagons, delivery time, and transport tonnage to guarantee an efficient (i.e., high volume and utilization, low resources and queuing times) wood transport.
The second business case provides a guideline for planning under restricted truck availability. In mountainous regions which have steep and widely ramified forest roads and lack GPS reception, planning should focus on a high utilization of the limited number of local forest truck drivers (= bottleneck), which are able to navigate through the forest road network. Here, the transport templates can be used to find an efficient number of wagons for a given number of train pick-ups, trucks, delivery time, and transport tonnage.
The third business case covers the common issue of defined delivery quotas. Wood based industry factories such as sawmills or pulp and paper mills, depend on a stable wood supply to guarantee smooth-running production. Furthermore, harvesting teams are dependent on constantly available transport to maintain enough space for harvested wood and its extraction (e.g., especially for cable logging to narrow mountain roads). Consequently, fixed delivery quotas are arranged to enable a smooth flow of wood. The transport templates permit the selection of an appropriate terminal, as well as transport configurations and provide KPIs in order to compare the effects of potential exemption clauses for higher transport tonnages after natural calamities.
3. Results
The managerial practice for operational wood transport planning follows a rolling weekly planning horizon. Thus, all results were aggregated to a weekly level and rounded to the nearest ten to provide a clear overview for short-term contingency planning. This approach allows contingency planners to react dynamically to changing conditions and restrictions after natural calamities or other disturbances. The numbers of available trucks and wagons are the main decision variables for contingency planners and thus, define the structure of the resulting templates (Appendix A and Appendix B; Table 4, Table 5, Table 6, Table 7, Table 8, Table 9, Table 10 and Table 11; Figure 3 and Figure 4).
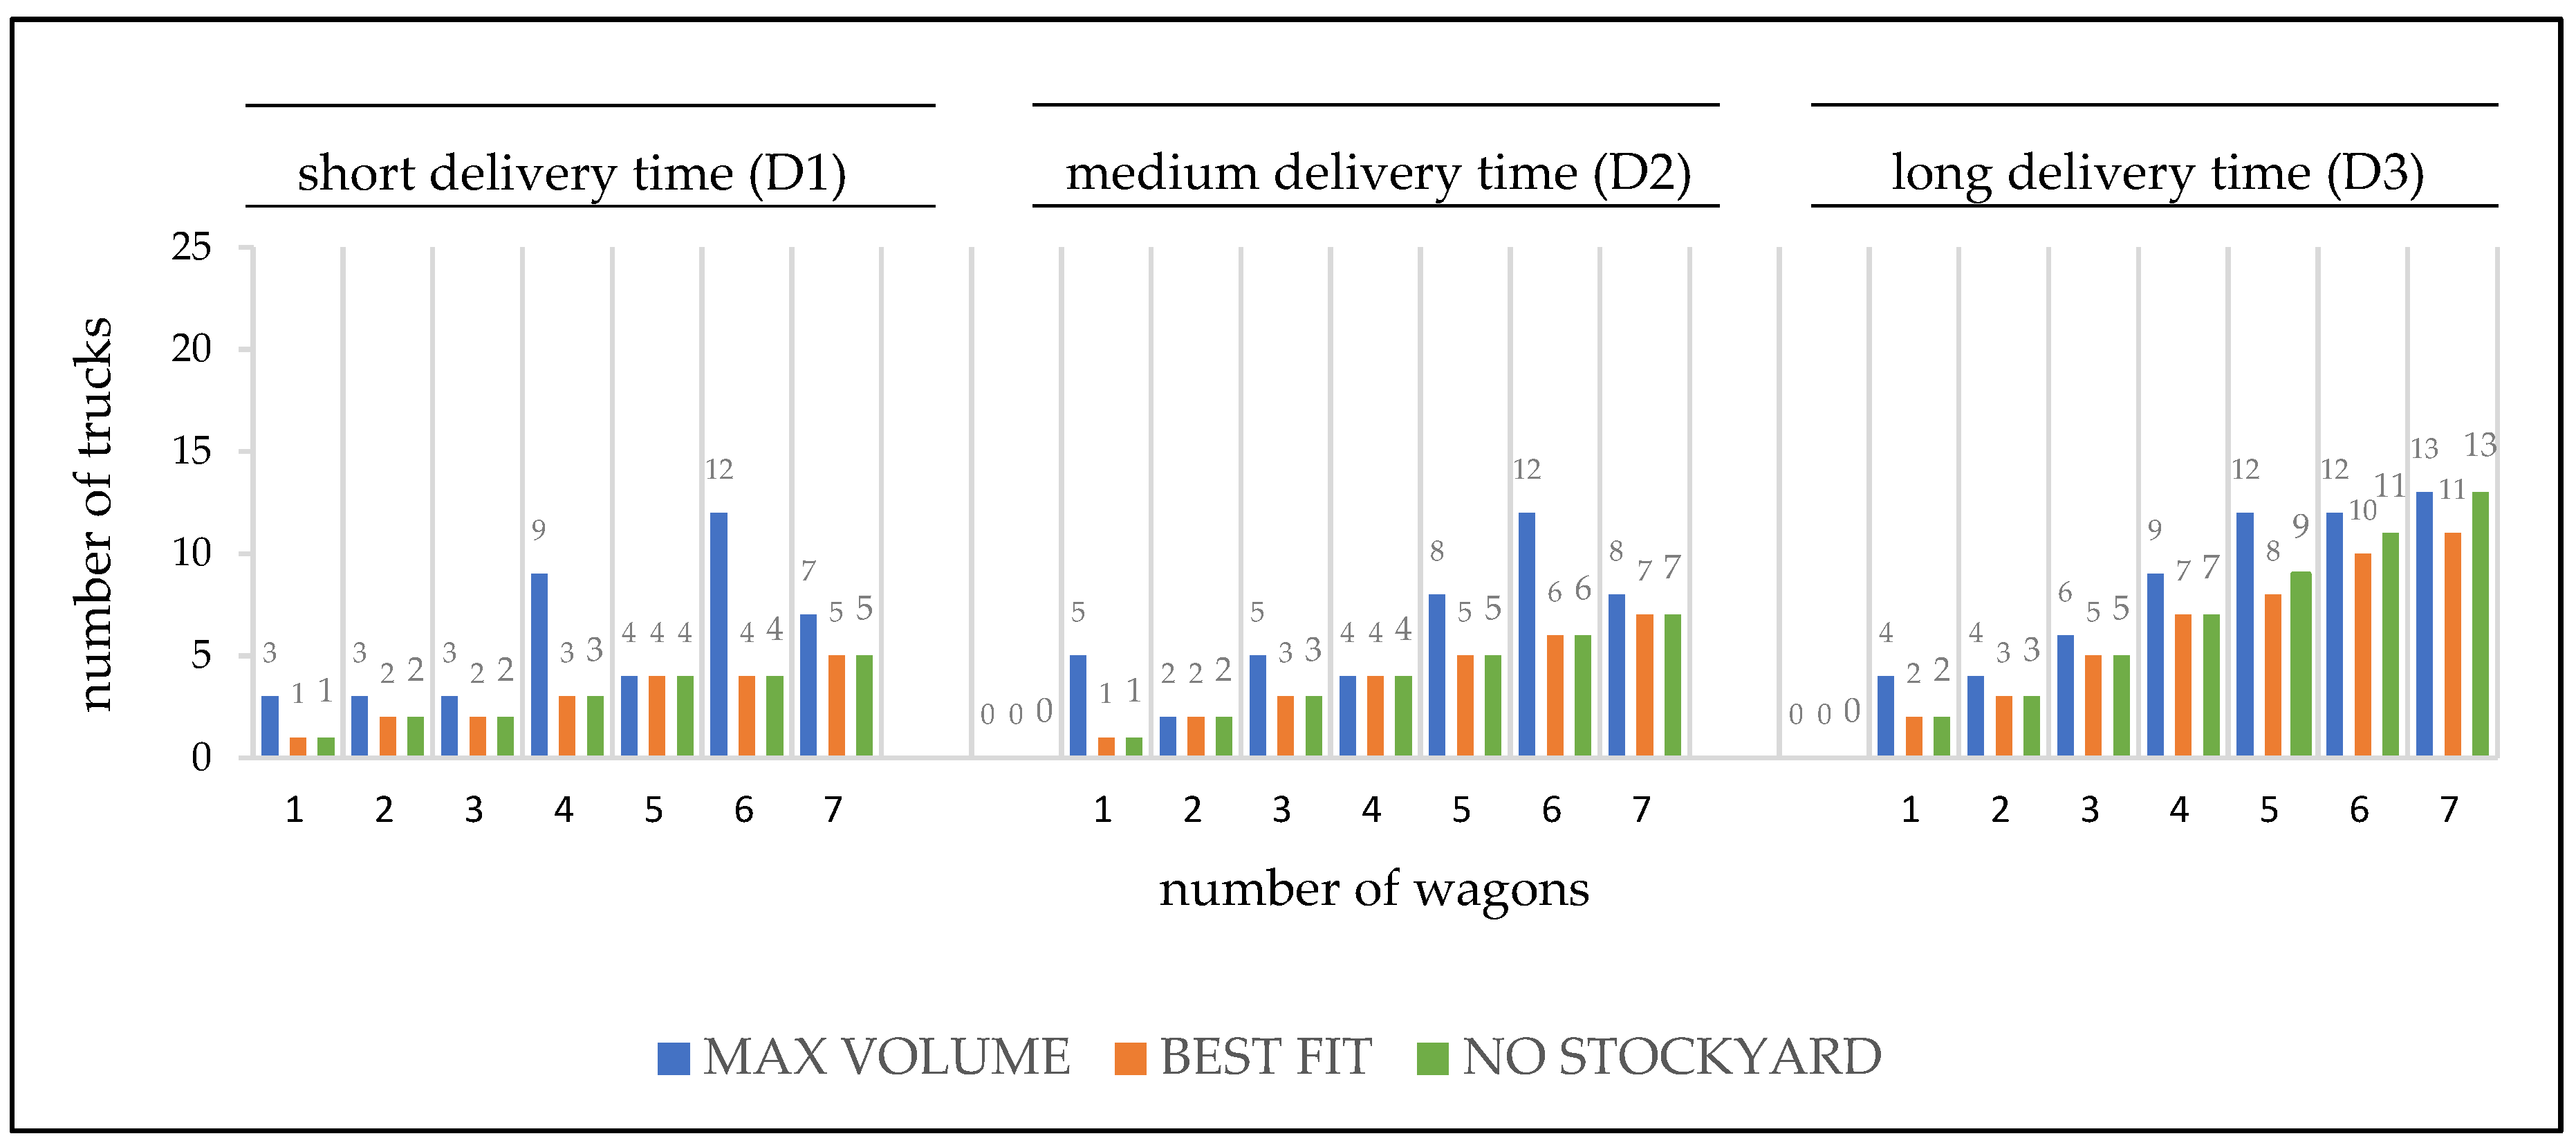
For the one train pick-up scenario the BEST FIT strategy provided the lowest number of trucks per wagon, closely followed by the NO STOCKYARD strategy, which performed worse for long delivery times whenever it goes beyond four wagons (Figure 3). Moreover, the BEST FIT strategy reduced the number of trucks compared to the MAX VOLUME strategy and transhipped similar amounts of wood (Table 7). Additionally, both the BEST FIT strategy and the NO STOCKYARD strategy reduced the required stockyard compared to the MAX VOLUME strategy. The BEST FIT strategy also outperformed MAX VOLUME, as well as the NO STOCKYARD strategy with regard to queuing times.
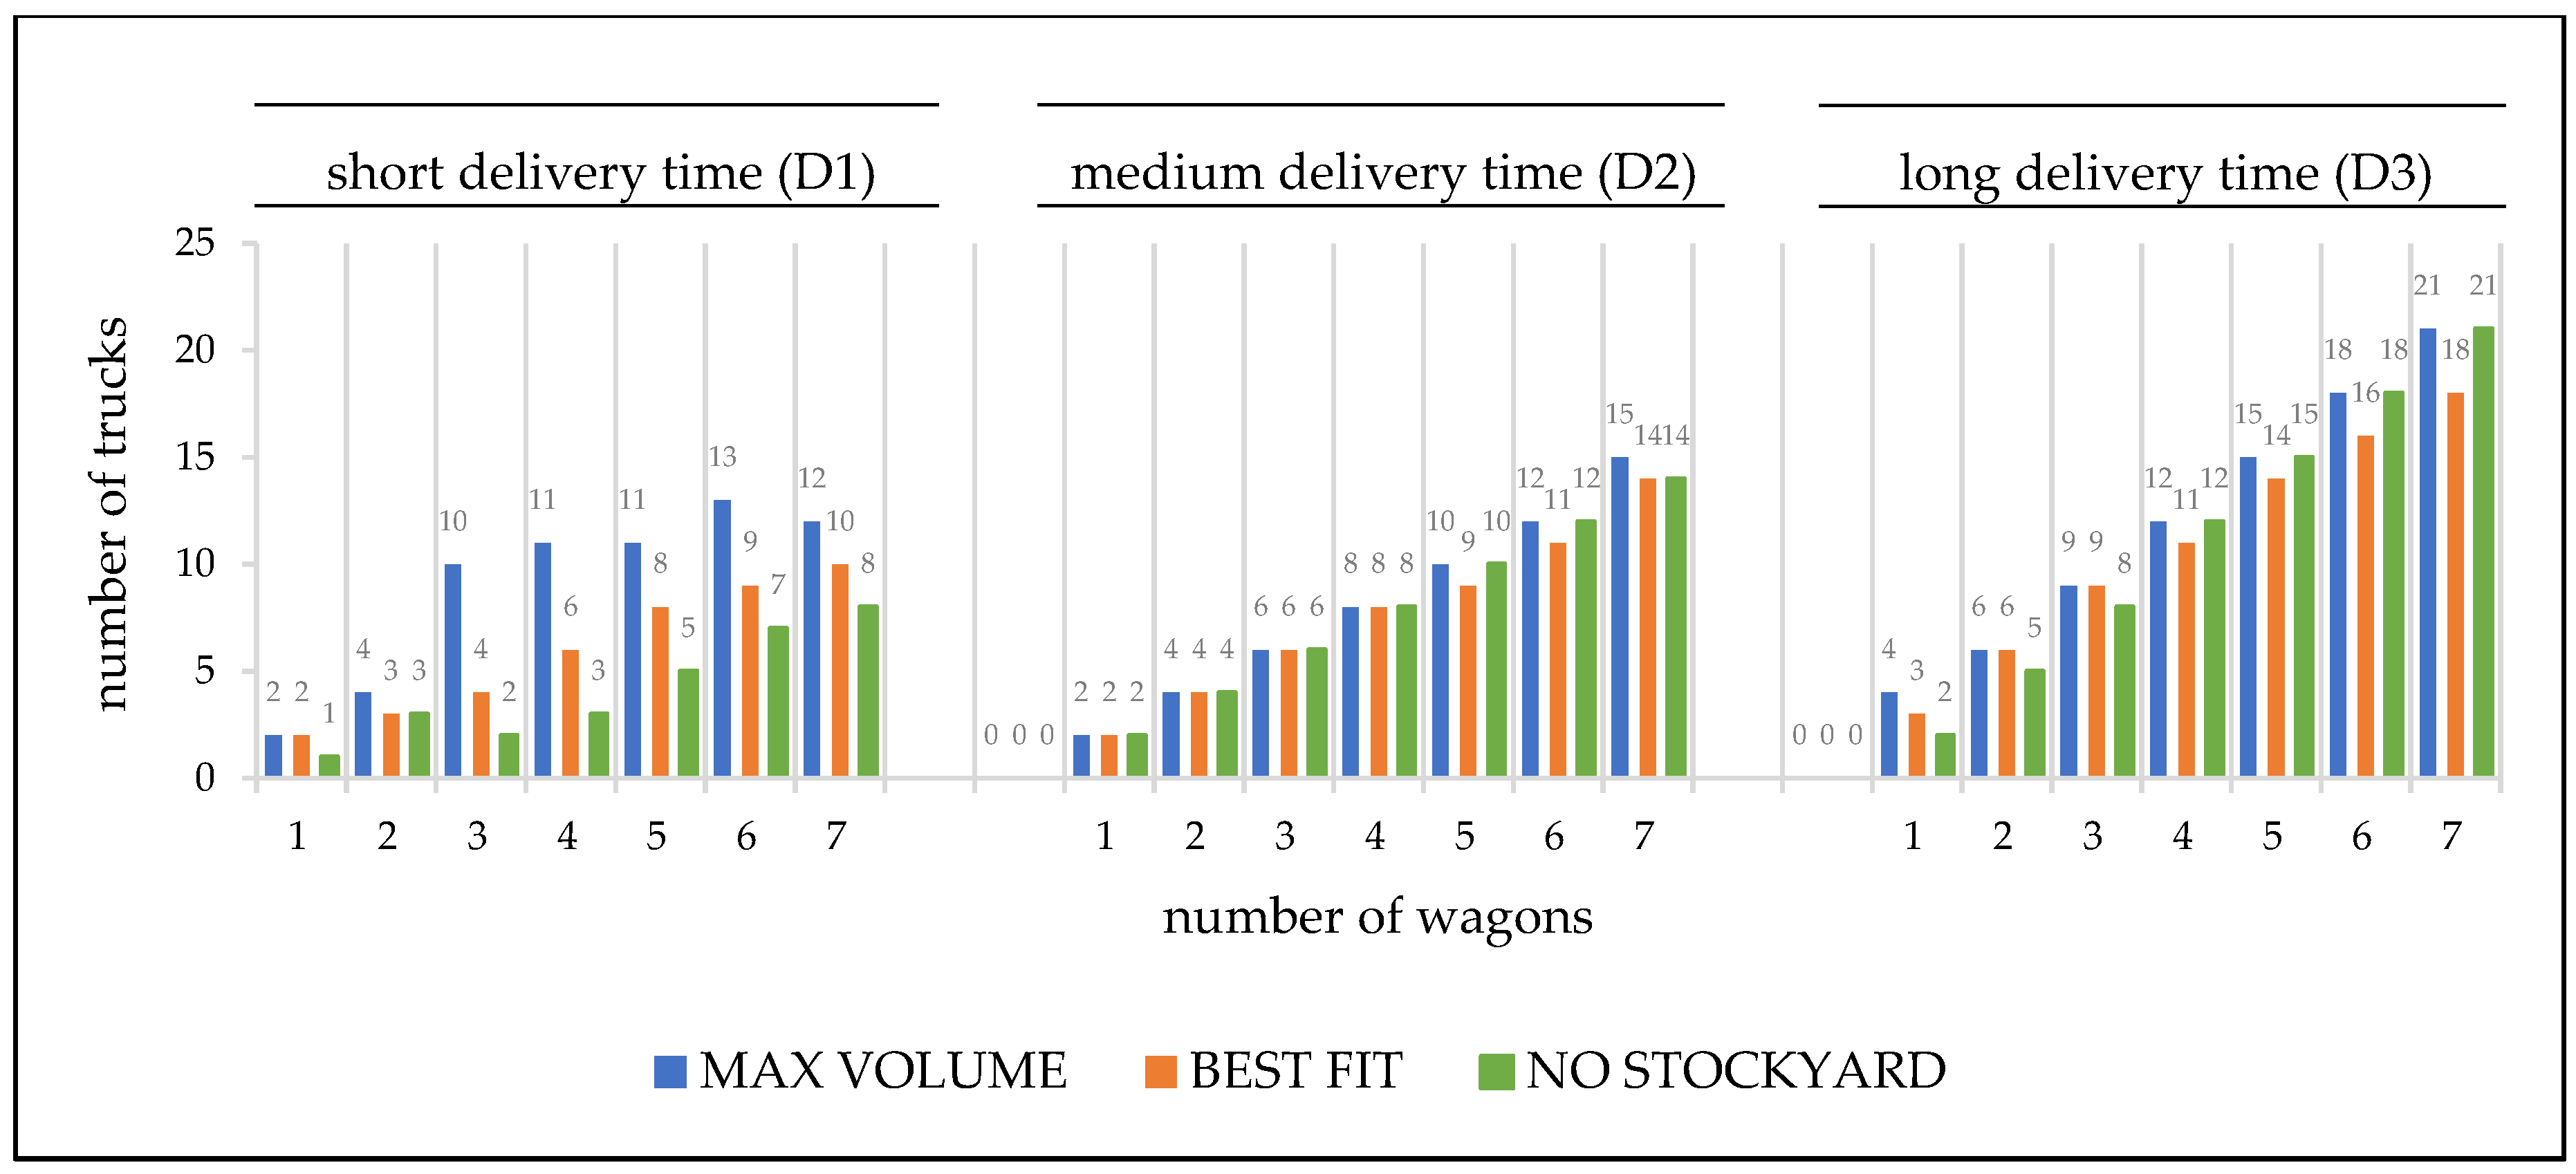
Two train pick-ups show a more diverse picture, because the lowest number of trucks per wagon switches between the BEST FIT strategy with 12 times lowest value and the NO STOCKYARD strategy with 15 times lowest value (Figure 4). If the MAX VOLUME strategy is used as a benchmark, on the one hand, the number of trucks is lower for the BEST FIT strategy and the NO STOCKYARD strategy (Table 11). On the other hand, the transhipment volume is slightly lower for the BEST FIT strategy, but drops sharply for short delivery times for the NO STOCKYARD strategy. Regarding the required terminal stockyard the NO STOCKYARD strategy outperforms BEST FIT strategy. For queuing times, the BEST FIT strategy outperforms for long delivery time, and the NO STOCKYARD strategy for short ones.
A framework for beneficial wagon to truck ratios is provided in Figure 3 for one train pick-up and Figure 4 for two train pick-ups. High quality solutions can be compared and selected according to the main contingency planning objective and strategy. Thereby, the framework is complemented by the transport configuration tables (Table 4, Table 5, Table 6, Table 8, Table 9 and Table 10), as well as transport templates (Appendix A and Appendix B) where KPIs can be compared in detail. For instance, it can be observed that the MAX VOLUME strategy builds up higher stockyards and thus, also more trucks and wagons are needed. Simultaneously those figures and tables are also useful, if contingency planners have other customizable decision variables such as delivery time or to deal with transport capacity limitation such as fewer truck or wagon availability. For example, Figure 4 shows, that if there are only 10 trucks available to supply a terminal with seven wagons and two train pick-ups, only supplying forests with short delivery time to the terminal would enable full utilization of the terminal capacity. Moreover, decision support can be provided regarding terminal selection, if different terminals are available.
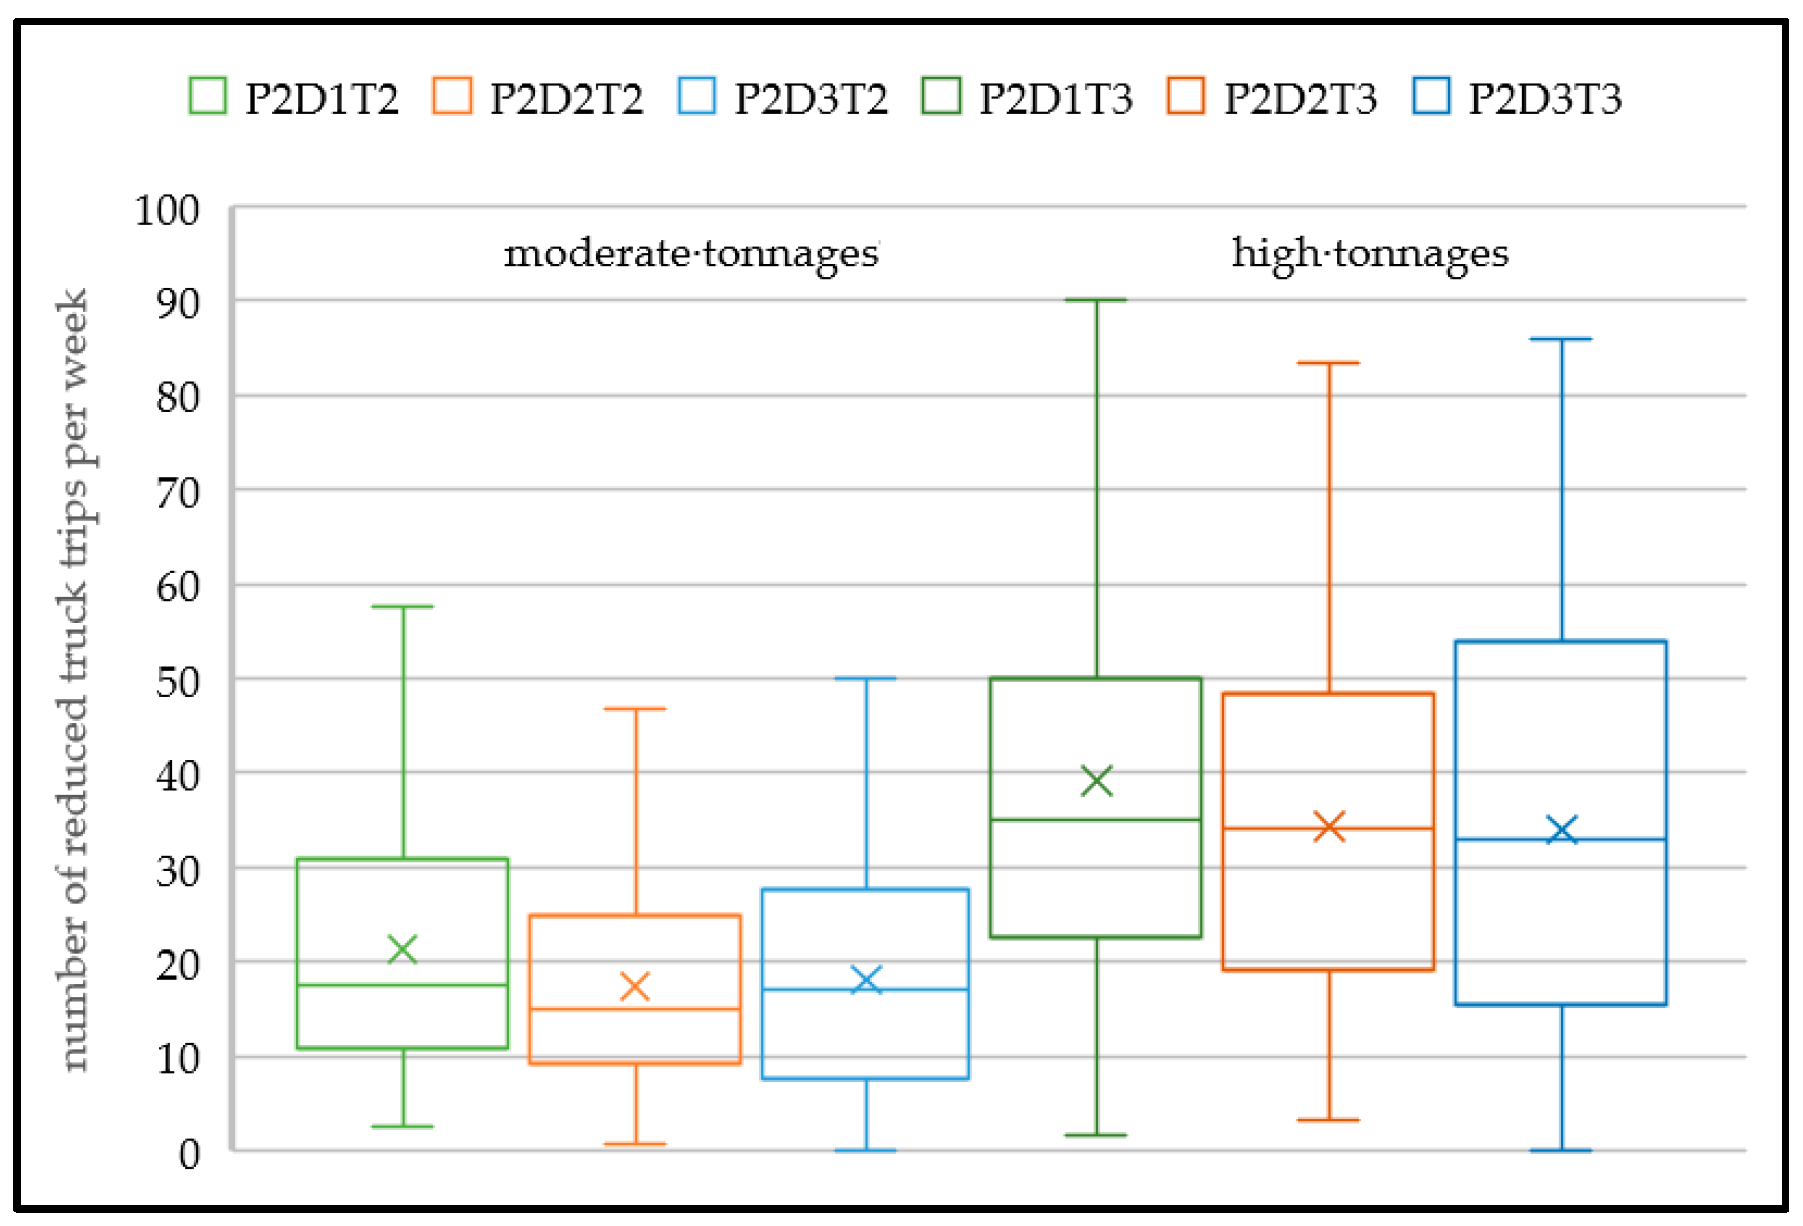
In business cases where higher transport tonnages are possible due to legislative changes or exemption clauses invoked by the authorities, the relevant KPIs can be looked up in the complete transport templates (Appendix A and Appendix B). Furthermore, the Appendix shows the potential for truck trip reduction. On average, the number of truck trips can be reduced by 6% for one train pick-up (short delivery time 9%/medium 8%/long 2%) and 10% for two train pick-ups (8%/11%/9%), when tonnages change from low to moderate. If tonnages change from low to high, the number of truck trips can be reduced by 10% for one train pick-up (14%/14%/7%) and 17% for two train pick-ups (14%/19%/16%). The distribution of the number of reduced truck trips per week is shown for one train pick-up in Figure 5 and two train pick-ups in Figure 6. In addition to tonnages and delivery times, the number of trucks in the system (i.e., higher for two train pick-ups), the number of wagons (i.e., from one up to seven), the average queuing times for one train pick-up (minutes: 20/12/74) and two train pick-ups (25/14/35) influence the number of reduced truck trips per week.
3.1. Contingency Planning Under Restricted Wagon Availability
The practical applicability of the simulation model for short-term transport and especially contingency planning is demonstrated by selected realistic business cases. For the first business case, contingency planning under restricted wagon availability, the transport templates can be used to find the appropriate number of trucks for a given number of train pick-ups (e.g., two), wagons (e.g., five), delivery time (e.g., medium), and transport tonnage (e.g., low). If there is no stockyard available, the corresponding transport template (Appendix Table A5) shows for 10 trucks a maximal weekly transhipment volume of 2350 m3 and an average queuing time of 20 min, as well as a maximal queuing time of 120 min. If there are only five trucks available, a switch to only one train pick-up a day (Appendix Table A2) with a maximal transhipment volume of 1170 m3 is the better option. For terminals with stockyards a controlled inventory accumulation at the train terminal (e.g., to prevent bark beetle infestation in the forest) can be achieved with one additional (11 trucks 250 m3) or two additional (12 trucks 490 m3) trucks per week. If truck carriers would not accept an average queuing time of 20 min (i.e., truck carrier paid per transhipped m3 tries to use negotiation power due to limited transport options after natural calamities), the number of trucks could be reduced from 10 to 8 to lower the average queuing time to 10 min (resulting in a transhipment volume of 1890 m3).
3.2. Contingency Planning Under Restricted Truck Availability
The second business case considers contingency planning under restricted truck availability, where transport templates can be used to find an efficient number of wagons for a given number of train pick-ups (e.g., two), trucks (e.g., five), delivery time (e.g., short), and transport tonnage (e.g., low). Without a stockyard available, five wagons can provide a transhipment volume of 1710 m3, an average of 10 min, and maximal queuing time of 90 min (Appendix Table A4). If more wagons (e.g., seven) are available, one train pick-up (Appendix Table A1) may be an alternative (providing 1630 m3, 20 min average, and 130 min maximal queuing time). In order to guarantee supply security from terminal to industry (e.g., restrictions in forest road usability due to snow, rain, or maintenance) buffer inventory at terminals with stockyards can be a strategic advantage. To build up inventory at a terminal supplied by five trucks, the number of wagons can be reduced to one, allowing a weekly stockyard accumulation of 1670 m3 (Appendix Table A1) for one train pick-up and 1430 m3 (Appendix Table A4) for two train pick-ups, respectively. If the queuing time for five trucks and wagons at the terminal needs to be reduced (e.g., because of negotiations or complaints), one train pick-up would lower the average queuing time to 10 min and the maximal queuing time to 80 min (transhipment volume 1130 m3, required stockyard 600 m3).
3.3. Contingency Planning Under Defined Delivery Quotas
The common issue of defined delivery quotas is showcased by the third business case. If a transport quota of 3300 m3 per week is designated, it can be achieved by a terminal with two train pick-ups per working day providing seven wagons each. For short delivery time 12 trucks (Appendix Table A4), for medium14 trucks (Appendix Table A5), and for long 21 trucks are needed (Appendix Table A6). If it is possible to increase the transport tonnage from low to moderate, the quota could be fulfilled with 11 trucks for short, 13 trucks for medium, and 19 trucks for long distances. In case of an increase from low to high, for short delivery time 8 trucks, for medium 12 trucks, and for long 17 trucks would be sufficient. In order to classify the truck savings through multimodal transport, one scenario setting for a similar unimodal supply chain was calculated (i.e., drive time forest MIN = 35 min/MODE = 40 min/MAX = 45 min, drive time industry 145/150/155, unloading and queuing time industry 85/90/95; resulting in one trip per truck per day to achieve an equivalent truck utilization for comparable results). To achieve a unimodal transport quota of 3300 m3 per week for low, moderate, and high tonnages the number of required trucks would be 28, 25, and 22 trucks, respectively.
4. Discussion
Comprehensive transport templates structured by main decision variables were proven to provide contingency planners with decision support for various conditions and objectives. Recommended transport configurations can be further refined by negotiations, legal adjustments, or process optimization that were not evaluated in the simulation model. Refinements by negotions may include modifying industry delivery quota to enable a higher utilization, providing additional transport capacity to fulfill required delivery quota, switching supply to an alternative forest region or adding additional train pick-ups. Legal adjustment could include the targeted use of over-time working to fill all wagons or exemption clauses regarding both worktime or tonnages to prevent bark beetle infestations. Further process optimization could be achieved by shorter process times, business process reengineering, learning curve or staggered shifts.
The results were obtained for rail terminal configurations that are typical for Austria’s mountainous regions. Due to limited space there is usually only a single, short loading track for transhipping wood to few wagons. Therefore, developed measures and strategies cannot be generalized for conditions where rail terminal have more than one loading track and provide space for a whole block train as is common in other countries. Another important restriction is the one-way truck driving route within the rail terminal, which provides no possibility for passing, since this causes trucks to queue up. In order to support a detailed planning for similar rail terminal configurations, main input parameters of the simulation model such as legal payload for trucks and wagons need to be adapted. If these restrictions apply, the general findings can be transferred to provide support for basic contingency planning in other regions of the world.
For the purpose of discussing the findings in a broader scientific context, it is vital to mention that there are also DES studies, which concentrate on specific parts of the wood supply chain such as harvesting [22] and log yard logistics at industry sites [23,24]. These studies consider in greater detail modules for harvesting and industry site management. However, the simulation model of this study concentrates on the logistics of the wood supply chain and thus connects the initial harvesting and final industry consumption of those studies [22,23,24]. Furthermore, impacts of climate change and risks were simulated on a higher abstraction level with other methods for upstream processes such as primal tree planting, forest stand growths, and forest management, but the studies did not focus on supply chain management and wood logistic [25,26,27,28]. Others simulated wood supply chains and pointed out the resulting outcomes of risks such as raw material availability and quality [19], quality loss during storage [29], and oversupply [13,14], but did not focus on concrete contingency strategies and plans to give operative decision support to manage those risks. In the past, many studies observed biomass supply chains and concentrated on logistics for in-wood operations [30,31] and there are also contributions for moisture content reduction during in-wood storage for wood biomass feedstock [32], but they did not focus on discrete event simulation nor on multimodal timber transport.
In order to enable short-term contingency planning for multimodal wood supply chains, the terminal and queuing processes need to be modeled in detail. In a recent review [33], the simulation model of Kogler and Rauch 2019 [15] was described as “perhaps the most detailed railroad terminal study to date for the wood supply chain” (i.e., presumable Acuna et al. [33] accidentally interchanged the references of [10] and [15] in their paper). For this study, that model was further developed to cover identified sensible factors, as well as various scenario designs, KPIs, and strategies to provide robust results for a variety of small scale train terminals with different delivery times, train pick-ups, and tonnages. This was supported by comprehensive business process mapping and reengineering, which was also heavily used for other detailed DES studies in the wood supply chain [34,35].
The results indicate in line with Korpinen et al. [36] that higher truck transport tonnages provide potential to reduce truck trips and thus, transport costs and emissions. However, for political discourse further factors such as potential shifts from rail to road, traffic intensity, social compatibility, technical reliability, and unified competition regulations in the European Union have to be taken into consideration. In accordance with Eliasson et al. [37] emphasis was put on observing the impacts of transport distance, number of trucks in the system, and stockyards. Contrary to Eliasson et al. [37] staggered truck shifts were not implemented in this study, rather, truck shifts were coordinated with train schedules to guarantee high utilization. A potential for improvement could be the modeling of wood value loss during long lead times and the implementation of different delivery strategies [29]. Next to advantages such as buffer capacity and saved emission, terminals also show disadvantages such as higher costs, which were accordingly discussed for the wood assortment chips [38]. Managerial options such as staggered shifts, or targeted use of over-time working were not considered in this study but provide promising opportunities for further research. Another future approach is to focus on the modeling and management of log quality deterioration and the resulting wood value loss, caused by challenging transport (e.g., long lead times), as well as storage (e.g., weather, temperature) conditions.
5. Conclusions
The management of wood supply chains is a complex task facing many challenges such as decreasing forest truck transport capacity, lack of digitalization, and increasing risks of natural calamities due to climate change. The transhipment of wood from trucks to trains at terminals offers important strategy options and operational advantages including additional transport capacity, shorter truck queuing times at industrial sites, and reduced CO2 emissions. Moreover, fewer bottlenecks caused by the limited availability of forest trucks equipped with cranes occur, since trucks are deployed on indispensible short-distance wood transport from forest landings to terminals rather than long trips to industry.
Simulation provides powerful methods to cover dynamic and interdependent changes and analyze bottlenecks and queuing times to support advanced short-term contingency planning. Consequently, this study introduced a toolbox consisting of a discrete event simulation model set up for analyses on an operational level, strategies to cope with challenging business cases, as well as transport templates and tables including critical parameters, decision variables, and KPIs to facilitate contingency planning.
Identified critical factors such as the number of wagons and trucks in the system, terminal transhipment volume, required terminal stockyard, average and maximal queuing times at the terminal, truck and train utilization, as well as worktime coordination provide useful decision support for a variety of objectives. The multiobjective transport planning strategy BEST FIT provides robust solutions which save truck and train resources, as well as keep the transhipment volume on a high and the stockyard and queuing time on a low level.
Furthermore, different planning conditions such as the number of train pick-ups, the delivery time from forest to industry (i.e., resulting in different number of truck trips per day), as well as the truck transport tonnage (i.e., varies between regions or due to exemption clauses) influence contingency plans. Thus, the transport templates presented provide a sound overview of beneficial (i.e., high truck and wagon utilization) solutions to compare alternatives and support developing customized plans. The results supported contingency planning in common business cases such as restricted wagon or truck availability, defined delivery quota, terminal selection, inventory accumulation, and queuing time reduction.
The simulation model provided a variety of supply chain configurations outcomes of decisions before real, costly, and wide-ranging changes have to be made. Consequently, simulation results provided a well performing configuration which can be fine-tuned in real life business and contingency cases. For example, the permission granted for higher truck transport tonnages (e.g., after natural calamities) was evaluated as a potential means to reduce truck trips.
Author Contributions
Both co-authors participated in conceptualization, validation, investigation, resources, data curation, funding acquisition, review and editing; C.K., methodology, formal analysis, software, writing—original draft preparation, and visualization; P.R., supervision and project administration. All authors have read and agreed to the published version of the manuscript.
Funding
The authors gratefully acknowledge that this research was funded within the collective research project THEKLA by the Austrian Research Promotion Agency (FFG) and the forest, wood, and paper industry consortium (FHP). The Austrian Marshall Plan foundation and the Austrian Forschungsgemeinschaft (ÖFG) supported the authoring of the article by sponsoring a research stay at the UC-Berkeley. Open access funding provided by BOKU Vienna Open Access Publishing Fund.
Conflicts of Interest
The authors declare no conflict of interest.
Appendix A

Table A1.
Terminal transport template for one train pick-up, short delivery time, and all tonnages (P1D1 T1/2/3).
Table A1.
Terminal transport template for one train pick-up, short delivery time, and all tonnages (P1D1 T1/2/3).
| Wagons | Trucks | Terminal Transhipment Volume 1 | Required TERMINAL Stockyard 1 | Average Queuing Time 2 | Maximal Queuing Time 2 | Half loaded Train Wagons 3 | Reduced Truck Trips 3 | |||||||||||
|---|---|---|---|---|---|---|---|---|---|---|---|---|---|---|---|---|---|---|
| T1 | T2 | T3 | T1 | T2 | T3 | T1 | T2 | T3 | T1 | T2 | T3 | T1 | T2 | T3 | T2 | T3 | ||
| 1 | 1 | 230 | 270 | 290 | 120 | 130 | 140 | 10 | 0 | 0 | 60 | 0 | 60 | 0 | 0 | 0 | 4 | 7 |
| 1 | 2 | 230 | 260 | 290 | 590 | 660 | 660 | 10 | 10 | 20 | 110 | 120 | 120 | 0 | 0 | 0 | 8 | 11 |
| 1 | 3 | 240 | 260 | 280 | 950 | 1060 | 1110 | 20 | 20 | 20 | 120 | 130 | 130 | 0 | 0 | 0 | 11 | 17 |
| 1 | 4 | 240 | 260 | 280 | 1310 | 1470 | 1560 | 20 | 20 | 30 | 130 | 140 | 130 | 0 | 0 | 0 | 15 | 24 |
| 1 | 5 | 240 | 260 | 290 | 1670 | 1870 | 2010 | 30 | 30 | 30 | 140 | 140 | 140 | 0 | 0 | 0 | 18 | 33 |
| 2 | 2 | 450 | 530 | 590 | 240 | 270 | 250 | 10 | 0 | 0 | 80 | 60 | 60 | 0 | 0 | 0 | 9 | 13 |
| 2 | 3 | 490 | 530 | 570 | 710 | 760 | 750 | 10 | 10 | 10 | 110 | 120 | 110 | 0 | 0 | 0 | 8 | 10 |
| 2 | 4 | 470 | 530 | 590 | 1190 | 1310 | 1290 | 10 | 10 | 20 | 110 | 120 | 130 | 0 | 0 | 0 | 15 | 18 |
| 2 | 5 | 470 | 530 | 590 | 1550 | 1710 | 1740 | 20 | 20 | 20 | 120 | 130 | 130 | 0 | 0 | 0 | 18 | 26 |
| 3 | 2 | 710 | 790 | 880 | 0 | 0 | 0 | 10 | 10 | 20 | 70 | 70 | 70 | 0 | 0 | 0 | 7 | 14 |
| 3 | 3 | 730 | 790 | 880 | 360 | 400 | 360 | 10 | 0 | 0 | 70 | 60 | 60 | 0 | 0 | 0 | 8 | 13 |
| 3 | 4 | 700 | 770 | 880 | 830 | 850 | 890 | 10 | 10 | 10 | 110 | 120 | 70 | 0 | 0 | 0 | 8 | 20 |
| 3 | 5 | 700 | 760 | 880 | 1300 | 1390 | 1380 | 10 | 10 | 20 | 110 | 120 | 120 | 0 | 0 | 0 | 13 | 22 |
| 3 | 6 | 730 | 790 | 880 | 1780 | 1940 | 1900 | 10 | 20 | 20 | 110 | 120 | 130 | 0 | 0 | 0 | 18 | 23 |
| 3 | 7 | 710 | 790 | 910 | 2140 | 2340 | 2360 | 20 | 20 | 20 | 120 | 130 | 130 | 0 | 0 | 0 | 23 | 35 |
| 3 | 8 | 700 | 790 | 880 | 2480 | 2740 | 2760 | 20 | 20 | 30 | 130 | 140 | 140 | 0 | 0 | 0 | 29 | 38 |
| 3 | 9 | 710 | 820 | 880 | 2780 | 3070 | 3210 | 30 | 30 | 30 | 130 | 140 | 130 | 0 | 0 | 0 | 33 | 50 |
| 3 | 10 | 700 | 820 | 880 | 3210 | 3500 | 3620 | 20 | 30 | 30 | 130 | 140 | 140 | 0 | 0 | 0 | 34 | 49 |
| 4 | 3 | 940 | 1060 | 1170 | 0 | 0 | 0 | 10 | 20 | 20 | 80 | 110 | 90 | 0 | 0 | 0 | 10 | 19 |
| 4 | 4 | 940 | 1060 | 1170 | 480 | 530 | 440 | 10 | 0 | 10 | 80 | 60 | 90 | 0 | 0 | 0 | 14 | 16 |
| 4 | 5 | 940 | 1020 | 1180 | 940 | 940 | 1000 | 10 | 10 | 10 | 110 | 110 | 70 | 0 | 0 | 0 | 7 | 25 |
| 4 | 6 | 940 | 1020 | 1180 | 1410 | 1430 | 1490 | 10 | 10 | 10 | 120 | 120 | 100 | 0 | 0 | 0 | 8 | 27 |
| 4 | 7 | 940 | 1060 | 1180 | 1900 | 2000 | 2000 | 10 | 20 | 20 | 120 | 120 | 120 | 0 | 0 | 0 | 18 | 28 |
| 4 | 8 | 940 | 1060 | 1170 | 2300 | 2480 | 2490 | 20 | 20 | 20 | 130 | 130 | 130 | 0 | 0 | 0 | 25 | 35 |
| 4 | 9 | 980 | 1060 | 1130 | 2610 | 2830 | 2920 | 20 | 20 | 20 | 130 | 140 | 130 | 0 | 0 | 0 | 25 | 38 |
| 4 | 10 | 940 | 1020 | 1180 | 2870 | 3160 | 3270 | 30 | 30 | 30 | 150 | 140 | 140 | 0 | 0 | 0 | 31 | 53 |
| 4 | 11 | 940 | 1090 | 1170 | 3350 | 3630 | 3730 | 20 | 20 | 30 | 130 | 150 | 150 | 0 | 0 | 0 | 36 | 51 |
| 5 | 4 | 1220 | 1320 | 1470 | 0 | 0 | 0 | 20 | 20 | 20 | 90 | 90 | 110 | 0 | 0 | 0 | 8 | 21 |
| 5 | 5 | 1130 | 1330 | 1470 | 600 | 660 | 540 | 10 | 0 | 10 | 80 | 60 | 70 | 0 | 0 | 0 | 22 | 23 |
| 5 | 6 | 1170 | 1370 | 1470 | 1060 | 1070 | 1090 | 10 | 10 | 10 | 120 | 70 | 70 | 0 | 0 | 0 | 18 | 28 |
| 5 | 7 | 1170 | 1320 | 1470 | 1540 | 1510 | 1630 | 10 | 10 | 10 | 110 | 110 | 80 | 0 | 0 | 0 | 10 | 33 |
| 5 | 8 | 1180 | 1320 | 1420 | 1880 | 2020 | 2070 | 20 | 20 | 20 | 120 | 120 | 120 | 0 | 0 | 0 | 23 | 36 |
| 5 | 9 | 1170 | 1320 | 1470 | 2320 | 2480 | 2550 | 20 | 20 | 20 | 120 | 130 | 130 | 0 | 0 | 0 | 26 | 44 |
| 5 | 10 | 1170 | 1320 | 1470 | 2670 | 2920 | 2960 | 30 | 30 | 30 | 130 | 140 | 140 | 0 | 0 | 0 | 33 | 49 |
| 5 | 11 | 1170 | 1320 | 1510 | 2920 | 3210 | 3300 | 30 | 30 | 30 | 140 | 130 | 150 | 0 | 0 | 0 | 37 | 60 |
| 5 | 12 | 1120 | 1320 | 1420 | 3340 | 3680 | 3850 | 30 | 30 | 30 | 130 | 150 | 140 | 0 | 0 | 0 | 45 | 68 |
| 6 | 4 | 1350 | 1620 | 1740 | 0 | 0 | 0 | 20 | 20 | 20 | 120 | 140 | 120 | 0 | 0 | 0 | 23 | 33 |
| 6 | 5 | 1410 | 1580 | 1700 | 20 | 0 | 0 | 20 | 20 | 30 | 160 | 130 | 130 | 0 | 0 | 0 | 13 | 23 |
| 6 | 6 | 1410 | 1580 | 1770 | 720 | 770 | 620 | 10 | 0 | 10 | 70 | 60 | 70 | 0 | 0 | 0 | 18 | 22 |
| 6 | 7 | 1410 | 1580 | 1830 | 1170 | 1200 | 1190 | 10 | 10 | 10 | 120 | 70 | 70 | 0 | 0 | 0 | 17 | 37 |
| 6 | 8 | 1410 | 1580 | 1760 | 1560 | 1590 | 1690 | 20 | 10 | 10 | 130 | 100 | 110 | 0 | 0 | 0 | 17 | 40 |
| 6 | 9 | 1410 | 1580 | 1820 | 1940 | 1990 | 2090 | 20 | 20 | 20 | 140 | 140 | 90 | 0 | 0 | 0 | 18 | 47 |
| 6 | 10 | 1350 | 1590 | 1690 | 2310 | 2450 | 2450 | 30 | 20 | 30 | 130 | 140 | 140 | 0 | 0 | 0 | 32 | 40 |
| 6 | 11 | 1410 | 1580 | 1760 | 2650 | 2890 | 2820 | 30 | 30 | 30 | 140 | 150 | 140 | 0 | 0 | 0 | 34 | 43 |
| 6 | 12 | 1470 | 1590 | 1750 | 3000 | 3300 | 3320 | 30 | 30 | 40 | 140 | 140 | 150 | 0 | 0 | 0 | 35 | 50 |
| 6 | 13 | 1410 | 1520 | 1700 | 3340 | 3730 | 3990 | 30 | 30 | 30 | 140 | 130 | 140 | 0 | 0 | 0 | 42 | 78 |
| 6 | 14 | 1350 | 1580 | 1760 | 3580 | 3890 | 4320 | 40 | 30 | 30 | 190 | 140 | 140 | 0 | 0 | 0 | 45 | 96 |
| 7 | 5 | 1630 | 1850 | 2120 | 0 | 0 | 0 | 20 | 20 | 30 | 130 | 160 | 150 | 0 | 0 | 0 | 18 | 41 |
| 7 | 6 | 1640 | 1850 | 2050 | 50 | 0 | 0 | 20 | 40 | 30 | 120 | 140 | 130 | 0 | 0 | 0 | 13 | 30 |
| 7 | 7 | 1710 | 1850 | 1990 | 830 | 890 | 680 | 10 | 0 | 10 | 80 | 60 | 110 | 0 | 0 | 0 | 17 | 11 |
| 7 | 8 | 1640 | 1910 | 2060 | 1230 | 1300 | 1270 | 10 | 10 | 10 | 130 | 100 | 110 | 0 | 0 | 0 | 28 | 38 |
| 7 | 9 | 1640 | 1910 | 2050 | 1680 | 1640 | 1740 | 20 | 10 | 10 | 130 | 120 | 130 | 0 | 0 | 0 | 19 | 39 |
| 7 | 10 | 1570 | 1850 | 2050 | 2060 | 2050 | 2200 | 20 | 20 | 20 | 140 | 130 | 130 | 0 | 0 | 0 | 23 | 52 |
| 7 | 11 | 1570 | 1850 | 2060 | 2430 | 2470 | 2560 | 20 | 20 | 20 | 150 | 140 | 140 | 0 | 0 | 0 | 27 | 52 |
| 7 | 12 | 1640 | 1850 | 2060 | 2760 | 2910 | 2900 | 30 | 30 | 30 | 140 | 140 | 140 | 0 | 0 | 0 | 30 | 47 |
| 7 | 13 | 1650 | 1850 | 1990 | 3080 | 3340 | 3400 | 30 | 30 | 30 | 140 | 140 | 150 | 0 | 0 | 0 | 38 | 55 |
| 7 | 14 | 1640 | 1850 | 2060 | 3400 | 3750 | 4160 | 30 | 30 | 20 | 150 | 140 | 130 | 0 | 0 | 0 | 47 | 98 |
| 7 | 15 | 1640 | 1850 | 2130 | 3510 | 3890 | 4320 | 40 | 40 | 30 | 200 | 140 | 140 | 0 | 0 | 0 | 49 | 108 |
| 7 | 16 | 1650 | 1850 | 2050 | 3640 | 4020 | 4460 | 50 | 50 | 40 | 210 | 150 | 140 | 0 | 0 | 0 | 48 | 102 |
1 Average per week in solid cubic meters (rounded to the nearest ten). 2 In minutes (rounded to the nearest ten). 3 Average quantity per week.
Table A2.
Terminal transport template for one train pick-up, medium delivery time, and all tonnages (P1D2 T1/2/3).
Table A2.
Terminal transport template for one train pick-up, medium delivery time, and all tonnages (P1D2 T1/2/3).
| Wagons | Trucks | Terminal Transhipment Volume 1 | Required Terminal Stockyard 1 | Average Queuing Time 2 | Maximal Queuing Time 2 | Half Loaded Train Wagons 3 | Reduced Truck Trips 3 | |||||||||||
|---|---|---|---|---|---|---|---|---|---|---|---|---|---|---|---|---|---|---|
| T1 | T2 | T3 | T1 | T2 | T3 | T1 | T2 | T3 | T1 | T2 | T3 | T1 | T2 | T3 | T2 | T3 | ||
| 1 | 1 | 230 | 260 | 290 | 0 | 0 | 0 | 0 | 0 | 0 | 70 | 70 | 70 | 0 | 0 | 0 | 3 | 5 |
| 1 | 2 | 240 | 260 | 290 | 280 | 270 | 300 | 10 | 10 | 10 | 70 | 70 | 70 | 0 | 0 | 0 | 1 | 6 |
| 1 | 3 | 240 | 260 | 300 | 540 | 540 | 600 | 10 | 10 | 10 | 80 | 130 | 80 | 0 | 0 | 0 | 2 | 10 |
| 1 | 4 | 230 | 260 | 290 | 800 | 820 | 890 | 10 | 10 | 10 | 80 | 150 | 130 | 0 | 0 | 0 | 4 | 13 |
| 1 | 5 | 250 | 260 | 280 | 1070 | 1100 | 1190 | 10 | 10 | 10 | 120 | 80 | 130 | 0 | 0 | 0 | 3 | 13 |
| 2 | 1 | 240 | 260 | 300 | 0 | 0 | 0 | 0 | 0 | 0 | 70 | 0 | 70 | 0 | 0 | 0 | 2 | 5 |
| 2 | 2 | 470 | 530 | 570 | 0 | 0 | 0 | 0 | 0 | 0 | 70 | 70 | 70 | 0 | 0 | 0 | 5 | 8 |
| 2 | 3 | 470 | 530 | 590 | 270 | 270 | 240 | 10 | 10 | 10 | 70 | 70 | 70 | 0 | 0 | 0 | 5 | 8 |
| 2 | 4 | 470 | 530 | 590 | 530 | 540 | 600 | 10 | 10 | 10 | 70 | 70 | 70 | 0 | 0 | 0 | 6 | 16 |
| 2 | 5 | 450 | 530 | 590 | 770 | 810 | 890 | 10 | 10 | 10 | 70 | 80 | 80 | 0 | 0 | 0 | 10 | 22 |
| 3 | 1 | 250 | 260 | 300 | 0 | 0 | 0 | 0 | 0 | 0 | 70 | 70 | 70 | 0 | 0 | 0 | 1 | 4 |
| 3 | 2 | 480 | 530 | 590 | 0 | 0 | 0 | 10 | 10 | 10 | 70 | 70 | 70 | 0 | 0 | 0 | 4 | 9 |
| 3 | 3 | 680 | 790 | 880 | 0 | 0 | 0 | 0 | 0 | 0 | 70 | 70 | 80 | 0 | 0 | 0 | 9 | 17 |
| 3 | 4 | 710 | 790 | 910 | 240 | 230 | 140 | 10 | 0 | 0 | 70 | 70 | 70 | 0 | 0 | 0 | 6 | 8 |
| 3 | 5 | 710 | 790 | 880 | 530 | 530 | 550 | 10 | 10 | 10 | 70 | 70 | 80 | 0 | 0 | 0 | 7 | 16 |
| 3 | 6 | 700 | 790 | 880 | 770 | 810 | 890 | 10 | 10 | 10 | 80 | 80 | 80 | 0 | 0 | 0 | 11 | 25 |
| 3 | 7 | 710 | 790 | 880 | 1020 | 1080 | 1190 | 10 | 10 | 10 | 80 | 80 | 90 | 0 | 0 | 0 | 12 | 28 |
| 3 | 8 | 700 | 790 | 880 | 1270 | 1350 | 1490 | 10 | 10 | 10 | 80 | 150 | 150 | 0 | 0 | 0 | 14 | 33 |
| 3 | 9 | 700 | 790 | 880 | 1540 | 1630 | 1790 | 10 | 10 | 10 | 90 | 80 | 90 | 0 | 0 | 0 | 15 | 36 |
| 3 | 10 | 680 | 820 | 880 | 1830 | 1900 | 2090 | 10 | 20 | 20 | 90 | 140 | 150 | 0 | 0 | 0 | 18 | 38 |
| 4 | 2 | 500 | 530 | 590 | 0 | 0 | 0 | 0 | 0 | 0 | 70 | 70 | 70 | 10 | 10 | 10 | 3 | 8 |
| 4 | 3 | 750 | 760 | 910 | 0 | 0 | 0 | 10 | 10 | 10 | 80 | 80 | 80 | 0 | 0 | 0 | 1 | 13 |
| 4 | 4 | 940 | 1060 | 1210 | 0 | 0 | 0 | 0 | 0 | 0 | 70 | 70 | 80 | 0 | 0 | 0 | 10 | 23 |
| 4 | 5 | 940 | 1020 | 1180 | 220 | 210 | 20 | 10 | 0 | 0 | 80 | 70 | 70 | 0 | 0 | 0 | 6 | 3 |
| 4 | 6 | 940 | 1060 | 1170 | 510 | 510 | 440 | 10 | 0 | 10 | 70 | 80 | 80 | 0 | 0 | 0 | 10 | 13 |
| 4 | 7 | 940 | 1060 | 1170 | 780 | 800 | 850 | 10 | 10 | 10 | 80 | 90 | 80 | 0 | 0 | 0 | 12 | 25 |
| 4 | 8 | 940 | 1060 | 1170 | 1020 | 1070 | 1180 | 10 | 10 | 10 | 80 | 80 | 150 | 0 | 0 | 0 | 14 | 33 |
| 4 | 9 | 940 | 1060 | 1170 | 1280 | 1350 | 1470 | 10 | 10 | 10 | 140 | 150 | 150 | 0 | 0 | 0 | 16 | 35 |
| 4 | 10 | 940 | 1060 | 1140 | 1520 | 1630 | 1770 | 10 | 20 | 10 | 110 | 90 | 160 | 0 | 0 | 0 | 19 | 38 |
| 4 | 11 | 940 | 1060 | 1170 | 1770 | 1890 | 2070 | 20 | 20 | 20 | 140 | 140 | 160 | 0 | 0 | 0 | 20 | 44 |
| 5 | 3 | 740 | 800 | 880 | 0 | 0 | 0 | 10 | 0 | 0 | 80 | 70 | 70 | 10 | 10 | 10 | 5 | 12 |
| 5 | 4 | 950 | 1060 | 1170 | 0 | 0 | 0 | 10 | 10 | 10 | 80 | 80 | 80 | 0 | 0 | 0 | 9 | 18 |
| 5 | 5 | 1170 | 1270 | 1470 | 0 | 0 | 0 | 10 | 10 | 10 | 100 | 80 | 90 | 0 | 0 | 0 | 8 | 25 |
| 5 | 6 | 1180 | 1320 | 1470 | 190 | 130 | 0 | 0 | 0 | 0 | 70 | 80 | 100 | 0 | 0 | 0 | 7 | 8 |
| 5 | 7 | 1170 | 1270 | 1470 | 500 | 490 | 310 | 10 | 0 | 10 | 70 | 80 | 80 | 0 | 0 | 0 | 8 | 9 |
| 5 | 8 | 1220 | 1270 | 1460 | 770 | 780 | 730 | 10 | 10 | 10 | 80 | 100 | 90 | 0 | 0 | 0 | 5 | 17 |
| 5 | 9 | 1170 | 1320 | 1470 | 1020 | 1070 | 1090 | 10 | 10 | 10 | 80 | 140 | 90 | 0 | 0 | 0 | 17 | 31 |
| 5 | 10 | 1120 | 1320 | 1480 | 1270 | 1340 | 1410 | 10 | 10 | 10 | 100 | 100 | 100 | 0 | 0 | 0 | 23 | 42 |
| 5 | 11 | 1180 | 1320 | 1420 | 1510 | 1620 | 1660 | 20 | 20 | 20 | 110 | 140 | 100 | 0 | 0 | 0 | 21 | 33 |
| 5 | 12 | 1170 | 1320 | 1520 | 1760 | 1890 | 1970 | 20 | 20 | 20 | 100 | 140 | 160 | 0 | 0 | 0 | 23 | 47 |
| 6 | 4 | 950 | 1060 | 1170 | 0 | 0 | 0 | 10 | 0 | 0 | 80 | 80 | 80 | 10 | 10 | 10 | 9 | 18 |
| 6 | 5 | 1180 | 1330 | 1420 | 0 | 0 | 0 | 20 | 20 | 20 | 90 | 90 | 90 | 0 | 0 | 0 | 13 | 20 |
| 6 | 6 | 1350 | 1650 | 1760 | 0 | 0 | 0 | 20 | 20 | 20 | 90 | 90 | 90 | 0 | 0 | 0 | 25 | 34 |
| 6 | 7 | 1410 | 1640 | 1770 | 160 | 60 | 0 | 0 | 0 | 10 | 70 | 80 | 100 | 0 | 0 | 0 | 11 | 17 |
| 6 | 8 | 1410 | 1530 | 1760 | 500 | 430 | 150 | 10 | 10 | 10 | 100 | 90 | 90 | 0 | 0 | 0 | 4 | 0 |
| 6 | 9 | 1410 | 1580 | 1820 | 770 | 760 | 530 | 10 | 10 | 10 | 80 | 100 | 90 | 0 | 0 | 0 | 13 | 14 |
| 6 | 10 | 1350 | 1590 | 1750 | 1020 | 1050 | 900 | 10 | 10 | 10 | 120 | 100 | 100 | 0 | 0 | 0 | 23 | 23 |
| 6 | 11 | 1350 | 1580 | 1770 | 1250 | 1320 | 1250 | 20 | 10 | 20 | 110 | 110 | 110 | 0 | 0 | 0 | 25 | 35 |
| 6 | 12 | 1470 | 1520 | 1760 | 1500 | 1600 | 1540 | 20 | 20 | 20 | 110 | 170 | 180 | 0 | 0 | 0 | 13 | 28 |
| 6 | 13 | 1410 | 1590 | 1760 | 1750 | 1870 | 1810 | 20 | 20 | 20 | 160 | 160 | 180 | 0 | 0 | 0 | 25 | 34 |
| 6 | 14 | 1410 | 1590 | 1760 | 1980 | 2130 | 2080 | 30 | 20 | 30 | 160 | 170 | 170 | 0 | 0 | 0 | 28 | 38 |
| 7 | 5 | 1190 | 1320 | 1470 | 0 | 0 | 0 | 10 | 10 | 10 | 90 | 80 | 80 | 10 | 10 | 10 | 11 | 23 |
| 7 | 6 | 1420 | 1580 | 1760 | 0 | 0 | 0 | 20 | 20 | 10 | 90 | 90 | 90 | 0 | 0 | 0 | 13 | 28 |
| 7 | 7 | 1640 | 1850 | 2060 | 0 | 0 | 0 | 30 | 30 | 30 | 110 | 110 | 90 | 0 | 0 | 0 | 18 | 35 |
| 7 | 8 | 1650 | 1850 | 2040 | 160 | 20 | 0 | 10 | 10 | 10 | 80 | 120 | 100 | 0 | 0 | 0 | 5 | 19 |
| 7 | 9 | 1640 | 1850 | 2050 | 480 | 380 | 20 | 10 | 10 | 10 | 100 | 100 | 100 | 0 | 0 | 0 | 9 | 0 |
| 7 | 10 | 1640 | 1910 | 1980 | 770 | 710 | 430 | 10 | 10 | 10 | 100 | 100 | 150 | 0 | 0 | 0 | 18 | 0 |
| 7 | 11 | 1650 | 1850 | 2060 | 1020 | 1010 | 760 | 10 | 10 | 10 | 110 | 100 | 170 | 0 | 0 | 0 | 16 | 13 |
| 7 | 12 | 1570 | 1850 | 2120 | 1260 | 1300 | 1100 | 20 | 10 | 20 | 110 | 120 | 100 | 0 | 0 | 0 | 27 | 33 |
| 7 | 13 | 1640 | 1780 | 2060 | 1490 | 1570 | 1430 | 20 | 20 | 20 | 170 | 170 | 170 | 0 | 0 | 0 | 18 | 30 |
| 7 | 14 | 1570 | 1850 | 1980 | 1740 | 1830 | 1690 | 20 | 20 | 30 | 160 | 170 | 190 | 0 | 0 | 0 | 31 | 30 |
| 7 | 15 | 1640 | 1850 | 2050 | 1970 | 2080 | 1960 | 30 | 30 | 30 | 170 | 180 | 180 | 0 | 0 | 0 | 27 | 33 |
| 7 | 16 | 1640 | 1850 | 2120 | 2200 | 2350 | 2220 | 30 | 30 | 40 | 180 | 170 | 190 | 0 | 0 | 0 | 30 | 42 |
1 Average per week in solid cubic meters (rounded to the nearest ten). 2 In minutes (rounded to the nearest ten). 3 Average quantity per week.
Table A3.
Terminal transport template for one train pick-up, long delivery time, and all tonnages (P1D3 T1/2/3).
Table A3.
Terminal transport template for one train pick-up, long delivery time, and all tonnages (P1D3 T1/2/3).
| Wagons | Trucks | Terminal Transhipment Volume 1 | Required Terminal Stockyard 1 | Average Queuing Time 2 | Maximal Queuing Time 2 | Half Loaded Train Wagons 3 | Reduced Truck Trips 3 | |||||||||||
|---|---|---|---|---|---|---|---|---|---|---|---|---|---|---|---|---|---|---|
| T1 | T2 | T3 | T1 | T2 | T3 | T1 | T2 | T3 | T1 | T2 | T3 | T1 | T2 | T3 | T2 | T3 | ||
| 1 | 2 | 230 | 260 | 300 | 80 | 30 | 10 | 50 | 60 | 70 | 110 | 110 | 110 | 0 | 0 | 0 | 0 | 0 |
| 1 | 3 | 230 | 260 | 290 | 190 | 160 | 150 | 70 | 80 | 80 | 120 | 130 | 130 | 0 | 0 | 0 | 0 | 2 |
| 1 | 4 | 240 | 260 | 290 | 320 | 310 | 300 | 70 | 80 | 90 | 120 | 130 | 130 | 0 | 0 | 0 | 1 | 3 |
| 1 | 5 | 230 | 260 | 290 | 440 | 430 | 450 | 80 | 90 | 90 | 120 | 130 | 130 | 0 | 0 | 0 | 2 | 6 |
| 2 | 3 | 440 | 430 | 450 | 0 | 0 | 0 | 40 | 50 | 60 | 110 | 110 | 110 | 0 | 0 | 0 | 0 | 1 |
| 2 | 4 | 470 | 530 | 590 | 130 | 50 | 0 | 60 | 70 | 70 | 110 | 120 | 120 | 0 | 0 | 0 | 0 | 0 |
| 2 | 5 | 470 | 530 | 590 | 260 | 170 | 160 | 60 | 80 | 80 | 120 | 130 | 130 | 0 | 0 | 0 | 0 | 2 |
| 3 | 5 | 660 | 700 | 740 | 0 | 0 | 0 | 50 | 60 | 70 | 110 | 120 | 120 | 0 | 0 | 0 | 3 | 7 |
| 3 | 6 | 730 | 790 | 880 | 170 | 50 | 10 | 60 | 70 | 70 | 120 | 120 | 120 | 0 | 0 | 0 | 0 | 0 |
| 3 | 7 | 700 | 760 | 880 | 290 | 180 | 150 | 70 | 80 | 80 | 130 | 130 | 130 | 0 | 0 | 0 | 0 | 3 |
| 3 | 8 | 700 | 790 | 850 | 400 | 310 | 300 | 70 | 80 | 90 | 130 | 130 | 140 | 0 | 0 | 0 | 0 | 4 |
| 3 | 9 | 730 | 790 | 880 | 510 | 440 | 450 | 80 | 90 | 90 | 130 | 140 | 140 | 0 | 0 | 0 | 0 | 8 |
| 3 | 10 | 710 | 790 | 880 | 630 | 580 | 600 | 80 | 90 | 90 | 140 | 140 | 150 | 0 | 0 | 0 | 3 | 12 |
| 4 | 5 | 730 | 740 | 740 | 0 | 0 | 0 | 40 | 50 | 60 | 110 | 110 | 110 | 0 | 10 | 10 | 1 | 1 |
| 4 | 6 | 850 | 860 | 890 | 0 | 0 | 0 | 50 | 60 | 60 | 110 | 120 | 120 | 0 | 0 | 0 | 1 | 3 |
| 4 | 7 | 930 | 960 | 1040 | 0 | 0 | 0 | 60 | 70 | 70 | 120 | 130 | 130 | 0 | 0 | 0 | 3 | 9 |
| 4 | 8 | 940 | 1060 | 1170 | 180 | 60 | 10 | 60 | 70 | 80 | 120 | 130 | 130 | 0 | 0 | 0 | 0 | 5 |
| 4 | 9 | 980 | 1060 | 1170 | 290 | 190 | 150 | 70 | 80 | 80 | 140 | 150 | 150 | 0 | 0 | 0 | 0 | 4 |
| 4 | 10 | 980 | 1020 | 1210 | 420 | 320 | 300 | 70 | 80 | 90 | 140 | 150 | 150 | 0 | 0 | 0 | 0 | 9 |
| 4 | 11 | 940 | 1060 | 1130 | 540 | 440 | 450 | 80 | 90 | 90 | 150 | 150 | 150 | 0 | 0 | 0 | 2 | 8 |
| 5 | 6 | 910 | 830 | 910 | 0 | 0 | 0 | 40 | 50 | 50 | 110 | 110 | 110 | 10 | 10 | 10 | 0 | 0 |
| 5 | 7 | 980 | 1000 | 990 | 0 | 0 | 0 | 50 | 60 | 60 | 120 | 120 | 120 | 0 | 10 | 10 | 2 | 1 |
| 5 | 8 | 1100 | 1140 | 1180 | 0 | 0 | 0 | 50 | 70 | 70 | 120 | 130 | 130 | 0 | 0 | 0 | 3 | 7 |
| 5 | 9 | 1170 | 1230 | 1320 | 0 | 0 | 0 | 60 | 70 | 80 | 130 | 140 | 140 | 0 | 0 | 0 | 5 | 13 |
| 5 | 10 | 1170 | 1270 | 1470 | 180 | 40 | 10 | 70 | 80 | 80 | 140 | 140 | 140 | 0 | 0 | 0 | 0 | 11 |
| 5 | 11 | 1170 | 1370 | 1470 | 330 | 180 | 150 | 70 | 80 | 90 | 140 | 150 | 150 | 0 | 0 | 0 | 4 | 10 |
| 5 | 12 | 1180 | 1310 | 1470 | 430 | 320 | 300 | 80 | 90 | 90 | 150 | 150 | 160 | 0 | 0 | 0 | 2 | 13 |
| 6 | 9 | 1210 | 1230 | 1320 | 0 | 0 | 0 | 60 | 70 | 70 | 140 | 140 | 140 | 0 | 10 | 10 | 2 | 9 |
| 6 | 10 | 1320 | 1360 | 1470 | 0 | 0 | 0 | 60 | 70 | 80 | 140 | 140 | 150 | 0 | 0 | 0 | 3 | 13 |
| 6 | 11 | 1400 | 1490 | 1620 | 0 | 0 | 0 | 70 | 80 | 80 | 150 | 140 | 140 | 0 | 0 | 0 | 8 | 18 |
| 6 | 12 | 1410 | 1580 | 1760 | 180 | 40 | 0 | 70 | 80 | 90 | 140 | 140 | 140 | 0 | 0 | 0 | 3 | 14 |
| 6 | 13 | 1410 | 1580 | 1760 | 330 | 170 | 150 | 80 | 90 | 90 | 150 | 150 | 150 | 0 | 0 | 0 | 1 | 14 |
| 6 | 14 | 1410 | 1640 | 1770 | 420 | 320 | 300 | 80 | 90 | 100 | 190 | 200 | 200 | 0 | 0 | 0 | 11 | 20 |
| 7 | 10 | 1340 | 1370 | 1470 | 0 | 0 | 0 | 60 | 70 | 70 | 140 | 140 | 140 | 10 | 10 | 10 | 3 | 11 |
| 7 | 11 | 1490 | 1450 | 1620 | 0 | 0 | 0 | 60 | 70 | 80 | 140 | 140 | 150 | 0 | 10 | 10 | 0 | 11 |
| 7 | 12 | 1560 | 1620 | 1760 | 0 | 0 | 0 | 70 | 80 | 80 | 140 | 140 | 140 | 0 | 0 | 0 | 5 | 17 |
| 7 | 13 | 1640 | 1760 | 1910 | 0 | 0 | 0 | 70 | 80 | 80 | 140 | 150 | 150 | 0 | 0 | 0 | 10 | 23 |
| 7 | 14 | 1640 | 1850 | 2050 | 220 | 50 | 10 | 80 | 80 | 90 | 150 | 150 | 150 | 0 | 0 | 0 | 3 | 17 |
| 7 | 15 | 1640 | 1850 | 1990 | 300 | 180 | 150 | 80 | 90 | 100 | 210 | 210 | 220 | 0 | 0 | 0 | 8 | 17 |
| 7 | 16 | 1640 | 1850 | 2060 | 430 | 320 | 300 | 90 | 100 | 100 | 220 | 220 | 230 | 0 | 0 | 0 | 8 | 24 |
1 Average per week in solid cubic meters (rounded to the nearest ten). 2 In minutes (rounded to the nearest ten). 3 Average quantity per week.
Appendix B
Table A4.
Terminal transport template for two train pick-ups, short delivery time, and all tonnages (P2D1 T1/2/3).
Table A4.
Terminal transport template for two train pick-ups, short delivery time, and all tonnages (P2D1 T1/2/3).
| Wagons | Trucks | Terminal Transhipment Volume 1 | Required Terminal Stockyard 1 | Average Queuing Time 2 | Maximal Queuing Time 2 | Half Loaded Train Wagons 3 | Reduced Truck Trips 3 | |||||||||||
|---|---|---|---|---|---|---|---|---|---|---|---|---|---|---|---|---|---|---|
| T1 | T2 | T3 | T1 | T2 | T3 | T1 | T2 | T3 | T1 | T2 | T3 | T1 | T2 | T3 | T2 | T3 | ||
| 1 | 1 | 240 | 270 | 380 | 120 | 120 | 0 | 0 | 0 | 10 | 50 | 60 | 70 | 0 | 0 | 0 | 3 | 2 |
| 1 | 2 | 490 | 530 | 590 | 360 | 390 | 370 | 20 | 10 | 20 | 70 | 120 | 120 | 0 | 0 | 0 | 6 | 9 |
| 1 | 3 | 470 | 530 | 590 | 710 | 800 | 810 | 30 | 30 | 30 | 120 | 140 | 130 | 0 | 0 | 0 | 13 | 18 |
| 1 | 4 | 450 | 530 | 590 | 1070 | 1200 | 1260 | 40 | 40 | 40 | 130 | 130 | 140 | 0 | 0 | 0 | 18 | 28 |
| 1 | 5 | 450 | 530 | 590 | 1430 | 1600 | 1710 | 50 | 40 | 40 | 130 | 140 | 130 | 0 | 0 | 0 | 21 | 35 |
| 2 | 2 | 460 | 820 | 910 | 230 | 0 | 0 | 10 | 10 | 10 | 60 | 70 | 70 | 0 | 0 | 0 | 11 | 18 |
| 2 | 3 | 930 | 880 | 960 | 190 | 320 | 310 | 20 | 20 | 20 | 100 | 100 | 100 | 0 | 0 | 0 | 7 | 13 |
| 2 | 4 | 940 | 1060 | 1170 | 710 | 780 | 700 | 20 | 10 | 20 | 120 | 120 | 120 | 0 | 0 | 0 | 16 | 18 |
| 2 | 5 | 900 | 1060 | 1170 | 1070 | 1170 | 1140 | 30 | 20 | 30 | 120 | 130 | 130 | 0 | 0 | 0 | 22 | 28 |
| 3 | 2 | 830 | 860 | 890 | 0 | 0 | 0 | 10 | 20 | 30 | 80 | 120 | 120 | 0 | 0 | 0 | 3 | 5 |
| 3 | 3 | 810 | 1090 | 1310 | 230 | 20 | 0 | 10 | 10 | 10 | 70 | 70 | 70 | 0 | 10 | 10 | 6 | 23 |
| 3 | 4 | 1310 | 1260 | 1470 | 100 | 260 | 150 | 10 | 20 | 20 | 100 | 100 | 100 | 0 | 10 | 10 | 9 | 18 |
| 3 | 5 | 1330 | 1240 | 1470 | 610 | 790 | 660 | 20 | 20 | 20 | 110 | 120 | 120 | 0 | 10 | 10 | 8 | 16 |
| 3 | 6 | 1360 | 1530 | 1750 | 1070 | 1140 | 1000 | 20 | 10 | 30 | 120 | 120 | 130 | 0 | 0 | 0 | 20 | 27 |
| 3 | 7 | 1410 | 1580 | 1700 | 1430 | 1520 | 1470 | 20 | 20 | 30 | 120 | 130 | 130 | 0 | 0 | 0 | 22 | 28 |
| 3 | 8 | 1410 | 1590 | 1820 | 1770 | 1920 | 1880 | 30 | 30 | 30 | 130 | 130 | 130 | 0 | 0 | 0 | 28 | 43 |
| 3 | 9 | 1410 | 1530 | 1760 | 2070 | 2280 | 2320 | 30 | 30 | 40 | 130 | 130 | 140 | 0 | 0 | 0 | 28 | 50 |
| 3 | 10 | 1420 | 1590 | 1770 | 2500 | 2700 | 2720 | 30 | 30 | 40 | 130 | 140 | 130 | 0 | 0 | 0 | 31 | 48 |
| 4 | 3 | 1170 | 1230 | 1350 | 0 | 0 | 0 | 20 | 20 | 20 | 110 | 80 | 110 | 10 | 10 | 10 | 5 | 15 |
| 4 | 4 | 1030 | 1470 | 1760 | 420 | 20 | 0 | 10 | 10 | 10 | 70 | 70 | 80 | 0 | 10 | 10 | 3 | 26 |
| 4 | 5 | 1600 | 1620 | 1860 | 110 | 230 | 120 | 10 | 10 | 10 | 100 | 100 | 100 | 10 | 10 | 10 | 12 | 23 |
| 4 | 6 | 1770 | 1650 | 1820 | 430 | 760 | 650 | 20 | 20 | 20 | 110 | 110 | 110 | 0 | 10 | 10 | 18 | 23 |
| 4 | 7 | 1830 | 1690 | 1940 | 930 | 1110 | 1050 | 20 | 20 | 20 | 110 | 120 | 120 | 0 | 10 | 10 | 3 | 19 |
| 4 | 8 | 1810 | 2070 | 2310 | 1390 | 1450 | 1320 | 20 | 20 | 30 | 130 | 120 | 130 | 0 | 0 | 0 | 27 | 36 |
| 4 | 9 | 1830 | 2070 | 2340 | 1660 | 1790 | 1730 | 30 | 30 | 30 | 130 | 140 | 140 | 0 | 0 | 0 | 31 | 48 |
| 4 | 10 | 1820 | 2080 | 2430 | 1930 | 2100 | 2110 | 40 | 30 | 30 | 150 | 150 | 140 | 0 | 0 | 0 | 36 | 66 |
| 4 | 11 | 1880 | 2120 | 2350 | 2410 | 2570 | 2550 | 30 | 30 | 30 | 120 | 150 | 140 | 0 | 0 | 0 | 33 | 51 |
| 5 | 4 | 1530 | 1680 | 1790 | 0 | 0 | 0 | 10 | 20 | 20 | 80 | 80 | 100 | 10 | 10 | 10 | 13 | 22 |
| 5 | 5 | 1710 | 1930 | 2270 | 0 | 0 | 0 | 10 | 10 | 20 | 90 | 70 | 90 | 10 | 10 | 10 | 18 | 47 |
| 5 | 6 | 1970 | 2100 | 2260 | 30 | 20 | 10 | 10 | 20 | 10 | 100 | 100 | 100 | 10 | 10 | 10 | 10 | 23 |
| 5 | 7 | 2130 | 2080 | 2320 | 320 | 540 | 510 | 20 | 20 | 20 | 110 | 120 | 110 | 0 | 10 | 10 | 14 | 32 |
| 5 | 8 | 2180 | 2160 | 2400 | 690 | 870 | 870 | 20 | 20 | 20 | 110 | 120 | 120 | 0 | 10 | 10 | 13 | 33 |
| 5 | 9 | 2270 | 2520 | 2690 | 1160 | 1120 | 1130 | 30 | 20 | 30 | 120 | 120 | 120 | 0 | 0 | 0 | 18 | 33 |
| 5 | 10 | 2260 | 2560 | 2910 | 1540 | 1640 | 1470 | 30 | 30 | 30 | 130 | 130 | 150 | 0 | 0 | 0 | 33 | 48 |
| 5 | 11 | 2390 | 2700 | 2940 | 1750 | 1910 | 1810 | 40 | 30 | 40 | 140 | 140 | 150 | 0 | 0 | 0 | 39 | 51 |
| 5 | 12 | 2360 | 2640 | 2940 | 2160 | 2340 | 2370 | 30 | 30 | 30 | 130 | 140 | 130 | 0 | 0 | 0 | 38 | 66 |
| 6 | 4 | 1620 | 1750 | 1770 | 0 | 0 | 0 | 20 | 20 | 30 | 100 | 130 | 110 | 10 | 10 | 10 | 11 | 13 |
| 6 | 5 | 1850 | 2060 | 2220 | 0 | 0 | 0 | 20 | 20 | 20 | 130 | 170 | 130 | 10 | 10 | 10 | 18 | 31 |
| 6 | 6 | 2090 | 2400 | 2640 | 0 | 0 | 0 | 10 | 10 | 20 | 80 | 70 | 100 | 10 | 10 | 10 | 26 | 46 |
| 6 | 7 | 2460 | 2550 | 2920 | 0 | 0 | 0 | 20 | 20 | 20 | 110 | 100 | 150 | 10 | 10 | 10 | 8 | 38 |
| 6 | 8 | 2530 | 2620 | 2800 | 170 | 270 | 240 | 20 | 20 | 20 | 120 | 120 | 130 | 10 | 10 | 10 | 16 | 28 |
| 6 | 9 | 2650 | 2870 | 3090 | 500 | 450 | 540 | 20 | 20 | 20 | 120 | 130 | 130 | 0 | 10 | 10 | 14 | 40 |
| 6 | 10 | 2740 | 2980 | 3510 | 870 | 770 | 730 | 30 | 30 | 30 | 130 | 130 | 130 | 0 | 0 | 0 | 12 | 53 |
| 6 | 11 | 2640 | 3080 | 3440 | 1270 | 1240 | 1070 | 30 | 30 | 40 | 130 | 130 | 130 | 0 | 0 | 0 | 34 | 50 |
| 6 | 12 | 2780 | 3160 | 3400 | 1590 | 1720 | 1540 | 40 | 30 | 30 | 130 | 130 | 140 | 0 | 0 | 0 | 43 | 48 |
| 6 | 13 | 2830 | 3180 | 3540 | 1910 | 2110 | 2210 | 30 | 30 | 30 | 150 | 130 | 130 | 0 | 0 | 0 | 46 | 84 |
| 6 | 14 | 2820 | 3300 | 3530 | 2010 | 2150 | 2380 | 50 | 40 | 40 | 190 | 140 | 140 | 0 | 0 | 0 | 52 | 90 |
| 7 | 5 | 1980 | 2090 | 2220 | 0 | 0 | 0 | 20 | 20 | 30 | 120 | 120 | 130 | 10 | 10 | 10 | 9 | 20 |
| 7 | 6 | 1960 | 2220 | 2580 | 0 | 0 | 0 | 20 | 20 | 30 | 180 | 180 | 160 | 20 | 20 | 10 | 22 | 52 |
| 7 | 7 | 2420 | 2810 | 3060 | 0 | 0 | 0 | 10 | 10 | 20 | 70 | 160 | 160 | 10 | 10 | 10 | 33 | 53 |
| 7 | 8 | 2820 | 3120 | 3250 | 0 | 0 | 0 | 20 | 20 | 20 | 100 | 100 | 140 | 10 | 10 | 10 | 25 | 36 |
| 7 | 9 | 2820 | 3140 | 3510 | 130 | 80 | 10 | 20 | 20 | 20 | 110 | 110 | 130 | 10 | 10 | 10 | 23 | 48 |
| 7 | 10 | 2990 | 3160 | 3690 | 380 | 340 | 260 | 20 | 20 | 20 | 120 | 130 | 110 | 10 | 10 | 10 | 11 | 48 |
| 7 | 11 | 3130 | 3400 | 3840 | 690 | 650 | 600 | 30 | 30 | 30 | 120 | 120 | 130 | 0 | 10 | 0 | 19 | 52 |
| 7 | 12 | 3300 | 3510 | 3780 | 1100 | 1030 | 990 | 30 | 30 | 30 | 130 | 130 | 130 | 0 | 0 | 0 | 12 | 31 |
| 7 | 13 | 3200 | 3740 | 4010 | 1450 | 1460 | 1390 | 30 | 30 | 40 | 150 | 140 | 140 | 0 | 0 | 0 | 46 | 63 |
| 7 | 14 | 3300 | 3700 | 4250 | 1710 | 1880 | 2080 | 40 | 30 | 30 | 150 | 140 | 130 | 0 | 0 | 0 | 48 | 110 |
| 7 | 15 | 3300 | 3700 | 4110 | 1690 | 1880 | 2080 | 60 | 50 | 40 | 190 | 150 | 160 | 0 | 0 | 0 | 49 | 100 |
| 7 | 16 | 3280 | 3840 | 4110 | 1750 | 1880 | 2090 | 70 | 60 | 60 | 210 | 160 | 160 | 0 | 0 | 0 | 58 | 98 |
1 Average per week in solid cubic meters (rounded to the nearest ten). 2 In minutes (rounded to the nearest ten). 3 Average quantity per week.
Table A5.
Terminal transport template for two train pick-ups, medium delivery time, and all tonnages (P2D2 T1/2/3).
Table A5.
Terminal transport template for two train pick-ups, medium delivery time, and all tonnages (P2D2 T1/2/3).
| Wagons | Trucks | Terminal Transhipment Volume 1 | Required Terminal Stockyard 1 | Average Queuing Time 2 | Maximal Queuing Time 2 | Half Loaded Train Wagons 3 | Reduced Truck Trips 3 | |||||||||||
|---|---|---|---|---|---|---|---|---|---|---|---|---|---|---|---|---|---|---|
| T1 | T2 | T3 | T1 | T2 | T3 | T1 | T2 | T3 | T1 | T2 | T3 | T1 | T2 | T3 | T2 | T3 | ||
| 1 | 1 | 250 | 260 | 290 | 0 | 0 | 0 | 0 | 0 | 0 | 10 | 10 | 0 | 0 | 0 | 0 | 1 | 3 |
| 1 | 2 | 470 | 530 | 590 | 0 | 0 | 0 | 10 | 10 | 20 | 120 | 110 | 110 | 0 | 0 | 0 | 5 | 10 |
| 1 | 3 | 470 | 530 | 570 | 240 | 270 | 300 | 20 | 20 | 20 | 130 | 110 | 120 | 0 | 0 | 0 | 8 | 13 |
| 1 | 4 | 470 | 530 | 590 | 480 | 540 | 590 | 20 | 30 | 30 | 120 | 120 | 110 | 0 | 0 | 0 | 10 | 19 |
| 1 | 5 | 470 | 530 | 590 | 720 | 800 | 890 | 30 | 30 | 30 | 120 | 120 | 110 | 0 | 0 | 0 | 12 | 24 |
| 2 | 1 | 250 | 280 | 290 | 0 | 0 | 0 | 0 | 0 | 0 | 10 | 0 | 0 | 0 | 0 | 0 | 3 | 3 |
| 2 | 2 | 490 | 530 | 570 | 0 | 0 | 0 | 0 | 0 | 0 | 20 | 20 | 20 | 0 | 0 | 0 | 3 | 7 |
| 2 | 3 | 710 | 760 | 880 | 0 | 0 | 0 | 10 | 10 | 10 | 110 | 110 | 110 | 0 | 0 | 0 | 4 | 14 |
| 2 | 4 | 980 | 1060 | 1210 | 0 | 0 | 0 | 20 | 20 | 20 | 110 | 110 | 110 | 0 | 0 | 0 | 7 | 19 |
| 2 | 5 | 940 | 1060 | 1170 | 240 | 270 | 300 | 20 | 20 | 20 | 80 | 120 | 130 | 0 | 0 | 0 | 13 | 24 |
| 3 | 1 | 240 | 270 | 290 | 0 | 0 | 0 | 0 | 0 | 0 | 10 | 10 | 0 | 0 | 0 | 0 | 3 | 4 |
| 3 | 2 | 470 | 550 | 590 | 0 | 0 | 0 | 0 | 0 | 0 | 20 | 20 | 20 | 0 | 0 | 0 | 7 | 10 |
| 3 | 3 | 710 | 790 | 880 | 0 | 0 | 0 | 0 | 0 | 0 | 20 | 20 | 20 | 0 | 0 | 0 | 7 | 14 |
| 3 | 4 | 940 | 1060 | 1140 | 0 | 0 | 0 | 10 | 10 | 10 | 110 | 110 | 100 | 10 | 10 | 10 | 10 | 17 |
| 3 | 5 | 1180 | 1320 | 1470 | 0 | 0 | 0 | 10 | 10 | 10 | 110 | 110 | 110 | 0 | 0 | 0 | 12 | 24 |
| 3 | 6 | 1410 | 1590 | 1760 | 0 | 0 | 0 | 20 | 20 | 20 | 110 | 110 | 110 | 0 | 0 | 0 | 15 | 29 |
| 3 | 7 | 1410 | 1530 | 1770 | 250 | 270 | 300 | 20 | 20 | 20 | 120 | 120 | 120 | 0 | 0 | 0 | 12 | 34 |
| 3 | 8 | 1410 | 1590 | 1760 | 480 | 540 | 600 | 20 | 20 | 20 | 120 | 120 | 110 | 0 | 0 | 0 | 20 | 39 |
| 3 | 9 | 1410 | 1590 | 1770 | 720 | 800 | 890 | 20 | 30 | 30 | 120 | 130 | 130 | 0 | 0 | 0 | 22 | 44 |
| 3 | 10 | 1350 | 1590 | 1820 | 960 | 1070 | 1190 | 30 | 30 | 30 | 120 | 130 | 120 | 0 | 0 | 0 | 29 | 58 |
| 4 | 2 | 470 | 530 | 590 | 0 | 0 | 0 | 0 | 0 | 0 | 20 | 20 | 10 | 0 | 0 | 0 | 5 | 10 |
| 4 | 3 | 680 | 800 | 890 | 0 | 0 | 0 | 0 | 0 | 0 | 20 | 20 | 20 | 10 | 0 | 0 | 10 | 18 |
| 4 | 4 | 900 | 1060 | 1180 | 0 | 0 | 0 | 0 | 0 | 0 | 20 | 20 | 20 | 0 | 0 | 0 | 13 | 23 |
| 4 | 5 | 1170 | 1330 | 1470 | 0 | 0 | 0 | 10 | 10 | 10 | 110 | 110 | 110 | 10 | 10 | 10 | 13 | 25 |
| 4 | 6 | 1420 | 1590 | 1830 | 0 | 0 | 0 | 10 | 10 | 10 | 120 | 110 | 110 | 10 | 10 | 10 | 14 | 34 |
| 4 | 7 | 1640 | 1860 | 2060 | 0 | 0 | 0 | 20 | 20 | 20 | 110 | 120 | 100 | 0 | 0 | 0 | 18 | 35 |
| 4 | 8 | 1880 | 2120 | 2350 | 0 | 0 | 0 | 20 | 20 | 20 | 120 | 120 | 110 | 0 | 0 | 0 | 20 | 39 |
| 4 | 9 | 1800 | 2110 | 2270 | 240 | 270 | 300 | 20 | 20 | 20 | 130 | 130 | 130 | 0 | 0 | 0 | 28 | 44 |
| 4 | 10 | 1880 | 2190 | 2270 | 480 | 540 | 600 | 20 | 20 | 30 | 130 | 130 | 140 | 0 | 0 | 0 | 31 | 43 |
| 4 | 11 | 1880 | 2110 | 2280 | 720 | 800 | 890 | 30 | 30 | 30 | 130 | 130 | 130 | 0 | 0 | 0 | 26 | 48 |
| 5 | 3 | 740 | 790 | 910 | 0 | 0 | 0 | 0 | 0 | 0 | 20 | 20 | 20 | 10 | 0 | 0 | 4 | 14 |
| 5 | 4 | 950 | 1020 | 1180 | 0 | 0 | 0 | 0 | 0 | 0 | 20 | 20 | 20 | 10 | 0 | 0 | 6 | 19 |
| 5 | 5 | 1170 | 1370 | 1470 | 0 | 0 | 0 | 0 | 0 | 0 | 20 | 20 | 20 | 0 | 0 | 0 | 17 | 25 |
| 5 | 6 | 1420 | 1590 | 1710 | 0 | 0 | 0 | 10 | 10 | 10 | 110 | 110 | 100 | 20 | 20 | 20 | 14 | 24 |
| 5 | 7 | 1650 | 1860 | 2060 | 0 | 0 | 0 | 10 | 10 | 10 | 120 | 110 | 110 | 10 | 10 | 10 | 18 | 34 |
| 5 | 8 | 1890 | 2120 | 2350 | 0 | 0 | 0 | 10 | 20 | 20 | 120 | 120 | 120 | 10 | 10 | 10 | 19 | 38 |
| 5 | 9 | 2120 | 2380 | 2560 | 0 | 0 | 0 | 20 | 20 | 20 | 130 | 120 | 120 | 0 | 0 | 0 | 22 | 37 |
| 5 | 10 | 2350 | 2650 | 2850 | 0 | 0 | 0 | 20 | 20 | 20 | 120 | 120 | 120 | 0 | 0 | 0 | 25 | 42 |
| 5 | 11 | 2350 | 2650 | 2940 | 250 | 270 | 300 | 20 | 20 | 20 | 130 | 130 | 130 | 0 | 0 | 0 | 27 | 53 |
| 5 | 12 | 2350 | 2550 | 2940 | 490 | 540 | 600 | 20 | 30 | 30 | 130 | 130 | 130 | 0 | 0 | 0 | 21 | 58 |
| 6 | 4 | 950 | 1060 | 1180 | 0 | 0 | 0 | 0 | 0 | 0 | 20 | 20 | 20 | 10 | 0 | 0 | 9 | 19 |
| 6 | 5 | 1230 | 1320 | 1470 | 0 | 0 | 0 | 0 | 0 | 0 | 20 | 20 | 20 | 20 | 0 | 0 | 8 | 20 |
| 6 | 6 | 1420 | 1590 | 1770 | 0 | 0 | 0 | 0 | 0 | 0 | 20 | 20 | 20 | 0 | 0 | 0 | 14 | 29 |
| 6 | 7 | 1650 | 1850 | 2070 | 0 | 0 | 0 | 10 | 10 | 10 | 110 | 100 | 100 | 20 | 20 | 20 | 17 | 35 |
| 6 | 8 | 1960 | 2120 | 2350 | 0 | 0 | 0 | 10 | 10 | 10 | 110 | 120 | 110 | 20 | 20 | 20 | 13 | 33 |
| 6 | 9 | 2040 | 2390 | 2650 | 0 | 0 | 0 | 10 | 10 | 20 | 120 | 120 | 110 | 10 | 10 | 10 | 29 | 51 |
| 6 | 10 | 2360 | 2650 | 2940 | 0 | 0 | 0 | 20 | 20 | 20 | 130 | 120 | 120 | 10 | 10 | 10 | 24 | 48 |
| 6 | 11 | 2590 | 3020 | 3220 | 0 | 0 | 0 | 20 | 20 | 20 | 120 | 120 | 120 | 0 | 0 | 0 | 36 | 53 |
| 6 | 12 | 2820 | 3180 | 3650 | 0 | 0 | 0 | 20 | 20 | 20 | 130 | 120 | 130 | 0 | 0 | 0 | 30 | 69 |
| 6 | 13 | 2820 | 3300 | 3520 | 250 | 270 | 300 | 20 | 20 | 30 | 140 | 130 | 120 | 0 | 0 | 0 | 42 | 63 |
| 6 | 14 | 2820 | 3170 | 3520 | 370 | 400 | 450 | 30 | 30 | 30 | 190 | 190 | 190 | 0 | 0 | 0 | 32 | 65 |
| 7 | 5 | 1190 | 1320 | 1470 | 0 | 0 | 0 | 0 | 0 | 0 | 40 | 20 | 20 | 10 | 0 | 0 | 11 | 23 |
| 7 | 6 | 1480 | 1590 | 1770 | 0 | 0 | 0 | 0 | 0 | 0 | 20 | 20 | 20 | 20 | 0 | 0 | 9 | 24 |
| 7 | 7 | 1650 | 1930 | 2060 | 0 | 0 | 0 | 0 | 0 | 0 | 20 | 20 | 20 | 0 | 0 | 0 | 23 | 34 |
| 7 | 8 | 1890 | 2120 | 2350 | 0 | 0 | 0 | 10 | 10 | 10 | 100 | 100 | 100 | 30 | 30 | 30 | 19 | 38 |
| 7 | 9 | 2110 | 2380 | 2560 | 0 | 0 | 0 | 10 | 10 | 10 | 110 | 100 | 110 | 20 | 20 | 20 | 23 | 38 |
| 7 | 10 | 2260 | 2650 | 2940 | 0 | 0 | 0 | 10 | 10 | 20 | 110 | 110 | 100 | 20 | 20 | 20 | 33 | 57 |
| 7 | 11 | 2600 | 2910 | 3240 | 0 | 0 | 0 | 20 | 20 | 20 | 110 | 110 | 100 | 10 | 10 | 10 | 26 | 53 |
| 7 | 12 | 2820 | 3170 | 3530 | 0 | 0 | 0 | 20 | 20 | 20 | 110 | 110 | 110 | 10 | 10 | 10 | 29 | 59 |
| 7 | 13 | 3060 | 3310 | 3830 | 0 | 0 | 0 | 20 | 20 | 20 | 120 | 110 | 110 | 0 | 0 | 0 | 21 | 64 |
| 7 | 14 | 3300 | 3840 | 4130 | 0 | 0 | 0 | 20 | 20 | 20 | 120 | 110 | 110 | 0 | 0 | 0 | 45 | 69 |
| 7 | 15 | 3430 | 3560 | 4110 | 130 | 140 | 150 | 30 | 30 | 30 | 190 | 190 | 190 | 0 | 0 | 0 | 12 | 58 |
| 7 | 16 | 3150 | 3700 | 4110 | 260 | 270 | 300 | 40 | 40 | 40 | 200 | 200 | 210 | 0 | 0 | 0 | 47 | 83 |
1 Average per week in solid cubic meters (rounded to the nearest ten). 2 In minutes (rounded to the nearest ten). 3 Average quantity per week.
Table A6.
Terminal transport template for two train pick-ups, long delivery time, and all tonnages (P2D3 T1/2/3).
Table A6.
Terminal transport template for two train pick-ups, long delivery time, and all tonnages (P2D3 T1/2/3).
| Wagons | Trucks | Terminal Transhipment Volume 1 | Required Terminal Stockyard 1 | Average Queuing Time 2 | Maximal Queuing Time 2 | Half Loaded Train Wagons 3 | Reduced Truck Trips 3 | |||||||||||
|---|---|---|---|---|---|---|---|---|---|---|---|---|---|---|---|---|---|---|
| T1 | T2 | T3 | T1 | T2 | T3 | T1 | T2 | T3 | T1 | T2 | T3 | T1 | T2 | T3 | T2 | T3 | ||
| 1 | 1 | 230 | 230 | 230 | 0 | 0 | 0 | 0 | 0 | 10 | 60 | 60 | 60 | 0 | 0 | 0 | 0 | 0 |
| 1 | 2 | 360 | 370 | 410 | 0 | 0 | 0 | 20 | 20 | 20 | 70 | 70 | 70 | 0 | 0 | 0 | 1 | 4 |
| 1 | 3 | 460 | 480 | 530 | 20 | 50 | 50 | 20 | 20 | 20 | 80 | 90 | 90 | 0 | 0 | 0 | 4 | 8 |
| 1 | 4 | 470 | 510 | 540 | 160 | 170 | 240 | 30 | 30 | 30 | 120 | 110 | 120 | 0 | 0 | 0 | 4 | 13 |
| 1 | 5 | 470 | 490 | 550 | 280 | 350 | 380 | 30 | 30 | 40 | 120 | 120 | 130 | 0 | 0 | 0 | 8 | 15 |
| 2 | 1 | 230 | 220 | 230 | 0 | 0 | 0 | 0 | 0 | 10 | 60 | 60 | 60 | 0 | 0 | 0 | 0 | 0 |
| 2 | 2 | 470 | 430 | 450 | 0 | 0 | 0 | 0 | 10 | 10 | 60 | 60 | 60 | 0 | 0 | 0 | 0 | 0 |
| 2 | 3 | 580 | 640 | 630 | 0 | 0 | 0 | 10 | 20 | 10 | 70 | 70 | 70 | 0 | 0 | 0 | 5 | 4 |
| 2 | 4 | 710 | 780 | 820 | 0 | 0 | 0 | 20 | 20 | 20 | 80 | 80 | 80 | 0 | 0 | 0 | 6 | 9 |
| 2 | 5 | 820 | 920 | 1000 | 0 | 0 | 0 | 20 | 20 | 30 | 80 | 80 | 90 | 0 | 0 | 0 | 8 | 15 |
| 2 | 6 | 940 | 1030 | 1160 | 10 | 30 | 20 | 30 | 30 | 30 | 80 | 80 | 90 | 0 | 0 | 0 | 9 | 19 |
| 2 | 7 | 930 | 990 | 1160 | 140 | 170 | 170 | 30 | 30 | 30 | 80 | 110 | 110 | 0 | 0 | 0 | 8 | 22 |
| 3 | 6 | 1010 | 1210 | 1210 | 0 | 0 | 0 | 20 | 20 | 20 | 80 | 80 | 110 | 10 | 10 | 10 | 17 | 17 |
| 3 | 7 | 1180 | 1350 | 1390 | 0 | 0 | 0 | 20 | 30 | 20 | 80 | 90 | 80 | 0 | 0 | 10 | 14 | 18 |
| 3 | 8 | 1300 | 1450 | 1590 | 0 | 0 | 0 | 30 | 30 | 30 | 90 | 120 | 110 | 0 | 0 | 0 | 13 | 24 |
| 3 | 9 | 1470 | 1580 | 1760 | 10 | 10 | 0 | 30 | 30 | 30 | 90 | 90 | 90 | 0 | 0 | 0 | 9 | 23 |
| 3 | 10 | 1410 | 1560 | 1760 | 130 | 170 | 150 | 30 | 30 | 30 | 110 | 120 | 120 | 0 | 0 | 0 | 16 | 31 |
| 4 | 9 | 1510 | 1620 | 1810 | 0 | 0 | 0 | 30 | 30 | 30 | 160 | 160 | 100 | 10 | 10 | 10 | 9 | 25 |
| 4 | 10 | 1650 | 1830 | 2000 | 0 | 0 | 0 | 30 | 30 | 30 | 160 | 160 | 110 | 0 | 10 | 10 | 15 | 29 |
| 4 | 11 | 1760 | 1980 | 2180 | 0 | 0 | 0 | 30 | 30 | 30 | 160 | 160 | 100 | 0 | 0 | 0 | 18 | 35 |
| 4 | 12 | 1880 | 2190 | 2430 | 0 | 0 | 0 | 30 | 30 | 30 | 160 | 160 | 160 | 0 | 0 | 0 | 26 | 46 |
| 4 | 13 | 1880 | 2040 | 2360 | 120 | 140 | 150 | 40 | 40 | 40 | 170 | 160 | 160 | 0 | 0 | 0 | 15 | 43 |
| 5 | 12 | 2000 | 2230 | 2390 | 0 | 0 | 0 | 30 | 30 | 30 | 180 | 170 | 120 | 10 | 10 | 10 | 19 | 33 |
| 5 | 13 | 2030 | 2370 | 2590 | 0 | 0 | 0 | 40 | 30 | 30 | 170 | 170 | 160 | 0 | 10 | 10 | 28 | 47 |
| 5 | 14 | 2240 | 2520 | 2690 | 0 | 0 | 0 | 40 | 30 | 30 | 170 | 160 | 170 | 0 | 0 | 0 | 23 | 38 |
| 5 | 15 | 2360 | 2650 | 2940 | 0 | 0 | 0 | 40 | 40 | 40 | 170 | 170 | 160 | 0 | 0 | 0 | 24 | 48 |
| 5 | 16 | 2360 | 2550 | 2930 | 120 | 140 | 150 | 50 | 40 | 40 | 180 | 180 | 170 | 0 | 0 | 0 | 18 | 50 |
| 6 | 15 | 2480 | 2760 | 2880 | 0 | 0 | 0 | 40 | 30 | 30 | 240 | 170 | 160 | 10 | 10 | 10 | 23 | 33 |
| 6 | 16 | 2590 | 2810 | 3270 | 0 | 0 | 0 | 40 | 30 | 30 | 180 | 180 | 180 | 0 | 10 | 10 | 18 | 57 |
| 6 | 17 | 2710 | 3050 | 3360 | 0 | 0 | 0 | 50 | 40 | 30 | 260 | 180 | 170 | 0 | 0 | 0 | 28 | 54 |
| 6 | 18 | 2820 | 3050 | 3510 | 0 | 0 | 0 | 50 | 40 | 40 | 180 | 180 | 180 | 0 | 0 | 0 | 19 | 58 |
| 6 | 19 | 2700 | 3290 | 3410 | 120 | 130 | 90 | 60 | 50 | 50 | 230 | 180 | 230 | 0 | 0 | 0 | 50 | 57 |
| 7 | 18 | 3060 | 3290 | 3570 | 0 | 0 | 0 | 50 | 40 | 40 | 190 | 190 | 180 | 10 | 10 | 10 | 19 | 43 |
| 7 | 19 | 3050 | 3420 | 3740 | 0 | 0 | 0 | 50 | 40 | 40 | 250 | 190 | 190 | 0 | 10 | 10 | 31 | 58 |
| 7 | 20 | 3170 | 3580 | 3930 | 0 | 0 | 0 | 50 | 40 | 40 | 190 | 190 | 190 | 0 | 0 | 0 | 34 | 63 |
| 7 | 21 | 3300 | 3830 | 4040 | 0 | 0 | 0 | 60 | 50 | 50 | 250 | 180 | 220 | 0 | 0 | 0 | 44 | 62 |
| 7 | 22 | 3290 | 3690 | 4050 | 120 | 100 | 0 | 60 | 60 | 60 | 270 | 250 | 220 | 0 | 0 | 0 | 32 | 53 |
| 7 | 23 | 3300 | 3690 | 4050 | 240 | 260 | 150 | 70 | 70 | 60 | 260 | 220 | 220 | 0 | 0 | 0 | 34 | 55 |
| 7 | 24 | 3290 | 3700 | 4080 | 360 | 410 | 370 | 70 | 70 | 70 | 250 | 260 | 240 | 0 | 0 | 0 | 38 | 67 |
| 7 | 25 | 3290 | 3690 | 4200 | 480 | 540 | 600 | 80 | 80 | 70 | 250 | 250 | 220 | 0 | 0 | 0 | 38 | 86 |
1 Average per week in solid cubic meters (rounded to the nearest ten). 2 In minutes (rounded to the nearest ten). 3 Average quantity per week.
References
- Federal Ministry for Sustainability and Tourism, Republic of Austria. Austrian Forest Strategy 2020+. BMNT 2018. Available online: https://www.bmlrt.gv.at/forst/oesterreich-wald/waldstrategie-2020/waldstrategie_paper.html (accessed on 27 March 2020).
- Austrian Paper Industry Association. Annual Report 2018/19. Austropapier 2019. Available online: https://www.austropapier.at/fileadmin/austropapier.at/dateiliste/Dokumente/Downloads/Jahresberichte/19.04.10__Gesamter_Bericht__9MB_.pdf (accessed on 27 March 2020).
- Austrian Wood Industry Association. Annual Report 2018/19. Fachverband der Holzindustrie 2019. Available online: https://www.wko.at/branchen/industrie/holzindustrie/branchenbericht-2018-2019.pdf (accessed on 27 March 2020).
- Cooperation Association Forest Wood Paper. Performance Report Value Chain Wood. FHP 2019. Available online: https://www.forstholzpapier.at/images/Leistungsbericht_kompakt_2019_Ansicht_FINAL.pdf (accessed on 27 March 2020).
- Federal Ministry for Sustainability and Tourism, Republic of Austria. Green Report. BMNT 2019. Available online: https://gruenerbericht.at/cm4/jdownload/send/2-gr-bericht-terreich/2007-gb2019 (accessed on 27 March 2020).
- Rail Cargo Austria. Wood Terminals in Austria; Rail Cargo Austria: Vienna, Austria, 2019. [Google Scholar]
- Bjarnehed, H.; Dotevall, J. Increased business value with digital twins. In Proceedings of the The Energiforsk Annual Nuclear Conference, Stockholm, Sweden, 24 January 2018; pp. 1–16. [Google Scholar]
- Dalstam, A.; Engberg, M.; Nafors, D.; Johansson, B.; Sundblom, A. A stepwise implementation of the virtual factory in manufacturing industry. In Proceedings of the 2018 Winter Simulation Conference, Gothenburg, Sweden, 9–12 December 2018; Rabe, M., Juan, A.A., Mustafee, N., Skoogh, A., Jain, S., Johansson, B., Eds.; Institute of Electrical and Electronics Engineers, Inc.: Piscataway, NJ, USA; pp. 3229–3240.
- The Anylogic Company. White Paper: An introduction to Digital Twin Development. Anylogic 2018. Available online: https://www.anylogic.com/resources/white-papers/an-introduction-to-digital-twin-development/ (accessed on 27 March 2020).
- Kogler, C.; Rauch, P. Discrete event simulation of multimodal and unimodal transportation in the wood supply chain: A literature review. Silva Fenn. 2018, 52, 1–29. [Google Scholar] [CrossRef]
- Saranen, J.; Hilmola, O.-P. Evaluating the competitiveness of railways in timber transports with discrete-event simulation. World Rev. Intermod. Transp. Res. 2007, 1, 445–458. [Google Scholar] [CrossRef]
- Karttunen, K.; Lättilä, L.; Korpinen, O.-J.; Ranta, T. Cost-efficiency of intermodal container supply chain for forest chips. Silva Fenn. 2013, 47, 1–24. [Google Scholar] [CrossRef] [Green Version]
- Wolfsmayr, U.J.; Merenda, R.; Rauch, P.; Longo, F.; Gronalt, M. Evaluating primary forest fuel rail terminals with discrete event simulation: A case study from Austria. Ann. For. Res. 2016, 59, 145–164. [Google Scholar] [CrossRef]
- Gronalt, M.; Rauch, P. Analyzing railroad terminal performance in the timber industry supply chain—A simulation study. Int. J. For. Eng. 2018, 29, 162–170. [Google Scholar] [CrossRef]
- Kogler, C.; Rauch, P. A discrete event simulation model to test multimodal strategies for a greener and more resilient wood supply. Can. J. For. Res. 2019, 49, 1298–1310. [Google Scholar] [CrossRef]
- Asikainen, A. Simulation of logging and barge transport of wood from forests on islands. Int. J. For. Eng. 2001, 12, 43–50. [Google Scholar] [CrossRef] [Green Version]
- Karttunen, K.; Väätäinen, K.; Asikainen, A.; Ranta, T. The operational efficiency of waterway transport of forest chips on Finland’s Lake Saimaa. Silva Fenn. 2012, 46, 395–413. [Google Scholar] [CrossRef] [Green Version]
- Mobini, M.; Sowlati, T.; Sokhansanj, S. A simulation model for the design and analysis of wood pellet supply chains. Appl. Energy 2013, 111, 1239–1249. [Google Scholar] [CrossRef]
- Mobini, M.; Meyer, J.-C.; Trippe, F.; Sowlati, T.; Fröhling, M.; Schultmann, F. Assessing the integration of torrefaction into wood pellet production. J. Clean. Prod. 2014, 78, 216–225. [Google Scholar] [CrossRef]
- Borshchev, A. The Big Book of Simulation Modeling: Multimethod Modeling with AnyLogic; Anylogic: Chicago, IL, USA, 2014; p. 612. ISBN 0989573176. [Google Scholar]
- Mahdavi, A. The Art of Process-Centric Modeling with AnyLogic. Available online: https://www.anylogic.com/resources/books/the-art-of-process-centric-modeling-with-anylogic/ (accessed on 27 March 2020).
- She, J.; Chung, W.; Kim, D. Discrete-event simulation of ground-based timber harvesting operations. Forests 2018, 9, 683. [Google Scholar] [CrossRef] [Green Version]
- Kons, K.; La Hera, P.; Bergström, D. Modelling dynamics of a log-yard through discrete-event mathematics. Forests 2020, 11, 155. [Google Scholar] [CrossRef] [Green Version]
- Beaudoin, D.; LeBel, L.; Soussi, M.A. Discrete event simulation to improve log yard operations. INFOR Inf. Syst. Oper. Res. 2012, 50, 175–185. [Google Scholar] [CrossRef] [Green Version]
- Anyomi, K.A.; Mitchell, S.J.; Perera, A.H.; Ruel, J.-C. Windthrow dynamics in boreal Ontario: A simulation of the vulnerability of several stand types across a range of wind speeds. Forests 2017, 8, 233. [Google Scholar] [CrossRef] [Green Version]
- Jandl, R.; Ledermann, T.; Kindermann, G.; Freudenschuss, A.; Gschwantner, T.; Weiss, P. Strategies for climate-smart forest management in Austria. Forests 2018, 8, 233. [Google Scholar] [CrossRef] [Green Version]
- Cristal, I.; Ameztegui, A.; González-Olabarria, J.R.; Garcia-Gonzalo, J. A decision support tool for assessing the impact of climate change on multiple ecosystem services. Forests 2019, 10, 440. [Google Scholar] [CrossRef] [Green Version]
- Iverson, L.R.; Prasad, A.M.; Peters, M.P.; Matthews, S.N. Facilitating adaptive forest management under climate change: A spatially specific synthesis of 125 species for habitat changes and assisted migration over the eastern United States. Forests 2019, 10, 989. [Google Scholar] [CrossRef] [Green Version]
- Eriksson, A.; Eliasson, L.; Sikanen, L.; Hansson, P.-A.; Jirjis, R. Evaluation of delivery strategies for forest fuels applying a model for weather-driven analysis of forest fuel systems (WAFFS). Appl. Energy 2017, 188, 420–430. [Google Scholar] [CrossRef]
- Paulson, J.S.; Kizha, A.R.; Han, H.-S. Integrating biomass conversion technologies with recovery operations in-woods: Modelling supply chain. Logistics 2019, 3, 16. [Google Scholar] [CrossRef] [Green Version]
- Montgomery, T.D.; Han, H.-S.; Kizha, A.R. Modeling work plan logistics for centralized biomass recovery operations in mountainous terrain. Biomass Bioenergy 2016, 85, 262–270. [Google Scholar] [CrossRef]
- Kizha, A.R.; Han, H.-S.; Paulson, J.; Koirala, A. Strategies for reducing moisture content in forest residues at the harvest site. Appl. Eng. Agric. 2018, 34, 25–33. [Google Scholar] [CrossRef]
- Acuna, M.; Sessions, J.; Zamora, R.; Boston, K.; Brown, M.; Ghaffariyan, M.R. Methods to manage and optimize forest biomass supply chains: A review. Curr. For. Rep. 2019, 5, 124–141. [Google Scholar] [CrossRef]
- Windisch, J.; Röser, D.; Mola-Yudego, B.; Sikanen, L.; Asikainen, A. Business process mapping and discrete-event simulation of two forest biomass supply chains. Biomass Bioenergy 2013, 56, 370–381. [Google Scholar] [CrossRef]
- Windisch, J.; Röser, D.; Sikanen, L.; Routa, J. Reengineering business processes to improve an integrated industrial roundwood and energywood procurement chain. Int. J. For. Eng. 2013, 24, 233–248. [Google Scholar] [CrossRef]
- Korpinen, O.J.; Aalto, M.; Venäläinen, P.; Ranta, T. Impacts of a high-capacity truck transportation system on the economy and traffic intensity of pulpwood supply in southeast Finland. Croat. J. For. Eng. 2019, 40, 89–105. [Google Scholar]
- Eliasson, L.; Eriksson, A.; Mohtashami, S. Analysis of factors affecting productivity and costs for a high-performance chip supply system. Appl. Energy 2017, 185, 497–505. [Google Scholar] [CrossRef]
- Fernandez-Lacruz, R.; Eriksson, A.; Bergström, D. Simulation-based cost analysis of industrial supply of chips from logging residues and small-diameter trees. Forests 2020, 11, 1. [Google Scholar] [CrossRef] [Green Version]
Figure 1.
Flowcharts of the wood and transporting flows of the simulation model.

Figure 2.
General layout of small scale train terminals displaying loading track, stockyard, and truck driving route.
Figure 2.
General layout of small scale train terminals displaying loading track, stockyard, and truck driving route.

Figure 3.
Best performing truck to wagon ratios for one train pick-up and low tonnages regarding three strategies.
Figure 3.
Best performing truck to wagon ratios for one train pick-up and low tonnages regarding three strategies.

Figure 4.
Best performing truck to truck ratios for two train pick-ups and low tonnages regarding three strategies.
Figure 4.
Best performing truck to truck ratios for two train pick-ups and low tonnages regarding three strategies.

Figure 5.
Reduced truck trips for one train pick-up. P = train wagons pick-ups: P1 = one a day, P2 = two a day. T = tonnage of forest trucks equipped with crane: T1 = low, T2 = moderate, T3 = high. D = delivery time to train terminal: D1 = short, D2 = medium, D3 = long.
Figure 5.
Reduced truck trips for one train pick-up. P = train wagons pick-ups: P1 = one a day, P2 = two a day. T = tonnage of forest trucks equipped with crane: T1 = low, T2 = moderate, T3 = high. D = delivery time to train terminal: D1 = short, D2 = medium, D3 = long.

Figure 6.
Reduced truck trips for two train pick-ups. P = train wagons pick-ups: P1 = one a day, P2 = two a day. T = tonnage of forest trucks equipped with crane: T1 = low, T2 = moderate, T3 = high. D = delivery time to train terminal: D1 = short, D2 = medium, D3 = long.
Figure 6.
Reduced truck trips for two train pick-ups. P = train wagons pick-ups: P1 = one a day, P2 = two a day. T = tonnage of forest trucks equipped with crane: T1 = low, T2 = moderate, T3 = high. D = delivery time to train terminal: D1 = short, D2 = medium, D3 = long.

Table 1.
18 scenario settings for simulation.
| One Train Pick-Up (P1) | Two Train Pick-Ups (P2) | ||||||
|---|---|---|---|---|---|---|---|
| Delivery Time (D) | Delivery Time (D) | ||||||
| Tonnage (T) | P1D1T1 | P1D2T1 | P1D3T1 | Tonnage (T) | P2D1T1 | P2D2T1 | P2D3T1 |
| P1D1T2 | P1D2T2 | P1D3T2 | P2D1T2 | P2D2T2 | P2D3T2 | ||
| P1D1T3 | P1D2T3 | P1D3T3 | P2D1T3 | P2D2T3 | P2D3T3 | ||
P = train wagons pick-ups: P1 = one a day, P2 = two a day. T = tonnage of forest trucks equipped with crane: T1 = low (MIN = 23 t/MODE = 24 t/MAX = 25 t), T2 = moderate (26/27/28), T3 = high (29/30/31). D = delivery time to train terminal: D1 = short (MIN = 5 min/MODE = 10 min/MAX = 15 min), D2 = medium (35/40/45), D3 = long (65/70/75).
Table 2.
One way truck delivery time.
| Delivery Time | Drive Time (min) | Number of Trips Per Truck Per Day | ||
|---|---|---|---|---|
| MIN | MODE | MAX | ||
| short | 5 | 10 | 15 | 3–4 |
| medium | 35 | 40 | 45 | 2–3 |
| long | 65 | 70 | 75 | 1–2 |
Table 3.
Truck tonnages and dependent process times.
| Transport Tonnages | Tonnage (t) | Load Truck Time (min) | Unload Time at Stockyard/Wagon (min) | ||||||
|---|---|---|---|---|---|---|---|---|---|
| MIN | MODE | MAX | MIN | MODE | MAX | MIN | MODE | MAX | |
| low | 23 | 24 | 25 | 30 | 35 | 40 | 35 | 45 | 55 |
| moderate | 26 | 27 | 28 | 33 | 38 | 43 | 38 | 48 | 58 |
| high | 29 | 30 | 31 | 36 | 41 | 46 | 41 | 51 | 61 |
Table 4.
Best performing simulation results for strategy MAX VOLUME (maximal terminal transhipment volume) for one train pick-up.
Table 4.
Best performing simulation results for strategy MAX VOLUME (maximal terminal transhipment volume) for one train pick-up.
| Wagons | Number of Trucks | Terminal Transhipment Volume (m3) | Required Terminal Stockyard (m3) | Average Queuing Time (min) | Maximal Queuing Time (min) | ||||||||||
|---|---|---|---|---|---|---|---|---|---|---|---|---|---|---|---|
| D1 | D2 | D3 | D1 | D2 | D3 | D1 | D2 | D3 | D1 | D2 | D3 | D1 | D2 | D3 | |
| 1 | 3 | 5 | 4 | 240 | 250 | 240 | 950 | 1070 | 320 | 20 | 10 | 70 | 120 | 120 | 120 |
| 2 | 3 | 2 | 4 | 490 | 470 | 470 | 710 | 0 | 130 | 10 | 0 | 60 | 110 | 70 | 110 |
| 3 | 3 | 5 | 6 | 730 | 710 | 730 | 360 | 530 | 170 | 10 | 10 | 60 | 70 | 70 | 120 |
| 4 | 9 | 4 | 9 | 980 | 940 | 980 | 2610 | 0 | 290 | 20 | 0 | 70 | 130 | 70 | 140 |
| 5 | 4 | 8 | 12 | 1220 | 1220 | 1180 | 0 | 770 | 430 | 20 | 10 | 80 | 90 | 80 | 150 |
| 6 | 12 | 12 | 12 | 1470 | 1470 | 1410 | 3000 | 1500 | 180 | 30 | 20 | 70 | 140 | 110 | 140 |
| 7 | 7 | 8 | 13 | 1710 | 1650 | 1640 | 830 | 160 | 0 | 10 | 10 | 70 | 80 | 80 | 140 |
Table 5.
Best performing simulation results for strategy NO STOCKYARD (no or low required terminal stockyard) for one train pick-up.
Table 5.
Best performing simulation results for strategy NO STOCKYARD (no or low required terminal stockyard) for one train pick-up.
| Wagons | Number of Trucks | Terminal Transhipment Volume (m3) | Required Terminal Stockyard (m3) | Average Queuing Time (min) | Maximal Queuing Time (min) | ||||||||||
|---|---|---|---|---|---|---|---|---|---|---|---|---|---|---|---|
| D1 | D2 | D3 | D1 | D2 | D3 | D1 | D2 | D3 | D1 | D2 | D3 | D1 | D2 | D3 | |
| 1 | 1 | 1 | 2 | 230 | 230 | 230 | 120 | 0 | 80 | 10 | 0 | 50 | 60 | 70 | 110 |
| 2 | 2 | 2 | 3 | 450 | 470 | 440 | 240 | 0 | 0 | 10 | 0 | 40 | 80 | 70 | 110 |
| 3 | 2 | 3 | 5 | 710 | 680 | 660 | 0 | 0 | 0 | 10 | 0 | 50 | 70 | 70 | 110 |
| 4 | 3 | 4 | 7 | 940 | 940 | 930 | 0 | 0 | 0 | 10 | 0 | 60 | 80 | 70 | 120 |
| 5 | 4 | 5 | 9 | 1220 | 1170 | 1170 | 0 | 0 | 0 | 20 | 10 | 60 | 90 | 100 | 130 |
| 6 | 4 | 6 | 11 | 1350 | 1350 | 1400 | 0 | 0 | 0 | 20 | 20 | 70 | 120 | 90 | 150 |
| 7 | 5 | 7 | 13 | 1630 | 1640 | 1640 | 0 | 0 | 0 | 20 | 30 | 70 | 130 | 110 | 140 |
Table 6.
Best performing simulation results for strategy BEST FIT (at least 90% terminal transhipment volume) for one train pick-up.
Table 6.
Best performing simulation results for strategy BEST FIT (at least 90% terminal transhipment volume) for one train pick-up.
| Wagons | Number of Trucks | Terminal Transhipment Volume (m3) | Required Terminal Stockyard (m3) | Average Queuing Time (min) | Maximal Queuing Time (min) | ||||||||||
|---|---|---|---|---|---|---|---|---|---|---|---|---|---|---|---|
| D1 | D2 | D3 | D1 | D2 | D3 | D1 | D2 | D3 | D1 | D2 | D3 | D1 | D2 | D3 | |
| 1 | 1 | 1 | 2 | 230 | 230 | 230 | 120 | 0 | 80 | 10 | 0 | 50 | 60 | 70 | 110 |
| 2 | 2 | 2 | 3 | 450 | 470 | 440 | 240 | 0 | 0 | 10 | 0 | 40 | 80 | 70 | 110 |
| 3 | 2 | 3 | 5 | 710 | 680 | 660 | 0 | 0 | 0 | 10 | 0 | 50 | 70 | 70 | 110 |
| 4 | 3 | 4 | 7 | 940 | 940 | 930 | 0 | 0 | 0 | 10 | 0 | 60 | 80 | 70 | 120 |
| 5 | 4 | 5 | 8 | 1220 | 1170 | 1100 | 0 | 0 | 0 | 20 | 10 | 50 | 90 | 100 | 120 |
| 6 | 4 | 6 | 10 | 1350 | 1350 | 1320 | 0 | 0 | 0 | 20 | 20 | 60 | 120 | 90 | 140 |
| 7 | 5 | 7 | 11 | 1630 | 1640 | 1490 | 0 | 0 | 0 | 20 | 30 | 60 | 130 | 110 | 140 |
Table 7.
Strategy comparison for one train pick-up (in %).
| Delivery Time | MAX VOLUME | NO STOCKYARD | BEST FIT | ||||
|---|---|---|---|---|---|---|---|
| Short | Medium | Long | Short | Medium | Long | ||
| Number of trucks | 100 | −49 | −36 | −17 | −49 | −36 | −23 |
| Transhipment volume | 100 | −5 | −3 | −3 | −5 | −3 | −7 |
| Required stockyard | 100 | −96 | −100 | −95 | −96 | −100 | −95 |
| Average queuing times | 100 | −17 | 0 | −17 | −17 | 0 | −23 |
| Maximal queuing times | 100 | −15 | −3 | −5 | −15 | −3 | −8 |
Table 8.
Best performing simulation results for strategy MAX VOLUME (maximal terminal transhipment volume) for two train pick-ups.
Table 8.
Best performing simulation results for strategy MAX VOLUME (maximal terminal transhipment volume) for two train pick-ups.
| Wagons | Number of Trucks | Terminal Transhipment Volume (m3) | Required Terminal Stockyard (m3) | Average Queuing Time (min) | Maximal Queuing Time (min) | ||||||||||
|---|---|---|---|---|---|---|---|---|---|---|---|---|---|---|---|
| D1 | D2 | D3 | D1 | D2 | D3 | D1 | D2 | D3 | D1 | D2 | D3 | D1 | D2 | D3 | |
| 1 | 2 | 2 | 4 | 490 | 470 | 470 | 360 | 0 | 160 | 20 | 10 | 30 | 70 | 120 | 120 |
| 2 | 4 | 4 | 6 | 940 | 980 | 940 | 710 | 0 | 10 | 20 | 20 | 30 | 120 | 110 | 80 |
| 3 | 10 | 6 | 9 | 1420 | 1410 | 1470 | 2500 | 0 | 10 | 30 | 20 | 30 | 130 | 110 | 90 |
| 4 | 11 | 8 | 12 | 1880 | 1880 | 1880 | 2410 | 0 | 0 | 30 | 20 | 30 | 120 | 120 | 160 |
| 5 | 11 | 10 | 15 | 2390 | 2350 | 2360 | 1750 | 0 | 0 | 40 | 20 | 40 | 140 | 120 | 170 |
| 6 | 13 | 12 | 18 | 2830 | 2820 | 2820 | 1910 | 0 | 0 | 30 | 20 | 50 | 150 | 130 | 180 |
| 7 | 12 | 15 | 21 | 3300 | 3430 | 3300 | 1100 | 130 | 0 | 30 | 30 | 60 | 130 | 190 | 250 |
Table 9.
Best performing simulation results for strategy NO STOCKYARD (no or low required terminal stockyard) for two train pick-ups.
Table 9.
Best performing simulation results for strategy NO STOCKYARD (no or low required terminal stockyard) for two train pick-ups.
| Wagons | Number of Trucks | Terminal Transhipment Volume (m3) | Required Terminal Stockyard (m3) | Average Queuing Time (min) | Maximal Queuing Time (min) | ||||||||||
|---|---|---|---|---|---|---|---|---|---|---|---|---|---|---|---|
| D1 | D2 | D3 | D1 | D2 | D3 | D1 | D2 | D3 | D1 | D2 | D3 | D1 | D2 | D3 | |
| 1 | 1 | 2 | 2 | 240 | 470 | 360 | 120 | 0 | 0 | 0 | 10 | 20 | 50 | 120 | 70 |
| 2 | 3 | 4 | 5 | 930 | 980 | 820 | 190 | 0 | 0 | 20 | 20 | 20 | 100 | 110 | 80 |
| 3 | 2 | 6 | 8 | 830 | 1410 | 1300 | 0 | 0 | 0 | 10 | 20 | 30 | 80 | 110 | 90 |
| 4 | 3 | 8 | 12 | 1170 | 1880 | 1880 | 0 | 0 | 0 | 20 | 20 | 30 | 110 | 120 | 160 |
| 5 | 5 | 10 | 15 | 1710 | 2350 | 2360 | 0 | 0 | 0 | 10 | 20 | 40 | 90 | 120 | 170 |
| 6 | 7 | 12 | 18 | 2460 | 2820 | 2820 | 0 | 0 | 0 | 20 | 20 | 50 | 110 | 130 | 180 |
| 7 | 8 | 14 | 21 | 2820 | 3300 | 3300 | 0 | 0 | 0 | 20 | 20 | 60 | 100 | 120 | 250 |
Table 10.
Best simulation results for strategy BEST FIT (at least 90% terminal transhipment volume) for two train pick-ups.
Table 10.
Best simulation results for strategy BEST FIT (at least 90% terminal transhipment volume) for two train pick-ups.
| Wagons | Number of Trucks | Terminal Transhipment Volume (m3) | Required Terminal Stockyard (m3) | Average Queuing Time (min) | Maximal Queuing Time (min) | ||||||||||
|---|---|---|---|---|---|---|---|---|---|---|---|---|---|---|---|
| D1 | D2 | D3 | D1 | D2 | D3 | D1 | D2 | D3 | D1 | D2 | D3 | D1 | D2 | D3 | |
| 1 | 2 | 2 | 3 | 490 | 470 | 460 | 360 | 0 | 20 | 20 | 10 | 20 | 70 | 120 | 80 |
| 2 | 3 | 4 | 6 | 930 | 980 | 940 | 190 | 0 | 10 | 20 | 20 | 30 | 100 | 110 | 80 |
| 3 | 4 | 6 | 9 | 1310 | 1410 | 1470 | 100 | 0 | 10 | 10 | 20 | 30 | 100 | 110 | 90 |
| 4 | 6 | 8 | 11 | 1770 | 1880 | 1760 | 430 | 0 | 0 | 20 | 20 | 30 | 110 | 120 | 160 |
| 5 | 8 | 9 | 14 | 2180 | 2120 | 2240 | 690 | 0 | 0 | 20 | 20 | 40 | 110 | 130 | 170 |
| 6 | 9 | 11 | 16 | 2650 | 2590 | 2590 | 500 | 0 | 0 | 20 | 20 | 40 | 120 | 120 | 180 |
| 7 | 10 | 14 | 18 | 2990 | 3300 | 3060 | 380 | 0 | 0 | 20 | 20 | 50 | 120 | 120 | 190 |
Table 11.
Strategy comparison for two train pick-ups (in %).
| Delivery Time | MAX VOLUME | NO STOCKYARD | BEST FIT | ||||
|---|---|---|---|---|---|---|---|
| Short | Medium | Long | Short | Medium | Long | ||
| Number of trucks | 100 | −54 | −2 | −5 | −33 | −5 | −9 |
| Transhipment volume | 100 | −23 | −1 | −3 | −7 | −4 | −5 |
| Required stockyard | 100 | −97 | −100 | −100 | −75 | −100 | −78 |
| Average queuing times | 100 | −50 | −7 | −7 | −35 | −7 | −11 |
| Maximal queuing times | 100 | −26 | −8 | −5 | −15 | −8 | −10 |
© 2020 by the authors. Licensee MDPI, Basel, Switzerland. This article is an open access article distributed under the terms and conditions of the Creative Commons Attribution (CC BY) license (http://creativecommons.org/licenses/by/4.0/).
Share and Cite
MDPI and ACS Style
Kogler, C.; Rauch, P. Contingency Plans for the Wood Supply Chain Based on Bottleneck and Queuing Time Analyses of a Discrete Event Simulation. Forests 2020, 11, 396. https://doi.org/10.3390/f11040396
AMA Style
Kogler C, Rauch P. Contingency Plans for the Wood Supply Chain Based on Bottleneck and Queuing Time Analyses of a Discrete Event Simulation. Forests. 2020; 11(4):396. https://doi.org/10.3390/f11040396
Chicago/Turabian StyleKogler, Christoph, and Peter Rauch. 2020. "Contingency Plans for the Wood Supply Chain Based on Bottleneck and Queuing Time Analyses of a Discrete Event Simulation" Forests 11, no. 4: 396. https://doi.org/10.3390/f11040396
Note that from the first issue of 2016, this journal uses article numbers instead of page numbers. See further details here.