A Color Consistency Processing Method for HY-1C Images of Antarctica
by
 , , , ,
Zhijiang Li
1 ,
,
Haonan Zhu
1,
Chunxia Zhou
2,*,
Liqin Cao
1,*,
Yanfei Zhong
3,
Tao Zeng
4 and
Jianqiang Liu
4 1
School of Printing and Packaging, Wuhan University, Wuhan 430079, China
2
Chinese Antarctic Center of Surveying and Mapping, Wuhan University, Wuhan 430079, China
3
State Key Laboratory of Information Engineering in Surveying, Mapping and Remote Sensing, Wuhan University, Wuhan 430079, China
4
National Satellite Ocean Application Service, Beijing 100081, China
*
Authors to whom correspondence should be addressed.
Remote Sens. 2020, 12(7), 1143; https://doi.org/10.3390/rs12071143
Submission received: 3 March 2020
/
Revised: 24 March 2020
/
Accepted: 28 March 2020
/
Published: 3 April 2020
(This article belongs to the Section Remote Sensing Image Processing)
Abstract
:The HY-1C satellite, as part of China’s optical satellite constellation for global ocean monitoring, monitors the ocean and coastal environment by the three broad visible bands of the Coastal Zone Imager (CZI) instrument. However, as a result of the sensor instrument noise, the atmospheric environment during imaging, and the shooting angle, the satellite images often show uneven illumination and inconsistent color between neighboring images. In this paper, according to the characteristics of the HY-1C CZI instrument, we propose a color consistency processing framework for coastal zone images of Antarctica. First of all, the high-frequency and low-frequency information of the image is separated by a statistical filter with simple clustering. The uneven lighting is then replaced by artificial lighting, which is globally uniform. Finally, the color difference between images is corrected by a color transfer method. In order to evaluate the color consistency results quantitatively, a new quantitative evaluation method is proposed. The experimental results for the coastal zone images of Antarctica show that the new processing framework can effectively eliminate the unevenness in the lighting and color. The mosaic results show a good performance in consistent lighting and tones, and the lack of visible mosaic lines proves the effectiveness of the proposed method. The quantitative evaluation analysis confirms the superiority of the proposed method over the Wallis method.
1. Introduction
The HY-1C satellite is the third experimental satellite launched by China for monitoring the ocean surface. The HY-1C and HY-1D satellites launched in 2018 and 2019, respectively, undertake the observation of the global ocean surface in the morning and the afternoon. The Coastal Zone Imager (CZI) instrument onboard the HY-1C satellite has the characteristics of a large swath width and a high spatial resolution, and it produces observations with a high contrast. It can capture real-time observations of coastal areas and can obtain the distribution of suspended sediments in estuaries and harbors. In addition, marine environmental concerns such as sea ice, red tide, green tide, and pollution events can be monitored by the CZI instrument [1,2,3].
Due to the parameters of the imaging instrument, light source, and shooting angle, the lighting in HY-1C imagery is not uniform, and the color between the images is inconsistent. As a result, during image mosaicking, a significant blocky effect occurs in the mosaic result, which interferes with target recognition and other observations. Therefore, color consistency processing, as a mosaic preprocessing task, is an important consideration.
The traditional methods for the color consistency processing of remote sensing images are mostly based on image processing tools or adjustment functions, according to the images to be corrected [4,5]. However, it is difficult to define the processing rules for different images. In addition, the manual operation takes much time and effort. Inspired by the digital image homogenization algorithms, some automated machine processing methods for digital images have been applied to the color consistency processing of remote sensing images. For example, Wang et al. [6] presented a processing flow and a corresponding processing approach based on the mask dodging principle. This method uses a mathematical model to simulate the changes of brightness and compensate the different parts of the image. It can achieve a satisfactory effect and can remove the uneven illumination of optical images. However, how to set the filter size is an open question. Based on the mask principle, a number of methods using specific filters have been proposed, such as the improved mask dodging method [7], improved mask methods [8,9,10,11], and the Wallis filter [12]. These methods are all based on filtering in the spatial domain. However, limited by the texture, color, and filter, these methods all need to be adjusted to the specific image characteristics when utilized in practice. To address this issue, Li et al. [13] proposed a uniform algorithm based on adaptive templates, which works by fitting the secondary surface of the brightness mean of the local area. However, this approach fails for complex brightness distributions and large-sized images, due to the number of windows and the amount of calculation.
In addition to filtering in the spatial domain, some approaches have been developed for filtering in the frequency domain [14,15,16]. For example, a method for removing the uneven light from images using multiple wavelet transformations was proposed by Zheng et al. [17]. This method takes into account both the frequency domain and the spatial domain of the digital images and improves the efficiency of the algorithm and the quality of the results. In addition, the homomorphic filtering method [18] utilizes a filter function to highlight the high frequency and weaken the low frequency, which helps the low-contrast images achieve improved brightness consistency.
The principle of physiology is also used in digital image processing. For example, Zhang et al. [19] presented an approach based on physical transformation and psychological perception. Based on the principle of the visual physiology of the human eye, retinex homogenization algorithms [20,21,22] have been used to realize consistent processing of images by means of retinal mechanism simulation. However, as the physiological study of the human eye is still an open problem, such methods sometimes lead to image degradation and color anomalies.
The color consistency of remote sensing images needs to be achieved according to the image features. Since the HY-1C satellite was recently launched and the Antarctic images feature a high dynamic range and high contrast, the direct application of previous methods cannot obtain good processing results. For previous methods, much manual operation is still necessary.
In this paper, according to the characteristics of the HY-1C CZI instrument for Antarctica, a novel color consistency processing framework is proposed to address the problems of large color differences and uneven lighting in the image mosaics. There are two steps in the proposed framework: single-view consistency processing and multi-view consistency processing. Firstly, the individual images are processed to achieve color consistency, based on mask theory. Auxiliary masks are obtained by simple clustering and used as semantic information to adjust the filter functions adaptively. The low-frequency information extraction of the scene segmentation is obtained by the use of a Gaussian filter with an auxiliary mask. After the color consistency processing of each image, a color transfer method is introduced for adjacent images to be mosaicked, to achieve color consistency for multiple images. An evaluation method for the color consistency of remote sensing images is also introduced, which includes both subjective and objective evaluations. In summary, the proposed method takes into account the consistency in both a single image and between different images.
2. Data Preprocessing and Analysis
2.1. Study Dataset
In this study, 63 remote sensing images of Antarctica were collected, which were obtained by the HY-1C CZI instrument between December 2018 and March 2019. The projected coordinate system of the original images was World Geodetic System 1984. Because the images were located near the South Pole, all the remote sensing images used in this study were converted into the WGS 1984 Antarctic Polar Stereographic coordinate system for better visibility. The dataset was made up of 16 bit three channel multispectral images, which were converted to 8 bit images in the data preparation. The images were compressed according to the cumulative histogram and the pixel frequency. Some pixels with high values were compressed to improve the retention of the main order of the original images.
The cumulative histogram of each image was calculated, and the minimum and the maximum truncation frequencies were set as and . The truncation frequency was set to preserve as much order information as possible in the conversion process. For each image, the pixel values and corresponding to the truncation frequency on the cumulative histogram were recalculated as follows:
where is the pixel value in the cumulative histogram corresponding to the frequency and is the cumulative histogram frequency. The original images were then translated to 8 bit images as follows:
where is the value of the pixel in the 16 bit image and is the converted 8 bit value. The images were stored in color mode and compressed independently in each color channel.
2.2. Data Analysis
2.2.1. Uneven Lighting
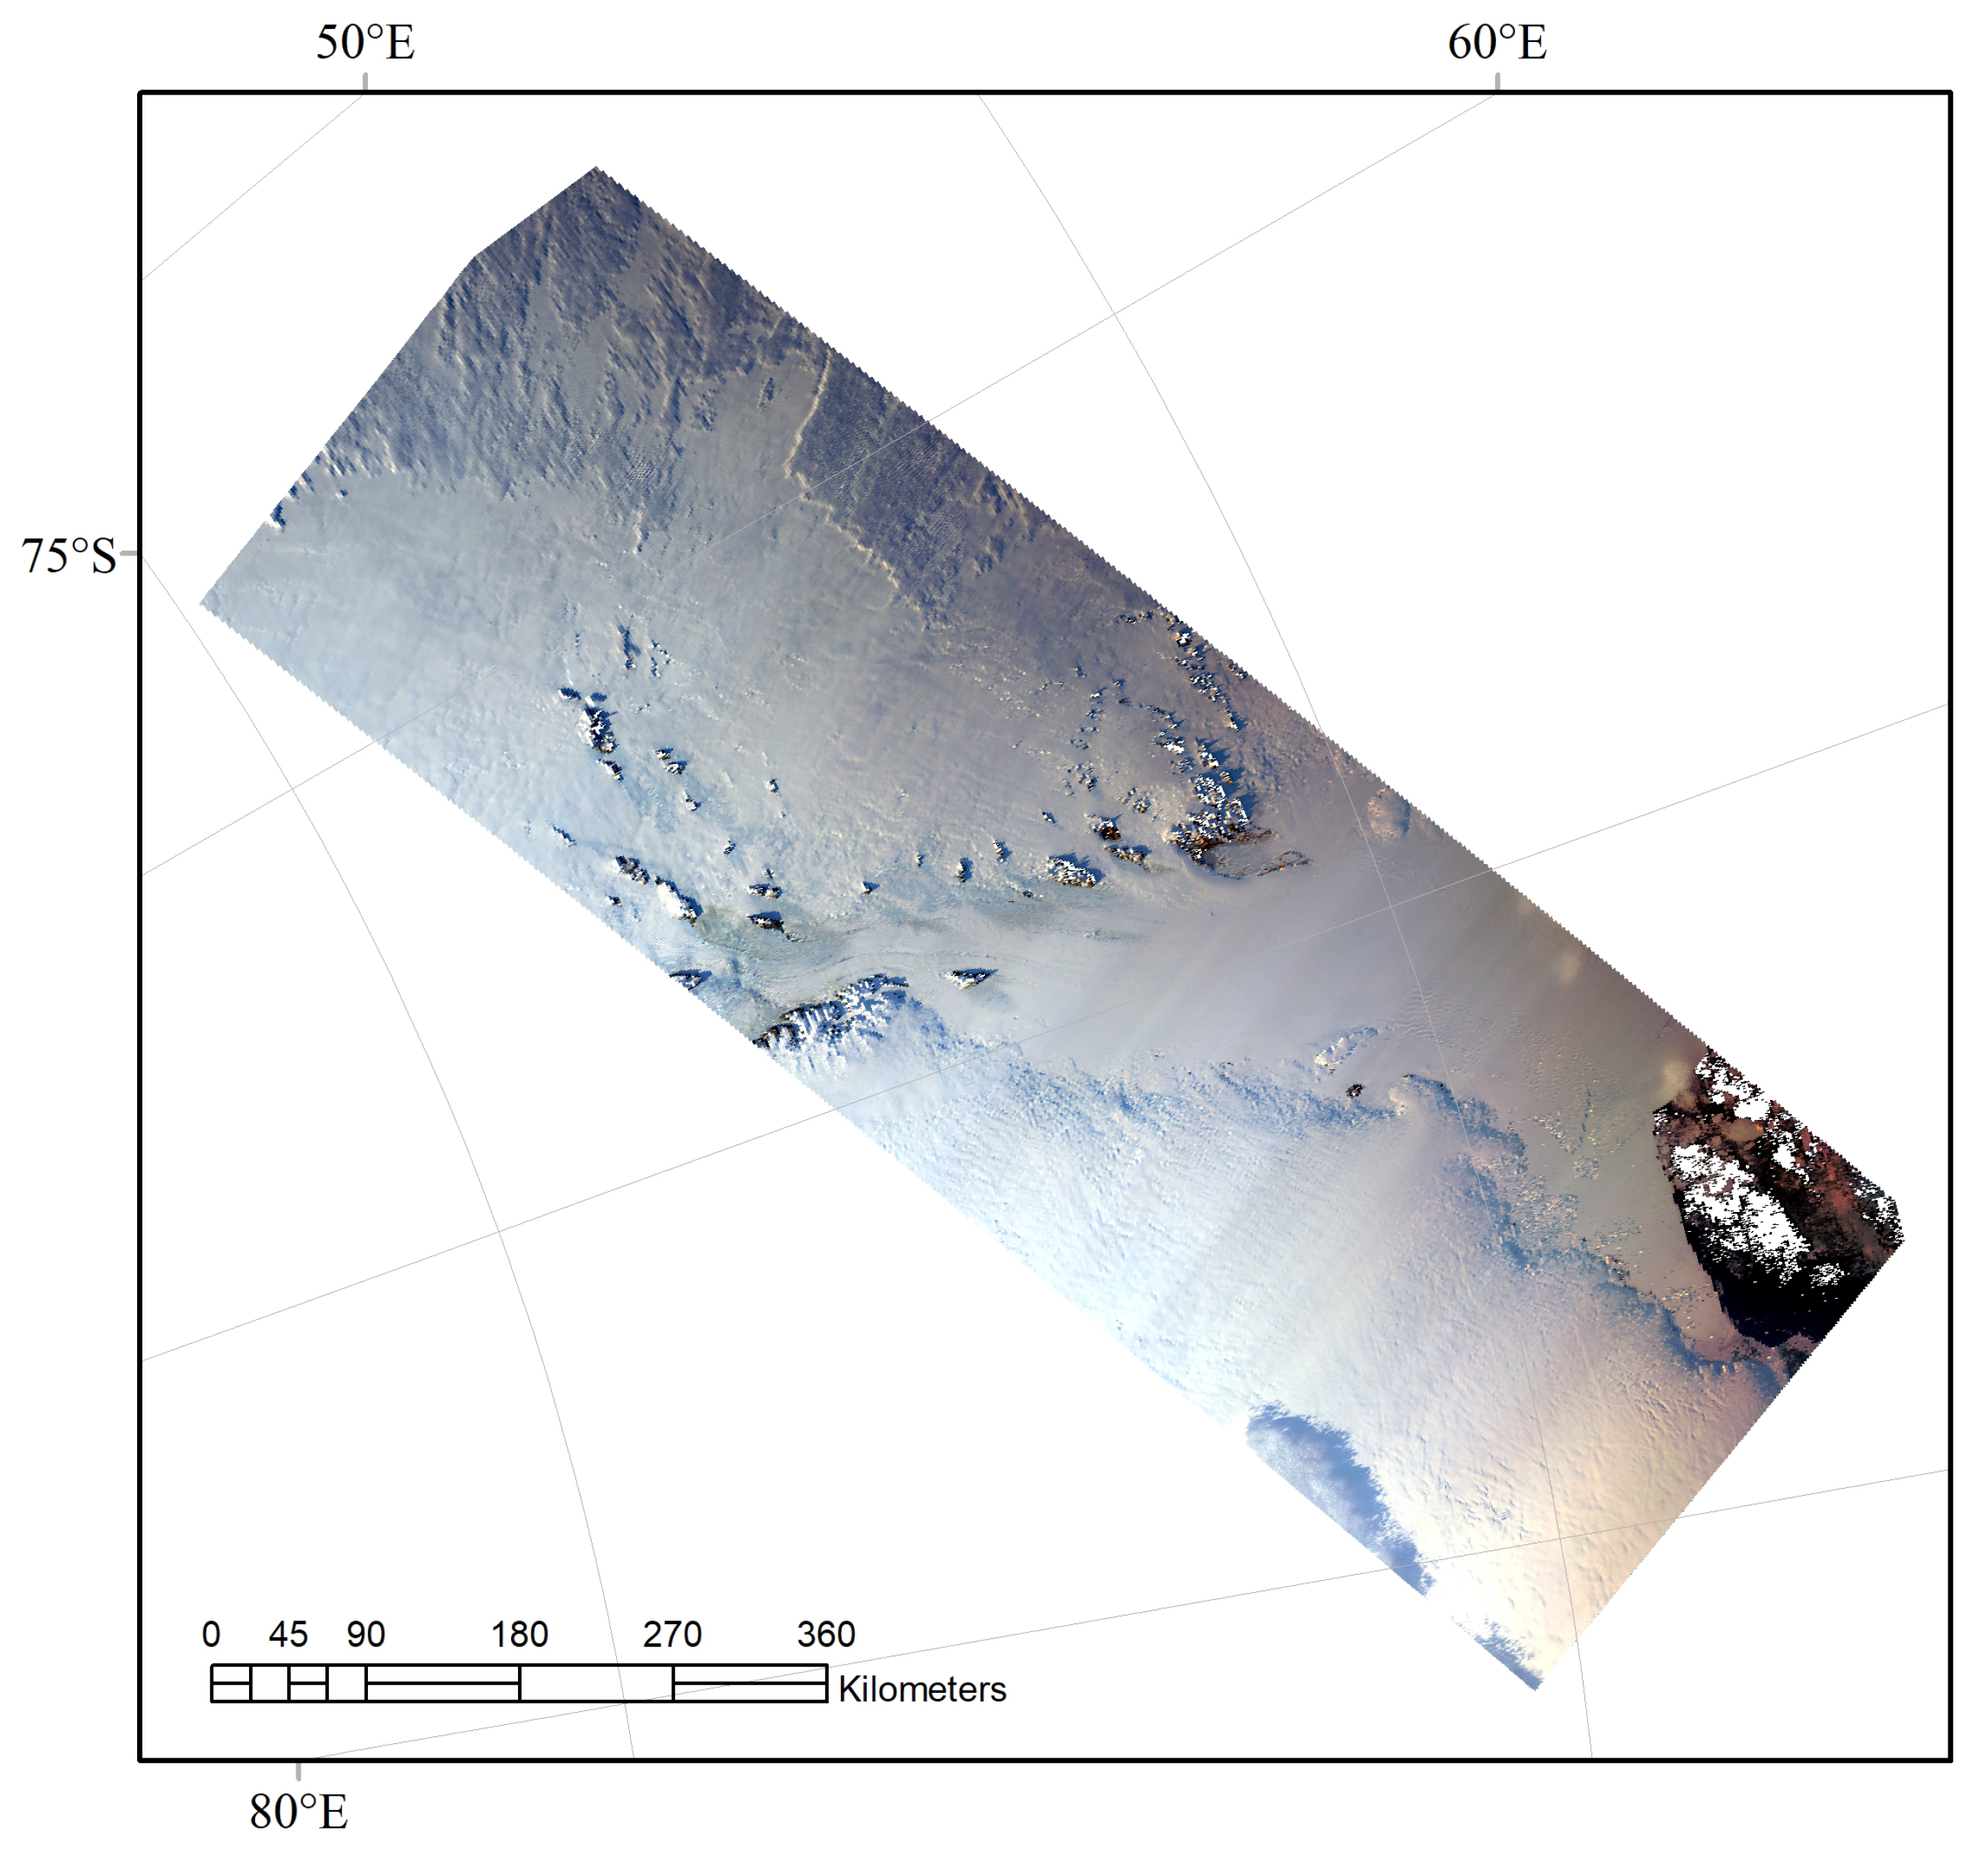
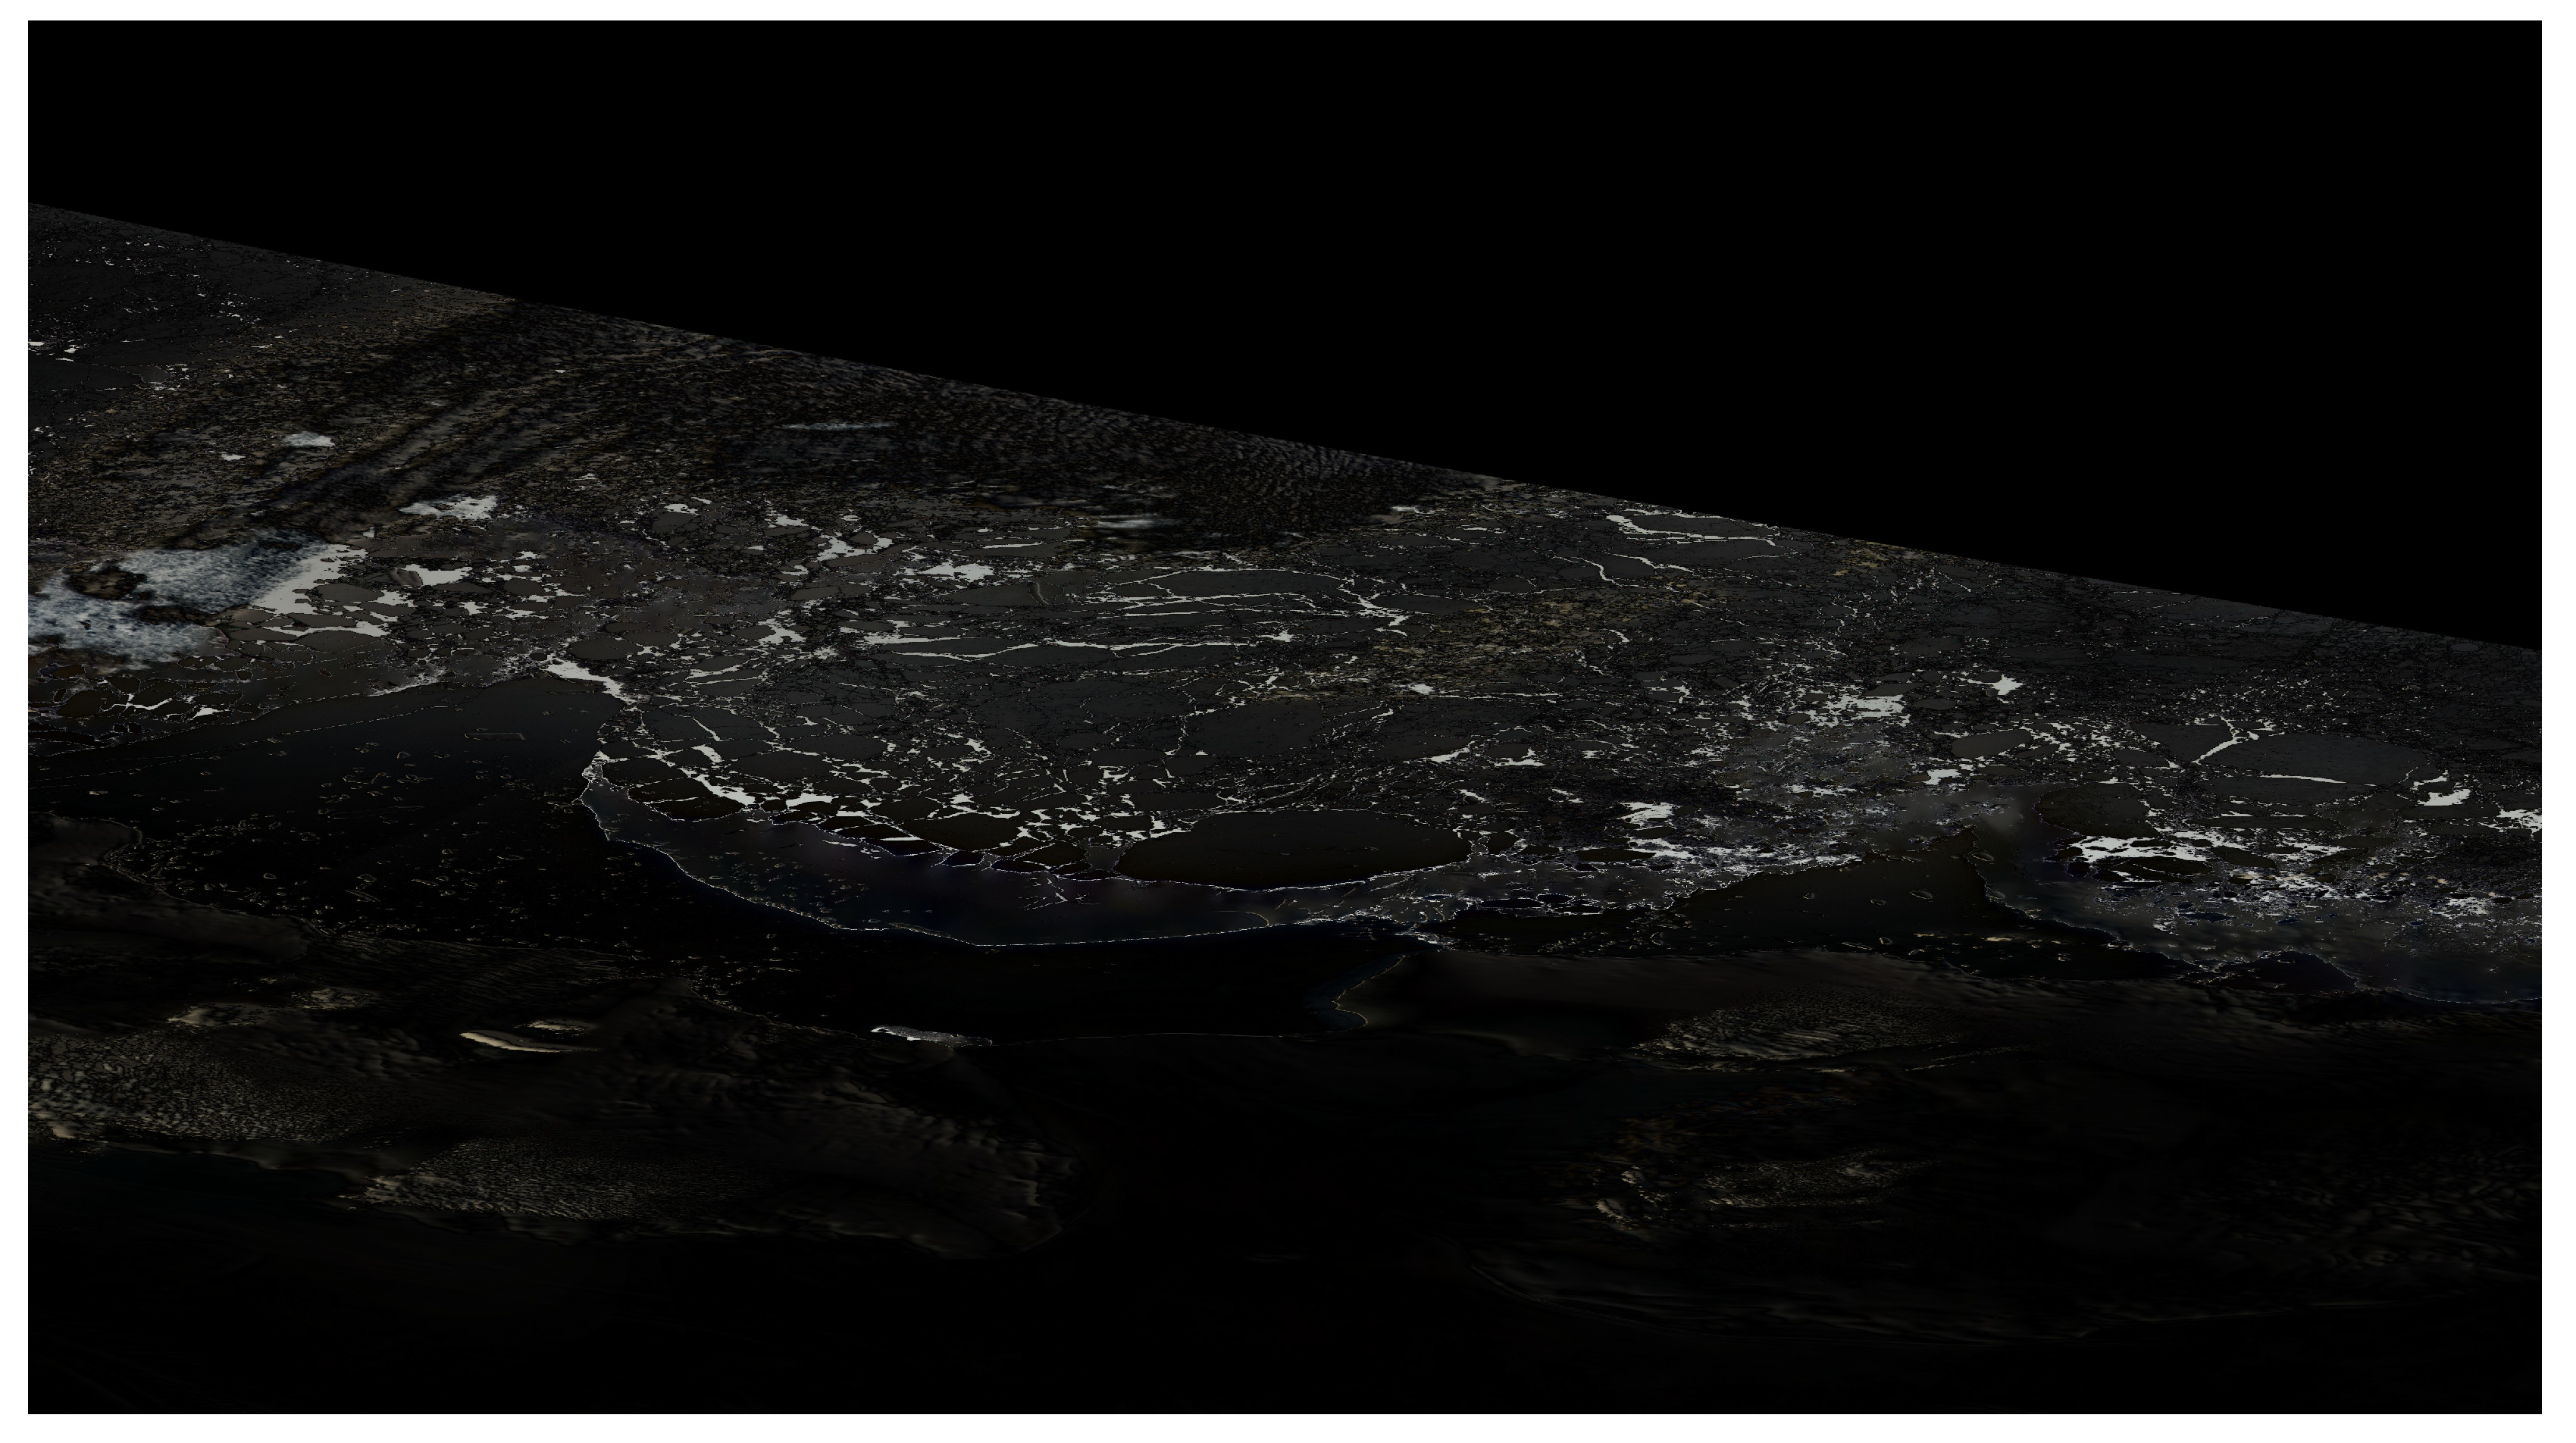
As a result of the changes of the light incident angle, plus atmospheric absorption and refraction, there is uneven lightness and/or color in HY-1C images. Different local parts of the image are illuminated differently, which causes uneven brightness and color in the overall image. An example image with uneven lighting is shown in Figure 1.
2.2.2. Inconsistent Colors
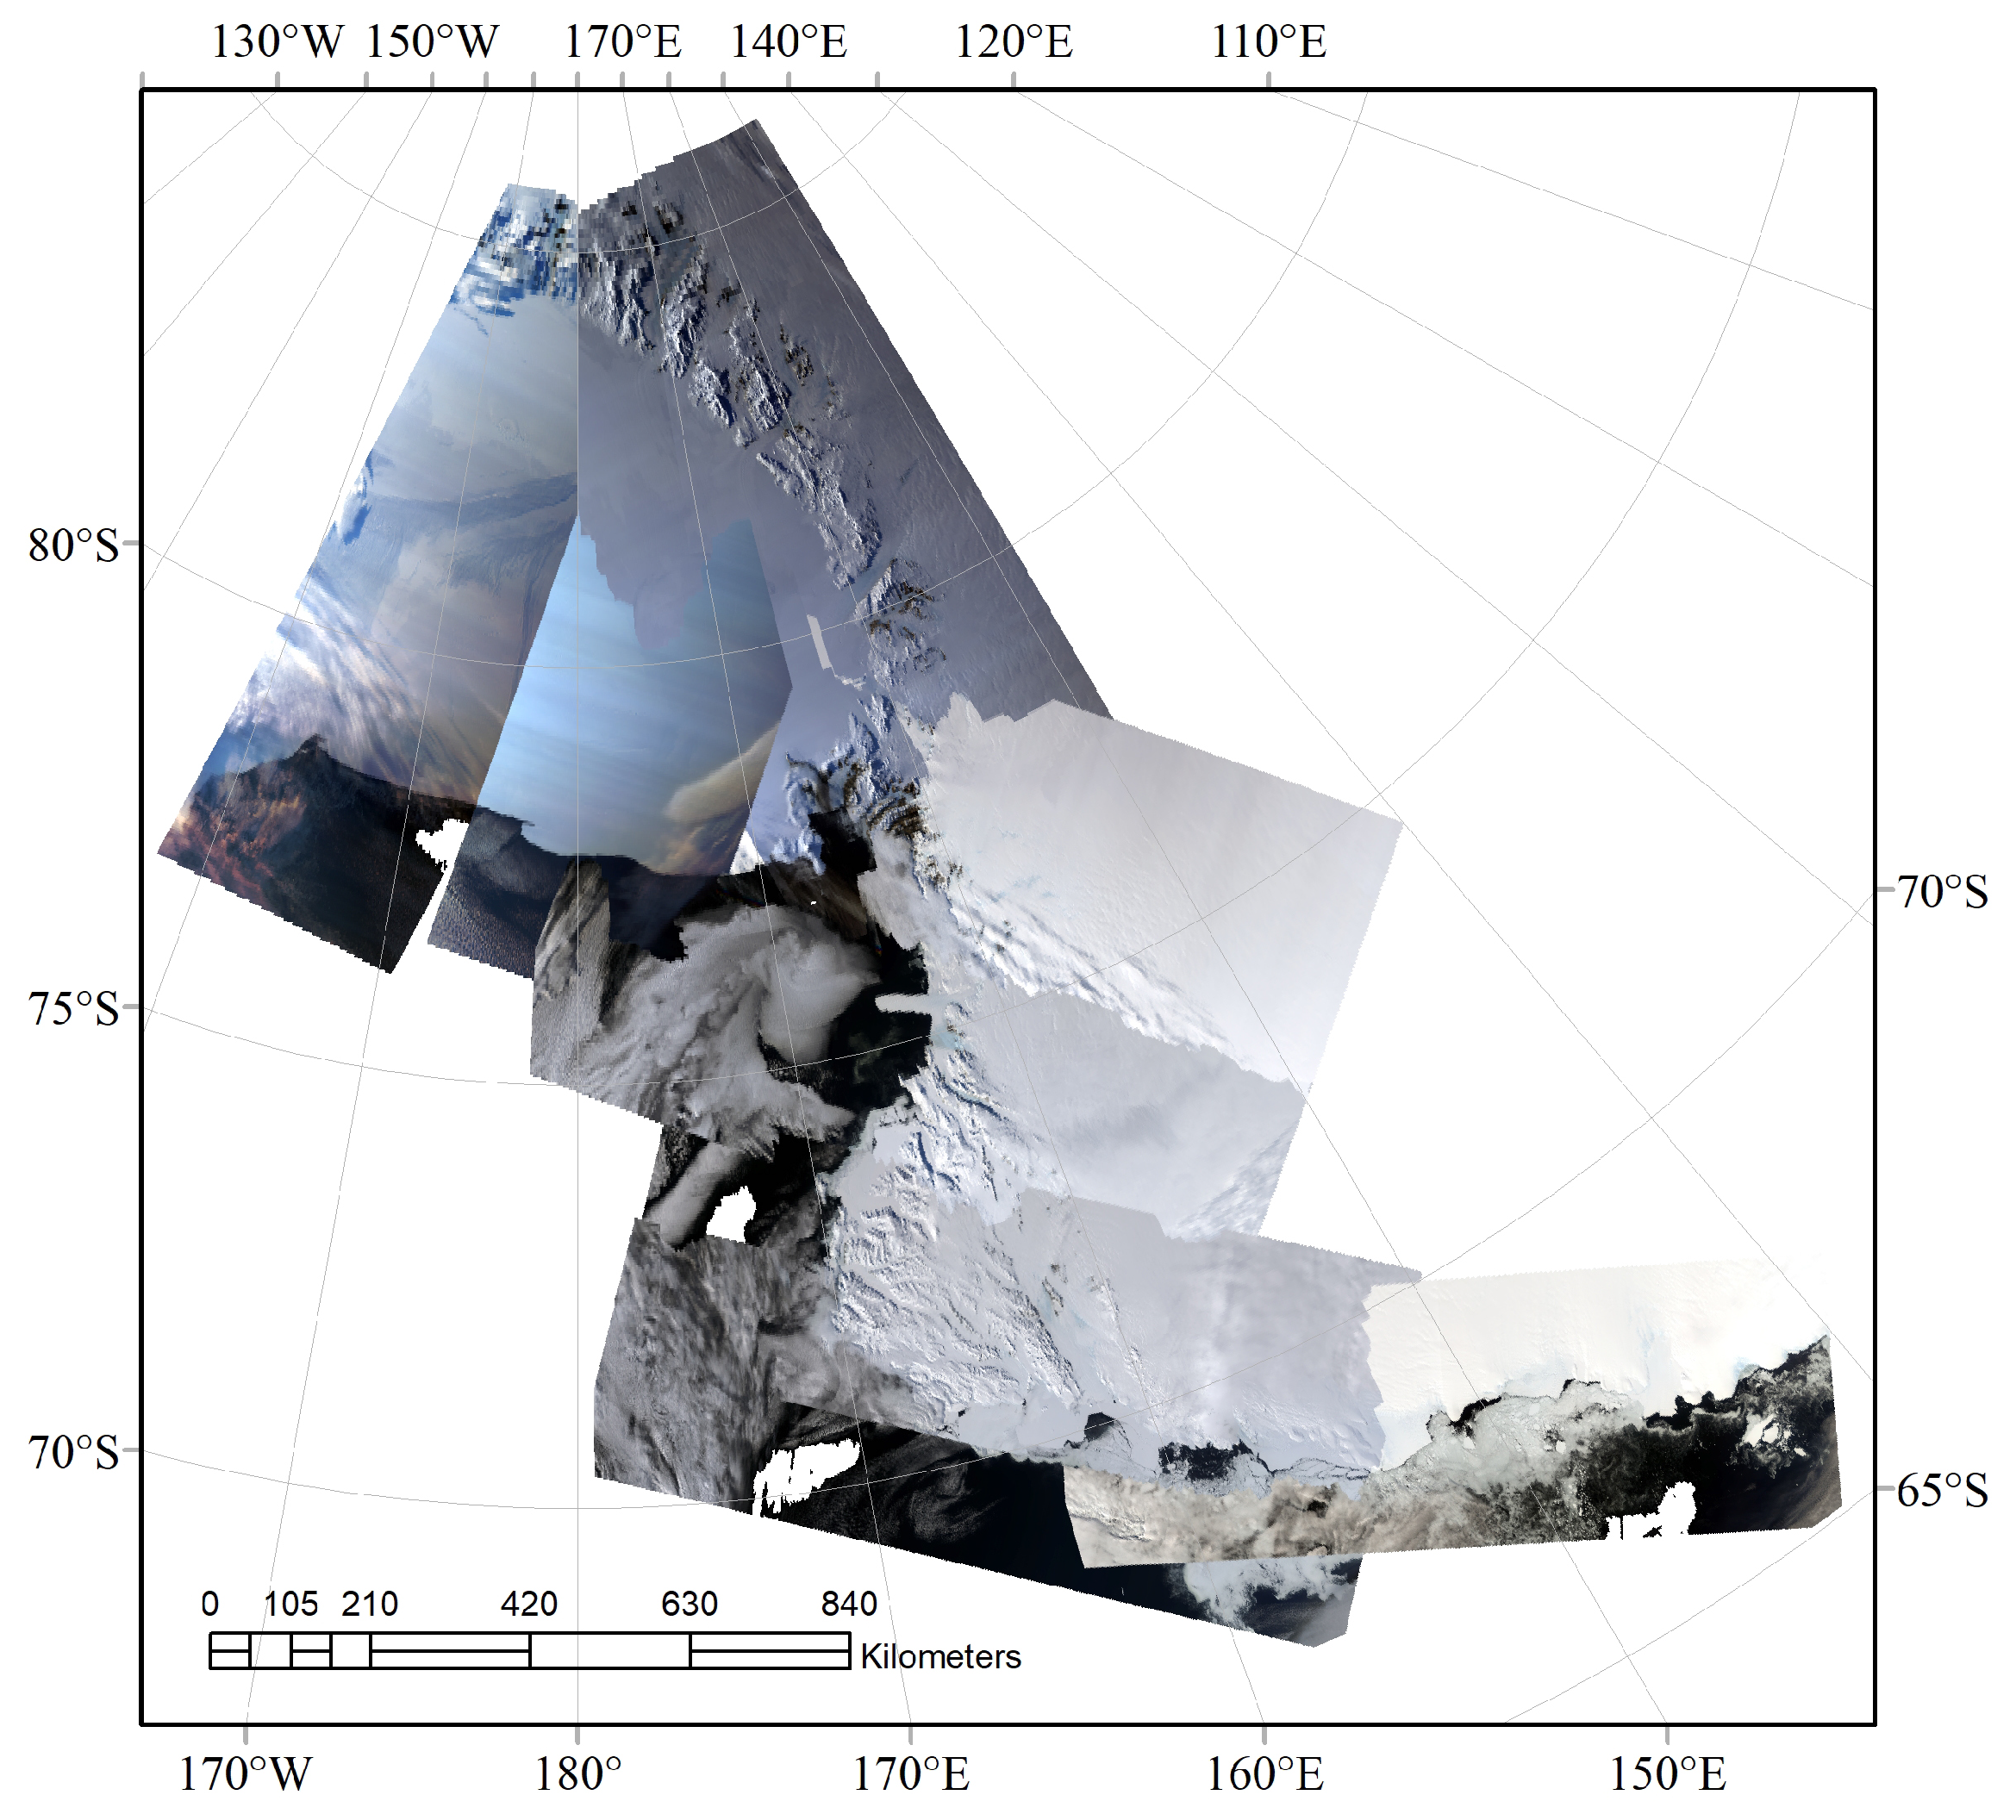
Due to the solar elevation angles and weather conditions during image acquisition, there are large differences in irradiance and color distribution between images. Figure 2 shows mosaicked images with adjacent locations, which illustrates the significant differences in brightness and color between images. An ideal mosaic result should have uniform tone and brightness, and the different sub-images should be difficult to distinguish.
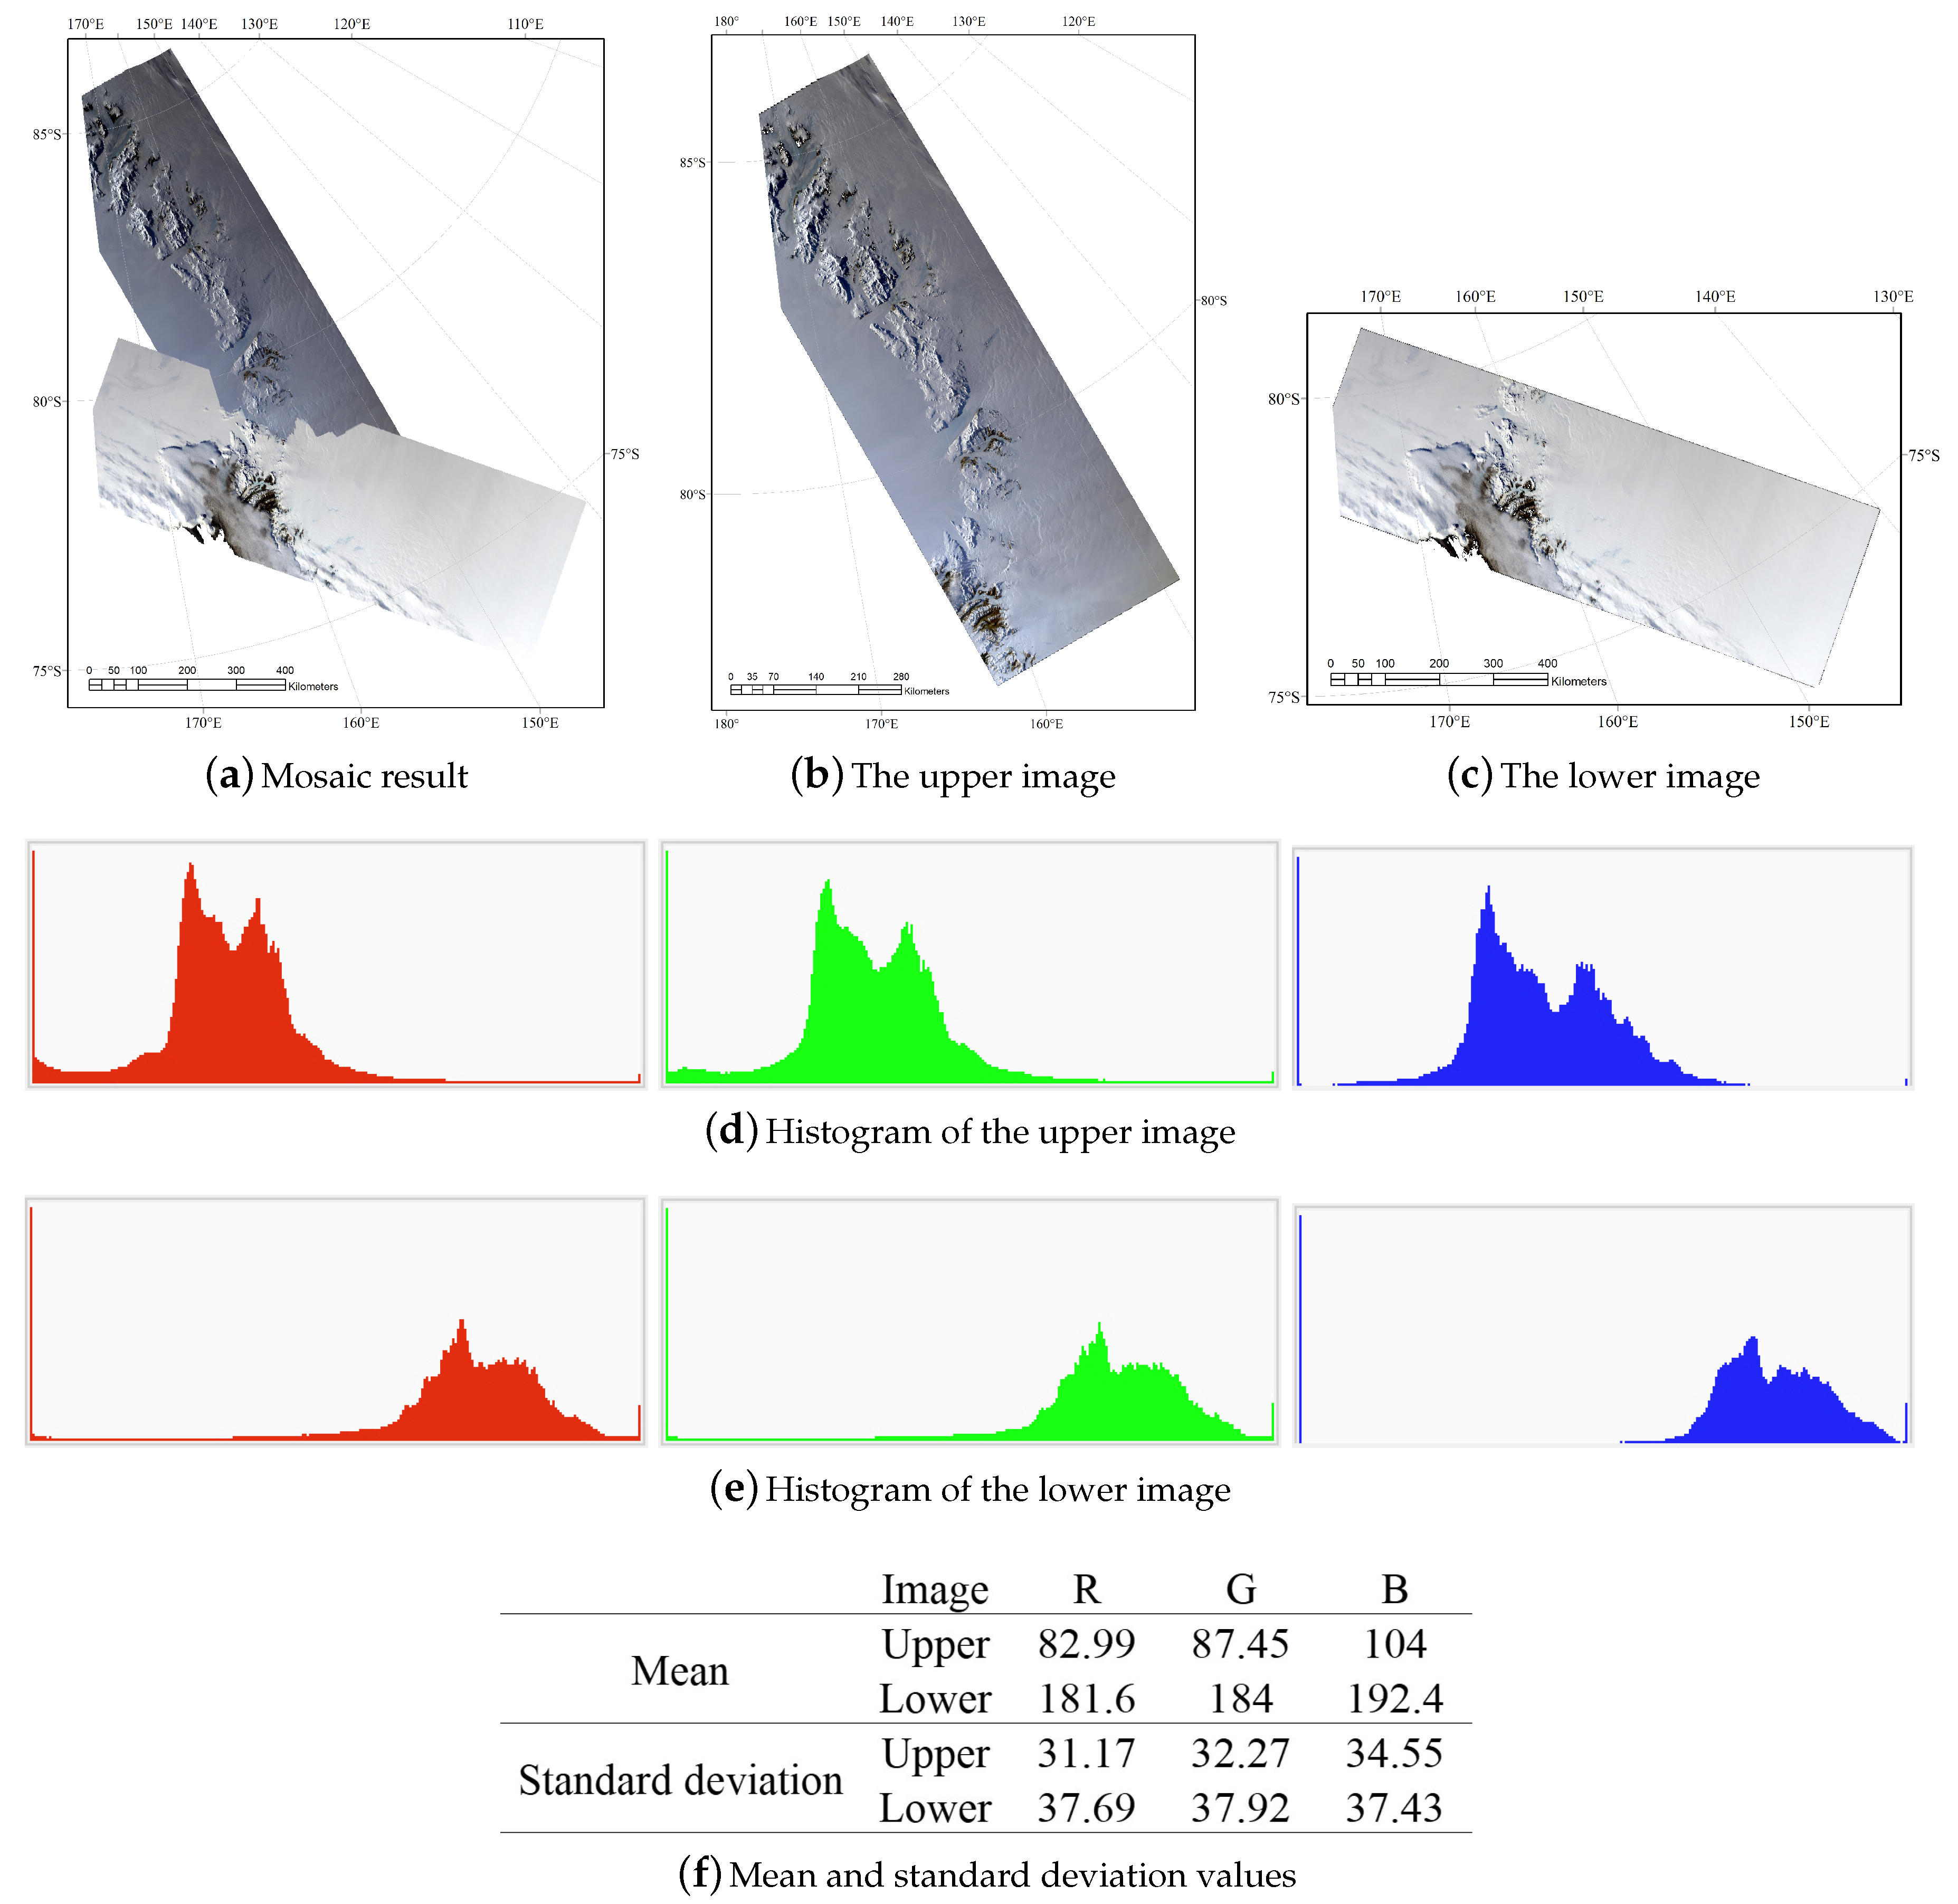
To illustrate the difference between images, two adjacent images were selected randomly from the dataset. Figure 3 shows their color histograms, means, and standard deviation values. It is clear that the color histogram, mean, and standard deviation values were quite different, whereas the contents of the two images were in fact similar. According to the laws of natural imagery, two images with adjacent locations and similar contents should had similar histogram, mean, and standard deviation values. This example clearly demonstrated the color consistency problem between images.
3. Consistency Processing Method
3.1. Color Consistency Framework
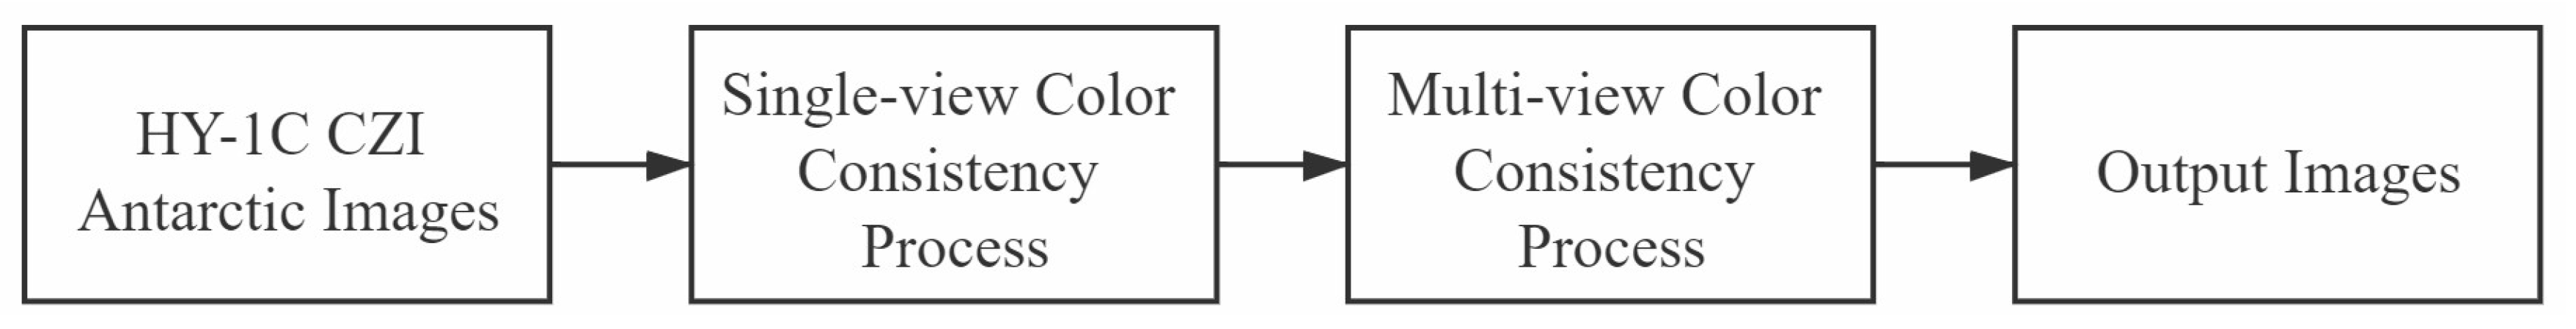
To address the problems of uneven lighting and color inconsistency, a color consistency processing method for the HY-1C CZI images of Antarctica is proposed. This processing framework consisted of two parts: single-view consistency processing and multi-view consistency processing. The overall processing framework is shown in Figure 4. First of all, the color, texture, and spatial distribution information was calculated to eliminate the uneven light and abnormal color existing in a single image, and we obtained an image with unified visual color perception. Then, on the basis of the previous step, a normalizing operation based on a color transfer method was performed between the different images. The light and/or color differences between images were thus eliminated, especially on both sides of the mosaic lines.
3.1.1. Single-view Consistency Process
Remote sensing images with uneven lighting can be represented by the following mathematical model [23]:
where is the original image, is the uneven lighting information, and is the ideal image with a uniform brightness distribution. This theory is the basis for the single-view color consistency processing. The most important issue is how to separate the uneven lighting information correctly from the original image. The theoretical basis for achieving color consistency of a single-view image is to extract the uneven lighting information by a reasonable method [24,25] and then remove it from the original image.
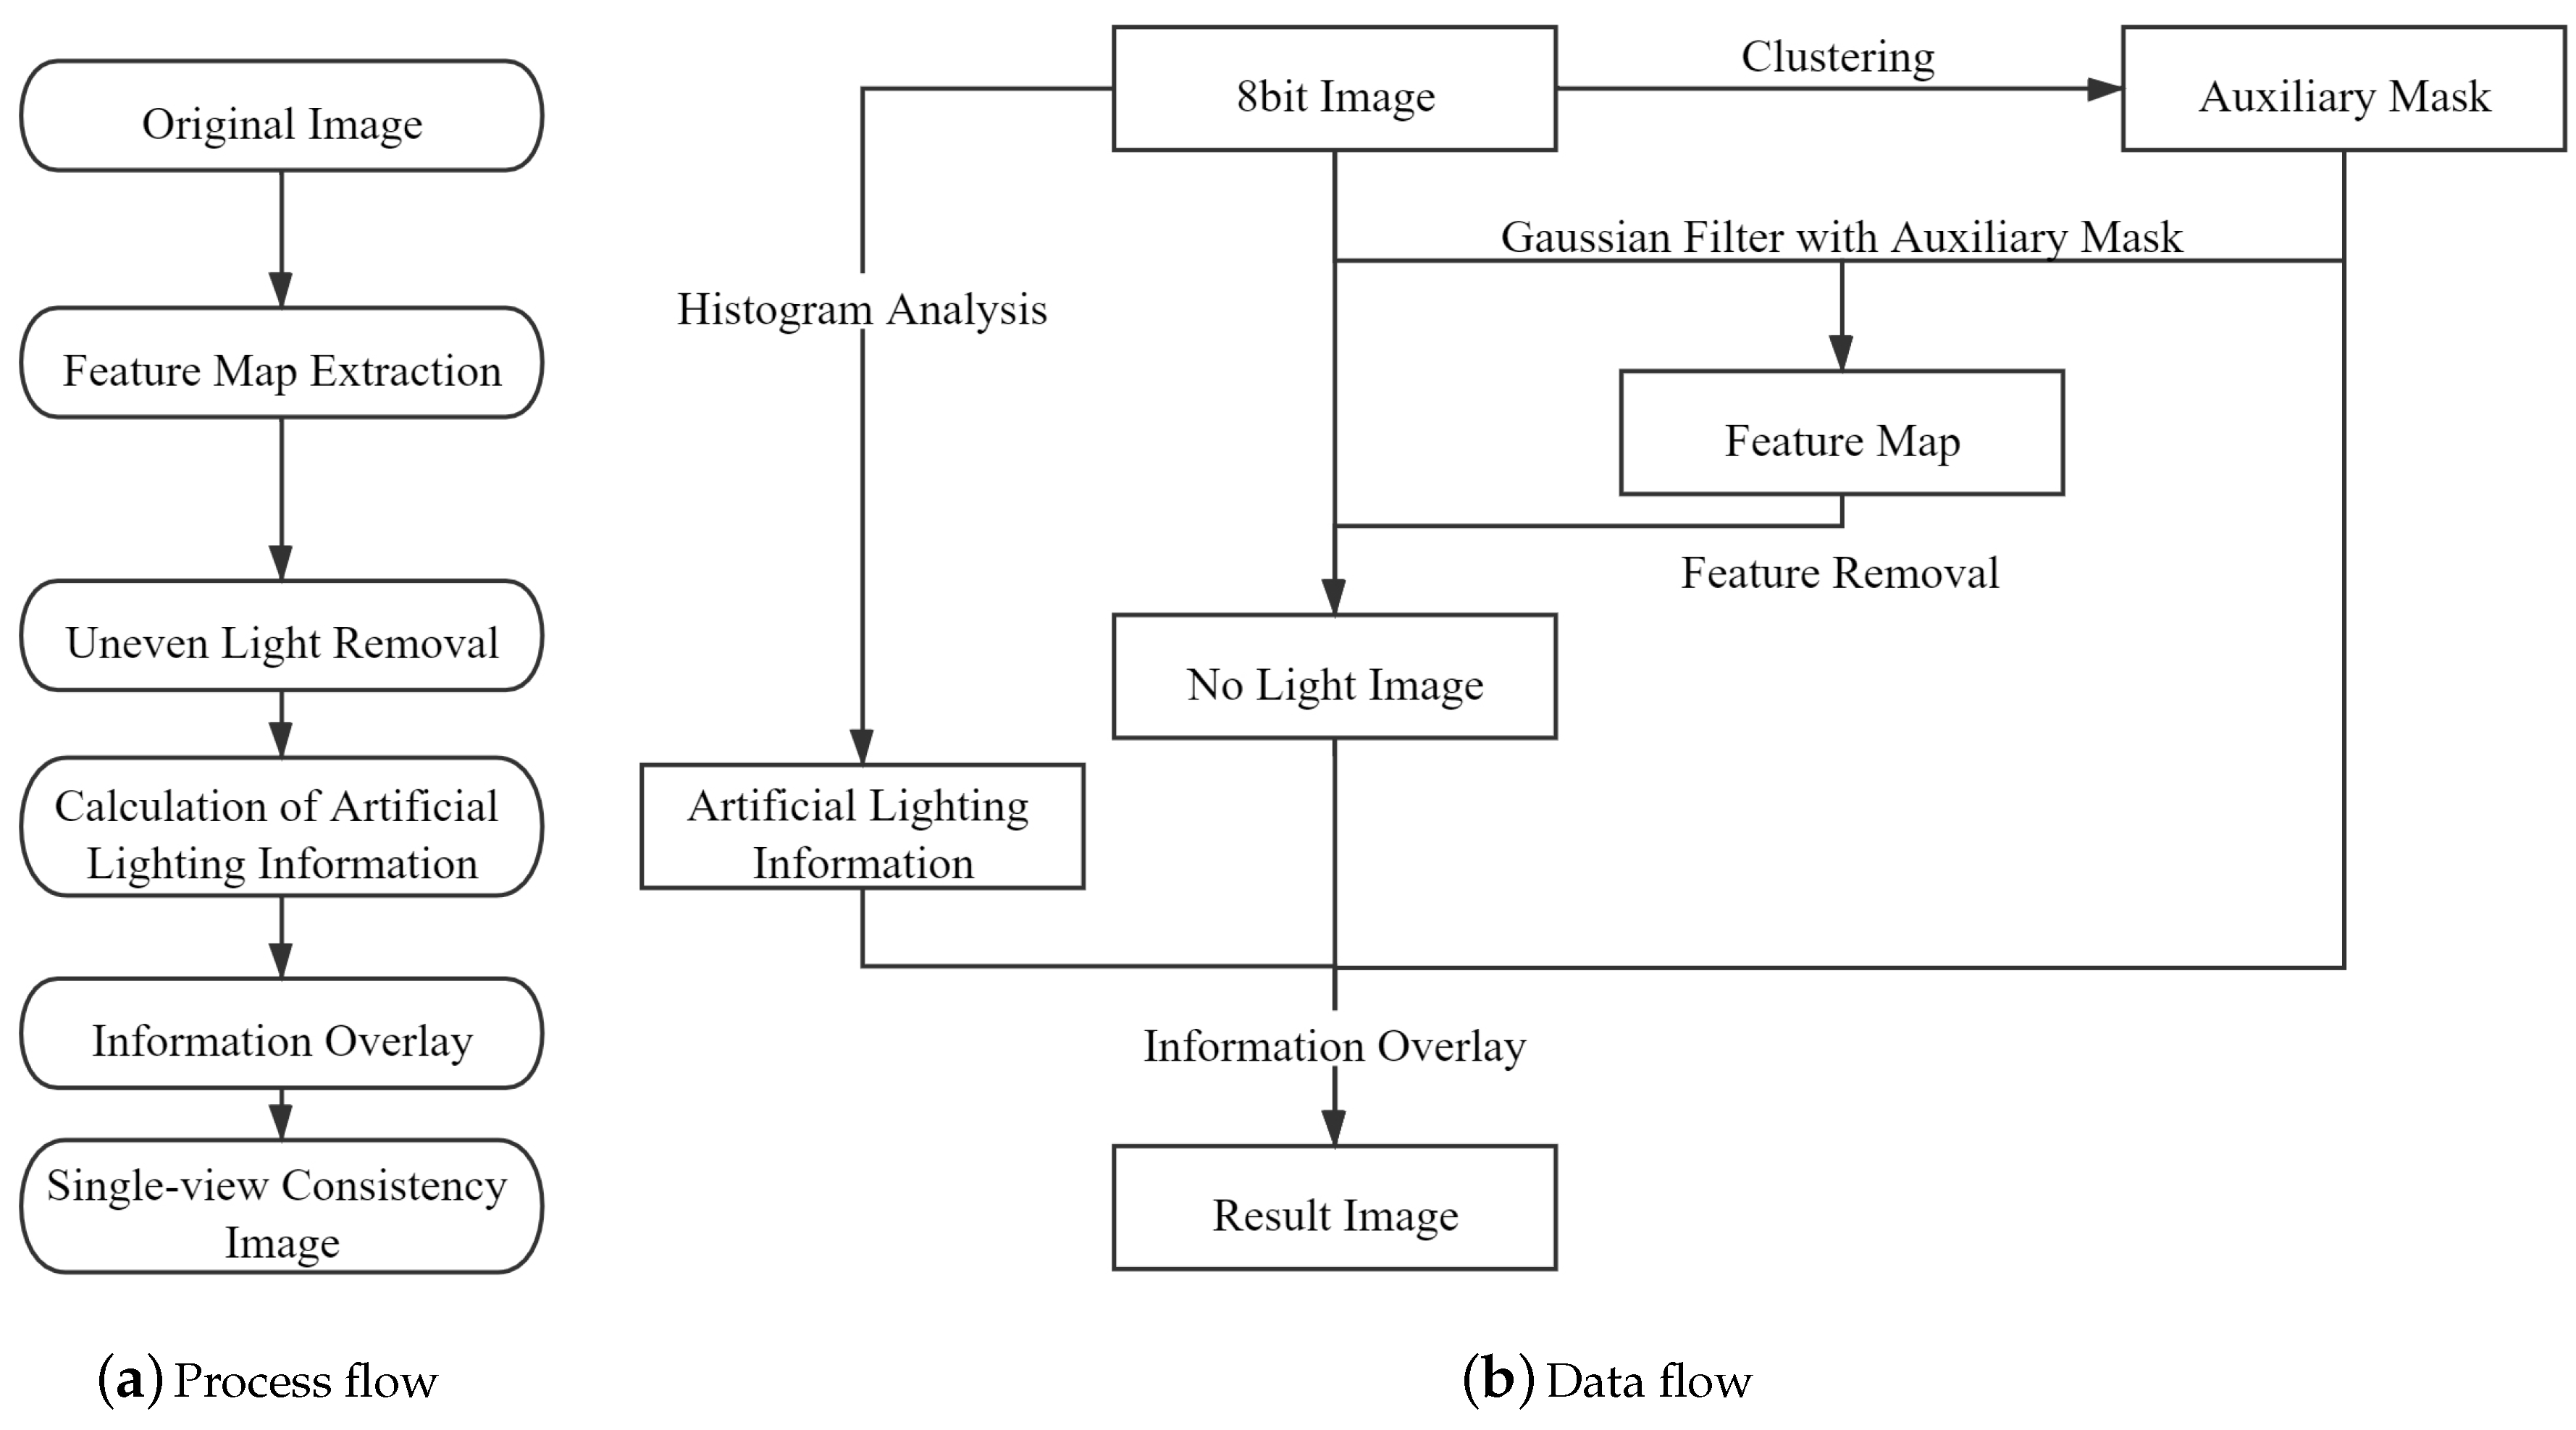
Inspired by the mask-based homogenization method [6], we improved the filter and made it suitable for the processing of the HY-1C imagery of Antarctica. We also developed a new single-view image consistency processing algorithm. There were four parts to the single-view consistency processing: (1) feature map extraction; (2) uneven light removal; (3) calculation of the artificial lighting information; and (4) information overlay. The flowchart of the method is shown in Figure 5.
In the process flow, there were two important parts: (1) the Gaussian filter with an auxiliary mask; and (2) the artificial lighting information. The filter was used to extract the uneven lighting information from the original image. The traditional Gaussian filter would mix the boundary parts and result in the edge fusion problem (as shown in Figure 6c). In order to optimize the processing of boundaries, a Gaussian filter with an auxiliary mask is proposed to separate the uneven lighting information (feature map) from the image. In addition, we also propose an artificial lighting information calculation algorithm for each image by means of a statistical method.
- Feature map extraction
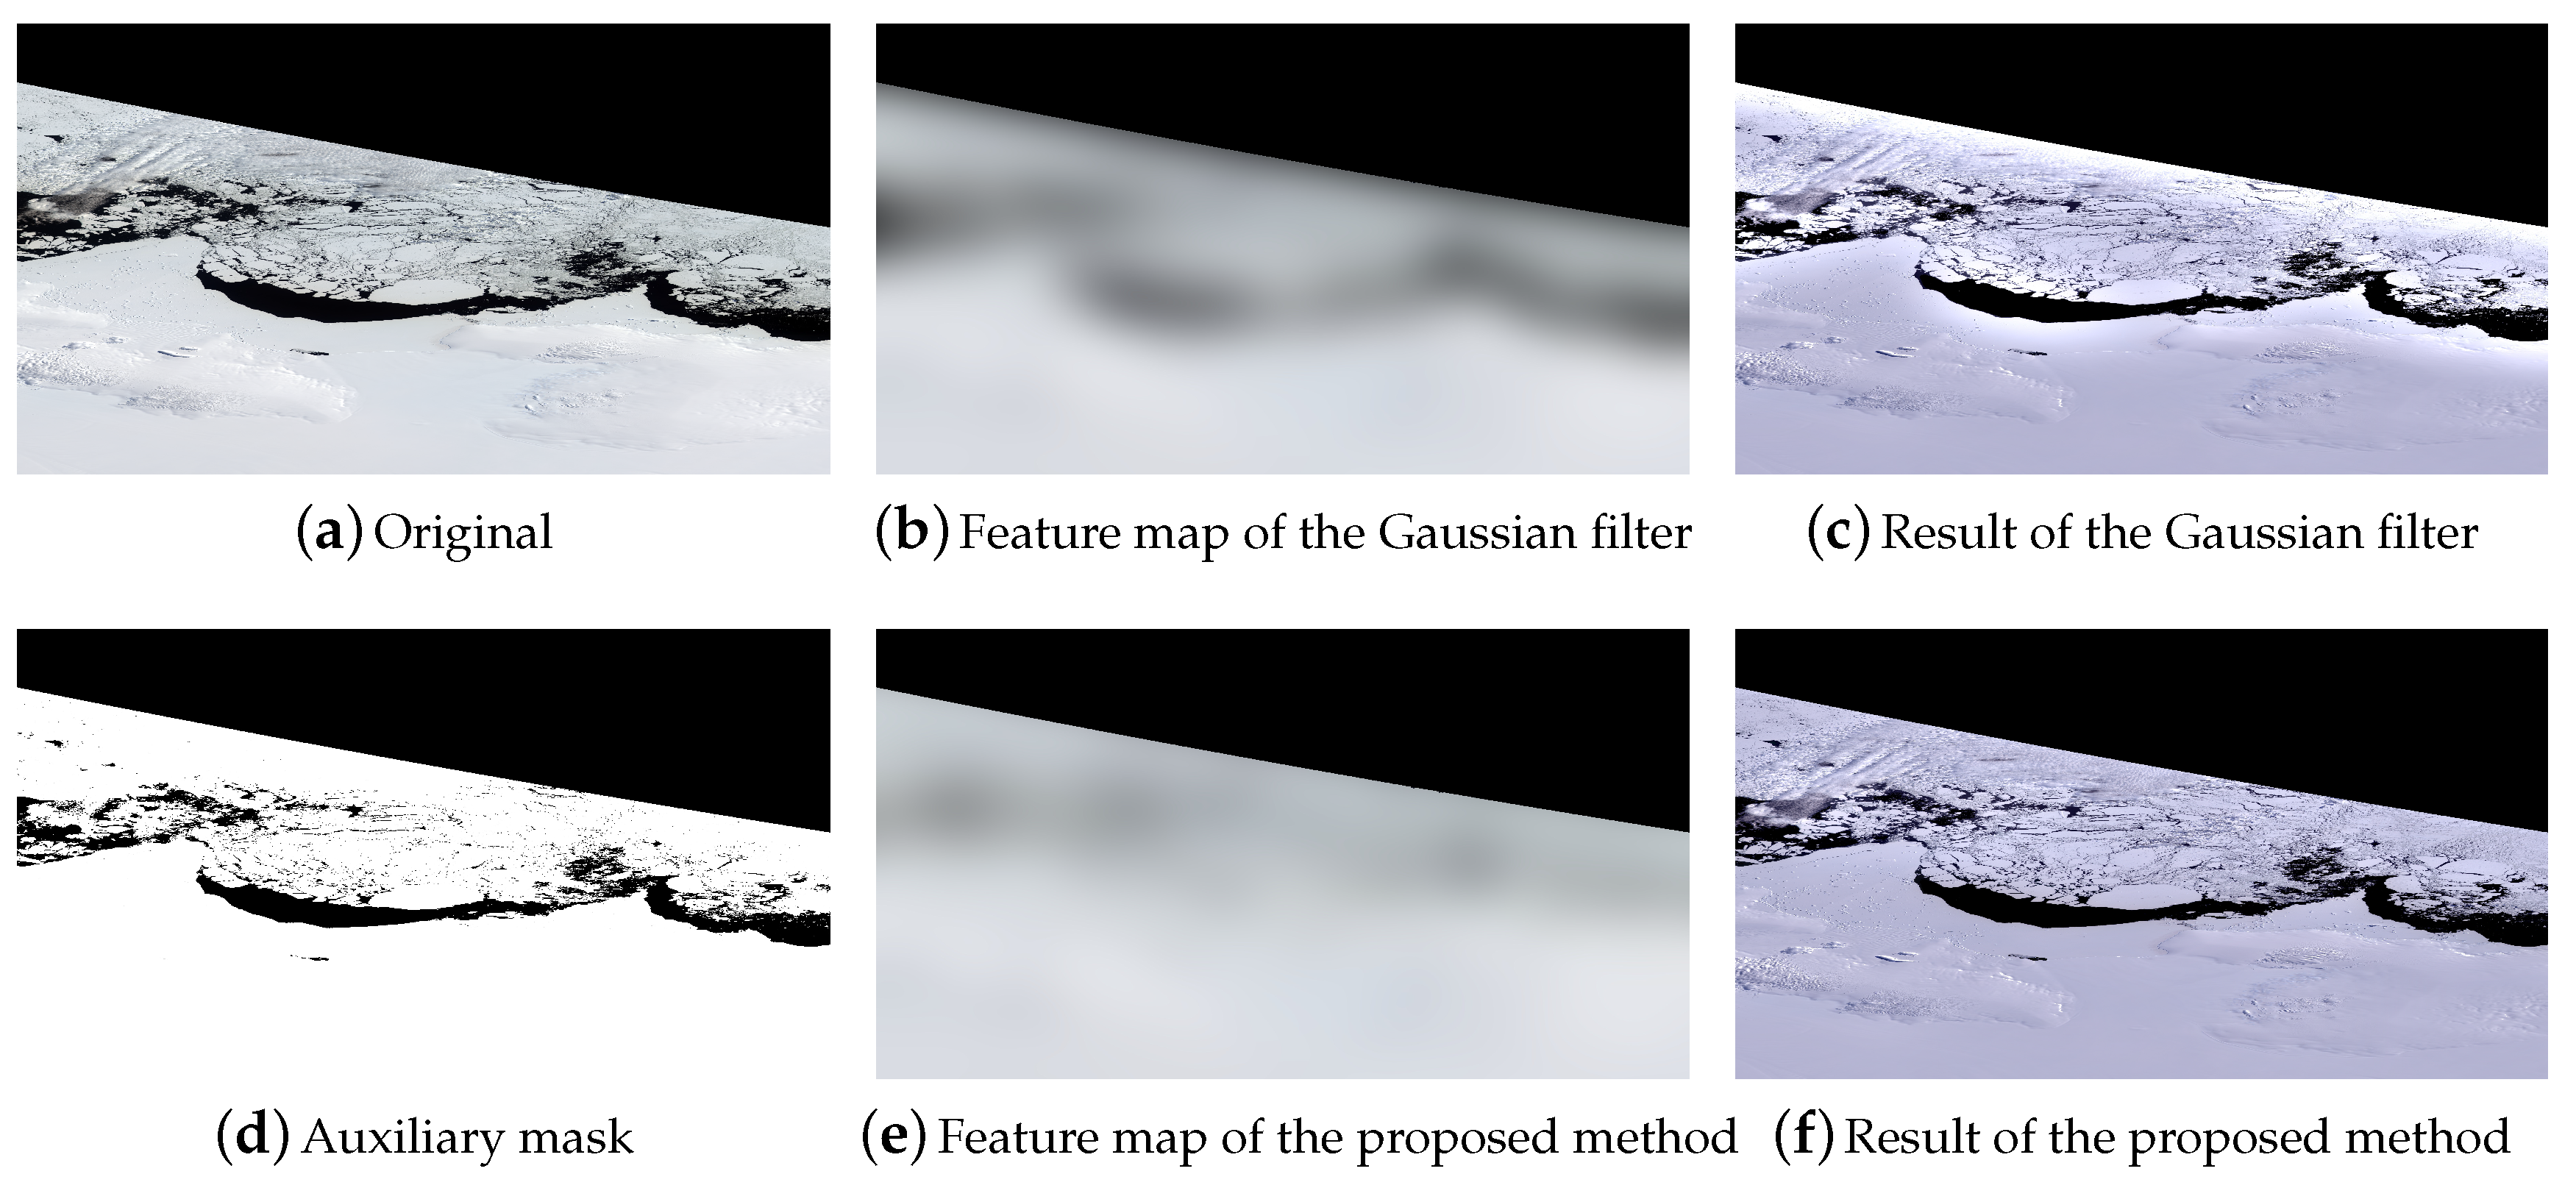
After Gaussian filtering, the low-frequency information with lighting and color information could be extracted. However, the result of the standard Gaussian filter for the HY-1C images of Antarctica still showed distinct Antarctic ice shelf and ocean parts, which formed high-contrast edges, as shown in Figure 6b. The reason for this was that the filter size for extracting the features was large, and the extracted light information was abnormal in the edge sections. It was clear that the color of the ice shelf boundary in Figure 6c was abnormal, as it was brighter than the inner part. To address this problem, we improved the filter and designed a Gaussian filter with an auxiliary mask.
Firstly, the image was clustered with manual adjustment according to the statistical brightness value, to obtain the auxiliary mask. The clustering results could define the Antarctic continent and the other parts, and the auxiliary mask could be expressed as follows:
The auxiliary mask of a sample image is shown in Figure 6d. We combined the Gaussian filter with an auxiliary mask and propose the Gaussian filter with the auxiliary mask:
where is the standard deviation of the Gaussian distribution, is a 2D Gaussian function, and pixels are not of the Antarctic continent part:
In the proposed method, the Gaussian kernel size was pixels, and can be calculated as follows:
The feature map of each image can be calculated by the Gaussian filter with the auxiliary mask as follows:
where ⨂ is the convolution calculation and is the kernel size. The results of Gaussian filtering with the auxiliary mask for a sample image are shown in Figure 6e. Compared with Figure 6b, it can be seen that the lighting and color consistency in the feature map were improved, without obvious boundary information. The final single-view consistency processing result is shown in Figure 6f.
- Uneven light removal
The main target of the mosaic task for the HY-1C images of Antarctica was the Antarctic continent. Therefore, to reduce the computational complexity and avoid anomalies, the uneven light was removed only in the Antarctic continent part. Uneven light information was removed from the original image, and a “no light image” was produced, which was calculated as follows:
According to Equation (5), is the difference of the ideal image () and the average lighting, I is the original image (), and is the sum of the average lighting and the uneven lighting information (). The “no light” image of the sample image (Figure 6a) is shown in Figure 7.
- Calculation of Artificial Lighting Information
Because is a uniform light image that does not contain a light source, manually calculated supplementary lighting needed to be added. The cumulative histogram of the original image was calculated, and the pixel values of frequency are were to a high-frequency width. The artificial lighting information is calculated as follows:
where L is the artificial lighting information and is the high-frequency width of each image.
- Information overlay
The original image, the auxiliary mask, and the artificial lighting information were combined to produce an image with color consistency in a single view. Each pixel of the output image is calculated as follows:
3.1.2. Multi-View Consistency Process
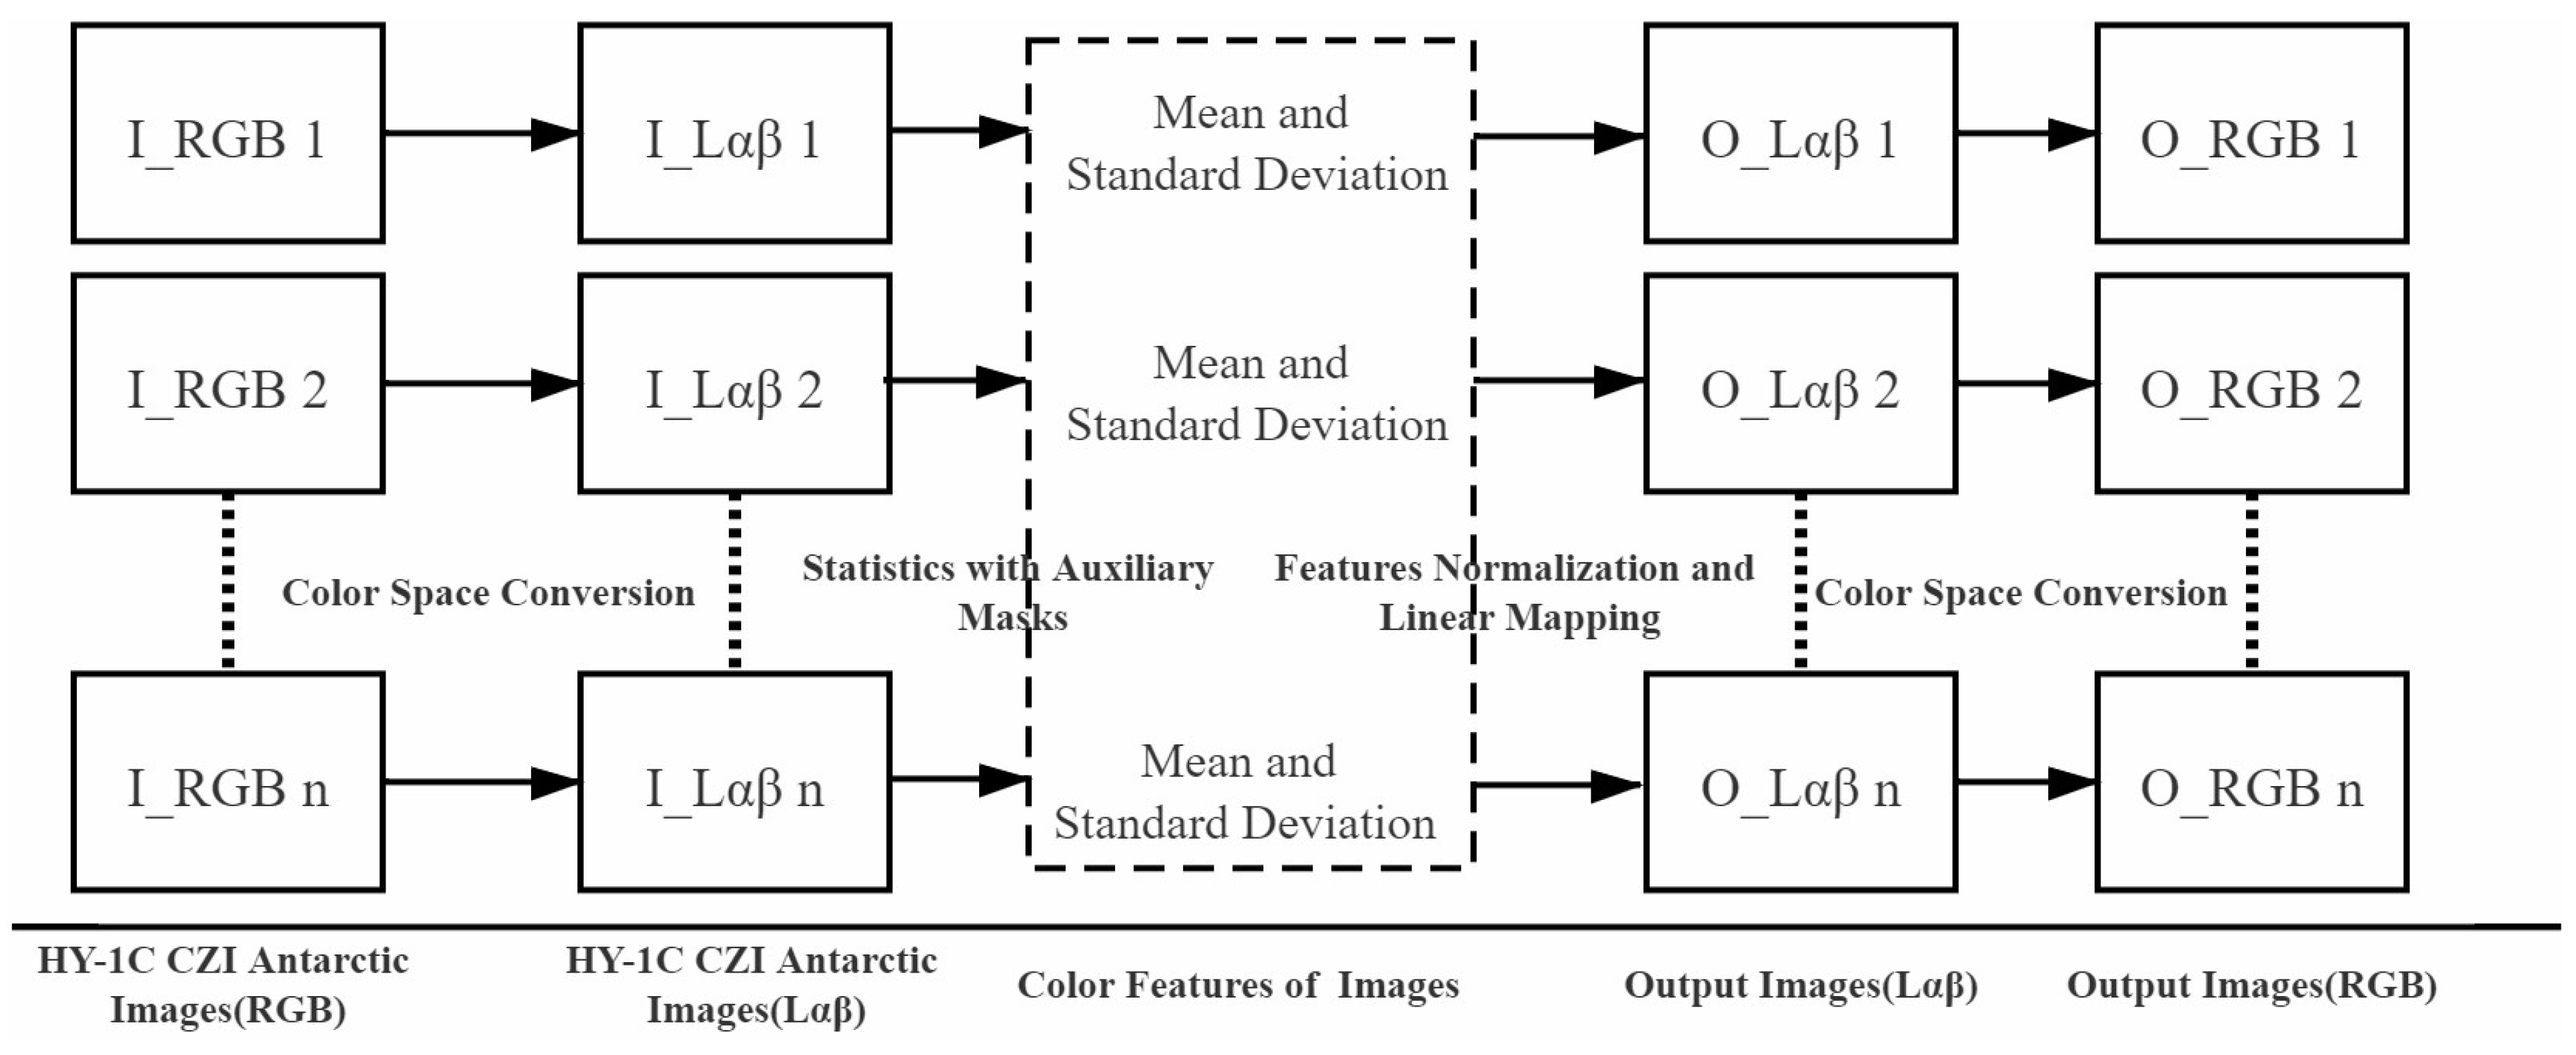
After the single-view image processing, the multi-view color consistency processing adjusted the color distribution between the different images. The task was mosaic preprocessing, and the mosaic line calculation was based on the consistent multi-view results. However, there was no mosaic line information available for the processing. Therefore, some of the color consistency processing methods using mosaic line elimination [26] were not appropriate for this task. The principle of image statistics was considered, in that the color statistics such as mean, variance, etc., could characterize the differences between different images and could be reduced to ensure the consistency between different images [27,28,29]. Color transfer [30] is an effective method of color consistency adjustment. In the proposed method, a color transfer method was introduced. According to the results of the color space conversion, the mean and standard deviation values of the images were extracted, and linear mapping was performed based on these statistical results to achieve coherent color results. The multi-view consistency could be achieved by color space conversion and normalization of the features. The complete multi-view consistency processing flowchart is shown in Figure 8.
- to color space
The data correlation of the three channels in the color space was very strong. The color space proposed by Ruderman et al. [31] eliminated the strong correlation between color channels and effectively separated the color information from the image. The color space conversion process is as follows:
- Feature calculation
To eliminate the effect of the background, auxiliary masks for the Antarctic continental part, as described in Section 3.1.1, were utilized to obtain the features of the images. The mean and standard deviation for the Antarctic continental part in the images are calculated as follows:
where is the value of pixel and .
- Feature normalization
The averages of the means and the standard deviations of all the images were calculated as the normalized target values, and they are calculated as follows:
where is the average of the means, is the average of the standard deviations, and is the number of images. The normalizing process for the features is as follows:
where pixels participating in the calculation are .
- Results visualization
The output images from the color space were converted into for the final visualization. The color space conversion process is as follows:
4. Results and Discussion
4.1. Single-View Consistency Evaluation
An objective and uniform criterion for evaluating the results is still an unresolved problem. Color consistency has a strong correlation with the subjectivity of human vision. A good result needs high resolution, high definition, moderate contrast, and correct average brightness, while keeping as much of the original information as possible [9]. We adopted both subjective and quantitative evaluations to prove the validity of the proposed method.
4.1.1. Subjective Evaluation
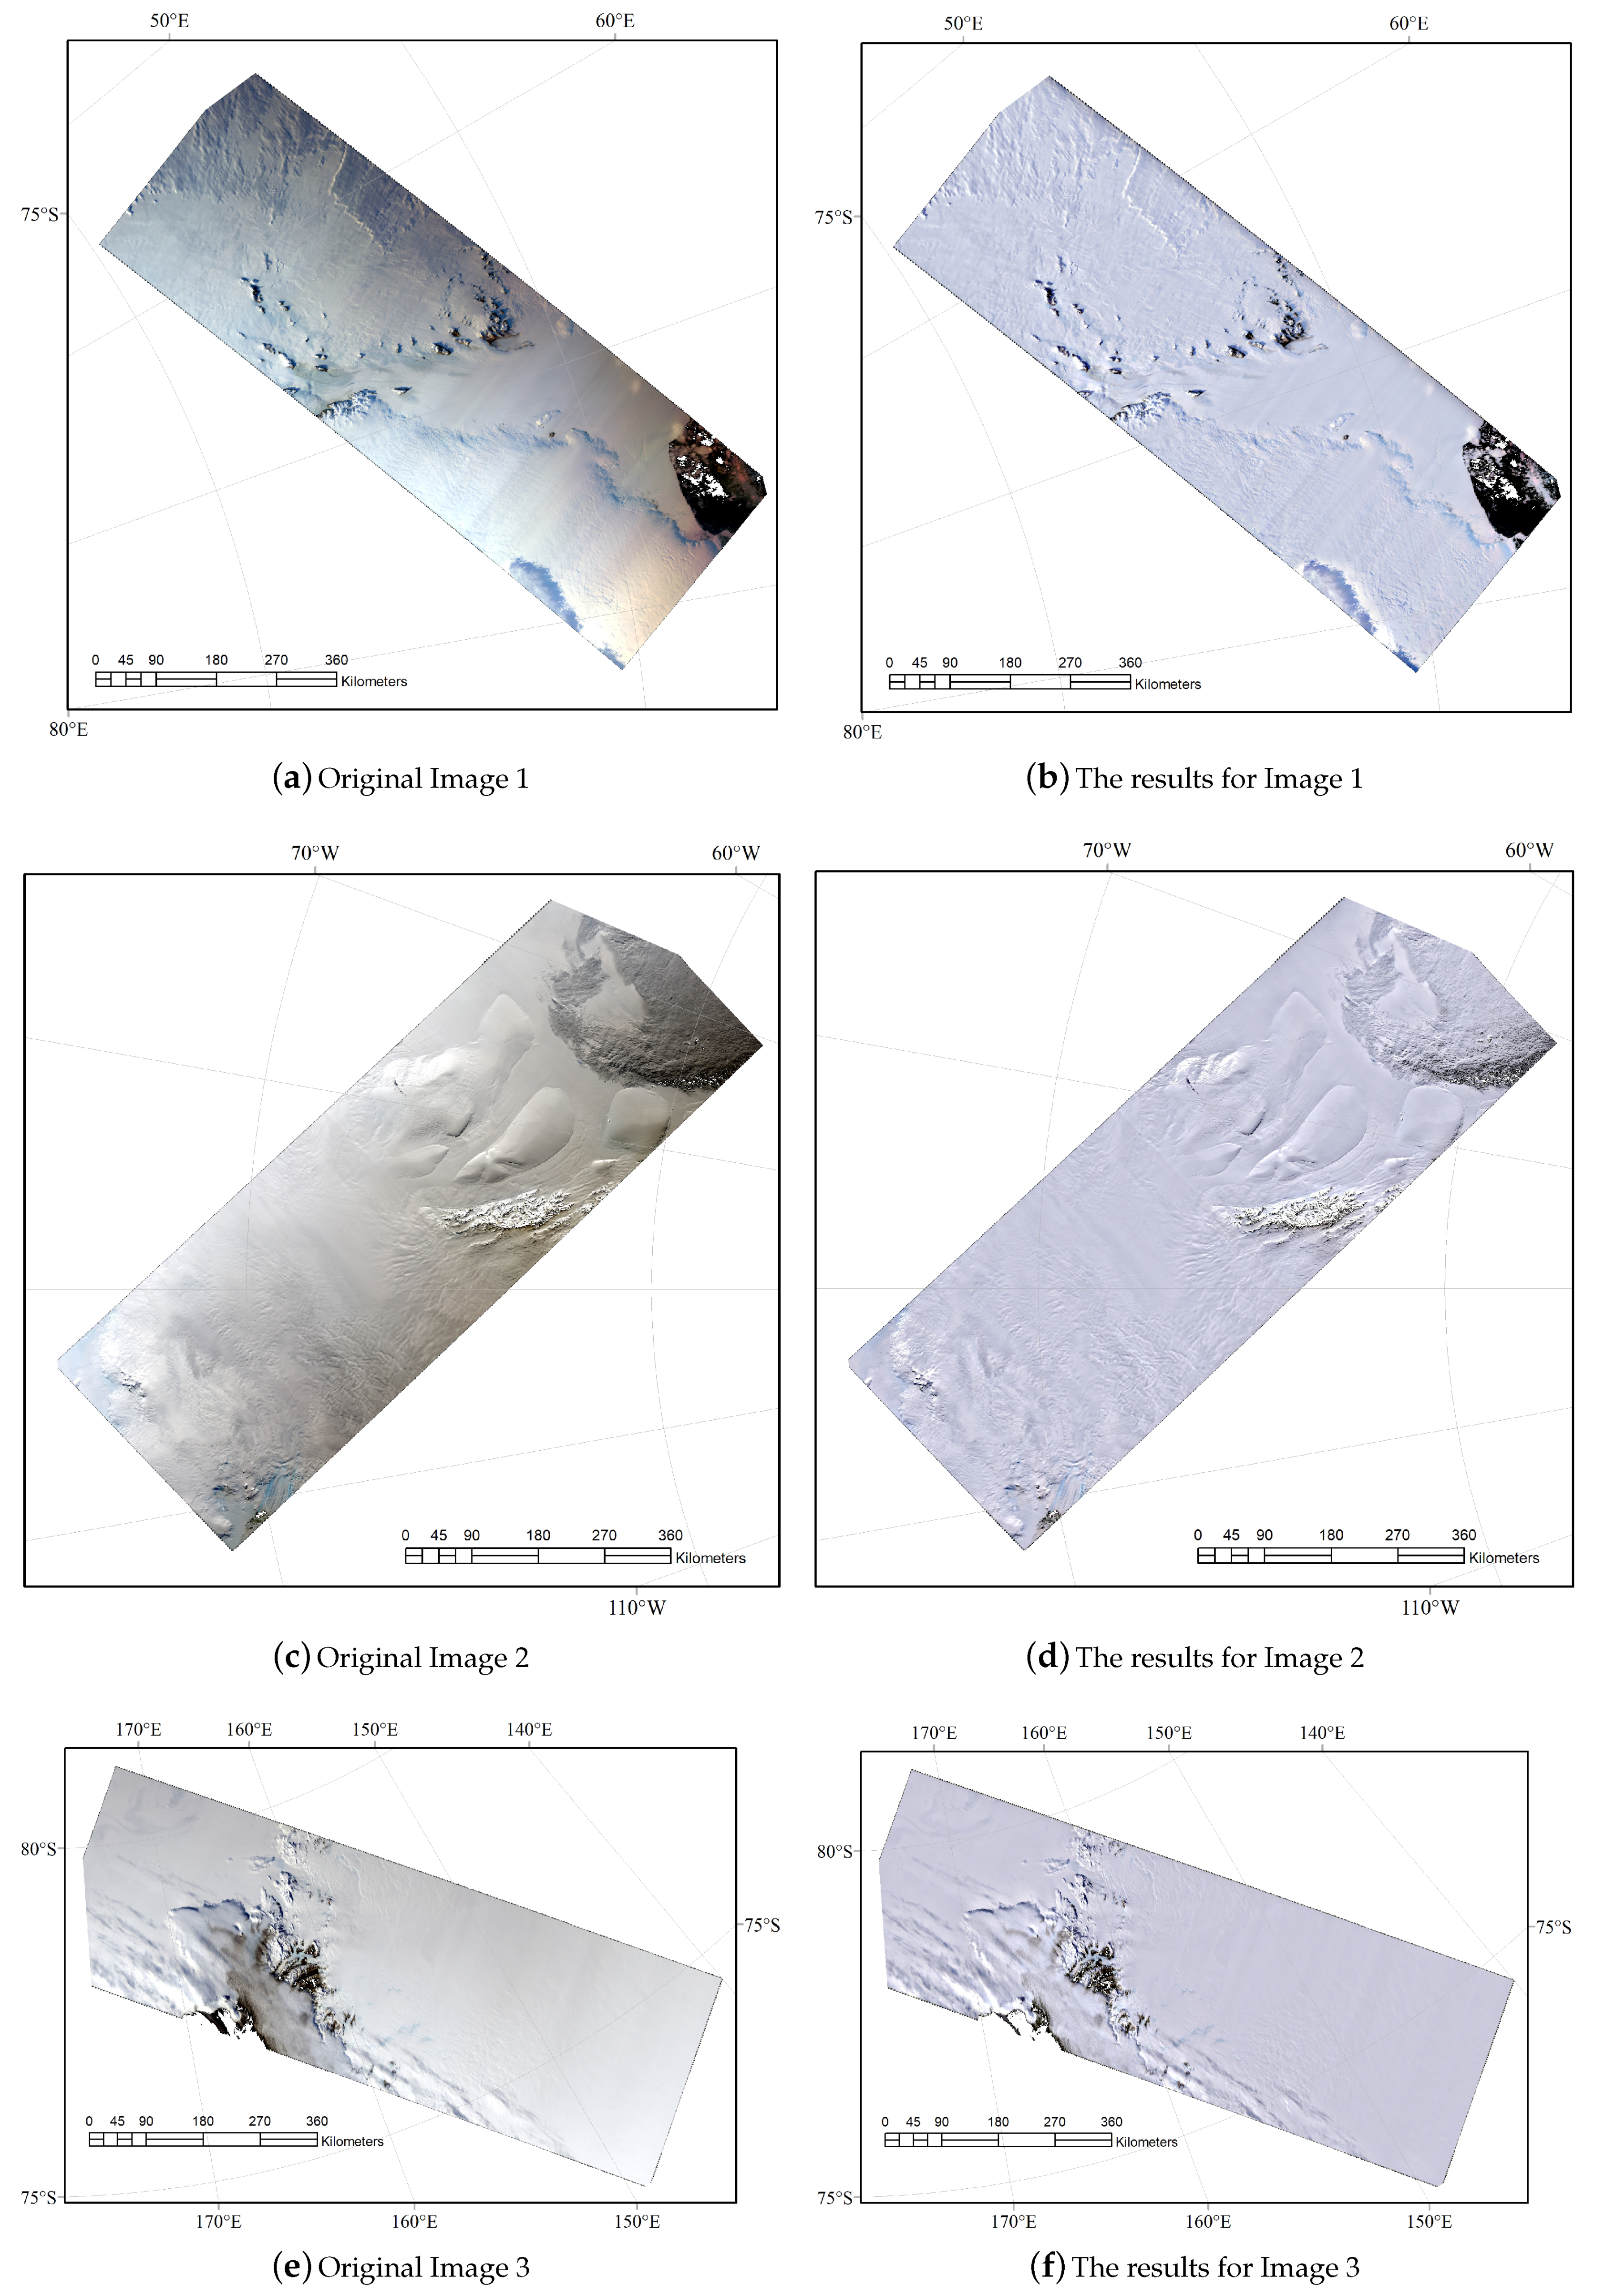
Five pairs of images before and after color consistency processing are shown in Figure 9. It can be seen that the proposed approach was able to obtain good single-view color consistency and rich image tone and contrast information. There was noticeably uneven light in Figure 9a, which was rich in red and bright in the lower-right part and rich in blue and dark in the upper-left part. The land presented different colors and brightness due to the uneven lighting. The proposed method was able to eliminate the effects of the uneven lighting, and the land part presented reasonable brightness and color. In addition, the image gradation was well preserved, which facilitated the identification of scenes. There was also uneven lighting in Figure 9c,e, where the brightness of the image was gradually reduced due to changes of the solar elevation. The left part of Figure 9c and the lower-right part of Figure 9e were brighter than the other parts. The proposed approach eliminated the change of lighting and obtained a uniform image. Figure 9g,i were bluish in color, and the Antarctic continent in the images looked like blue ocean, which brought difficulties to the target identification. The proposed approach was able to restore the color of the Antarctic continent.
4.1.2. Quantitative Evaluation
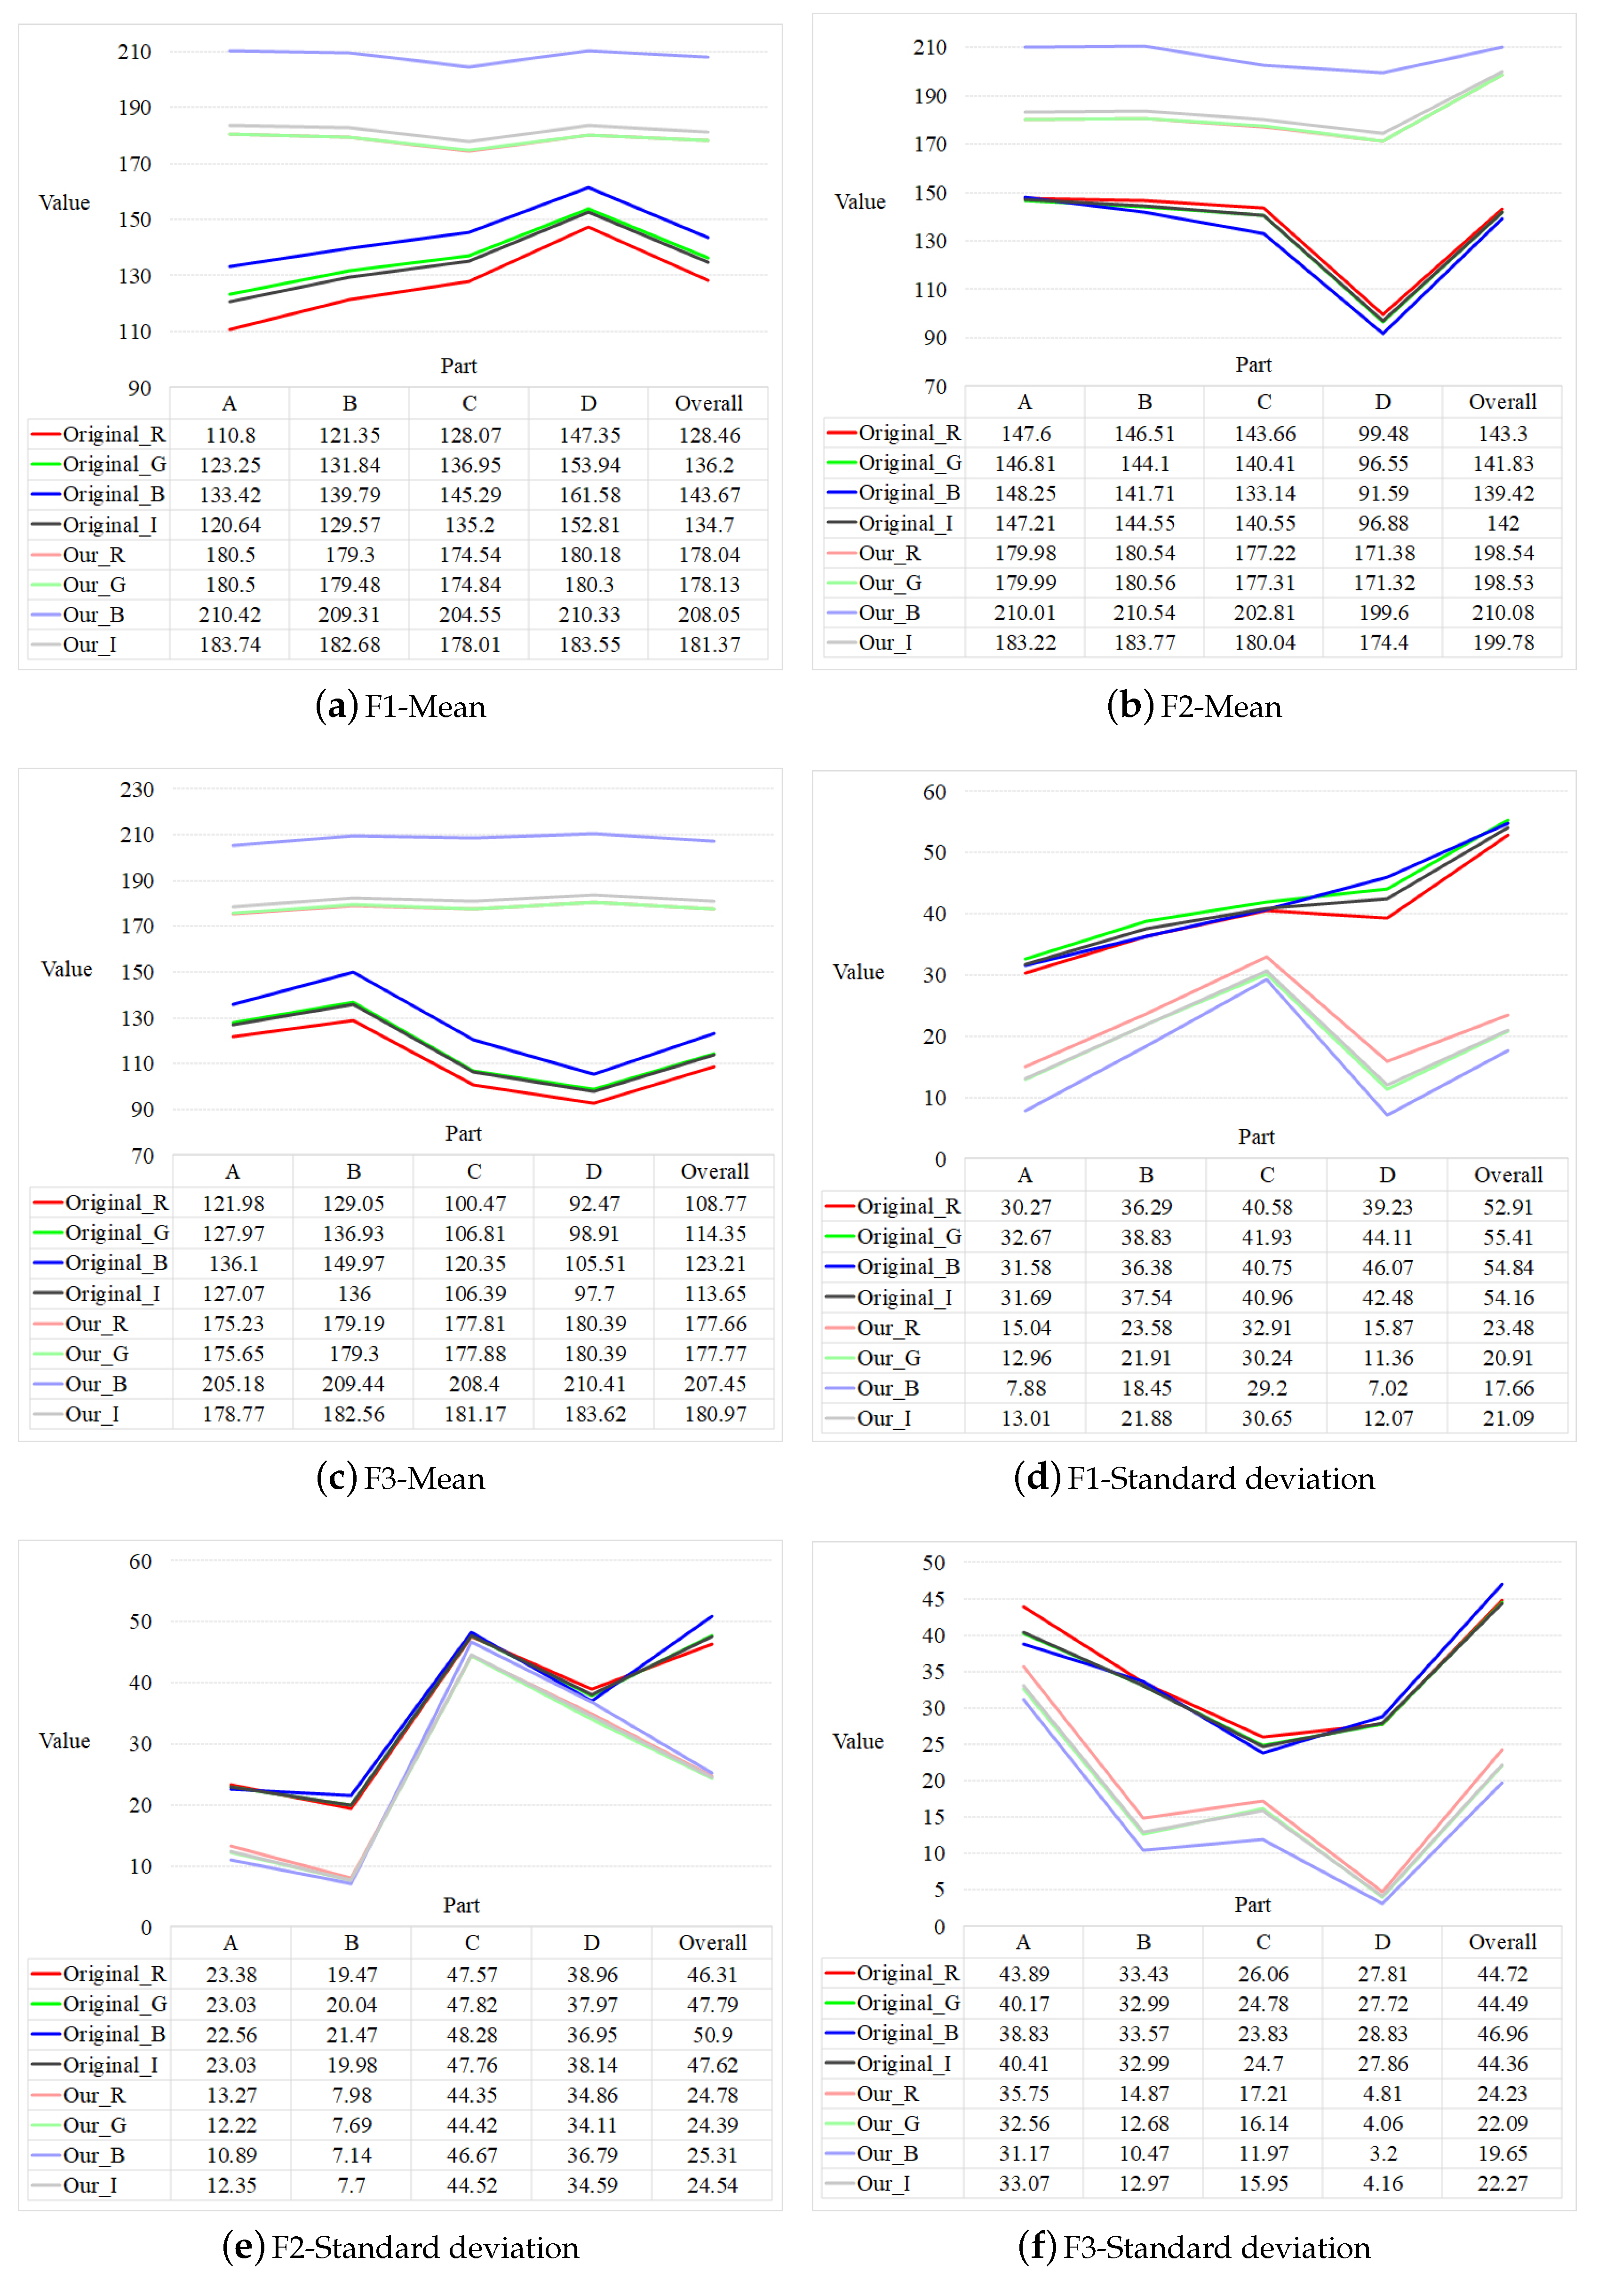
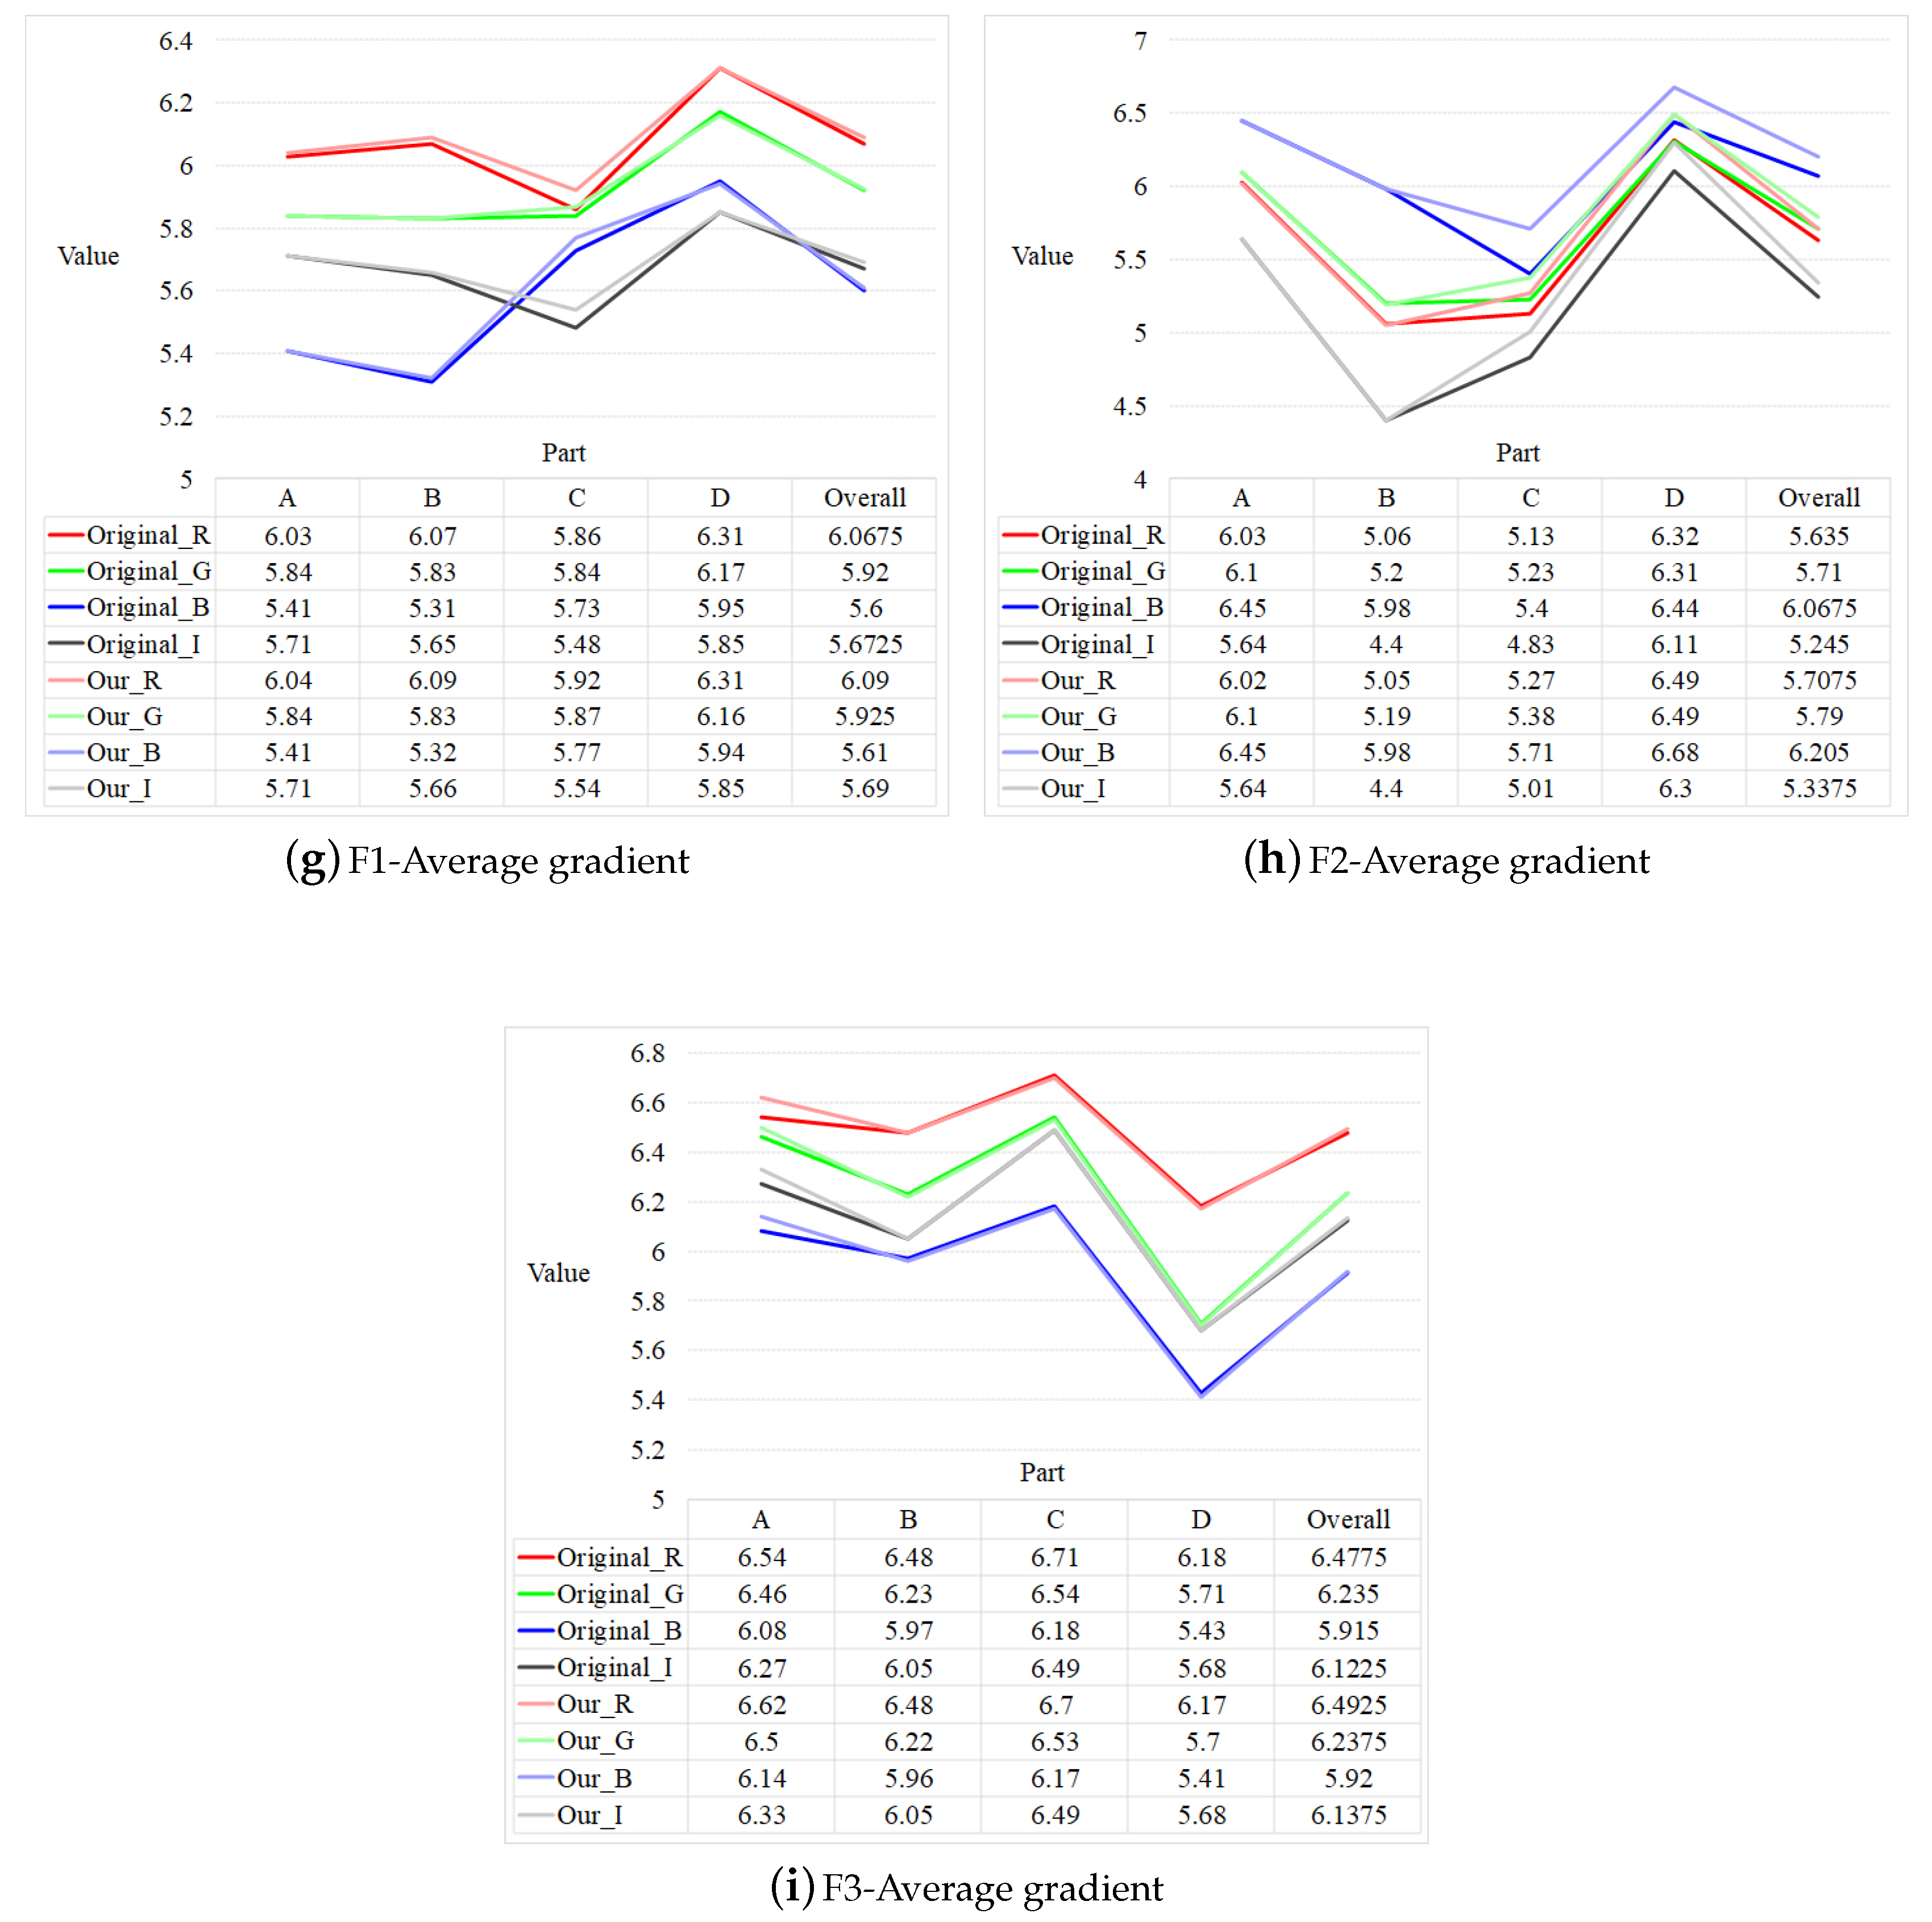
The mean, standard deviation, and average gradient were used as the objective evaluation indicators for the color consistency of the single images. The mean value could represent the average light and the average chroma value of the image. The standard deviation indicated the overall color difference. The average gradient represented the detail contrast and the character of the texture change. The ideal images should retain rich original texture information and reasonable contrast and show a slight increase in average gradient, but not excessive. The mean value is calculated as follows:
where is the value of pixel and is the number of pixels participating in the calculation. The sample standard deviation is calculated as follows:
where N is the degrees of freedom, where we let . The average gradient is calculated as follows:
where and are the first-order differences of pixel in the x and y directions, respectively; m and n are the height and width of the image, respectively; M and N are the degrees of freedom; and .
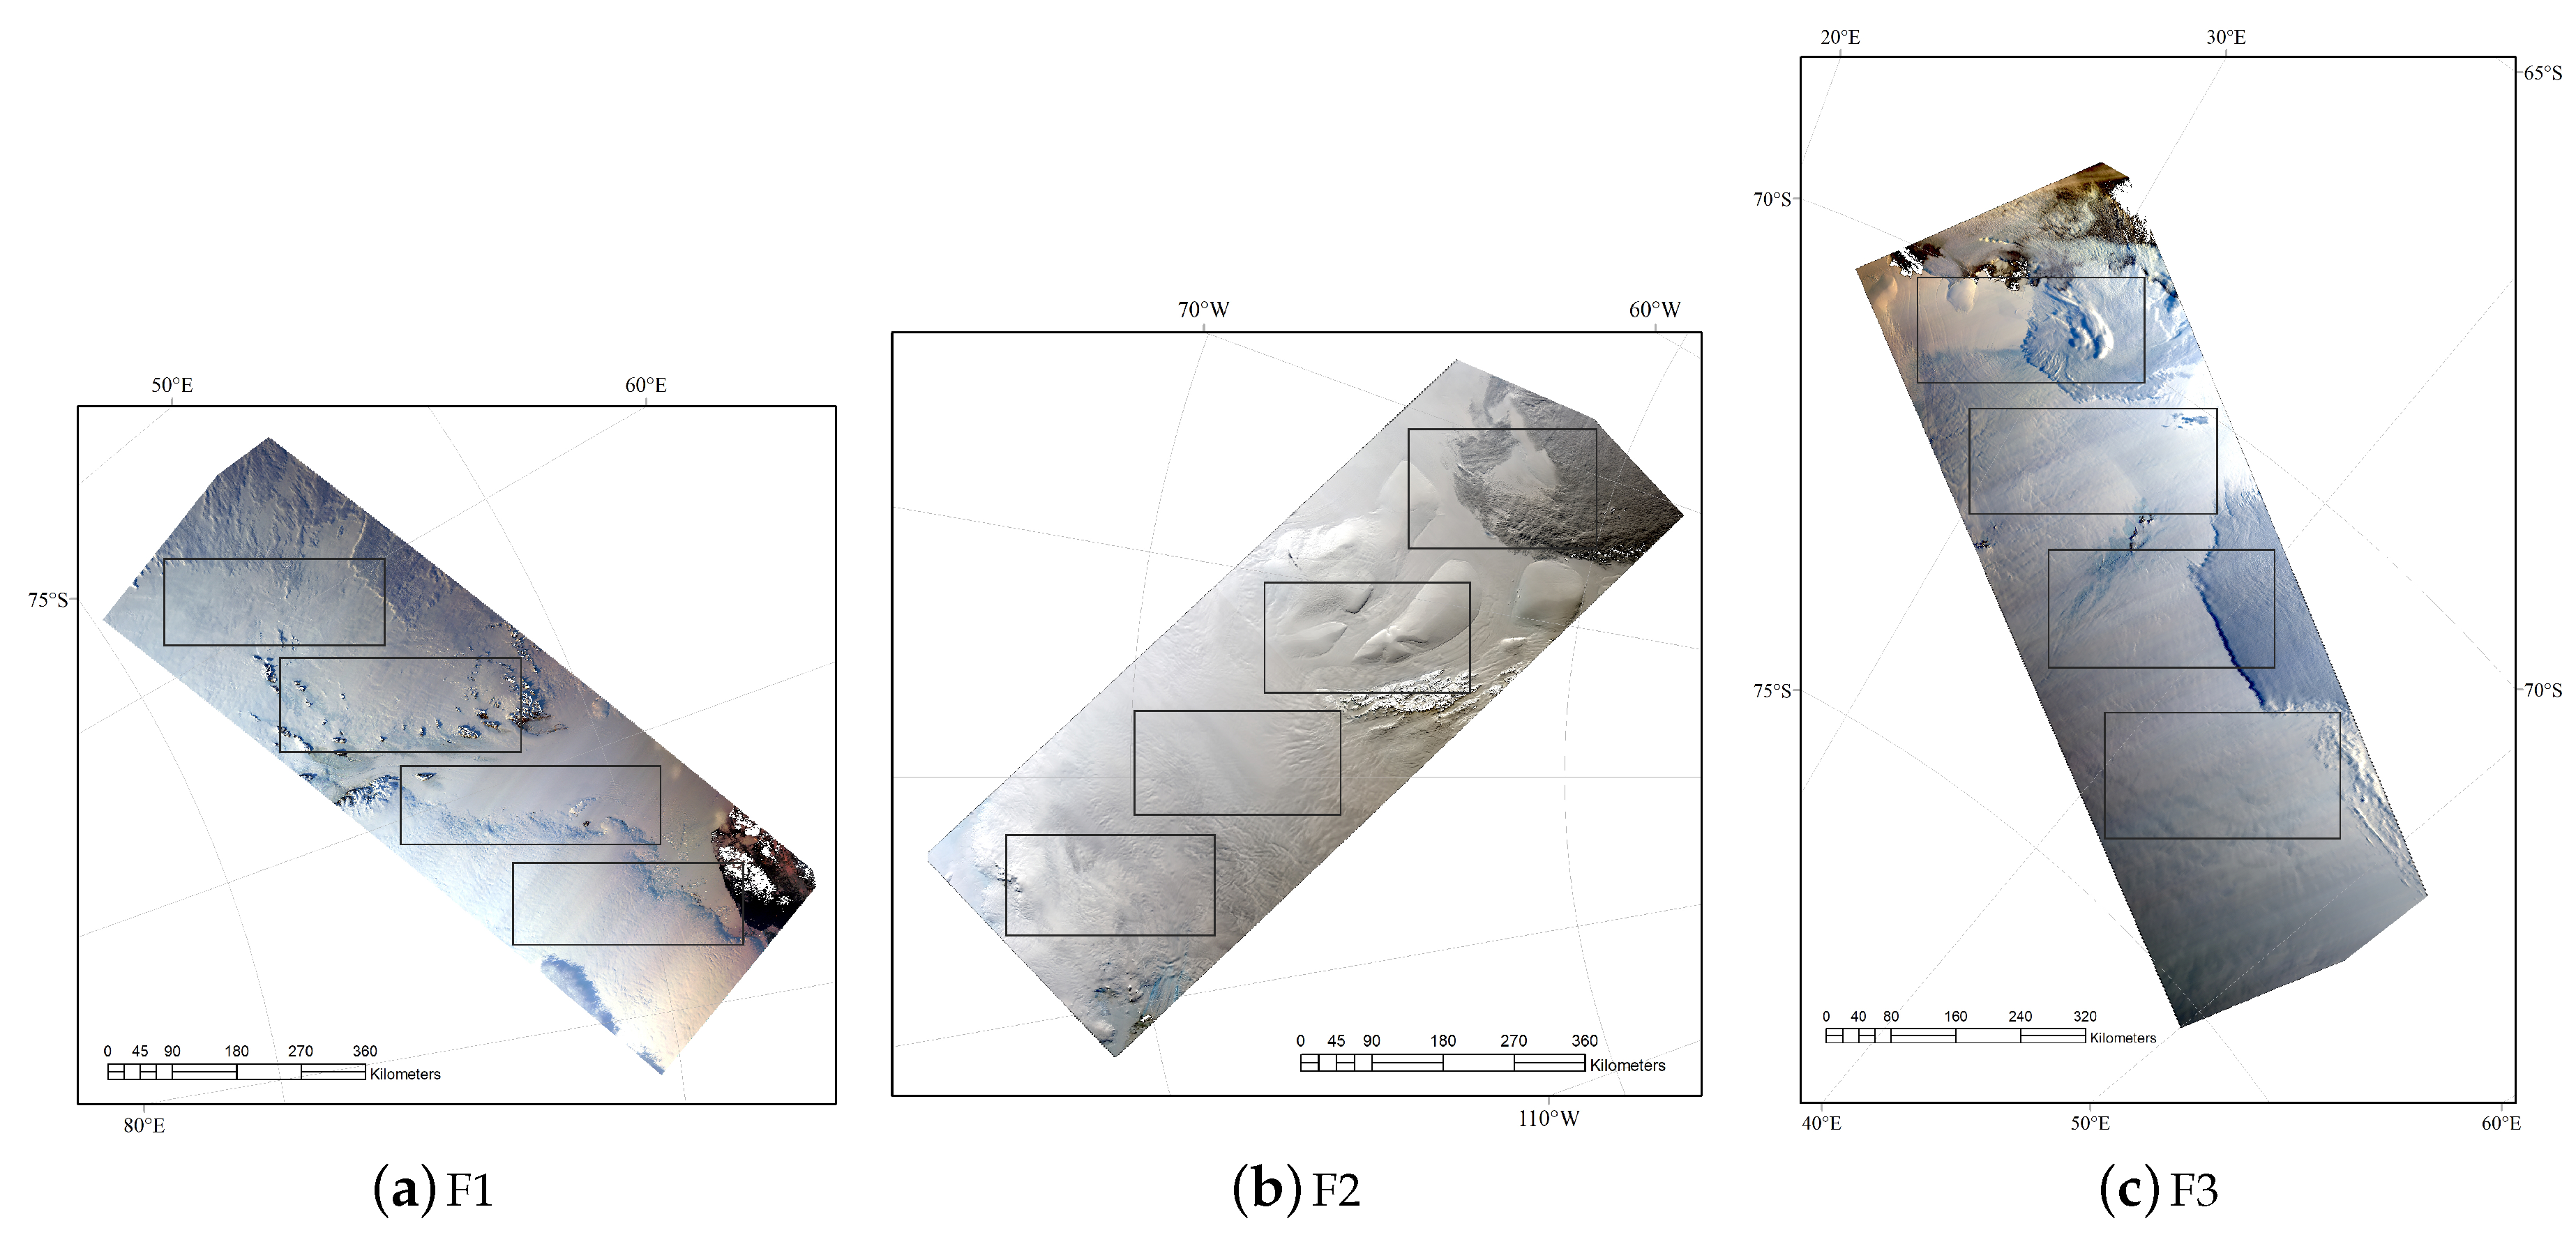
The images in Figure 9a,c and Figure 10d were evaluated quantitatively. For each image, we randomly extracted four areas of the same size as sub-regions and calculated the mean, variance, and average gradient of R, G, B, and I (brightness). The selected sub-regions are shown in Figure 10. The results before and after processing are shown in Figure 11.
Figure 11a–c show that the results after processing tended to appear as straight lines. This demonstrated that the mean values of the different parts in the same image were similar, which indicated that there were similar brightness and chroma values in each part. In Figure 11d–f, the results after processing showed a lower standard deviation for each part, indicating that the color and brightness distributions of the image were more concentrated. In addition, the results after processing were very close to the original images and showed little increase in the average gradient in Figure 11g–i, suggesting that the average gradient of each image showed an appropriate increase. The results shown in Figure 11 indicated that the proposed method improved the richness of the details and allowed clearer visual perception.
4.2. Multi-View Color Consistency Evaluation
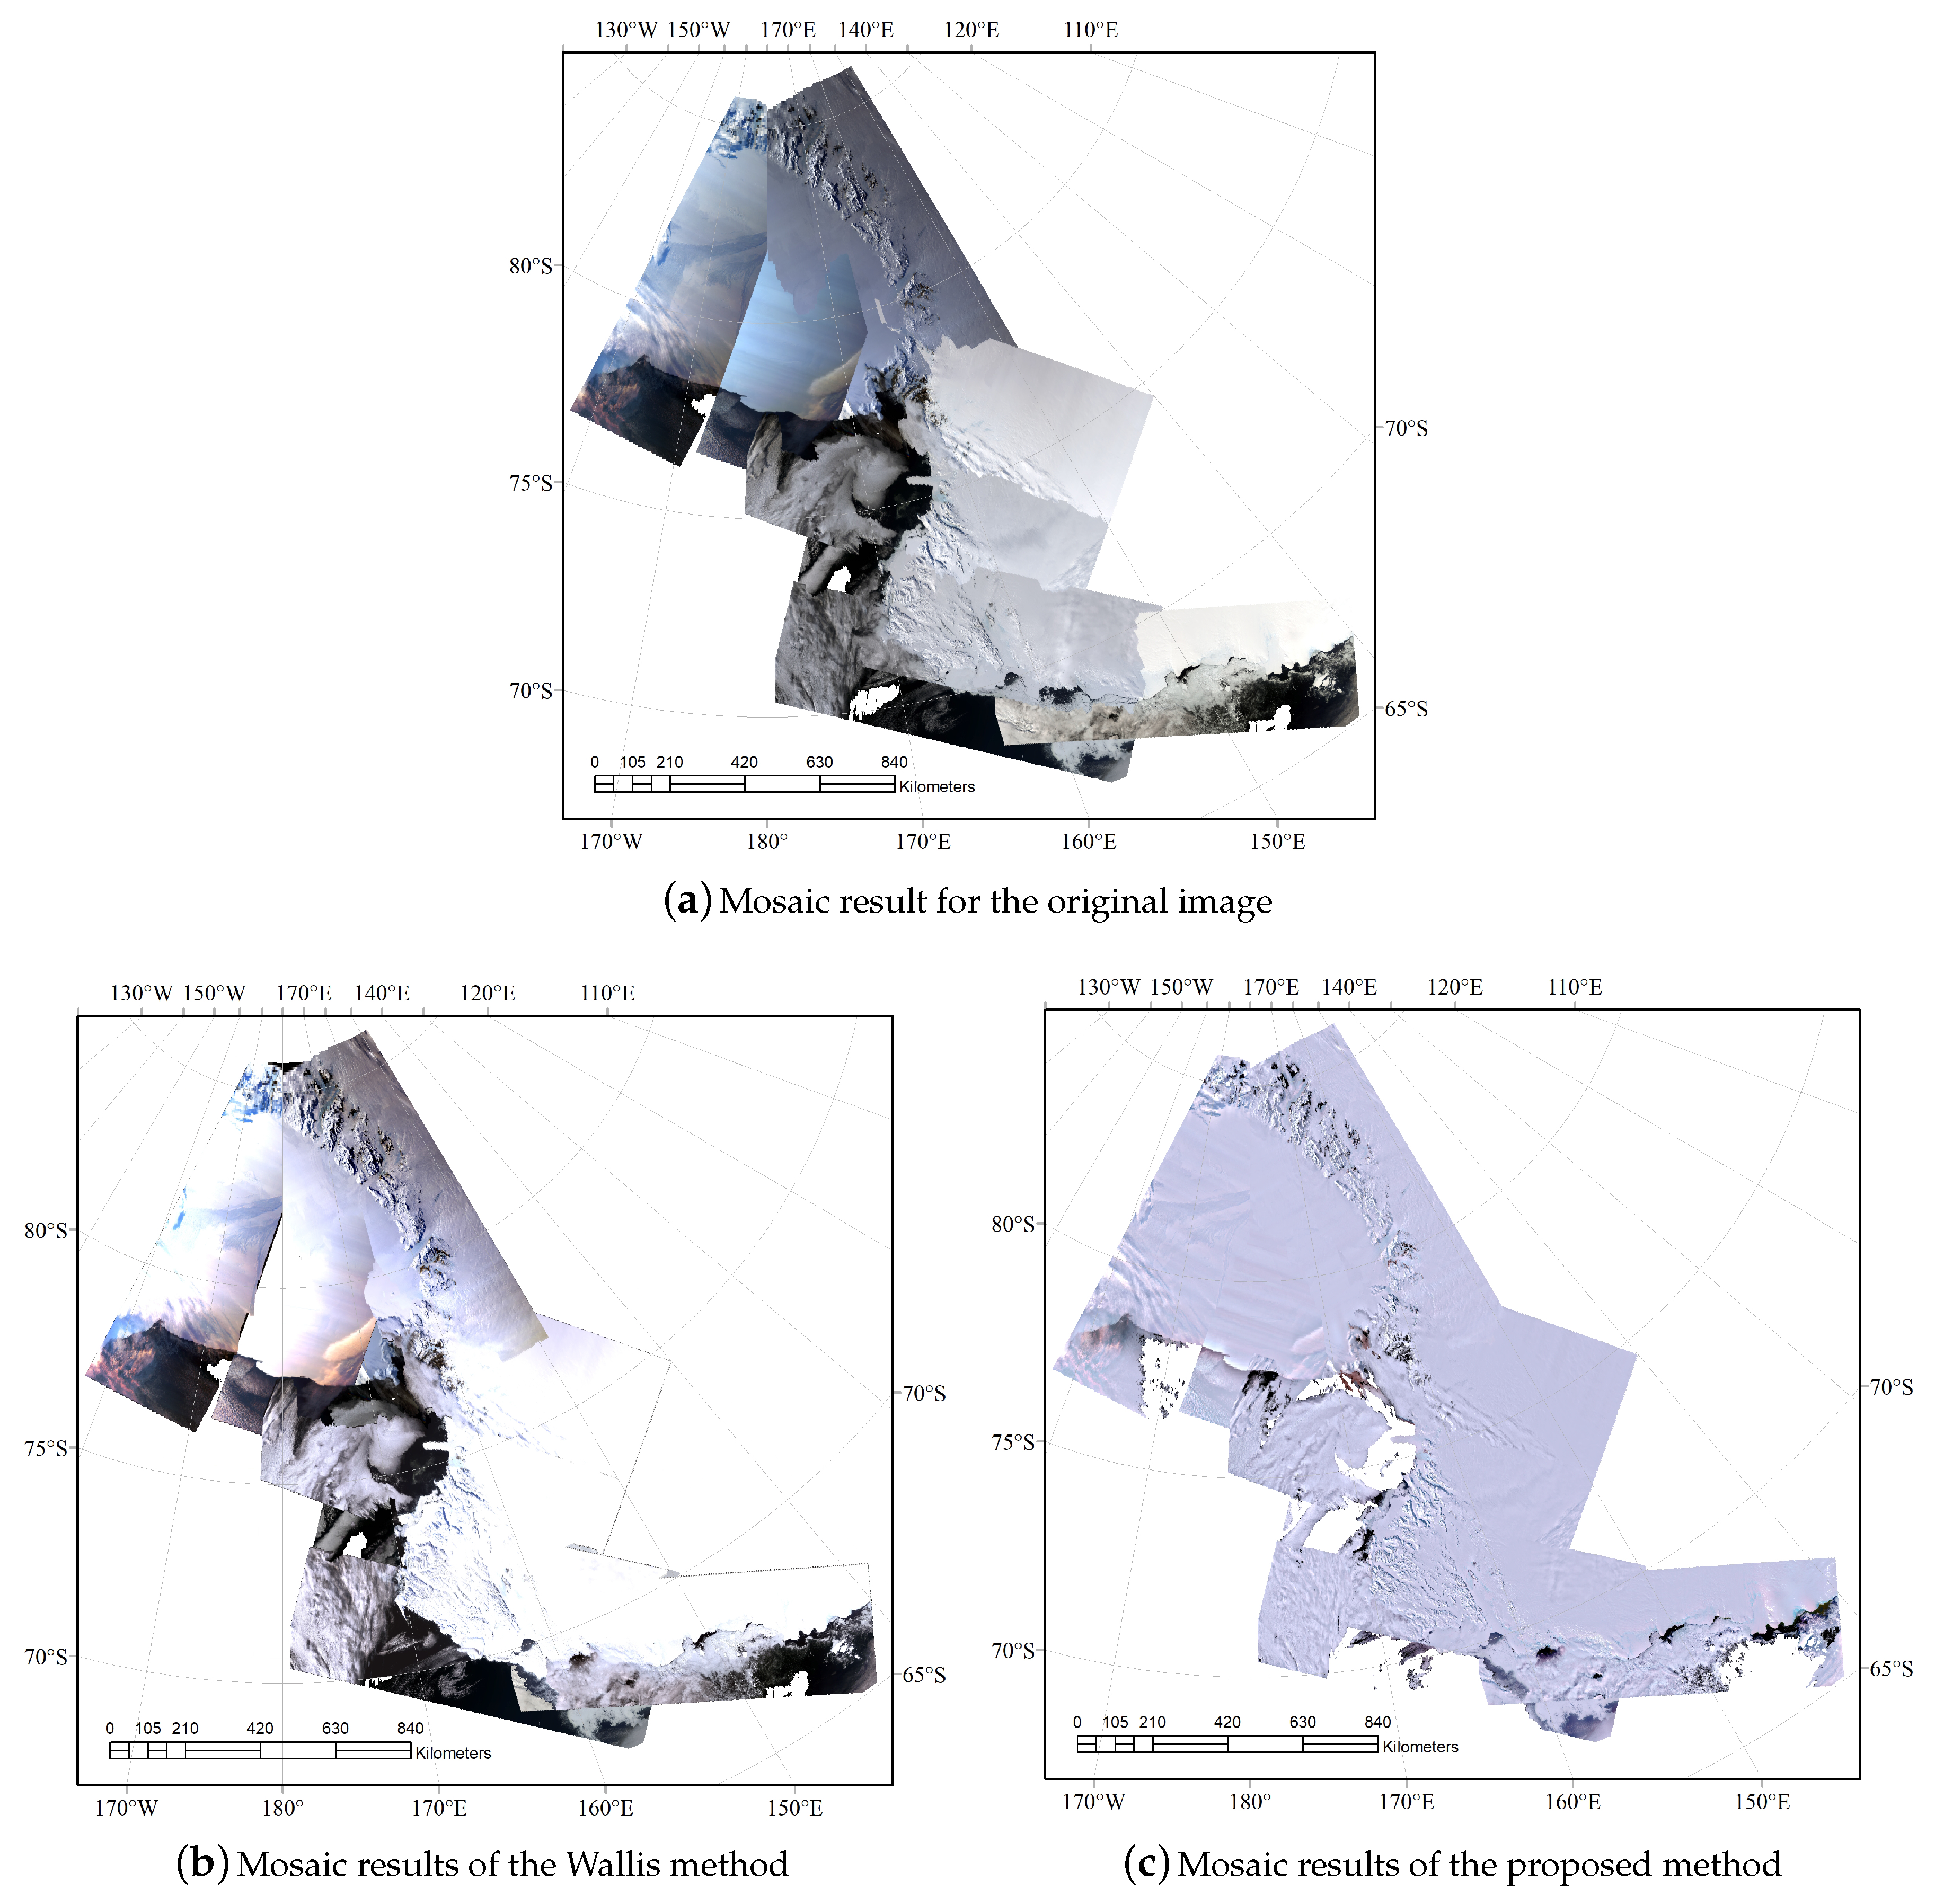
Generally speaking, distinct mosaic lines in the mosaicked image should not be visible, and the hue and brightness should be uniform in the mosaicked image. In our experiments, the quantitative and qualitative comparisons were conducted between the results of the proposed method and the results of the Wallis method [29,32].
4.2.1. Subjective Evaluation
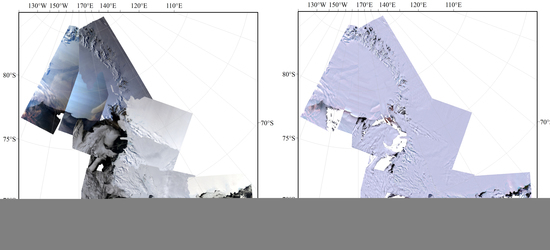
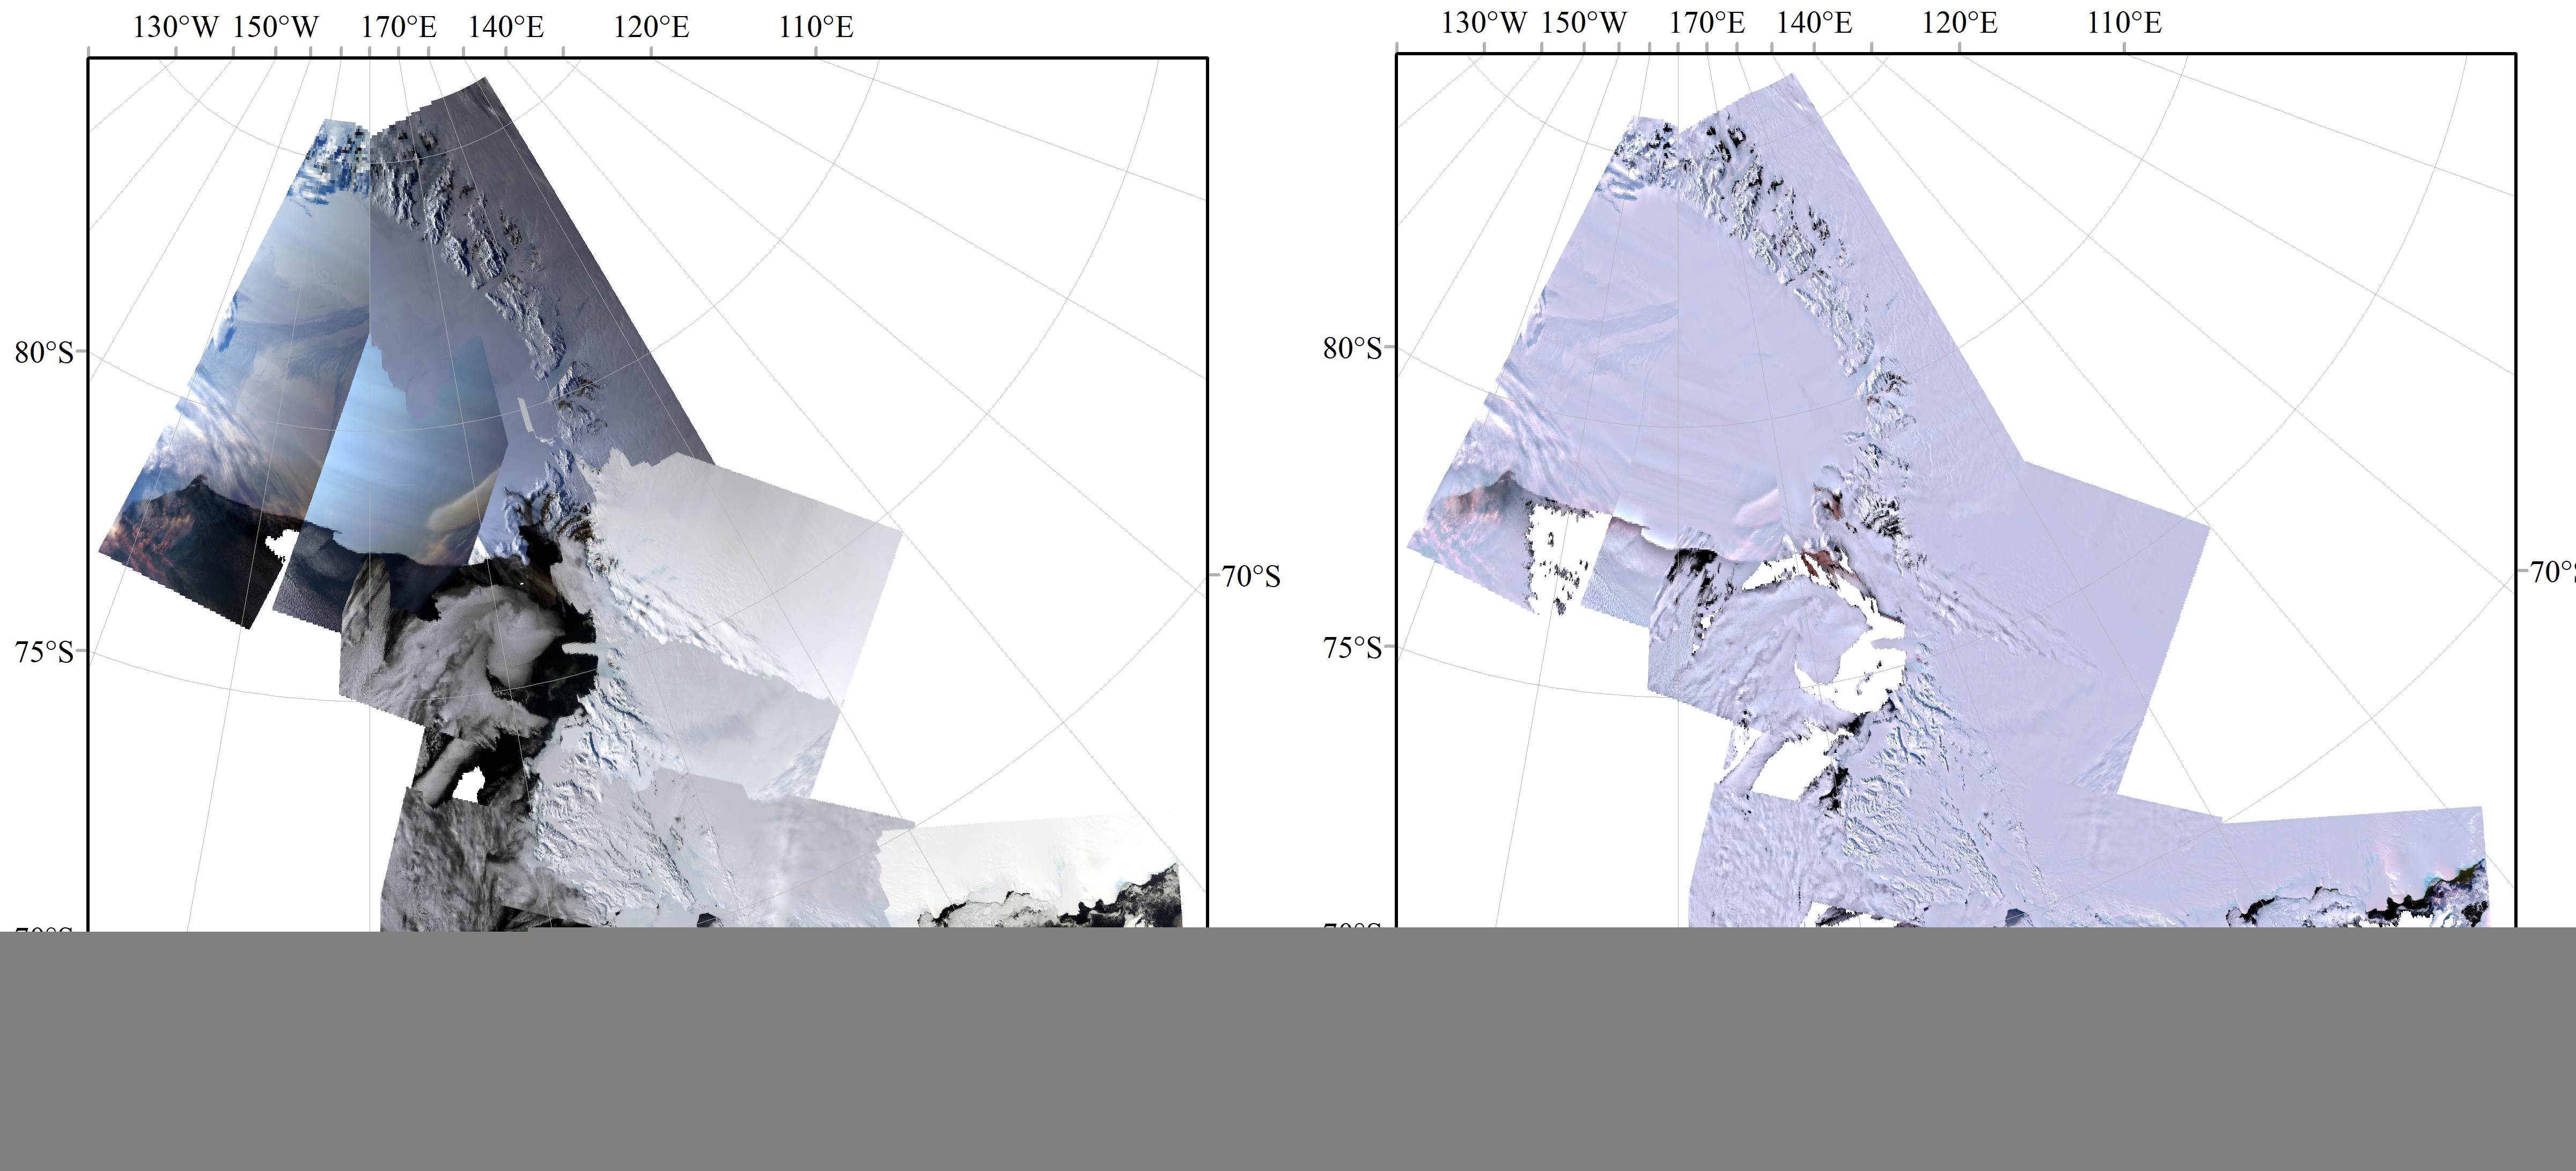
Ten original images of the same area were automatically mosaicked by the use of MCM Zhipin software [33] and are shown in Figure 12. For the original mosaic, there were obvious differences in color and brightness in both the single images and between the different images. The mosaic border lines were also clearly visible. After consistency processing, the Wallis method achieved color consistency in a few areas and a slight improvement in visual effect. However, there were still some evident boundaries in the results, and the brightness distribution was uneven. In contrast, the proposed method completely eliminated the uneven lighting. There were no visible mosaic boundaries, and the entire Antarctic ice shelf appeared in good uniform color.
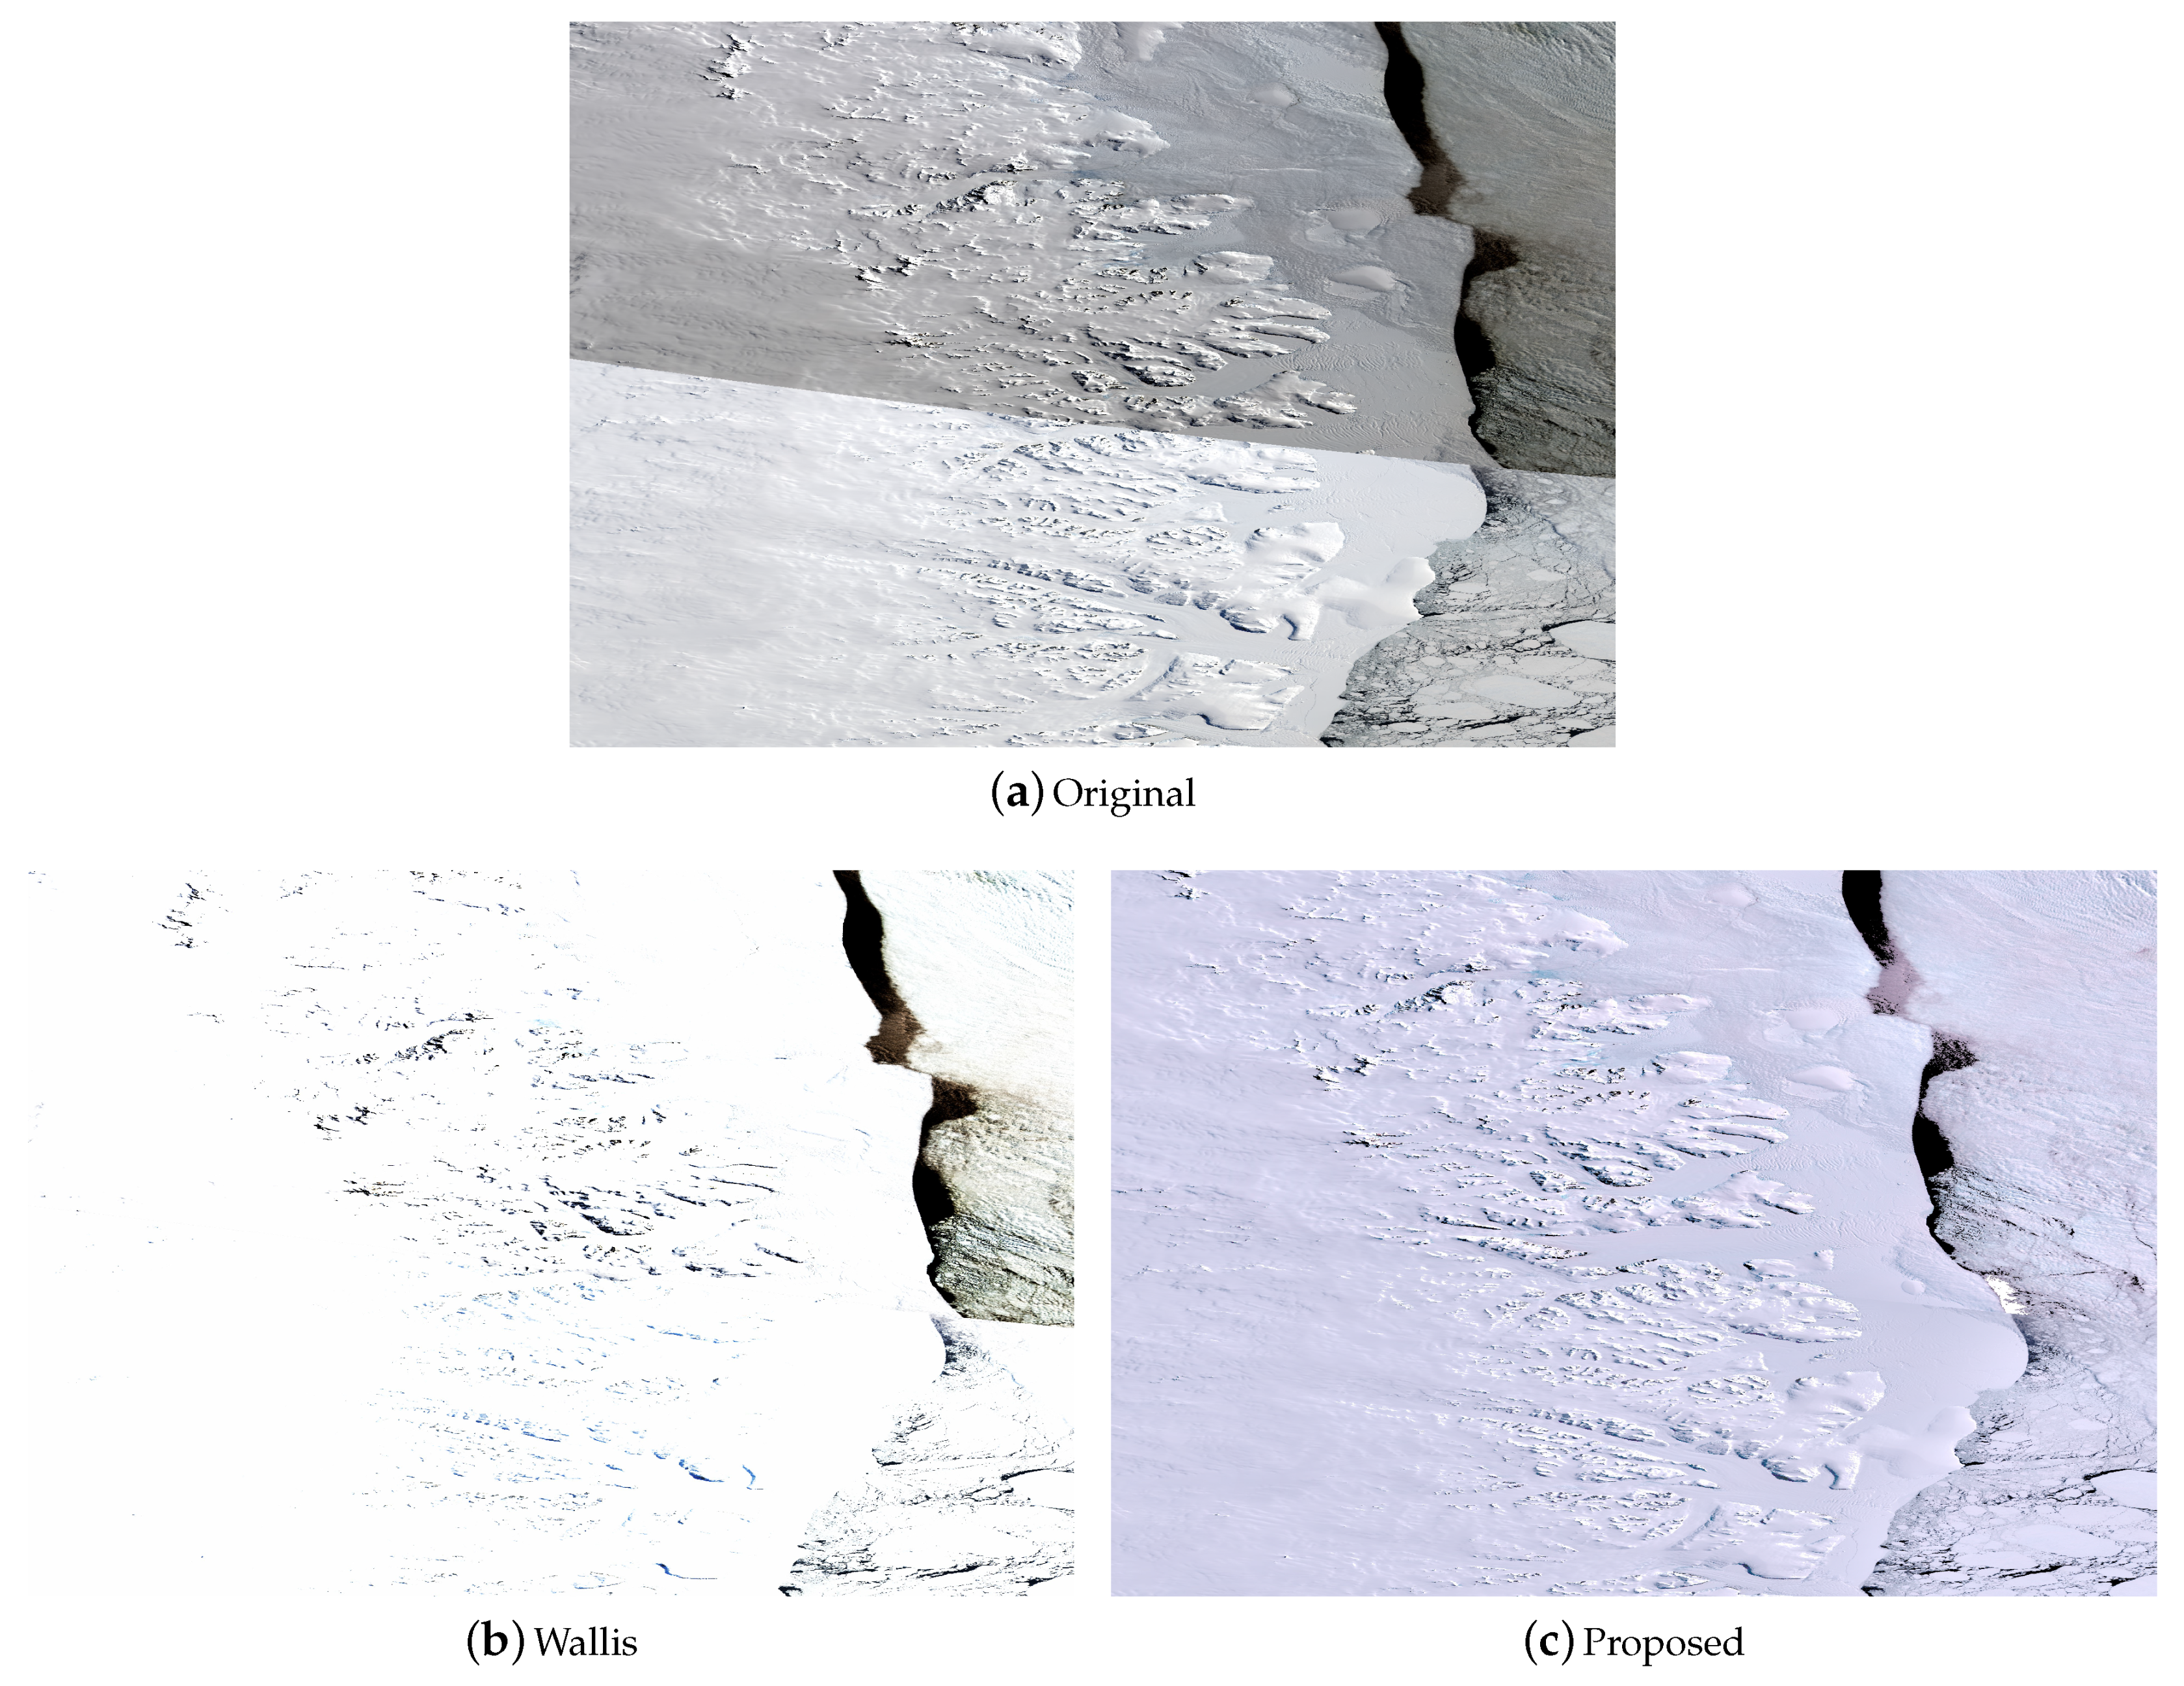
In order to further analyze the handling of mosaic boundaries by the proposed method, the details of two mosaic results are shown in Figure 13. In the mosaic result for the original images (Figure 13a), the upper sub-image and the lower sub-image were easily distinguishable, and the mosaic line was clear. The result of the Wallis method did not show a visible boundary, but the brightness and contrast were abnormal in Figure 13b. The mosaic image produced by the proposed method showed a good performance in uniformity of brightness and color, and there was no visible mosaic line in Figure 13c.
4.2.2. Quantitative Evaluation
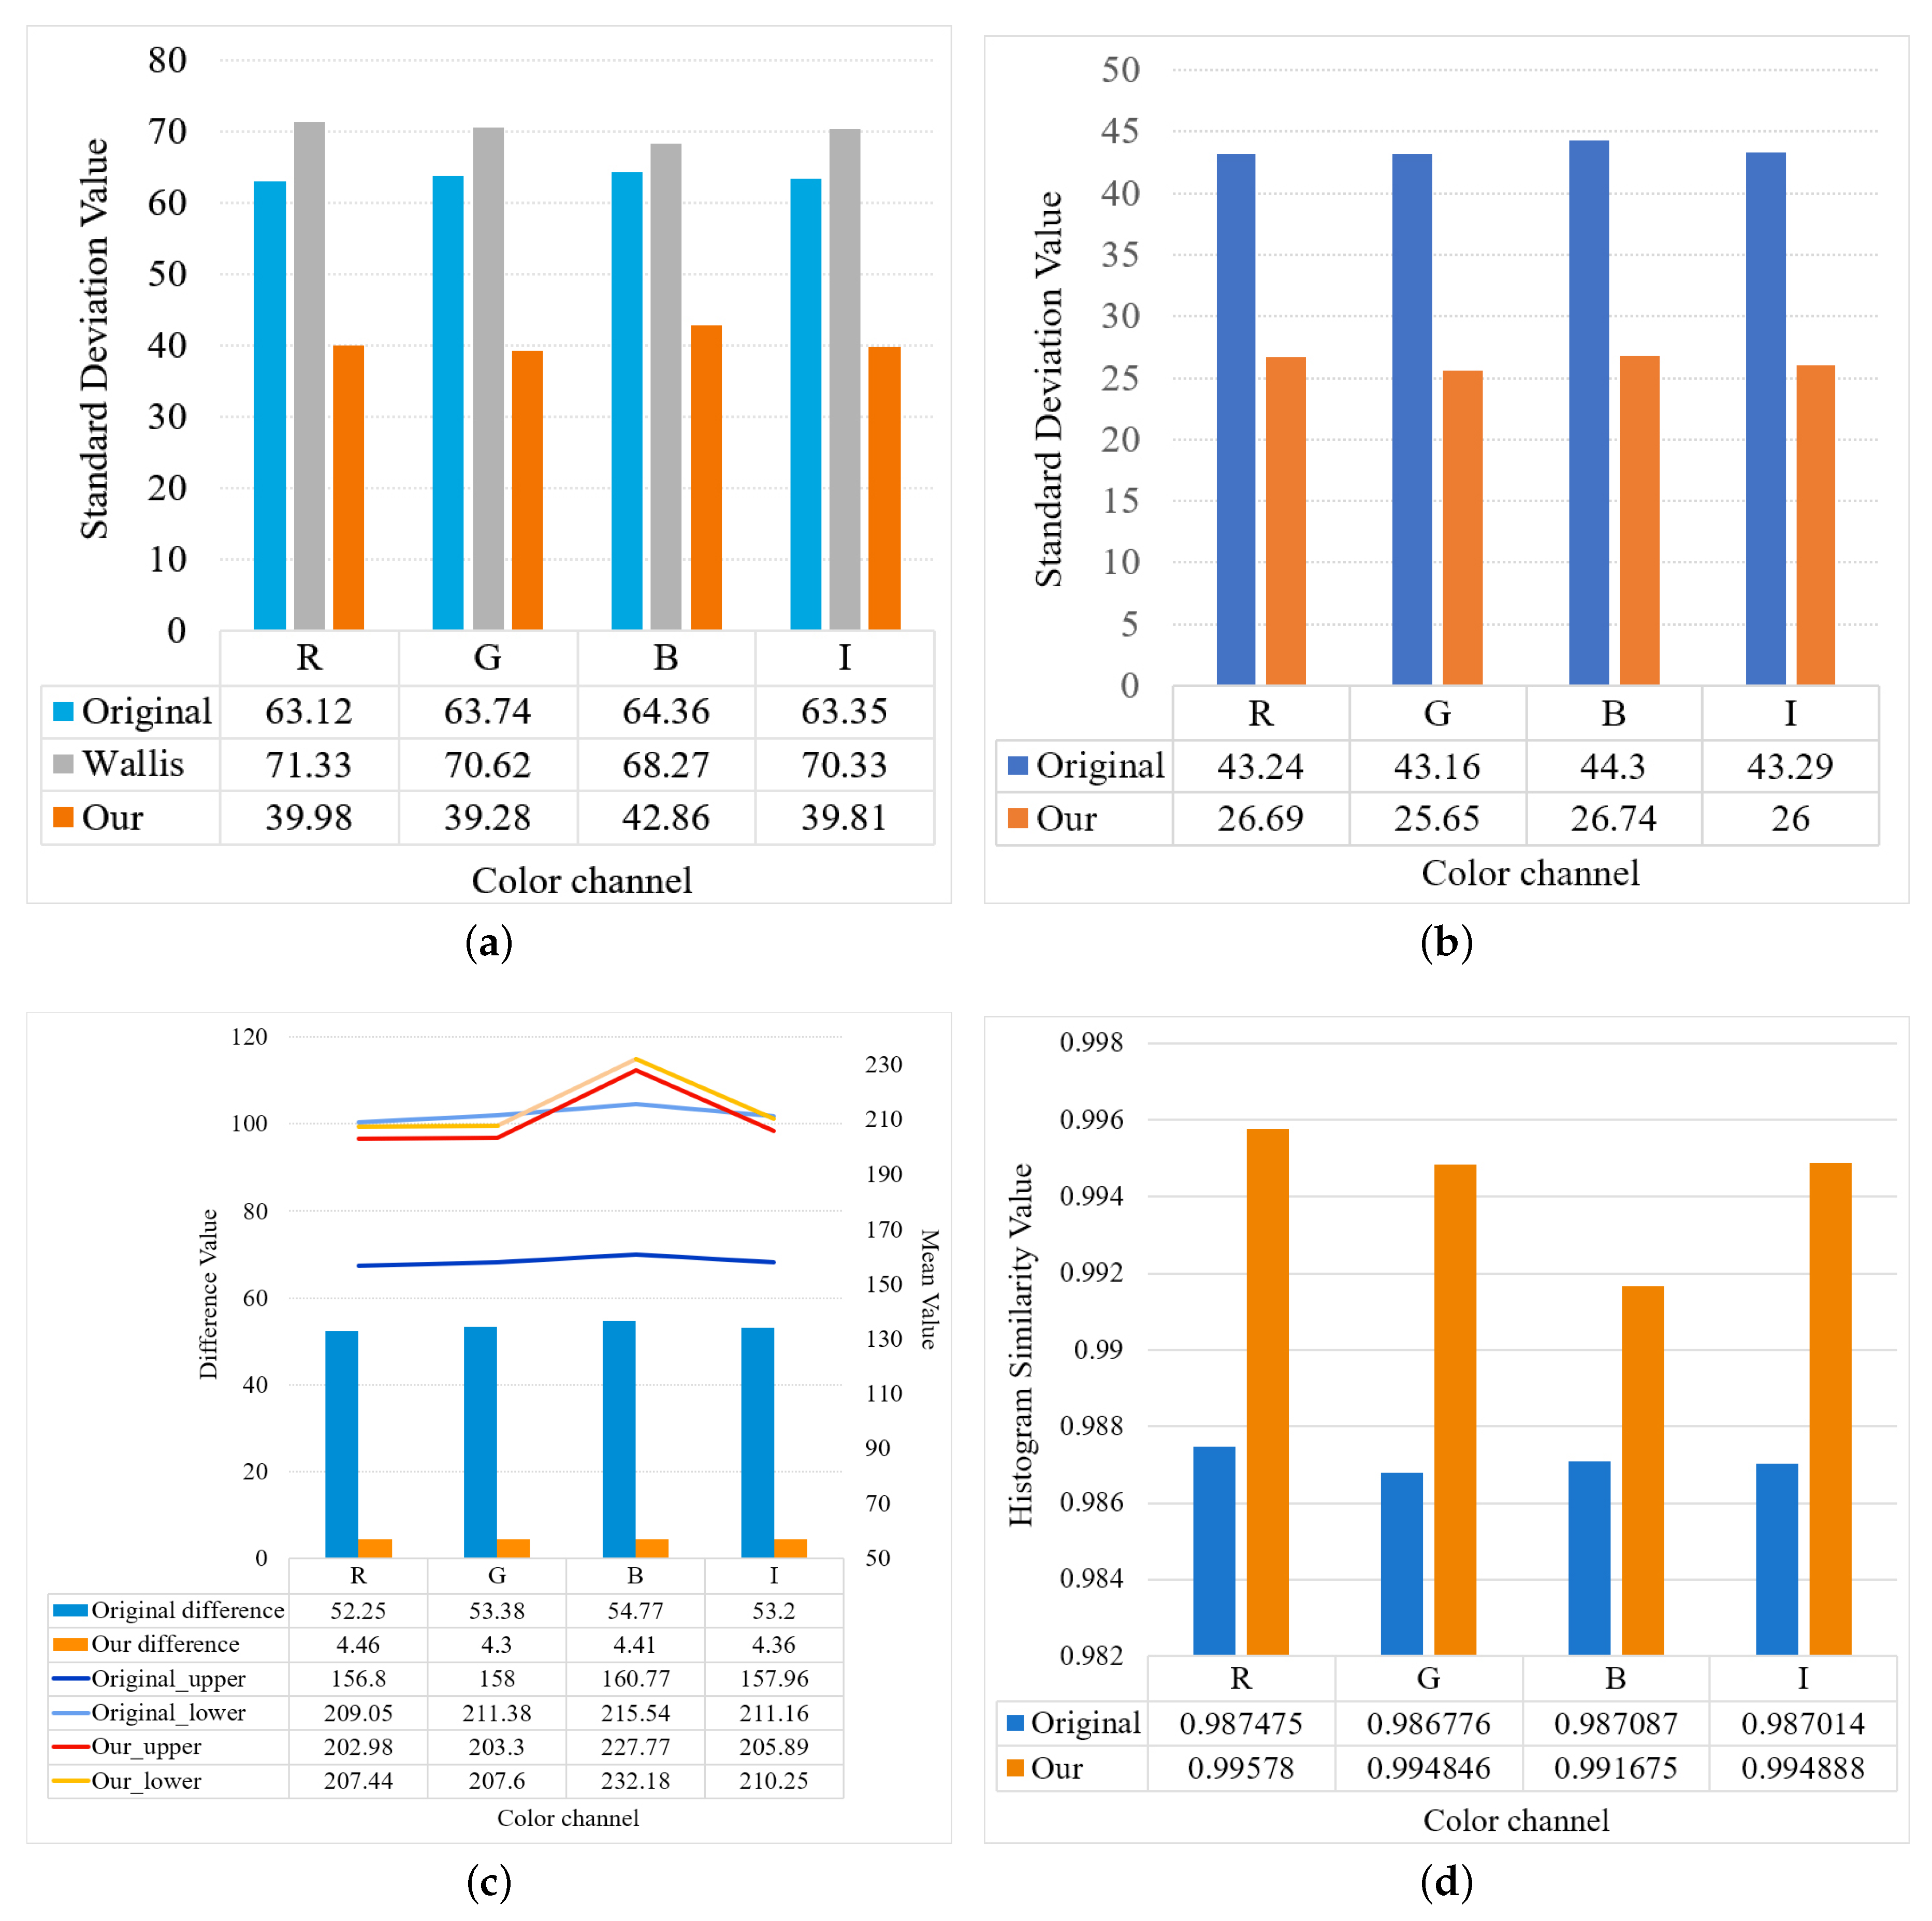
In order to evaluate the consistency between images objectively, we calculated the overall standard deviation of the three images in Figure 12. With the proposed method, the standard deviation of the images was smaller; the difference in the brightness and color was smaller; and the consistency was good. We also calculated the mean and histogram similarity of the two parts on either side of the mosaic line in each image. If the contents of the two sides were similar, the mean values and the distribution of the histogram should showed small differences. The histogram similarity was calculated as follows:
where and are the histograms of the two parts (different sides of the mosaic line); N is the bin number of the image, which was set to ; c is the pixel value; is the number of pixels with a value c. The background part did not participate in the calculation. The statistical results are shown in Figure 14.
From the statistical results, it is shown in Figure 14a that the value of the standard deviation for the Wallis method was increased, while the value for the proposed method was greatly reduced. In the details of the images in Figure 14b, the standard deviation of the results of the proposed method was also lower than that of the original images, which illustrated that the proposed approach obtained results with a more concentrated color and brightness distribution. In terms of the details, the upper part and lower part of the result of the proposed method had a smaller mean difference and higher histogram similarity in Figure 14c,d. This was consistent with the subjective view that the two parts should have similar hues and brightness. Overall, the experimental results confirmed that the proposed method obtained good multi-view color consistency for the mosaic preprocessing of HY-1C images of Antarctica.
5. Conclusions
In this paper, we proposed a color consistency processing framework for HY-1C images of Antarctica based on a statistical filter and color transfer method. The proposed method eliminated the uneven lighting in the images and reduced the difference in brightness and tone of the different parts. To extract image features and restore consistent images, the novel filter and the artificial lighting information calculation algorithm were proposed. We designed reasonable subjective and quantitative evaluation experiments, and the results verified the effectiveness of the proposed method. The results of proposed method had good color consistency both in the single image and the mosaic image. The results of the Wallis method were also compared, to further show the superiority of the proposed method. The proposed method could also be extended to the Antarctic images of other satellites, which will be beneficial for the image mosaic preprocessing in other regions.
Author Contributions
Conceptualization, Z.L., C.Z., and L.C.; data curation, C.Z.; formal analysis, C.Z. and L.C.; methodology, Z.L. and H.Z.; project administration, L.C.; resources, Z.L.; software, H.Z.; supervision, Z.L. and C.Z.; validation, T.Z. and J.L.; visualization, T.Z. and J.L.; writing, original draft, H.Z.; writing, review and editing, L.C. and Y.Z. All authors have read and agreed to the published version of the manuscript.
Funding
This research was funded by National Key Research and Development Program of China (No, 2018YFB10046 and No. 2017YFB0504202), the Fundamental Research Funds for the Central Universities under Grant No. 2042018kf0229, and National Natural Science Foundation of China under Grant No. 41671441 and No. 41776200.
Conflicts of Interest
The authors declare no conflict of interest.
References
- Pan, D.L.; Wang, D.F. Advances in the science of marine optical remote sensing application in China. Adv. Earth Sci. 2004, 19, 506–512. [Google Scholar]
- Liu, J.; Liu, J.H.; He, X.Q.; Pan, D.L.; Bai, Y.; Zhu, F.; Chen, T.Q.; Wang, Y.H. Diurnal Dynamics and Seasonal Variations of Total Suspended Particulate Matter in Highly Turbid Hangzhou Bay Waters Based on the Geostationary Ocean Color Imager. IEEE J. Sel. Top. Appl. Earth Obs. Remote Sens. 2018, 11, 2170–2180. [Google Scholar] [CrossRef]
- Pan, D.; Gong, F.; Chen, J. The Chinese environment satellite mission status and future plan. Proc. SPIE—Int. Soc. Opt. Eng. 2009, 7474. [Google Scholar] [CrossRef]
- Yu, H.P.; Cheng, P.G.; Li, Y.S. PhotoShop software in RS image processing. Sci. Surv. Mapp. 2011, 3, 199–201. [Google Scholar]
- Mi, H.C.; Zhang, X.D.; Lai, K. Correction of Interpolation Methods in ENVI for Remotely Sensed Imagery. Comput. Sci. 2014, 41, 322–326. [Google Scholar]
- Wang, M.; Pan, J.; Chen, S.Q.; Li, H. A method of removing the uneven illumination phenomenon for optical remote sensing image. In Proceedings of the 2005 IEEE International Geoscience and Remote Sensing Symposium, Seoul, Korea, 25–29 July 2005; Volume 5, pp. 3243–3246. [Google Scholar]
- Wang, W.T.; Wen, D.B.; Chen, Z.C.; Zhu, J.J. An Improved MASK Dodging Method Research on Neighborhood Pixels. Available online: http://www.en.cnki.com.cn/Article_en/CJFDTotal-DBCH201712013.htm (accessed on 2 January 2020).
- Li, D.; Wang, M.; Pan, J. Auto-dodging processing and its application for optical RS images. Geomat. Inf. Sci. Wuhan Univ. 2006, 31, 753–756. [Google Scholar]
- Zhang, Z.; Zhu, B.S.; Zhu, S.L. Improved MASK dodging method based on wavelet. J. Remote Sens. 2009, 6, 1074–1081. [Google Scholar]
- Yao, F.; Hu, H.; Wan, Y. Research on the Improved Image Dodging Algorithm Based on Mask Technique. Remote Sens. Inf. 2012, 28, 8–13. [Google Scholar] [CrossRef] [Green Version]
- Sun, W.; You, H.J.; Fu, X.Y.; Song, M.C. A non-linear MASK dodging algorithm for remote sensing images. Sci. Surv. Mapp. 2014, 39, 130–134. [Google Scholar]
- Celik, T. Two-dimensional histogram equalization and contrast enhancement. Pattern Recognit. 2012, 45, 3810–3824. [Google Scholar] [CrossRef]
- Li, Z.J. Theory and Practice on Tone Image Reproduction of Color Photos; Wuhan University: Wuhan, China, 2005. [Google Scholar]
- Bracewell, R. The Fourier Transform and Its Applications. Am. J. Phys. 2005, 34. [Google Scholar] [CrossRef]
- Cooley, J.W.; Lewis, P.A.W.; Welch, P.D. The Fast Fourier Transform and Its Applications. IEEE Trans. Educ. 1969, 12, 27–34. [Google Scholar] [CrossRef] [Green Version]
- Antonini, M.; Barlaud, M.; Mathieu, P.; Daubechies, I. Image coding using wavelet transform. IEEE Trans. Image Process. 1992, 1, 205–220. [Google Scholar] [CrossRef] [Green Version]
- Zheng, J.; Xu, C.G.; Xiao, D.G.; Li, H.; Huang, H. The Technique of Digit Image’s Illumination Uneven Elimination. J. Beijing Inst. Technol. 2003, 23, 286–289. [Google Scholar]
- Liu, Y.; Jia, X.F.; Tian, Z.J. A processing method for underground image of uneven illumination based on holomorphic filtering theory. Ind. Mine Autom. 2013, 1, 9–12. [Google Scholar]
- Zhang, X.X.; Li, Z.J.; Zhang, J.Q.; Zheng, L. Use of discrete chromatic space to tune the image tone in a color image mosaic. In Proceedings of the Third International Symposium on Multispectral Image Processing and Pattern Recognition, Beijing, China, 20–22 October 2003; pp. 16–21. [Google Scholar]
- Li, H.F.; Shen, H.F.; Zhang, L.P.; Li, P.X. An Uneven Illumination Correction Method Based on Variational Retinex for Remote Sensing Image. Acta Geod. Cartogr. Sin. 2010, 39, 585–591. [Google Scholar]
- Zhang, S.W.; Zeng, P.; Luo, X.M.; Zheng, H.H. Multi-Scale Retinex with Color Restoration and Detail Compensation. J. Xi’an Jiaotong Univ. 2012, 46, 32–37. [Google Scholar]
- Rahman, Z.; Jobson, D.J.; Woodell, G.A. Retinex processing for automatic image enhancement. J. Electron. Imaging 2004, 13, 100–111. [Google Scholar]
- Sun, M.W. Research on the Key Technologies of Automatic and Rapid Production of Orthophoto; Wuhan University: Wuhan, China, 2009. [Google Scholar]
- Zhan, Z.Q.; Rao, Y.Z. Application of Rank Deficient Free Network Adjustment to Color Equalization for Close-range Imagery. Remote Sens. Inf. 2014, 6, 3–24. [Google Scholar]
- Wang, B.S.; Ai, H.B.; An, H.; Zhang, L. Research on Color Consistency Processing of Aerial Images. Remote Sens. Inf. 2011, 1. [Google Scholar] [CrossRef]
- Zhou, T.G. Study on the Seam-line Removal under Mosaicking of Remote Sensing Color Images. Comput. Eng. Appl. 2004, 36, 84–86. [Google Scholar]
- Pan, J. The Research on Seamless Mosaic Approach of Stereo Orthophoto; Wuhan University: Wuhan, China, 2005. [Google Scholar]
- Pan, L.; Fu, L. Ambiguity resolution using genetic algorithm. Wtusm Bull. Sci. Technol. 2004, 3, 26–29. [Google Scholar]
- Chen, K.; Huang, T.Y.; Wen, P.; Luan, Y.K.; Yang, L.B. Research on establishment of seamless DOM image database with color consistency using dodging and uniform color. Eng. Surv. Mapp. 2014, 23, 66–69. [Google Scholar]
- Reinhard, E.; Ashikhmin, M.; Gooch, B.; Shirley, P. Color transfer between images. IEEE Comput. Graph. Appl. 2001, 21, 34–41. [Google Scholar] [CrossRef]
- Ruderman, D.L.; Cronin, T.W.; Chiao, C.C. Statistics of cone responses to natural images: Implications for visual coding. J. Opt. Soc. Am. A 1998, 15, 2036–2045. [Google Scholar] [CrossRef] [Green Version]
- Zhang, L.; Zhang, Z.X.; Zhang, J.Q. The Image Matching Based on Wallis Filtering. J. Wuhan Tech. Univ. Surv. Mapp. 1999, 24, 24–27. [Google Scholar]
- MCM Zhipin. Ver. 6.5.0; Beijing Huazhi Yixin Technology Co., Ltd.: Beijing, China, 2020.
Figure 1.
Example of an original HY-1C image of Antarctica. There is uneven lighting in the image.

Figure 2.
Example mosaic result for a group of HY-1C images of Antarctica.

Figure 3.
The statistics of two adjacent images randomly selected from the dataset. (a) Mosaicked image. (b) The upper image. (c) The lower image. (d) Histogram of the three color channels of the upper image. (e) Histogram of the three color channels of the lower image. (f) The mean and standard deviation values.

Figure 4.
The processing of HY-1C images of Antarctica in the color consistency framework. CZI, Coastal Zone Imager.
Figure 4.
The processing of HY-1C images of Antarctica in the color consistency framework. CZI, Coastal Zone Imager.

Figure 5.
The process of single-view color consistency processing. (a) The process flow. (b) The data flow according to the process flow.
Figure 5.
The process of single-view color consistency processing. (a) The process flow. (b) The data flow according to the process flow.

Figure 6.
A comparison between the proposed method and the standard Gaussian filtering method. (a) Original image. (b) The feature map extracted by the standard Gaussian filter. (c) Single-view color consistency processing results using the standard Gaussian filter. (d) The auxiliary mask of the sample image. (e) The feature map extracted by the proposed filter. (f) Single-view color consistency processing results using the proposed filter.

Figure 7.
Example of a “no light” image.

Figure 8.
The flowchart of multi-view color consistency processing.

Figure 9.
Comparisons between the original images and the result of the single-view color consistency method.
Figure 9.
Comparisons between the original images and the result of the single-view color consistency method.


Figure 10.
The sub-region locations and ranges. The three images shown are named F1, F2, and F3. The rectangles are the sub-regions of each image, labeled A, B, C, and D, from left to right.
Figure 10.
The sub-region locations and ranges. The three images shown are named F1, F2, and F3. The rectangles are the sub-regions of each image, labeled A, B, C, and D, from left to right.

Figure 11.
Statistics of the original images and the results after processing. The mean, standard deviation, and average gradient of F1, F2, and F3 are shown separately.
Figure 11.
Statistics of the original images and the results after processing. The mean, standard deviation, and average gradient of F1, F2, and F3 are shown separately.


Figure 12.
Comparison of the mosaic results for the group images processed by the Wallis method [12] and the proposed approach. (a) Mosaic results for the original images. (b) Mosaic results for the images processed by the Wallis method. (c) Mosaic results for the images processed by the proposed method.

Figure 13.
The details of the mosaic boundaries with (a) the original images, (b) the Wallis method, and (c) the proposed method.
Figure 13.
The details of the mosaic boundaries with (a) the original images, (b) the Wallis method, and (c) the proposed method.

Figure 14.
Statistical results for the color consistency processing between images. (a) The standard deviation values of the mosaic results of the original images, the Wallis method results, and the results of the proposed method. (b) The standard deviation values of the mosaic results of the details of the original images and the details of the results of the proposed method. (c) The mean values and the difference values of the upper and lower part of the details of the original images and the details of the results of the proposed method. (d) The histogram similarity values between the upper part and the lower part of the mosaic result of the details of the original images and the mosaic result of the details of the proposed method.

© 2020 by the authors. Licensee MDPI, Basel, Switzerland. This article is an open access article distributed under the terms and conditions of the Creative Commons Attribution (CC BY) license (http://creativecommons.org/licenses/by/4.0/).
Share and Cite
MDPI and ACS Style
Li, Z.; Zhu, H.; Zhou, C.; Cao, L.; Zhong, Y.; Zeng, T.; Liu, J. A Color Consistency Processing Method for HY-1C Images of Antarctica. Remote Sens. 2020, 12, 1143. https://doi.org/10.3390/rs12071143
AMA Style
Li Z, Zhu H, Zhou C, Cao L, Zhong Y, Zeng T, Liu J. A Color Consistency Processing Method for HY-1C Images of Antarctica. Remote Sensing. 2020; 12(7):1143. https://doi.org/10.3390/rs12071143
Chicago/Turabian StyleLi, Zhijiang, Haonan Zhu, Chunxia Zhou, Liqin Cao, Yanfei Zhong, Tao Zeng, and Jianqiang Liu. 2020. "A Color Consistency Processing Method for HY-1C Images of Antarctica" Remote Sensing 12, no. 7: 1143. https://doi.org/10.3390/rs12071143
Note that from the first issue of 2016, this journal uses article numbers instead of page numbers. See further details here.