Estimating Plant Nitrogen Concentration of Maize Using a Leaf Fluorescence Sensor across Growth Stages
by
 , ,
, ,
Rui Dong
1, 
Yuxin Miao
1,2,* ,
,
Xinbing Wang
1,
Zhichao Chen
3,
Fei Yuan
4,
Weina Zhang
1 and
Haigang Li
5 1
College of Resources and Environment Sciences, China Agricultural University, Beijing 100193, China
2
Precision Agriculture Center, Department of Soil, Water and Climate, University of Minnesota, St. Paul, MN 55108, USA
3
School of Surveying and Land Information Engineering, Henan Polytechnic University, Jiaozuo 454000, China
4
Department of Geography, Minnesota State University, Mankato, MN 56001, USA
5
College of Grassland, Resources and Environment, Inner Mongolia Agricultural University, Hohhot 010011, Inner Mongolia, China
*
Author to whom correspondence should be addressed.
Remote Sens. 2020, 12(7), 1139; https://doi.org/10.3390/rs12071139
Submission received: 28 February 2020
/
Revised: 26 March 2020
/
Accepted: 30 March 2020
/
Published: 2 April 2020
(This article belongs to the Special Issue Remote Sensing for Precision Nitrogen Management)
Abstract
:Nitrogen (N) is one of the most essential nutrients that can significantly affect crop grain yield and quality. The implementation of proximal and remote sensing technologies in precision agriculture has provided new opportunities for non-destructive and real-time diagnosis of crop N status and precision N management. Notably, leaf fluorescence sensors have shown high potential in the accurate estimation of plant N status. However, most studies using leaf fluorescence sensors have mainly focused on the estimation of leaf N concentration (LNC) rather than plant N concentration (PNC). The objectives of this study were to (1) determine the relationship of maize (Zea mays L.) LNC and PNC, (2) evaluate the main factors influencing the variations of leaf fluorescence sensor parameters, and (3) establish a general model to estimate PNC directly across growth stages. A leaf fluorescence sensor, Dualex 4, was used to test maize leaves with three different positions across four growth stages in two fields with different soil types, planting densities, and N application rates in Northeast China in 2016 and 2017. The results indicated that the total leaf N concentration (TLNC) and PNC had a strong correlation (R2 = 0.91 to 0.98) with the single leaf N concentration (SLNC). The TLNC and PNC were affected by maize growth stage and N application rate but not the soil type. When used in combination with the days after sowing (DAS) parameter, modified Dualex 4 indices showed strong relationships with TLNC and PNC across growth stages. Both modified chlorophyll concentration (mChl) and modified N balance index (mNBI) were reliable predictors of PNC. Good results could be achieved by using information obtained only from the newly fully expanded leaves before the tasseling stage (VT) and the leaves above panicle at the VT stage to estimate PNC. It is concluded that when used together with DAS, the leaf fluorescence sensor (Dualex 4) can be used to reliably estimate maize PNC across growth stages.
1. Introduction
Maize (Zea mays L.) is one of the three major grain crops in the world along with rice (Oryza sativa L.) and wheat (Triticum aestivum L.) [1]. Nitrogen (N) is one of the most essential nutrients that significantly affect maize yield, biomass, and grain quality. However, over-application of N is common in Chinese agriculture, resulting in many environmental problems [2,3]. Precision N management strategies aiming to apply the optimal amount of N fertilizer at the right time and place can help increase crop yield and N use efficiency, as well as reduce N surplus and environmental impacts [4,5,6].
The development and implementation of proximal and remote sensing technologies has provided new opportunities for non-destructive and real-time crop N status estimation on different scales [7,8,9]. Since leaf pigment concentrations, especially the chlorophyll concentration (Chl), can affect leaf reflectance properties and are highly correlated with N status, many optical sensors have been used to measure the canopy reflectance of a specific area or the entire crop field to estimate plant N status [7,10,11,12]. However, reflectance sensors are usually influenced by light conditions, soil and water background, and often saturate under high biomass conditions. Proximal fluorescence sensing is insensitive to soil backgrounds, environmental light, or biomass conditions and may overcome some of the problems in N status diagnosis [7,13]. As a traditional and standard indicator of plant N status, plant N concentration (PNC) is closely related to yield performance [14,15,16]. Therefore, PNC has been widely estimated through various sensing methods, and used as a reference in different N diagnostic methods, with critical PNC values established for different crops and growth stages [7,17,18]. Most importantly, unlike reflectance indices, fluorescence signals have stronger relationships with PNC as they are mainly affected by leaf Chl concentration but not by biomass or leaf area index (LAI) [13,19,20,21].
Dualex 4 (Force-A, Orsay, France) is a portable leaf fluorescence sensor and has been used in the past few years to monitor crop physiology and study N status diagnosis [22]. Apart from measuring Chl concentration through leaf transmittance, Dualex 4 can also measure leaf epidermal flavonoids (Flav) by comparing the Chl fluorescence induced by ultra-violet (UV) excitation at 375 nm to that induced by red light at 650 nm wavelength [23,24,25], and provides a new Chl/Flav ratio called N balance index (NBI). Numerous recent studies have focused on utilizing Dualex 4 to estimate N status in a variety of crops, and have revealed a significant relationship between Dualex 4 readings and N indicators. For example, Dualex 4-based Chl readings were found to be highly related to leaf Chl concentrations in four crops including corn, soybean (Glycine max L. Merr.), spring wheat (Triticum aestivum L.), and canola (Brassica napus L.) (R2 = 0.69–0.90) [26]. Cartelat et al. [27] showed a strong linear relationship between phenolics (Phen) measured by Dualex sensor and leaf N concentration (LNC) (R2 = 0.76) and further displayed the correlation between Phen and N nutrition index (NNI) (r = −0.60) for wheat. It was found that NBI calculated using a chlorophyll metercombined with an older version Dualex sensor could predict PNC and NNI most accurately for muskmelon (Cucumis melo L. cv. Tezac) (R2 = 0.79–0.93 and 0.80–0.95) [28].
However, it is sometimes difficult to successfully use various proximal and remote sensors, including fluorescence sensors, because spectral data may vary due to different factors, such as soil conditions, crop growth stages, and leaf positions [7,9,21,29,30,31,32]. The variations of different soils in terms of quality, water, nutrition, and temperature often affect crop growth and lead to changes in crop properties [33,34,35,36]. Stress events resulting from environmental situations may eventually change the content of some compounds like leaf pigments [37,38,39]. This could modify leaf optical and fluorescence properties and be monitored by proximal or remote sensing technologies.
It has been a great challenge to use proximal and remote sensing technologies to reliably estimate PNC across growth stages [40]. The active canopy sensor GreenSeeker-based vegetation indices (VIs) could be used to predict LAI and aboveground biomass well (R2 = 0.83–0.89), but had a poor performance for PNC estimation (R2 = 0.47) across V5–V10 growth stages for spring maize in Northeast China [41]. Different VIs and prediction models will be needed to estimate PNC at different growth stages [40,42]. PNC can be more reliably estimated at later growth stages, but at early growth stages before crop canopy closure, the performance of most prediction models has been quite poor, even with hyperspectral remote sensing data [40,42]. Gabriel et al. [43] compared two leaf chlorophyll sensors (SPAD-502 and Dualex) for estimating maize LNC on two different dates, and demonstrated similar performance of the two sensors, with R2 = 0.43 and 0.62 for SPAD and R2 = 0.42 and 0.68 for Dualex. Tremblay et al. [29] found that Dualex could be used to diagnose maize N status successfully within 21 days after topdressing but lost sensitivity at later stages. A hand-held canopy fluorescence sensor Multiplex has been used to detect N status in early growth stages of maize and it was proven that the Multiplex parameters were strongly influenced by N dose [20,44]. Moreover, strong relationships between fluorescence indices and N indicators of rice at different growth stages were revealed by Huang et al. [45]. To overcome the influence of growth stage or other factors, N sufficiency index (NSI) or response index (RI) is generally calculated by using a well-fertilized area as the reference to diagnose crop N status [41,45,46], but such approach will require a well-fertilized area or N rich plot, and generally cannot improve the prediction of PNC across growth stages [45]. Therefore, more studies are still needed to develop methods for reliable prediction of PNC across growth stages.
Several studies have reported the use of fluorescence sensing technology to evaluate crop N status. For example, Yang et al. [47] showed that there were consistent positive correlations between fluorescence parameters and LNC for different rice cultivars with R2 varying from 0.70 to 0.90. Another study demonstrated that NBI and NBI1 based on the Multiplex 2 fluorescence sensor were linearly related to LNC with a high coefficient of determination for two turfgrass cultivars (R2 = 0.85–0.87 and R2 = 0.75–0.78, respectively) [48]. A study using a Dualex sensor calibrated three optical indices (Chl, Flav and NBI) against LNC of grapevine (Vitis vinifera L.) and verified that NBI was optimal for estimating LNC with a root-mean-square error (RMSE) smaller than 2 mg of N g−1 dry weight. The threshold values of NBI from 11 to 18 at flowering and 8 to 11 at bunch closure were proposed [17]. Recently, Zhang et al. [49] found Dualex 4 sensor parameters were significantly correlated with rice PNC at different growth stages (R2 = 0.43–0.77) or across growth stages (R2 = 0.52–0.69).
To date, few studies have reported on how to use leaf fluorescence sensors to accurately estimate crop PNC, especially developing strategies to effectively overcome the influence of different growth stages. Therefore, the objectives of this study were to (1) determine the relationship of maize LNC and PNC, (2) evaluate the main factors influencing the variations of leaf fluorescence sensor parameters, and (3) develop a practical strategy to reliably estimate maize PNC using leaf fluorescence sensor across different growth stages.
2. Materials and Methods
2.1. Study Site and Soil Description
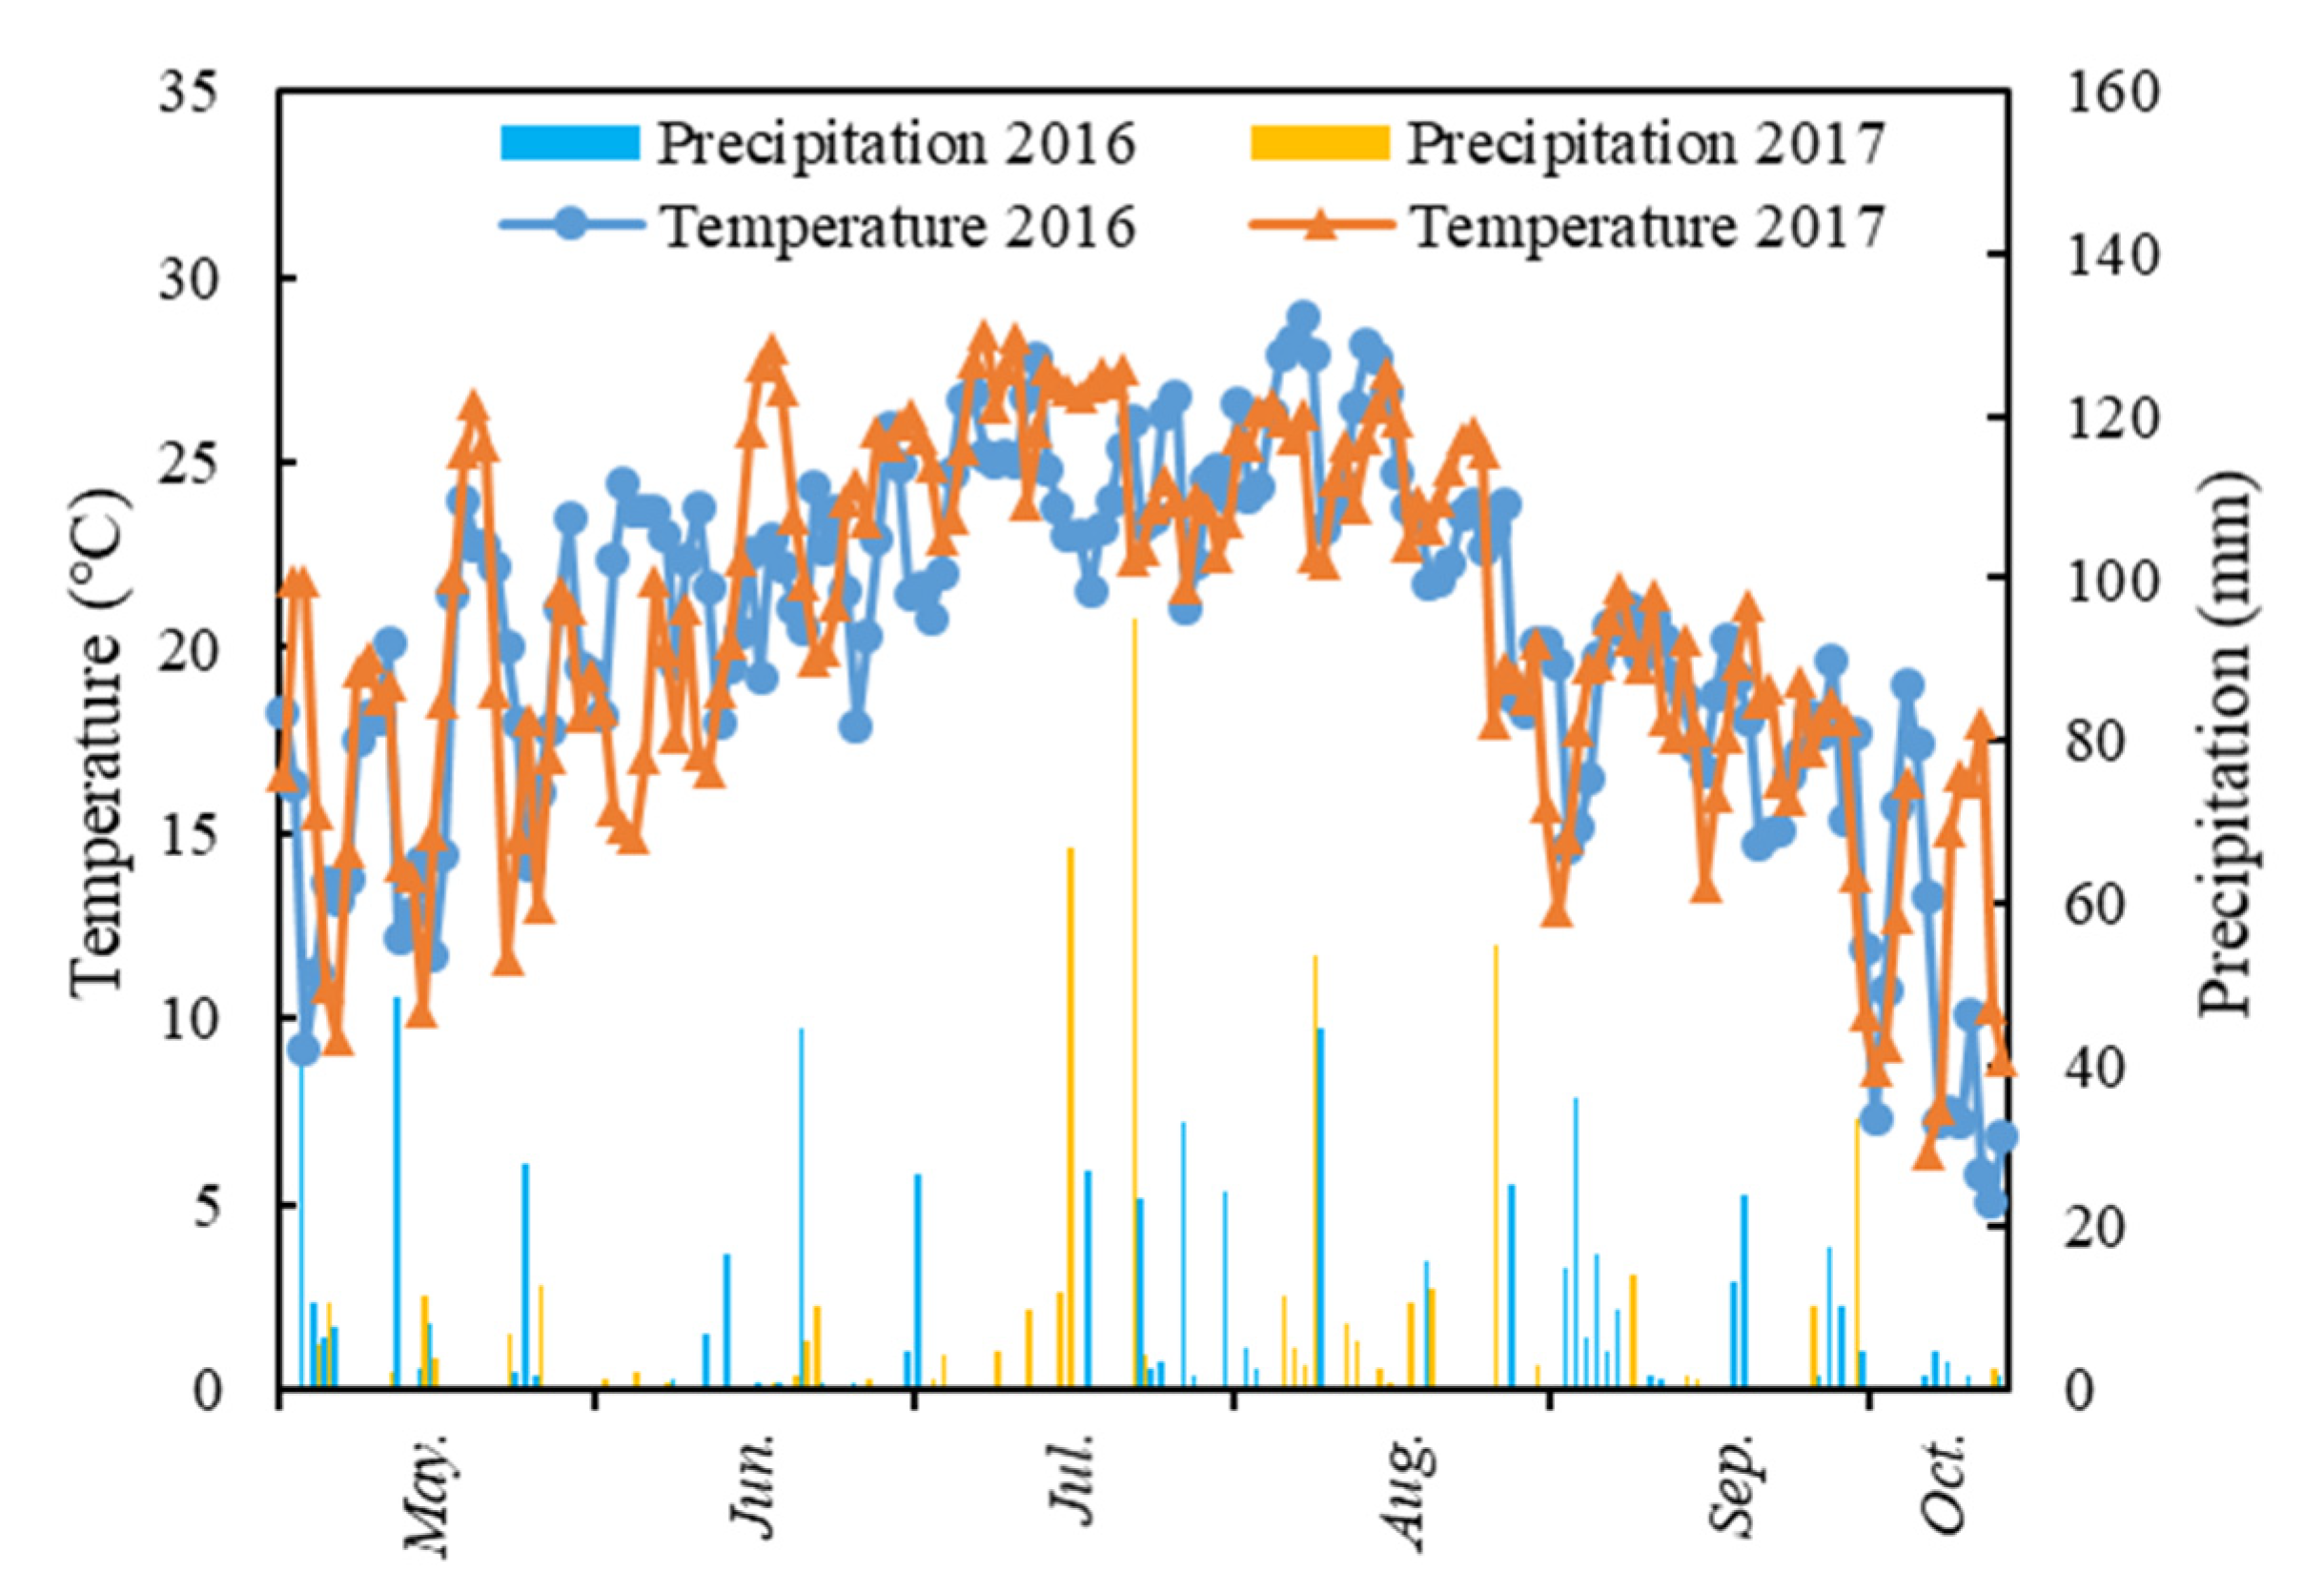
The study was conducted in Lishu County (43°02′–43°46′N, 123°45′–124°53′E), Jilin Province in Northeast China from 2016 to 2017. Located in North Temperate Zone with four distinct seasons, this region has a semi-humid continental monsoon climate. The mean annual average temperature is 6.6 °C, and the annual average precipitation is 556 mm, about 80% of which occurs during the crop growing season from May to September. Figure 1 shows the precipitation distribution and mean temperature during the growing season in 2016–2017 in Lishu.
Two sites with different soil types were selected for this study. Site 1 has Aeolian sandy soil (loamy sand), which is classified as typic Cryopsamments. Site 2 has Black soil (loamy clay), which is classified as typic Haploboroll in the United States Department of Agriculture (USDA) Soil Taxonomy.
2.2. Experimental Design
All the treatments of the experiment were the same in both fields. Using a split-plot design with three replications, a local maize cultivar Liangyu 66 was sown in early May each year with planting densities of 55,000, 70,000 and 85,000 plant ha−1 as the main plots, and six N treatments were established as the subplots, with total N doses of 0, 60, 120, 180, 240, and 300 kg ha−1, respectively. The N fertilizers were applied in two split applications: 1/3 was broadcasted and incorporated into the soil with rotary tillage as basal N using ammonium sulfate before sowing, and 2/3 was banded as side-dress N using urea at around V8–V9 growth stage in early July. The subplots in a wide-narrow row planting pattern were 9 × 12 m with 1 m wide alley between the subplots. Sufficient phosphate (90 kg P2O5 ha−1) and potash (90 kg K2O ha−1) fertilizers were applied before sowing to make sure P and K nutrients were not limiting for each plot.
There was no irrigation at Site 2, while about 50 mm of water was irrigated into the soil around mid-July at Site 1 in each year due to water stress in sandy soil. All plots were kept free of weeds, insects, and diseases with pesticides based on local standard practices. Detailed information about the experiments conducted in this study in 2016 and 2017 is listed in Table 1.
2.3. Dualex 4 Sensor Data Collection, Plant Sampling, and Measurements
Three representative plants located in the center rows of each plot of six N treatments at the 70,000 plants ha−1 density in the two fields were selected to be cut at the ground level at V8, V12, and VT in 2016, and V4, V11, and VT in 2017. Each single leaf was separated from the whole plant, and leaves in the same position of the three plants in each plot were mixed together. The stems were also mixed together.
The Dualex 4 sensor (Force-A, Orsay, France) was used in this study for proximal sensing. Three representative plants located in the inner rows of each plot of six N treatments at three densities were selected to be sampled and measured by the sensor. In particular, this sensor measures a leaf surface area of 20 mm2. The plant samples and sensor readings were obtained at V6, V8, V12, and VT growth stages in 2016 and at V6, V8, and VT growth stages in 2017 in each field. Dualex 4 values were measured at around the leaf blade midpoint to avoid midribs or physical damage on the adaxial side (upper side) of the uppermost, second, and third fully expanded leaves before VT stage, as well as the leaf above the panicle, panicle leaf, and the leaf below the panicle at the VT growth stage for each plant in each plot. After sensing, all plant samples in each plot were separated into leaves and stems except for the V6 growth stage.
All samples were oven-dried at 105 ℃ for 30 min, then dried at 70 ℃ to a constant weight, and ground into fine powders to determine N concentration using a modified Kjeldahl digestion method [50]. The total NLC (TLNC) is the sum of the product of the N concentration of each leaf and its proportional weight, while PNC is calculated by adding the product of the N concentration of each organ and its proportional weight. As the leaves were the main component of the plant at the V6 growth stage, the TLNC at this stage was also used as PNC in this study.
The data acquisition dates and days after sowing (DAS) are shown in Table 1. For the convenience of discussion, the first, second, and third leaves counted from the top of the maize plant selected for sensor measurement in this research were abbreviated as Leaf 1, Leaf 2, and Leaf 3, respectively. The three Dualex 4 parameters (Chl, Flav, and NBI) at the same leaf position of three plants in each plot were averaged and used as the mean reading of that leaf position for the plot. The details of the Dualex 4 parameters are shown in Table 2.
2.4. Statistical Analysis
The data collected were pooled together to establish the relationships between single LNC (SLNC) and TLNC and PNC. In addition, the data collected by fluorescence sensing for each site, year, growth stage, and N rate were divided into a calibration dataset (two replications of the observations) and a validation dataset (one replication of the observations). The mean, standard deviation (SD), coefficient of variation (CV, %) of SLNC, TLNC, and PNC were calculated using Microsoft Excel (Microsoft Corporation, Redmond, WA, USA).
Besides three raw Dualex 4 parameters, three modified parameters derived from them based on DAS were used in this study: modified Chl (mChl), modified Flav (mFlav), and modified NBI (mNBI) were computed as the ratio of Chl to DAS, the product of Flav and DAS, and the ratio of NBI to the square of DAS (Table 2). The coefficient of determination (R2) values for all relationships were calculated using SPSS 21.0 (SPSS Inc., Chicago, IL, USA), and the model with the highest R2 between the Dualex parameters and the two N indices (TLNC and PNC) was selected and listed in this paper, and was used for further estimation of PNC. The performance of the established relationship models for predicting PNC was evaluated by comparing R2, RMSE, and relative error (RE). The higher the R2 and the lower the RMSE and RE, the higher the accuracy of the prediction models. Agronomic and proximal sensing data were subjected to the least significant difference (LSD) test at a 5% significance level to assess differences between the means of treatments using SPSS 21.0.
3. Results
3.1. Interrelationships of SLNC, TLNC, and PNC
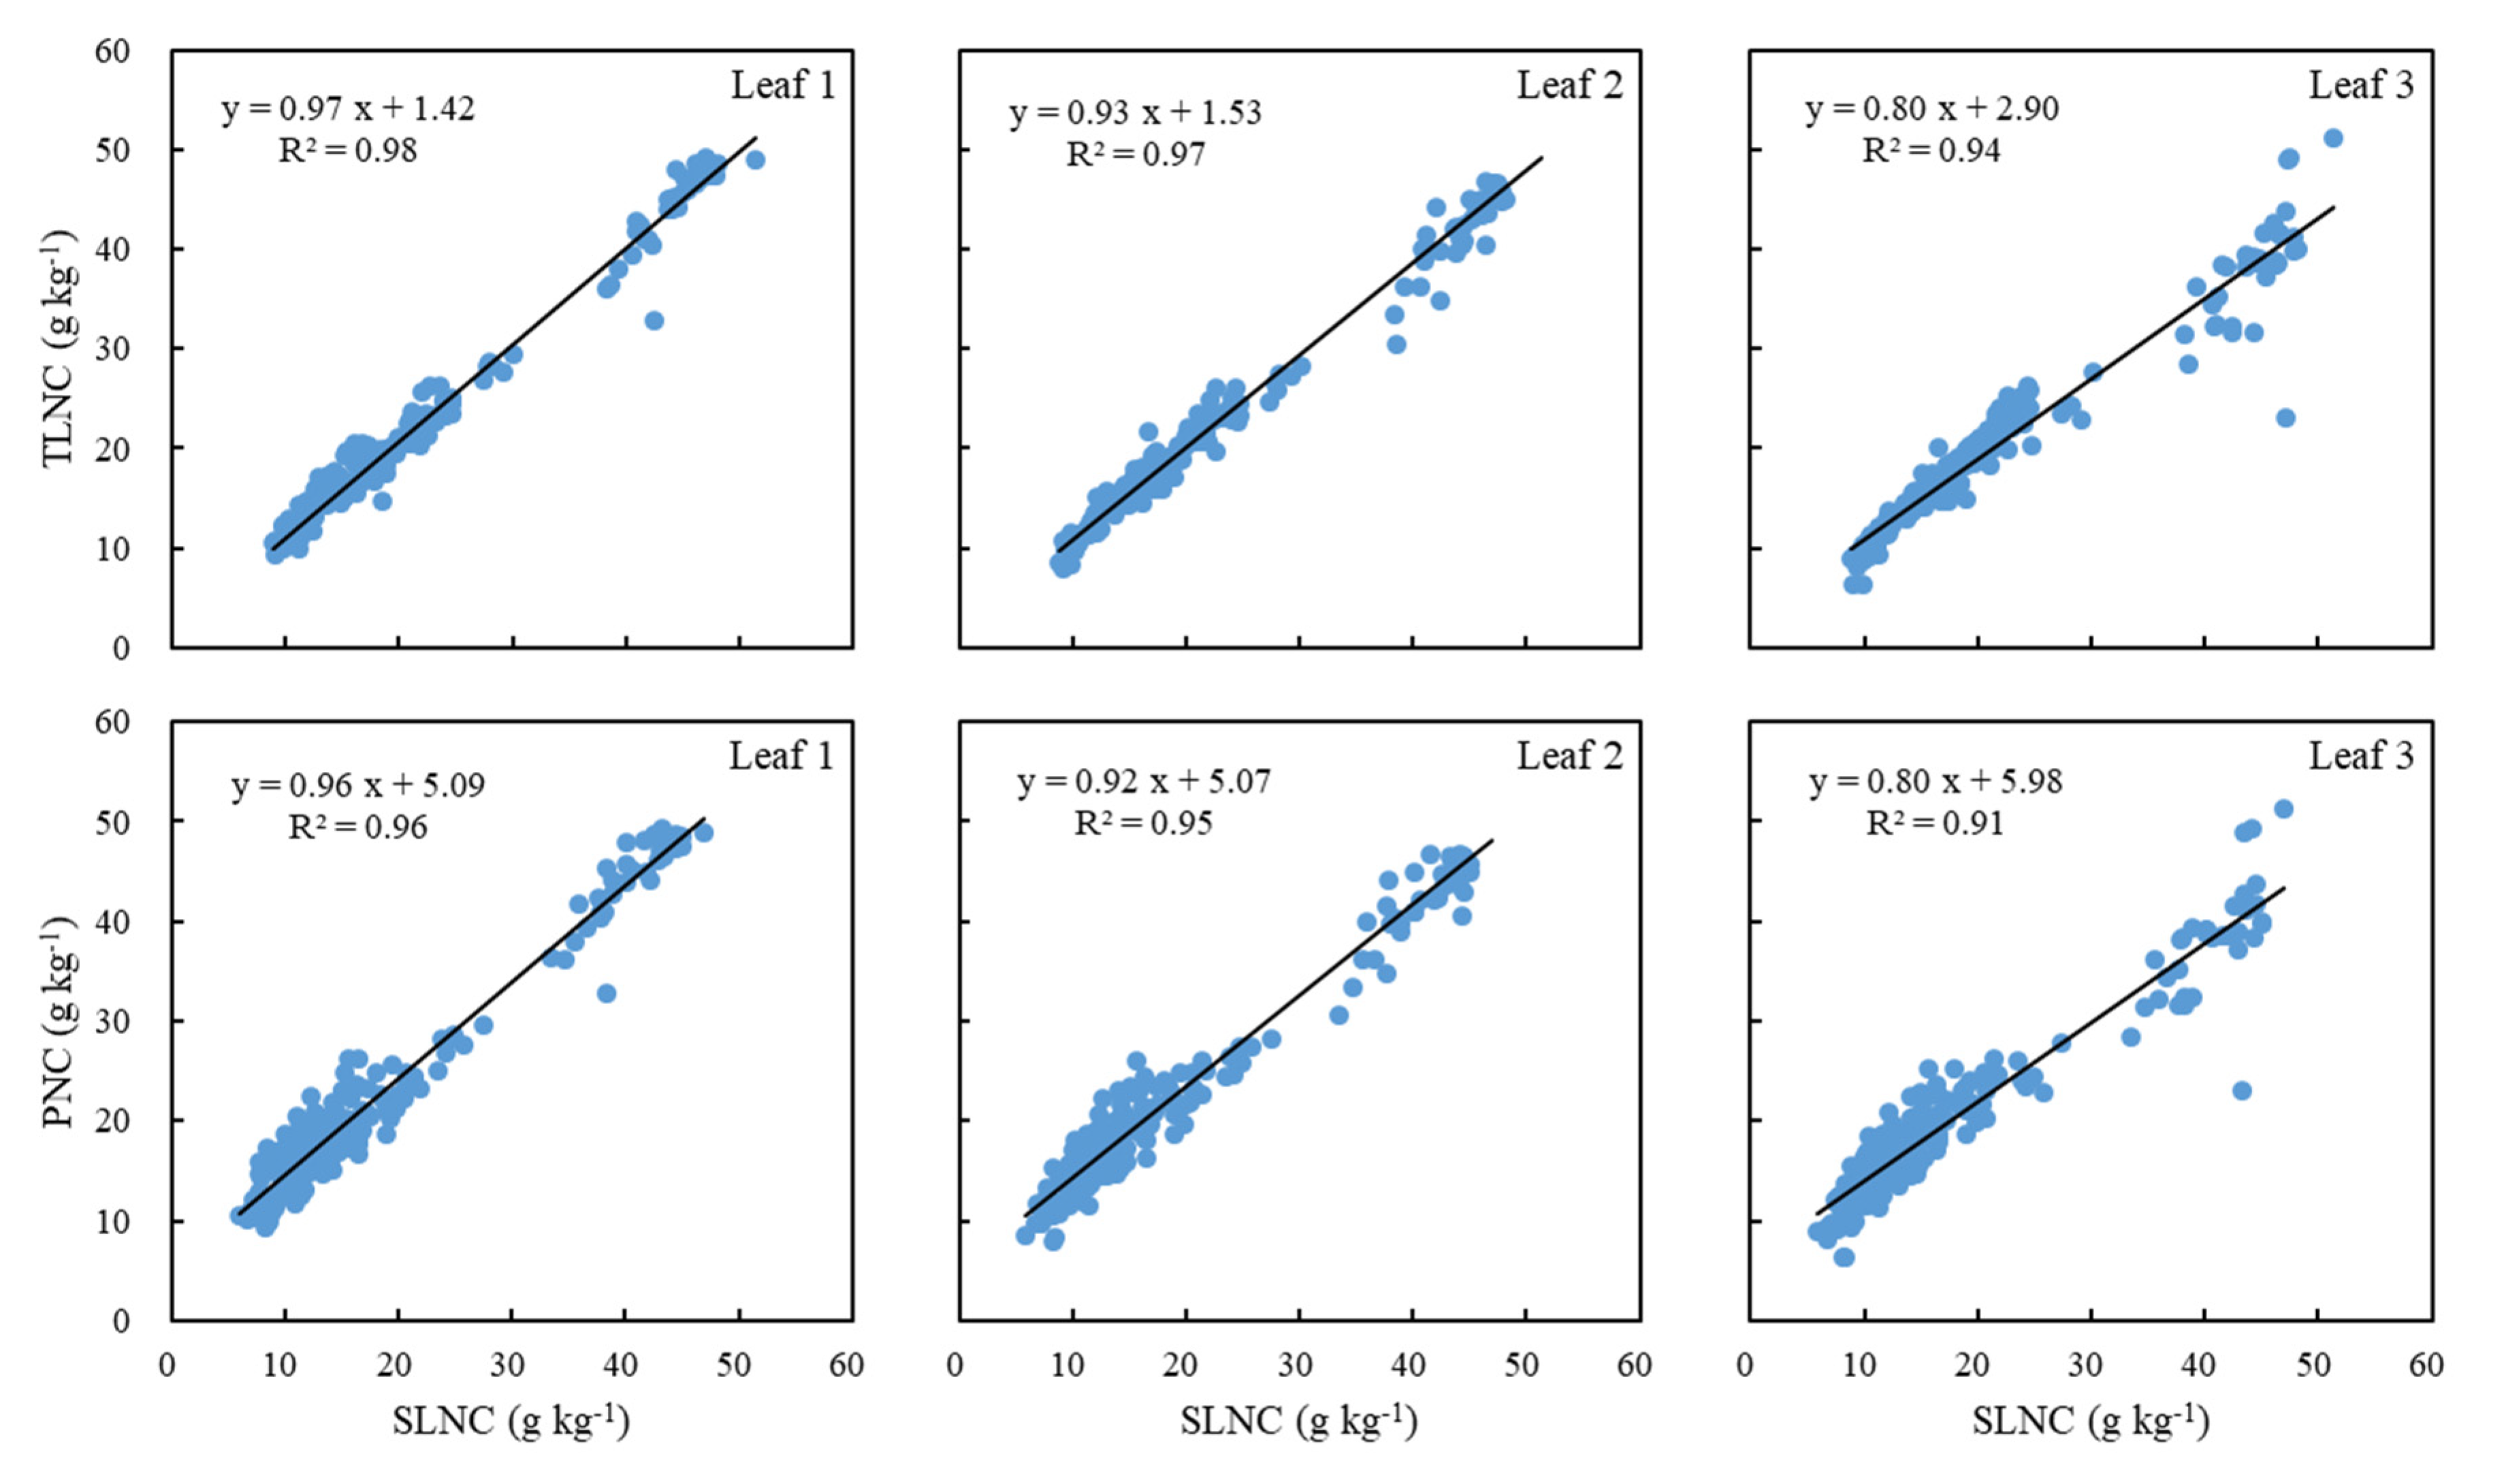
We plotted SLNC against TLNC and PNC in Figure 2. The SLNC was highly related to both TLNC and PNC with R2 varying from 0.91 to 0.98. The best relationships appeared in the results for Leaf 1 (R2 = 0.98 and 0.96), followed by Leaf 2 and finally Leaf 3. As the sum of each single leaf, the TLNC was more related to SLNC than that of the whole plant, because the PNC was also affected by the stem N concentration. However, the strong correlations of TLNC and PNC to SLNC indicated the high probability to use information acquired from a single leaf, especially Leaf 1, to understand the N status of maize through the prediction of TLNC or PNC.
3.2. Effects of Soil Type, Growth Stage, and N Rate on Maize TLNC and PNC
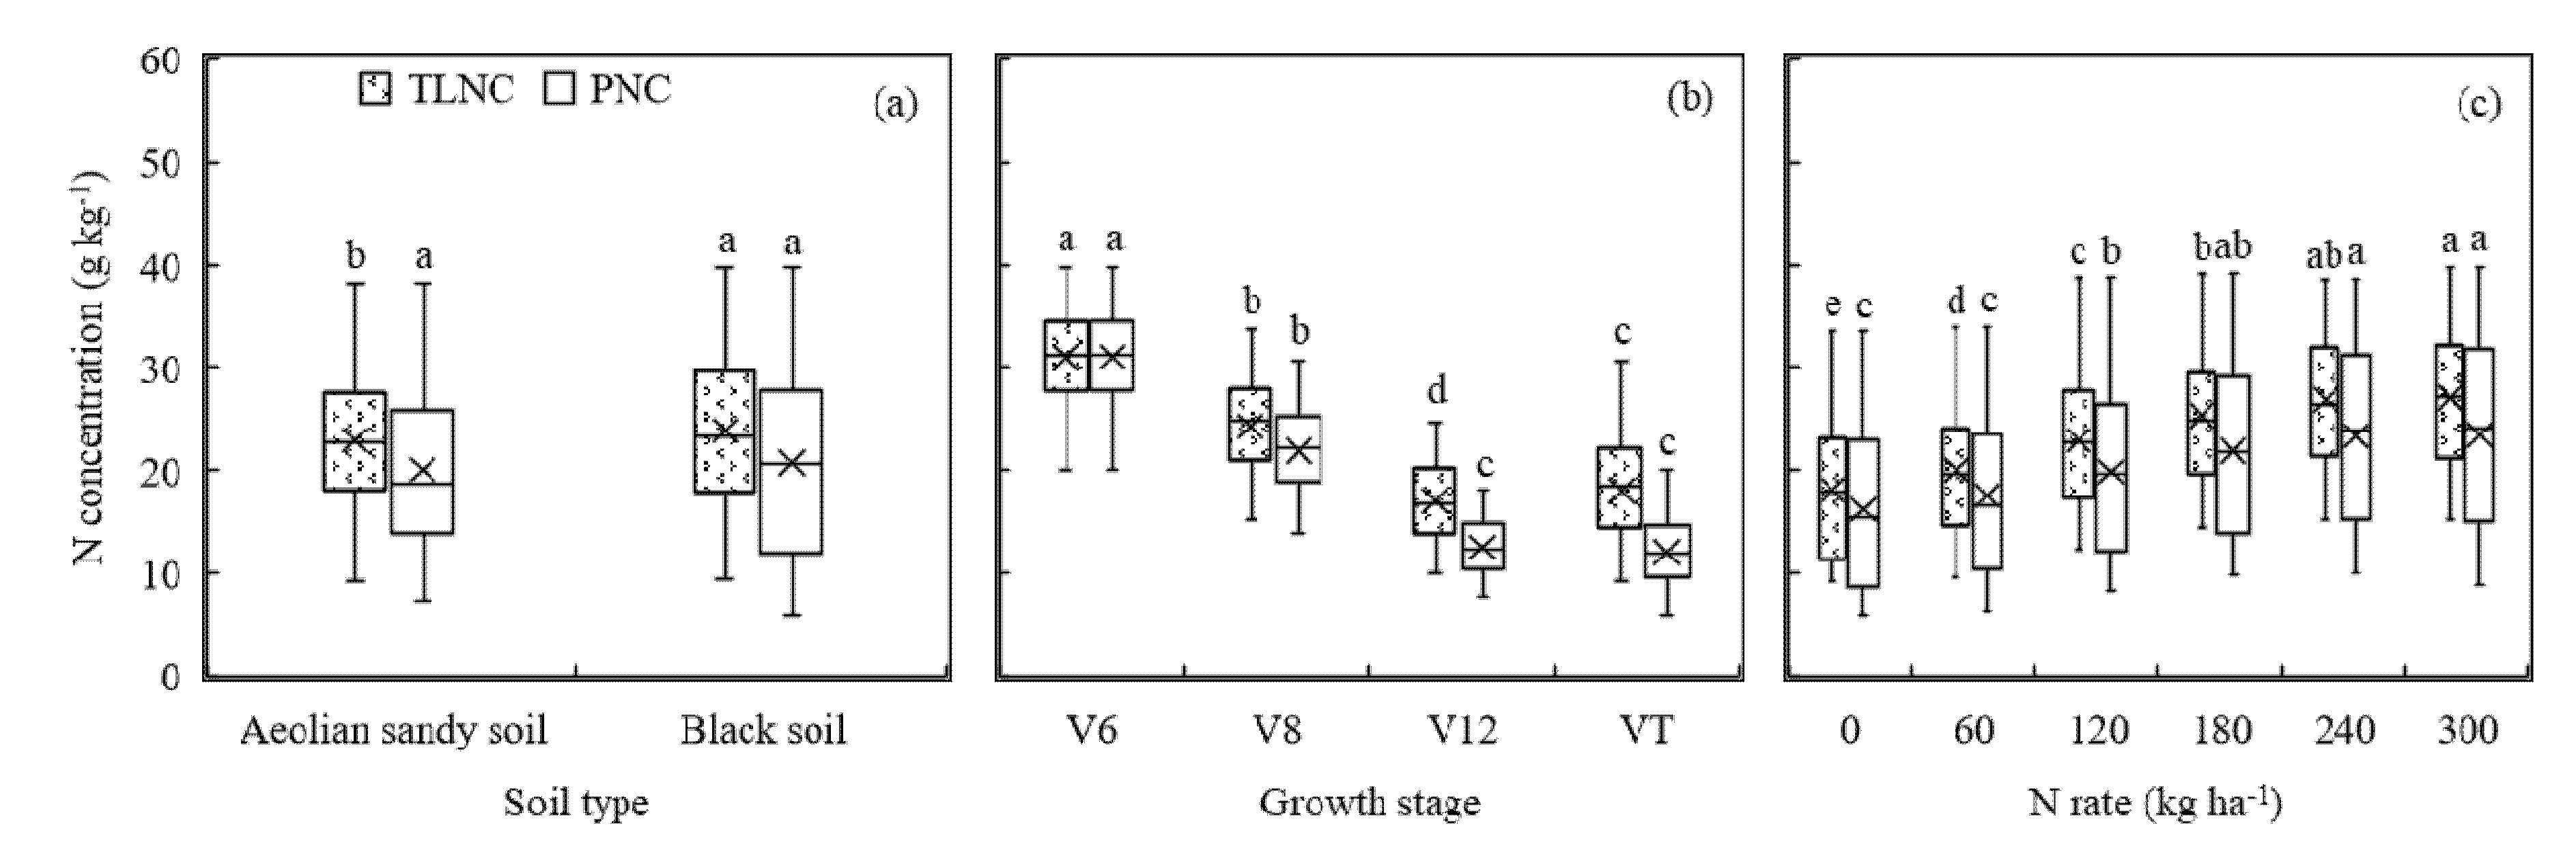
Figure 3 indicated that PNC was slightly lower than TLNC, and both were significantly affected by the growth stage and N rate. Different soil types only resulted in different TLNC values (mean = 22.91 and 23.93 g kg−1 for Aeolian sandy soil field (Site 1) and Black soil field (Site 2), respectively). For PNC, there was no significant difference between the two fields, with 20.07 and 20.69 g kg−1 for Aeolian sandy soil field (Site 1) and Black soil field (Site 2), respectively (Figure 3a). In contrast, TLNC of four growth stages differed significantly, from 17.06 g kg−1 at the V12 growth stage to 31.03 g kg−1 at the V6 growth stage, while PNC ranged from 12.10 g kg−1 at the VT growth stage to 31.28 g kg−1 at the V6 growth stage, without a significant difference between the V12 and VT growth stages (Figure 3b). The mean values of TLNC and PNC increased with N rates from the lowest under 0 kg ha−1 N rate treatment (18.10 g kg−1 for TLNC and 16.25 g kg−1 for PNC) to the highest under 300 kg ha−1 N rate treatment (27.09 g kg−1 for TLNC and 23.44 g kg−1 for PNC). The values of TLNC were significantly different under low N treatments (0 and 60 kg ha−1), but not under high N treatments (240 and 300 kg ha−1). However, the values of PNC were not significantly different under either low or high N treatments (Figure 3c).
3.3. Effects of Soil Type, Growth Stage, and N Rate on Dualex 4 Parameters
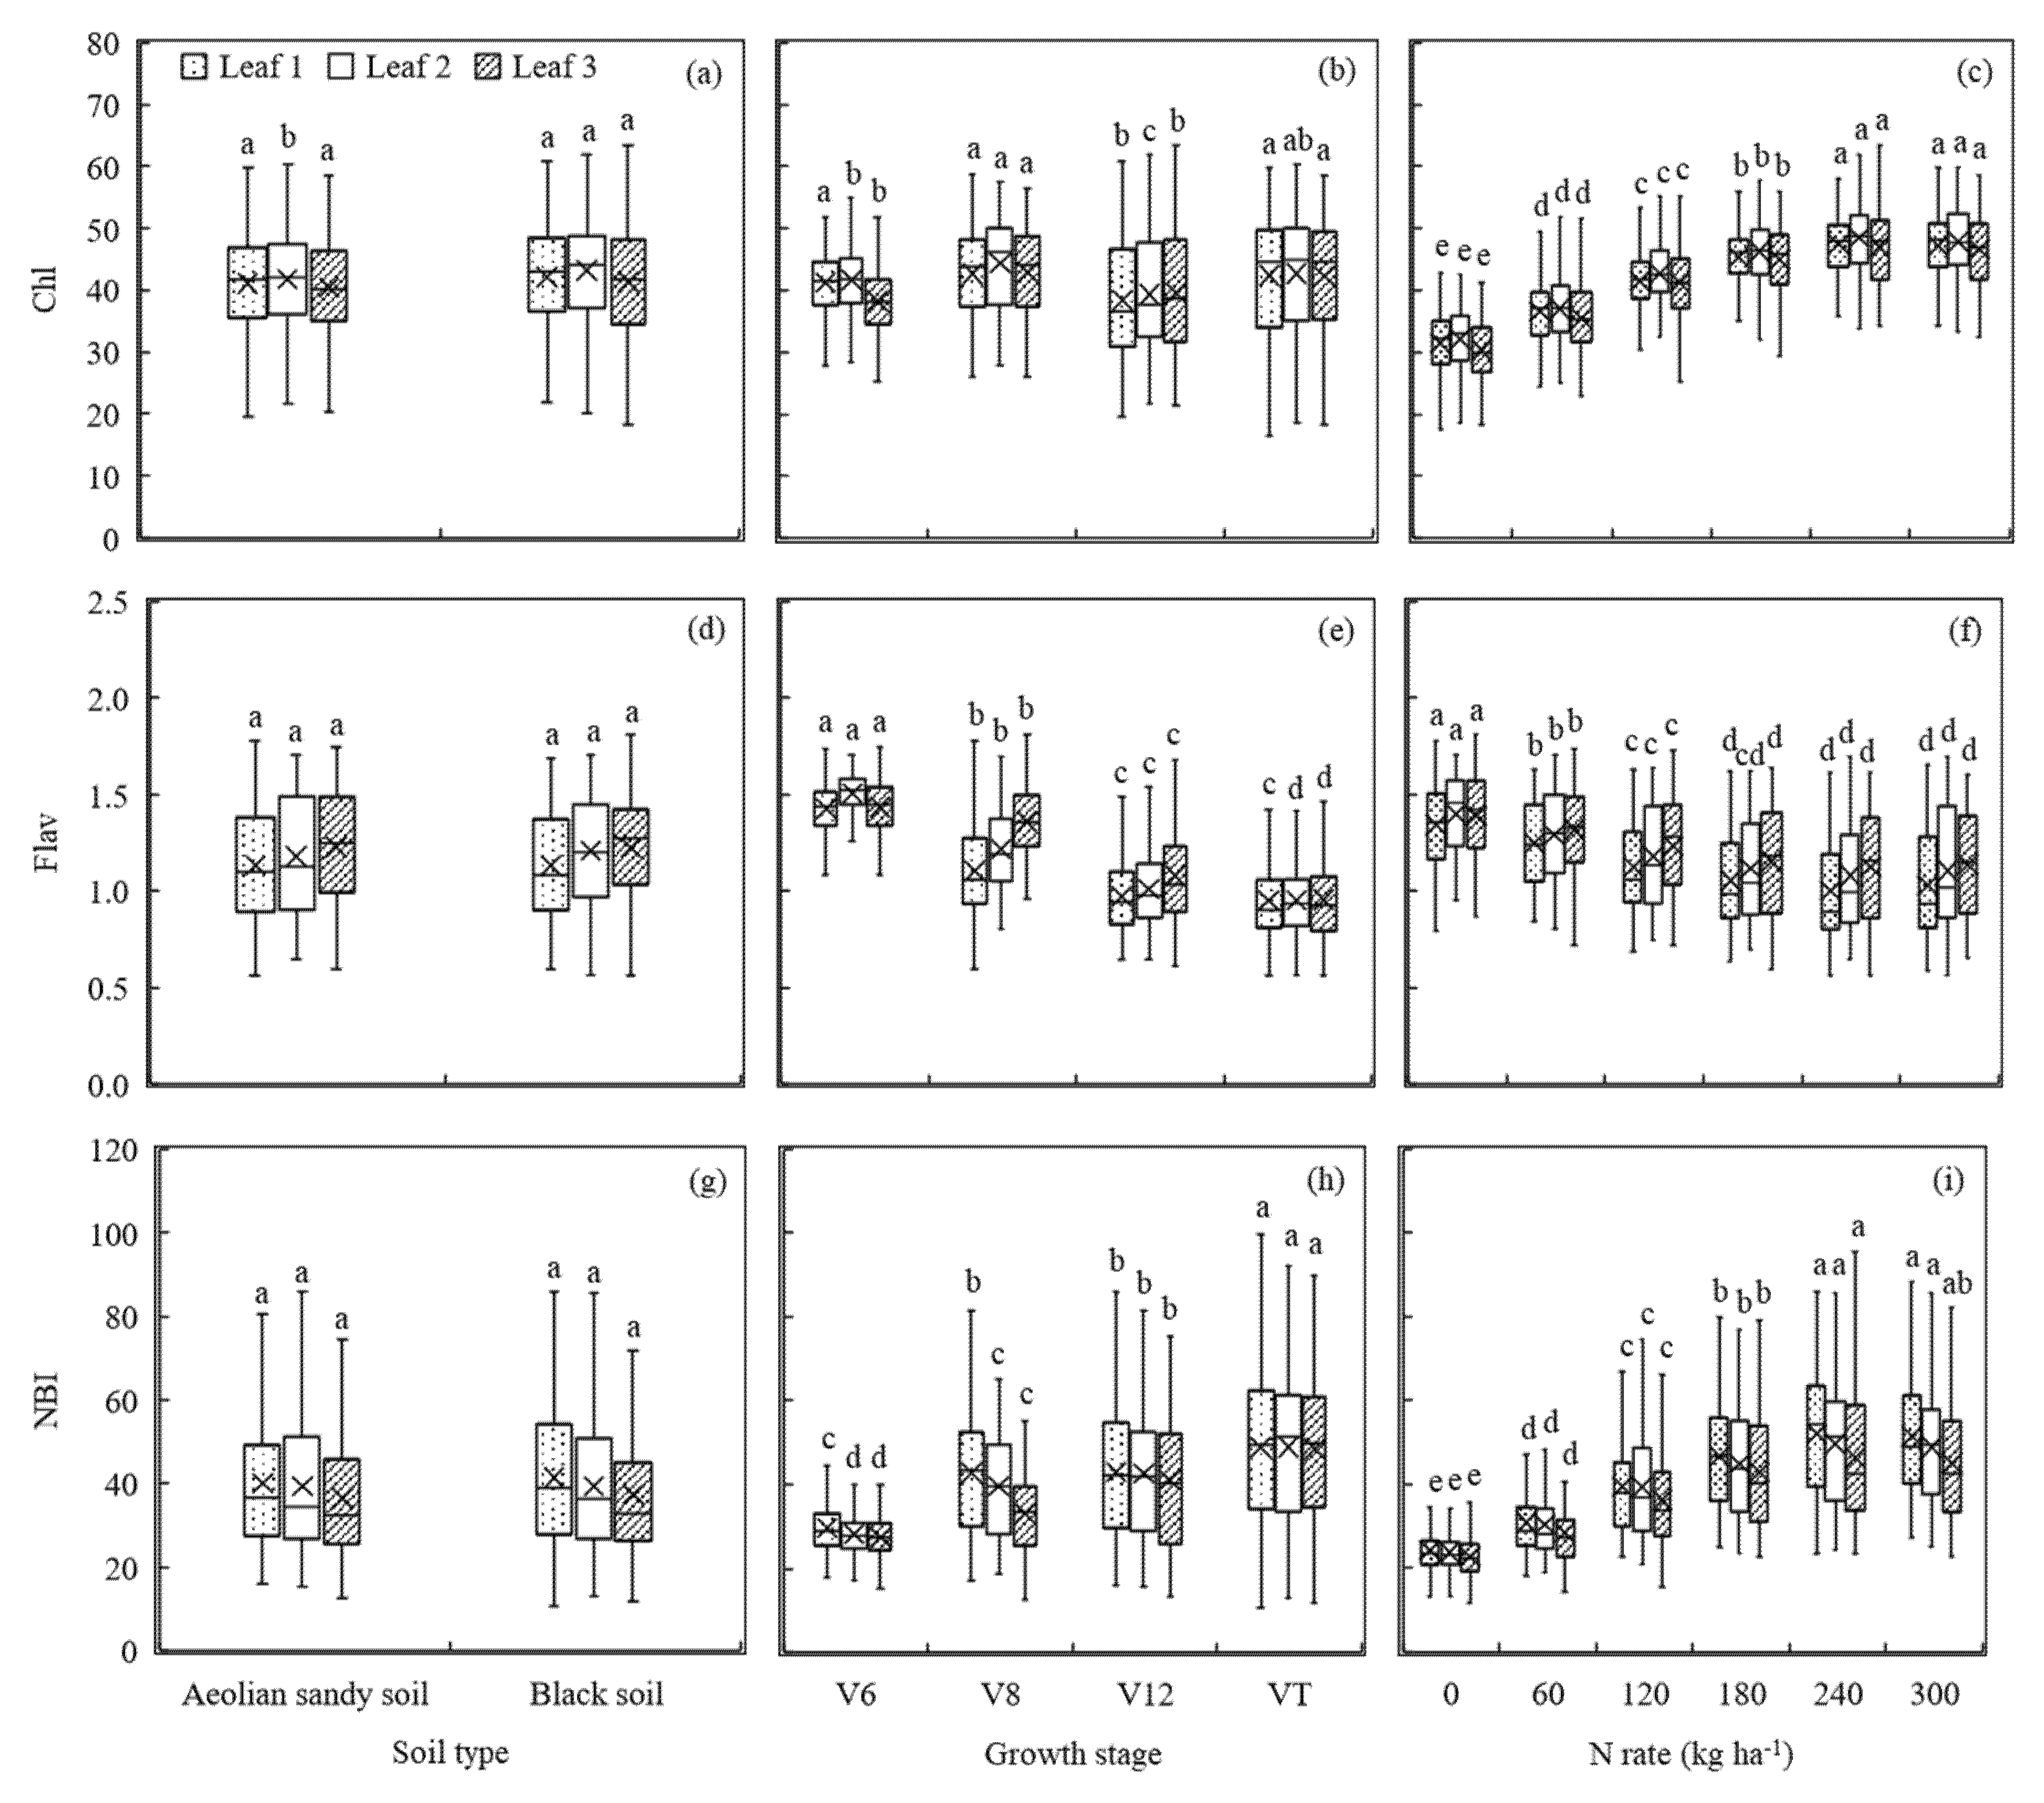
The differences in Chl, Flav, and NBI measured with a Dualex 4 sensor as influenced by soil types, growth stages, and N rates were analyzed and displayed in Figure 4. The Dualex 4 sensor-based fluorescence parameter values obtained from the three differently positioned leaves did not exhibit significant variability under the two soil types, except for Chl values of Leaf 2, with 41.70 for Aeolian sandy soil field (Site 1) and 43.14 for Black soil field (Site 2) (Figure 4a,d,g). Fluorescence parameter values changed less significantly with growth stages than TLNC and PNC (Figure 3b and Figure 4b,e,h). For Chl, there was no consistent trend as maize grew, although there was a significant difference at late growth stages for Leaf 1 and at early stages for Leaf 2 and Leaf 3 (Figure 4b). Flav values showed a constant decreasing trend with the growth of maize, similar to the changes of TLNC and PNC, but with less variation. Comparatively, the variation trend of Leaf 1 was the same as that of PNC, while the values of the other two leaves changed significantly with growth stages (Figure 3b and Figure 4e). NBI also showed significant differences among different growth stages, particularly for Leaf 2 and Leaf 3, but NBI and TLNC and PNC exhibited opposite trends from Flav, increasing with the increase of DAS (Figure 3b and Figure 4h). Besides, the Chl and NBI values increased with N rate up to 240 kg ha−1 for all three differently positioned leaves (Figure 4c,i). There was a negative relationship between Flav and N rate, with higher levels of Flav found in low N treatments and lower levels of Flav found in high N treatments. However, Flav did not vary much from 180 to 300 kg ha−1 N rates (Figure 4f). Moreover, the readings of the three fluorescence parameters of the three differently positioned leaves were very similar in different fields and under different growth stages and N rates (Figure 4).
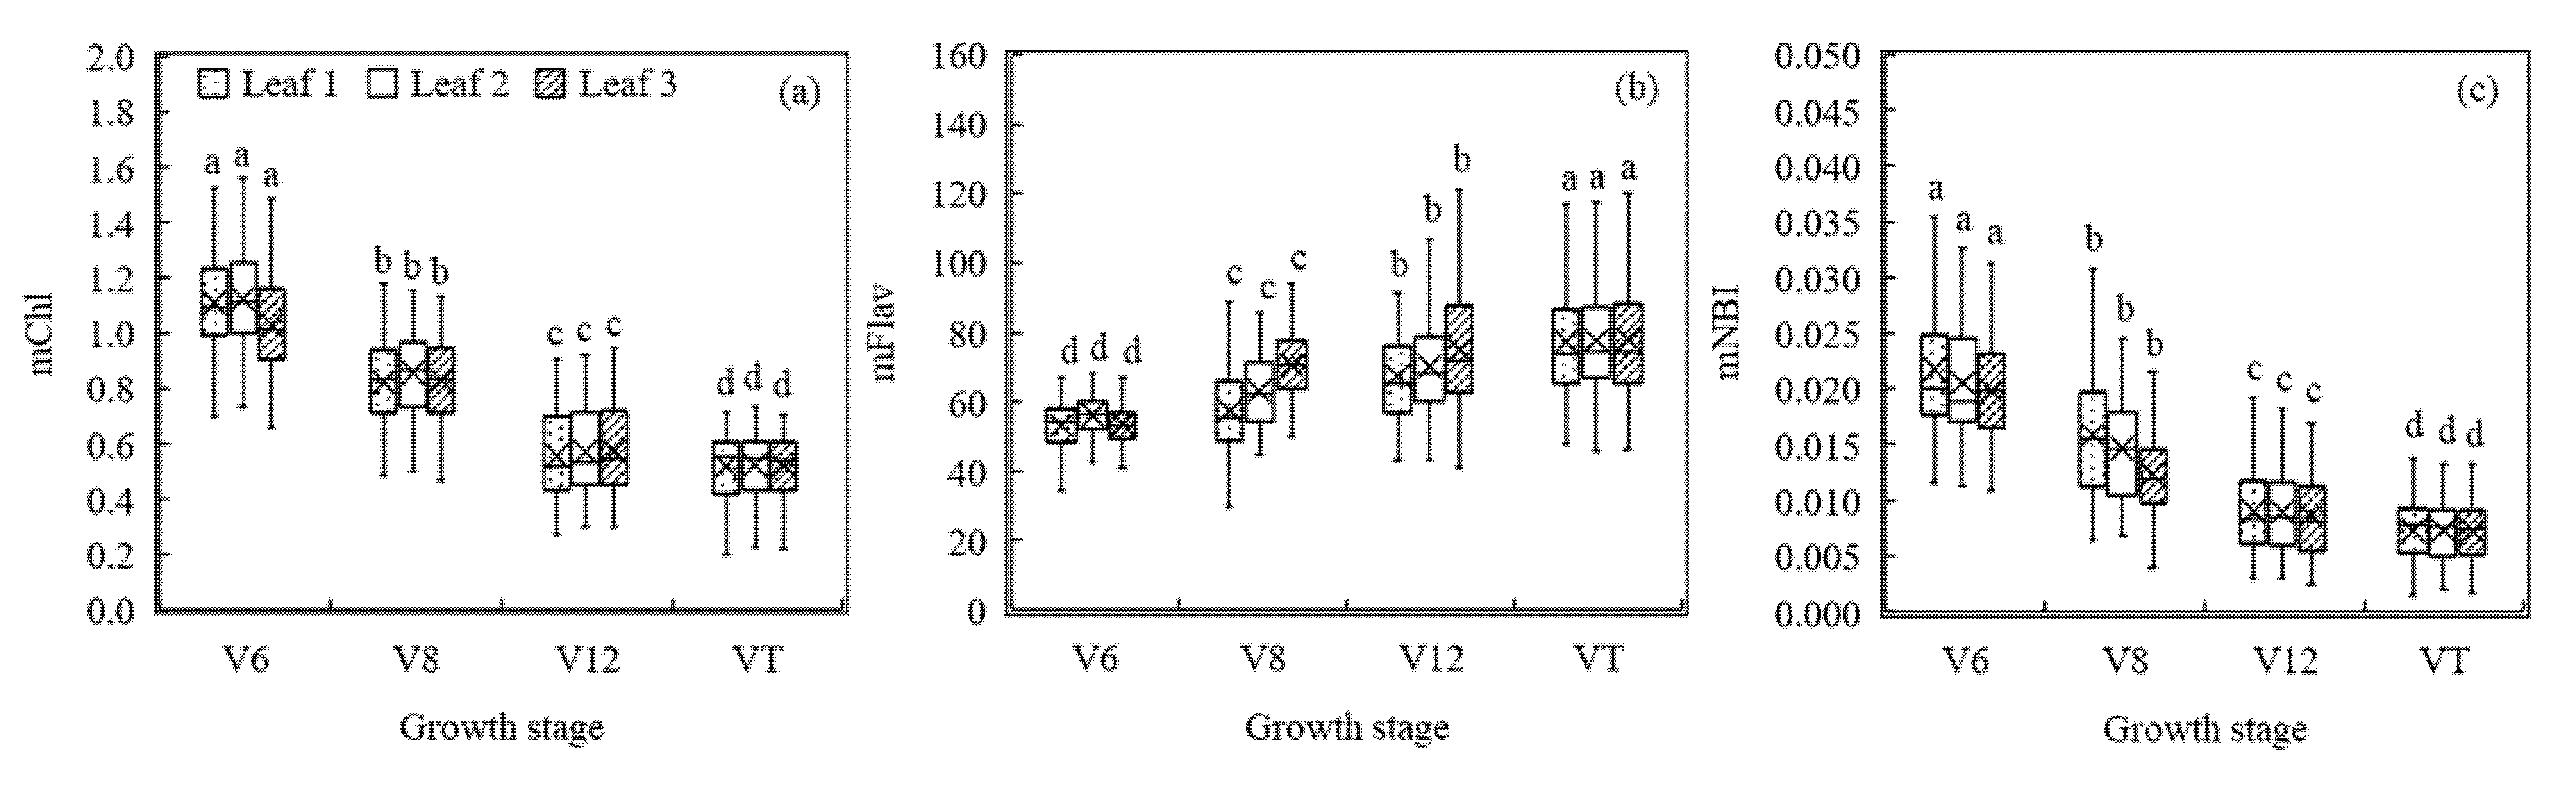
The results above indicated that growth stage was the main factor that influences the general model’s estimation of maize N concentration. To overcome the problem of the high inconsistency between the Dualex 4 parameters and the TLNC and PNC across growth stages, the modified Dualex 4 parameters incorporating the information of DAS were computed and the variations of these new parameters are displayed in Figure 5. It was evident that changes in these new parameters of differently positioned leaves varied markedly among different growth stages after combining with DAS, although a reverse trend was observed in mFlav compared with the original Flav. The mNBI showed a similar trend as mChl with the growth stage.
3.4. Relationships between Dualex 4 Parameters and TLNC or PNC
All data acquired from the two study sites across growth stages were gathered together and divided into calibration and validation datasets to establish a general model for PNC estimation (Table 3).
The mean values of TLNC (23.08–23.59 g kg−1) were larger than those of PNC (19.91–20.61 g kg−1) in both datasets. For the calibration dataset, across all growth stages, the PNC was more variable (CV = 42%) than the TLNC (CV = 31%), and the validation dataset had similar variability as the calibration dataset with a CV of 44% for PNC and of 31% for TLNC.
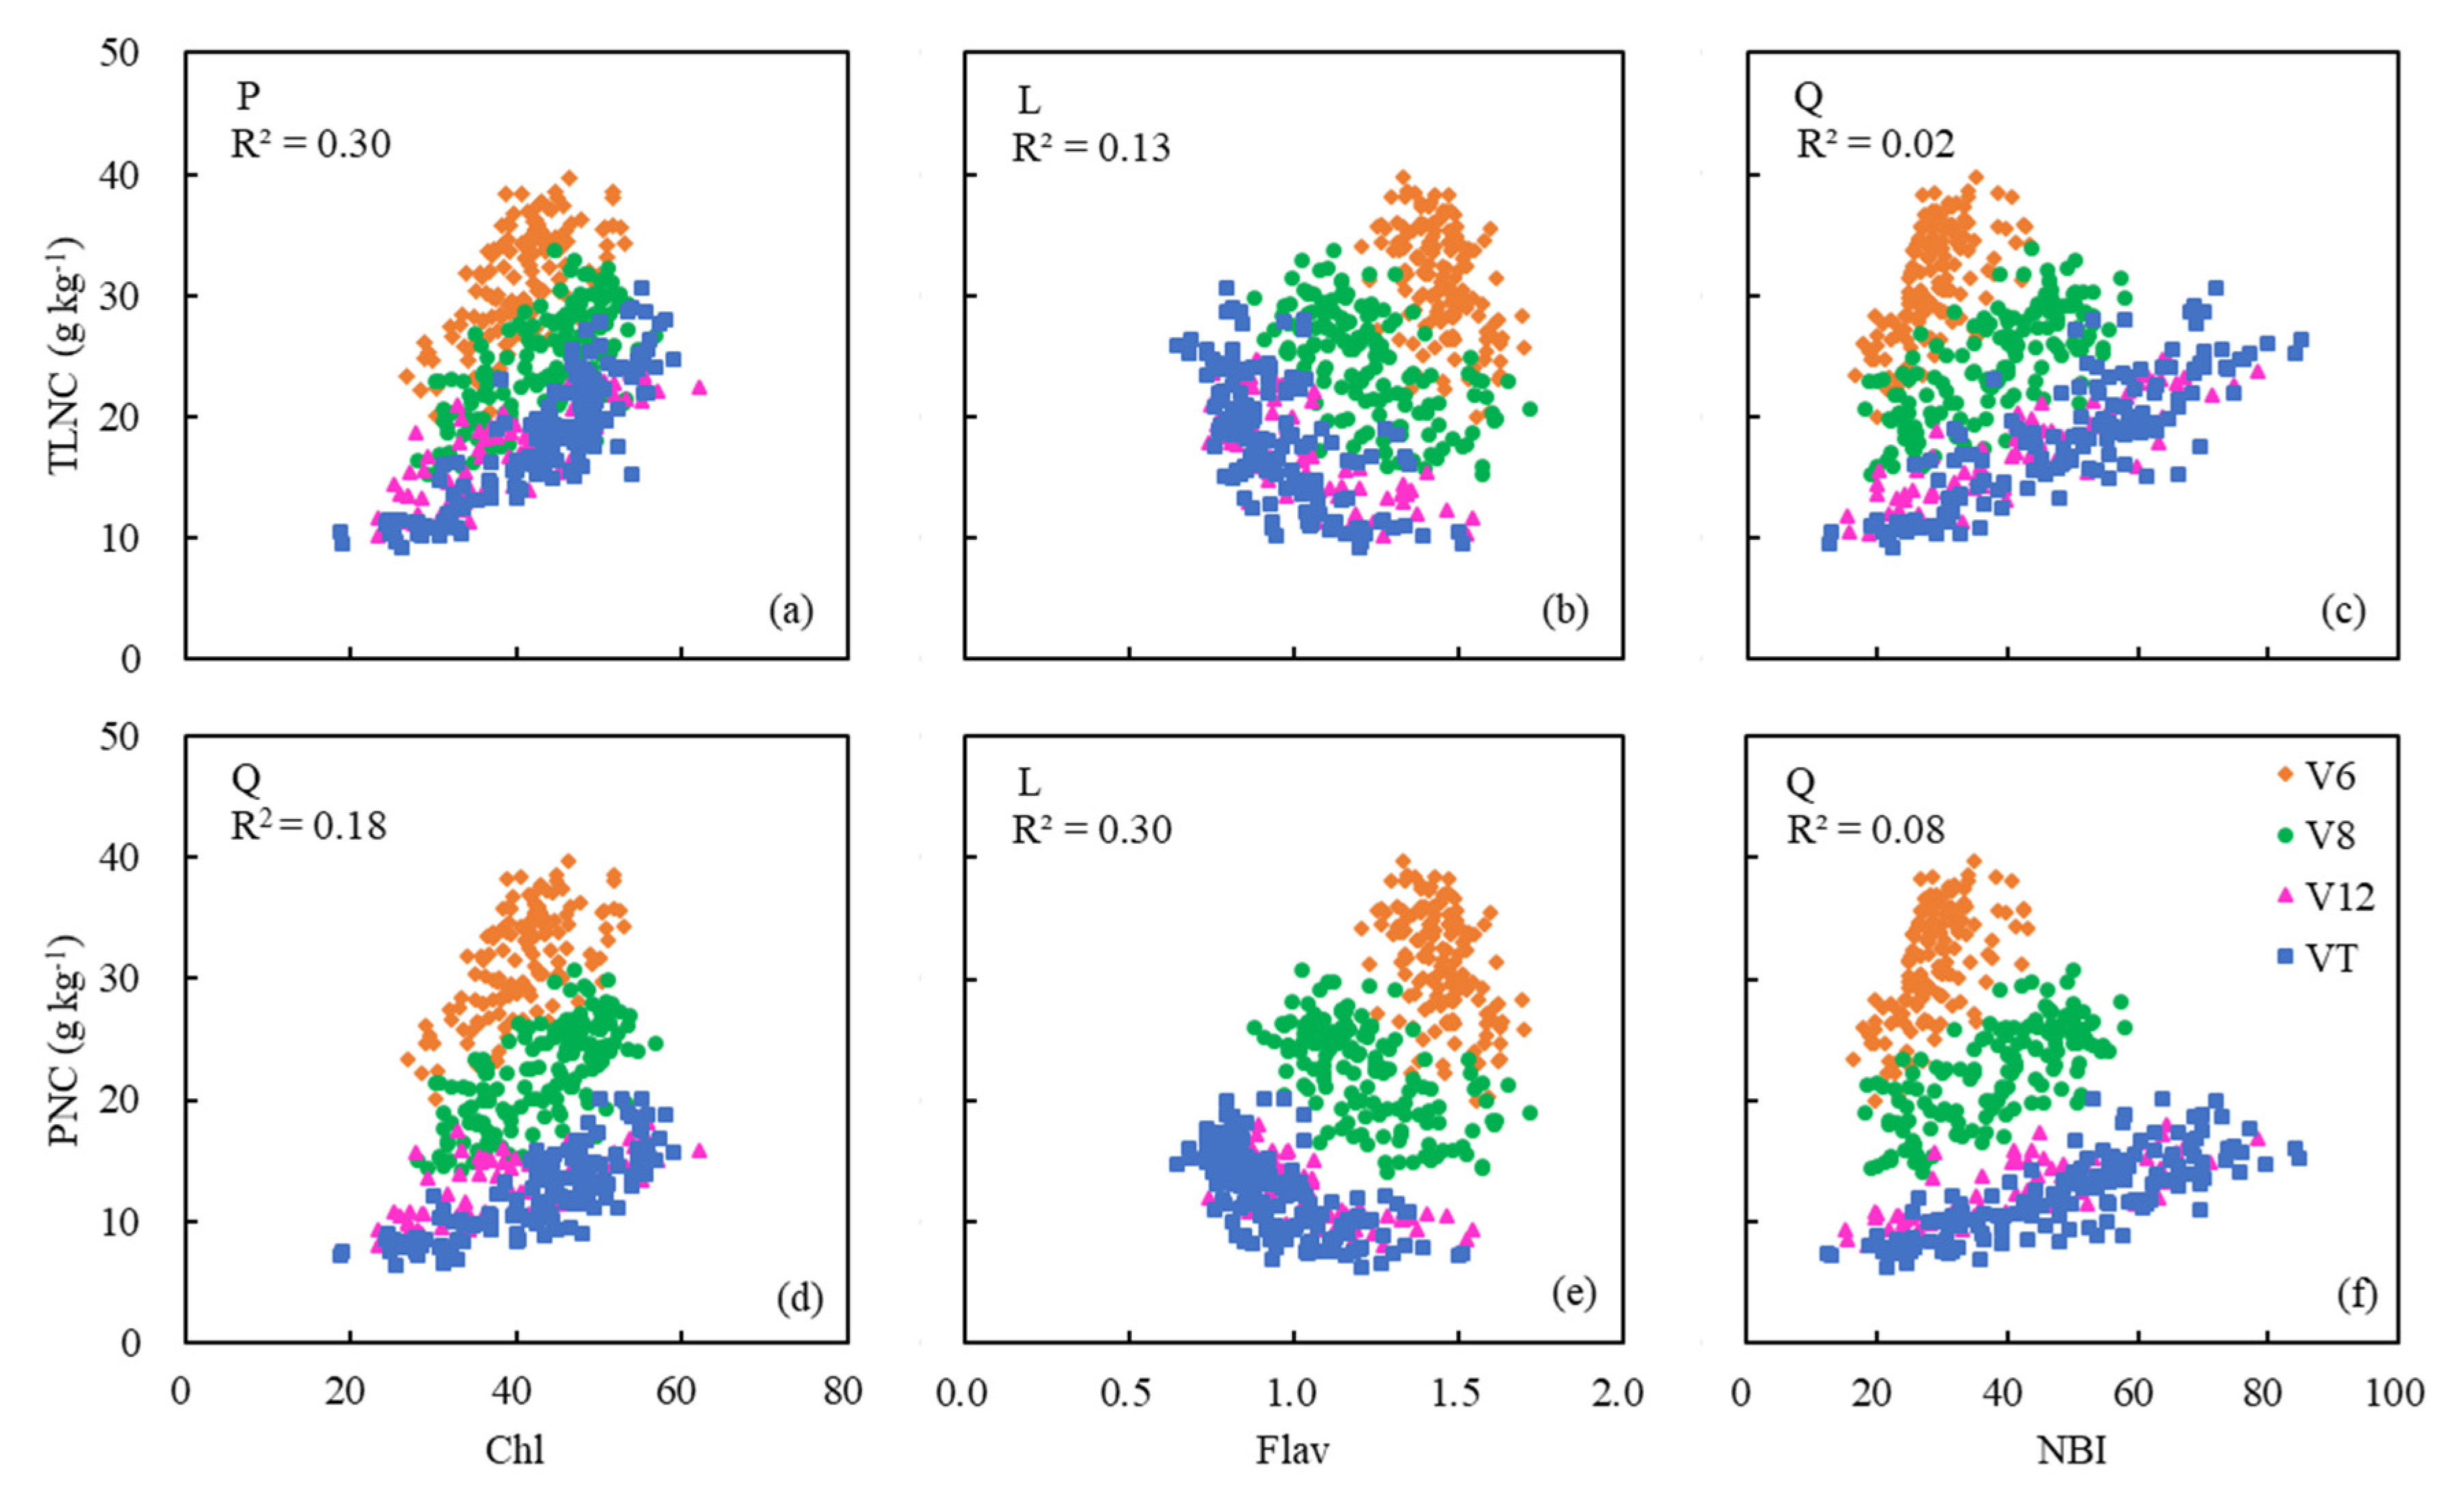
The original Dualex 4 readings, Chl, Flav, and NBI, demonstrated poor relationships with TLNC or PNC across growth stages, with R2 ranging from 0.01 to 0.34 (Table 4). The mean values of Chl, Flav, and NBI for the three differently positioned leaves were calculated and their relationships with TLNC and PNC at four growth stages are displayed in Figure 6. The impact of growth stages on these relationships were significant.
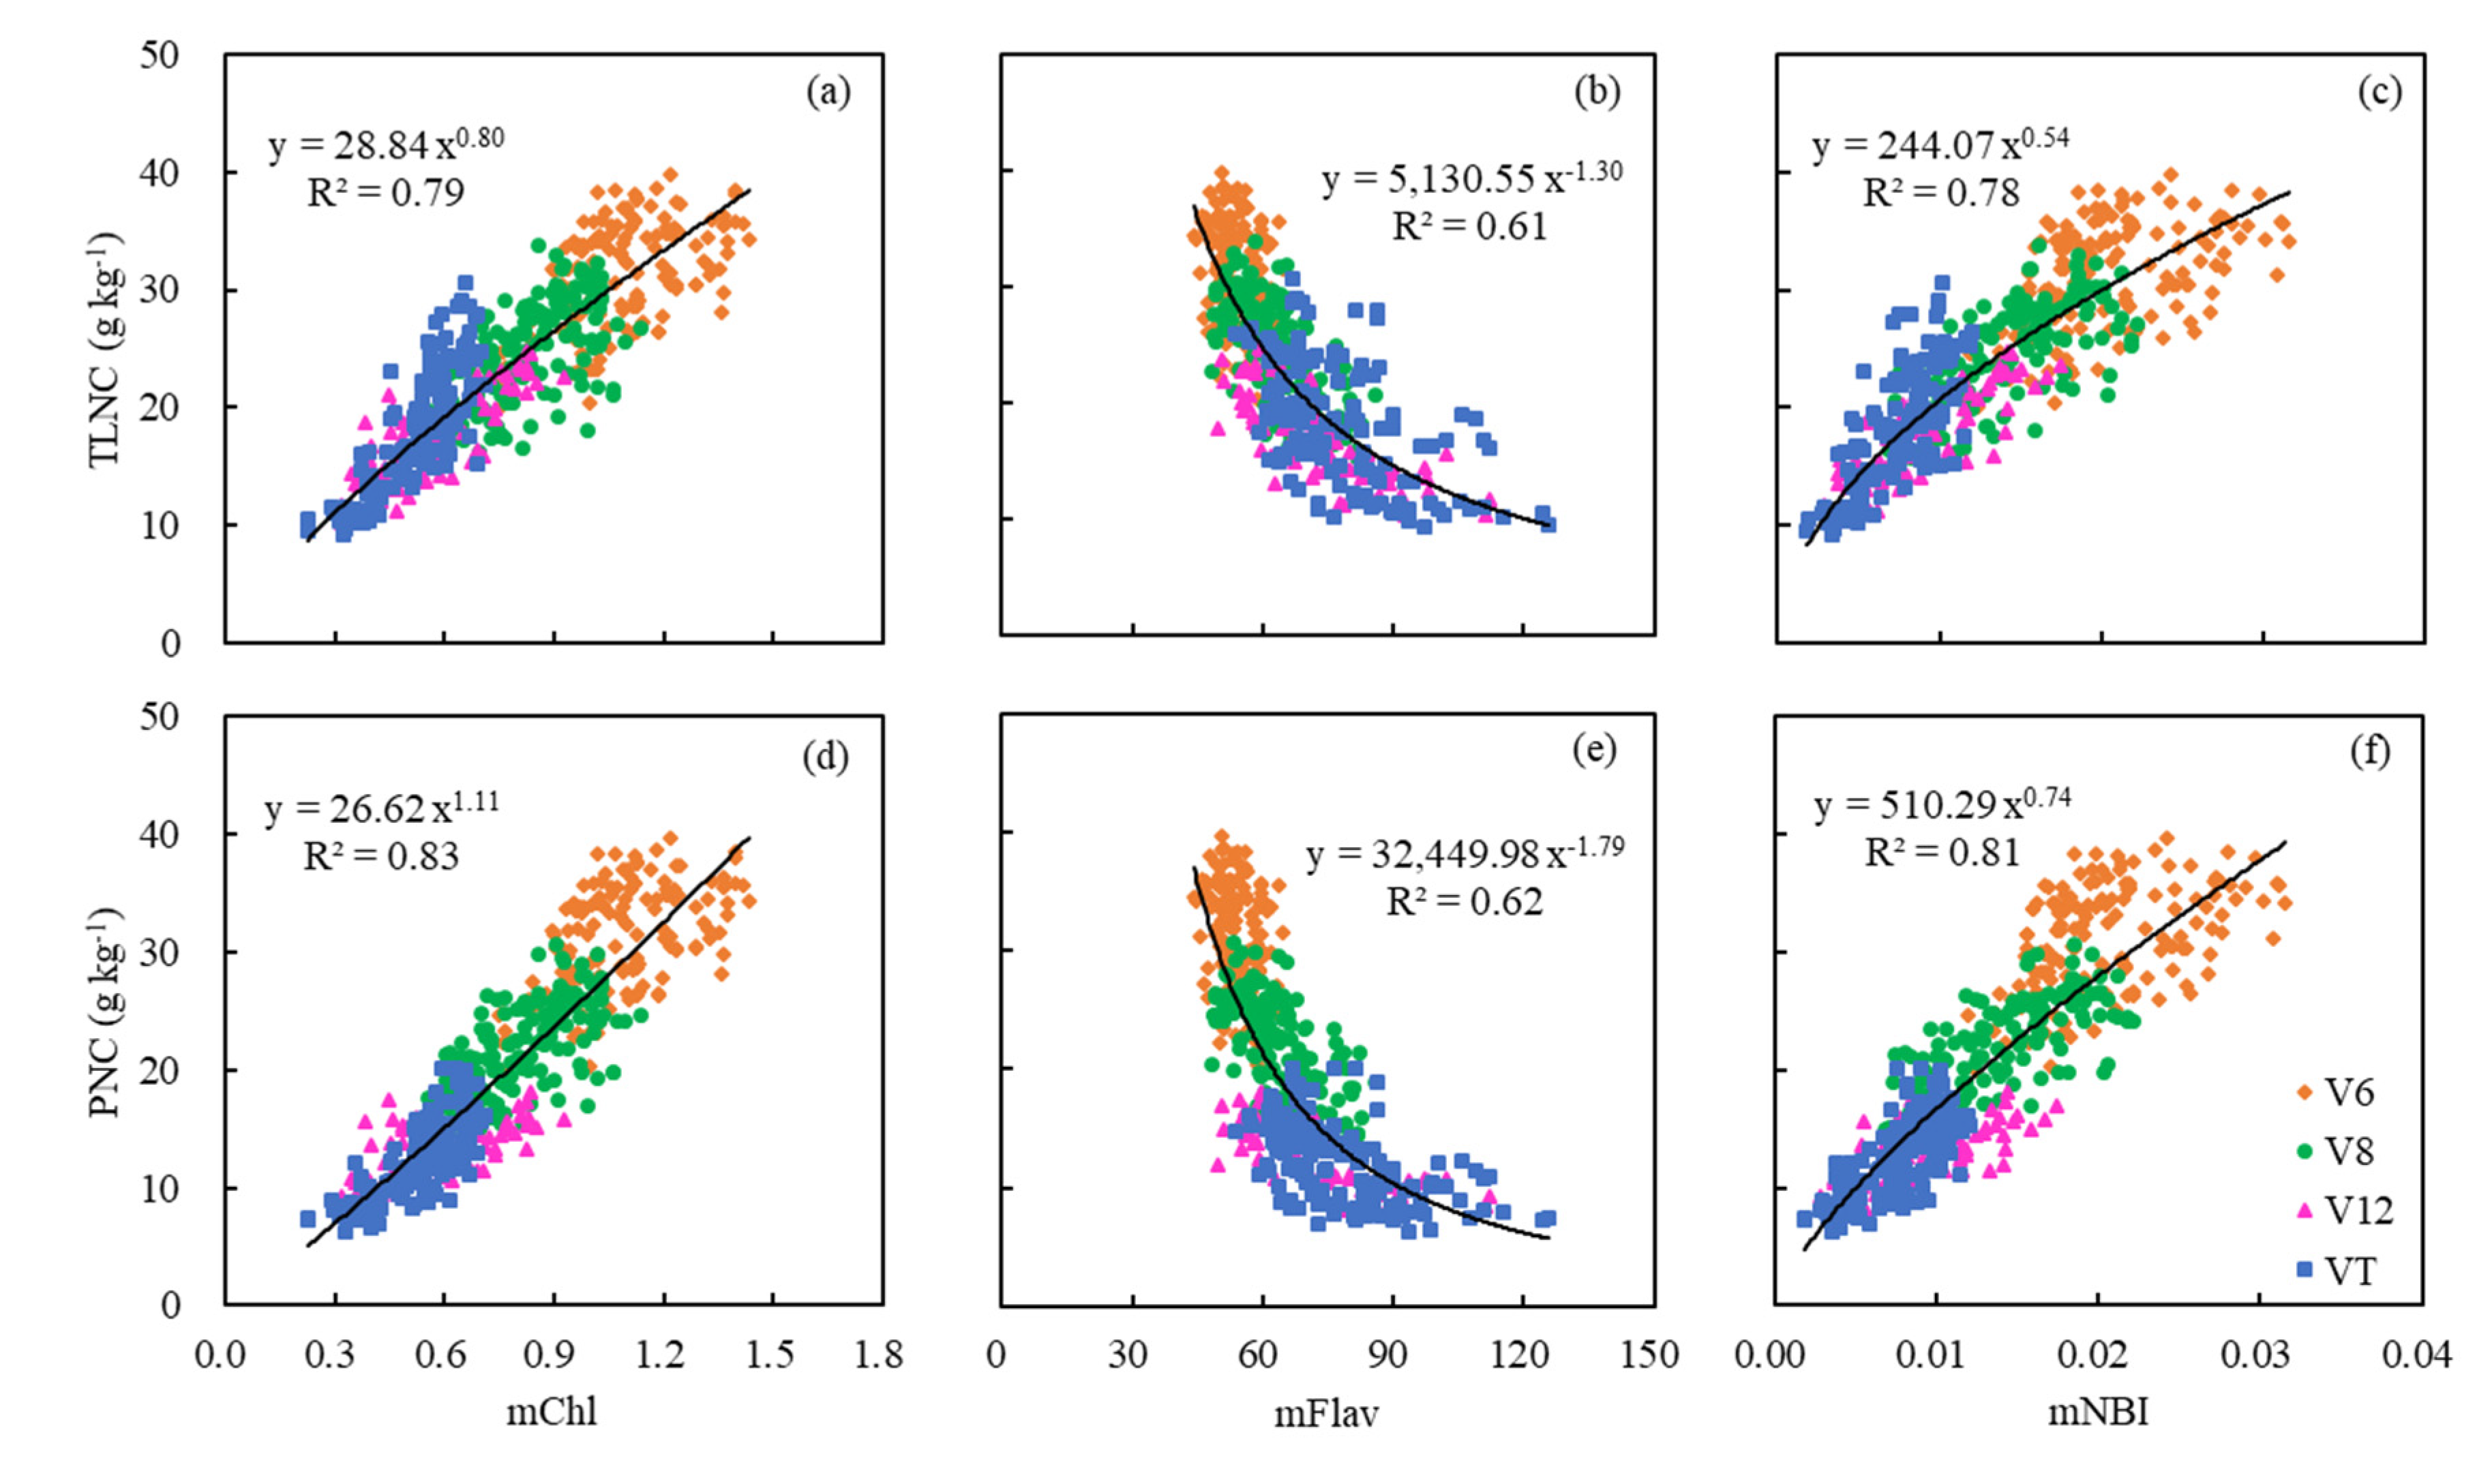
However, after combining with DAS, which was directly connected to the growth stage, the modified Dualex 4 parameters (mChl, mFlav, and mNBI) were highly related to TLNC and PNC (Table 4 and Figure 7). As maize grew, the values of mChl and mNBI decreased with the increase of TLNC and PNC (Figure 7a,c,d,f), while the values of mFlav increased with the growth stages and exhibited negative relationships with both TLNC and PNC accordingly (Figure 7b,e).
The mChl was most related to TLNC and PNC with R2 ranging from 0.75 to 0.84 for single-position leaves. mNBI also performed very well, with R2 ranging from 0.74 to 0.80. Nevertheless, the result for mFlav (R2 = 0.49–0.56) was not as good as the above-mentioned two parameters, but it was much better than that of the original Flav (Table 4). A power function relationship was found for the models established based on the values measured on every single leaf for mChl, mFlav, and mNBI. Leaf 1 showed the best potential to estimate PNC with the highest R2 values (Table 4). Moreover, by calculating the mean values of each parameter of the three leaves, the correlations between the modified Dualex 4 parameters and TLNC or PNC were improved to a certain extent, especially for mFlav (Figure 7b,e and Table 4). Compared with TLNC, PNC was more related to the modified Dualex 4 parameters (mChl, mFlav, and mNBI). This indicated that the modified Dualex 4 parameters had greater potential for direct estimation of PNC accurately (Figure 7 and Table 4).
3.5. The Estimation of PNC Using Different Modified Dualex 4 Parameters
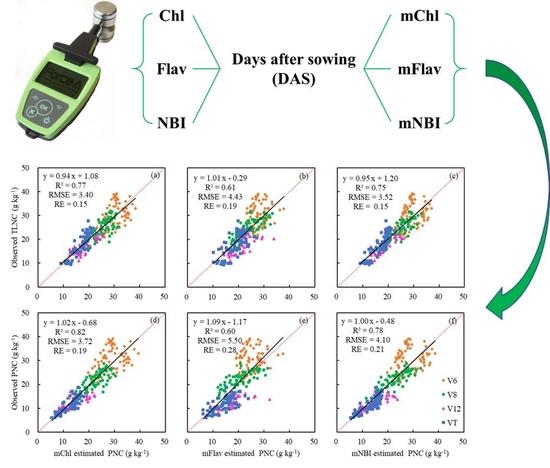
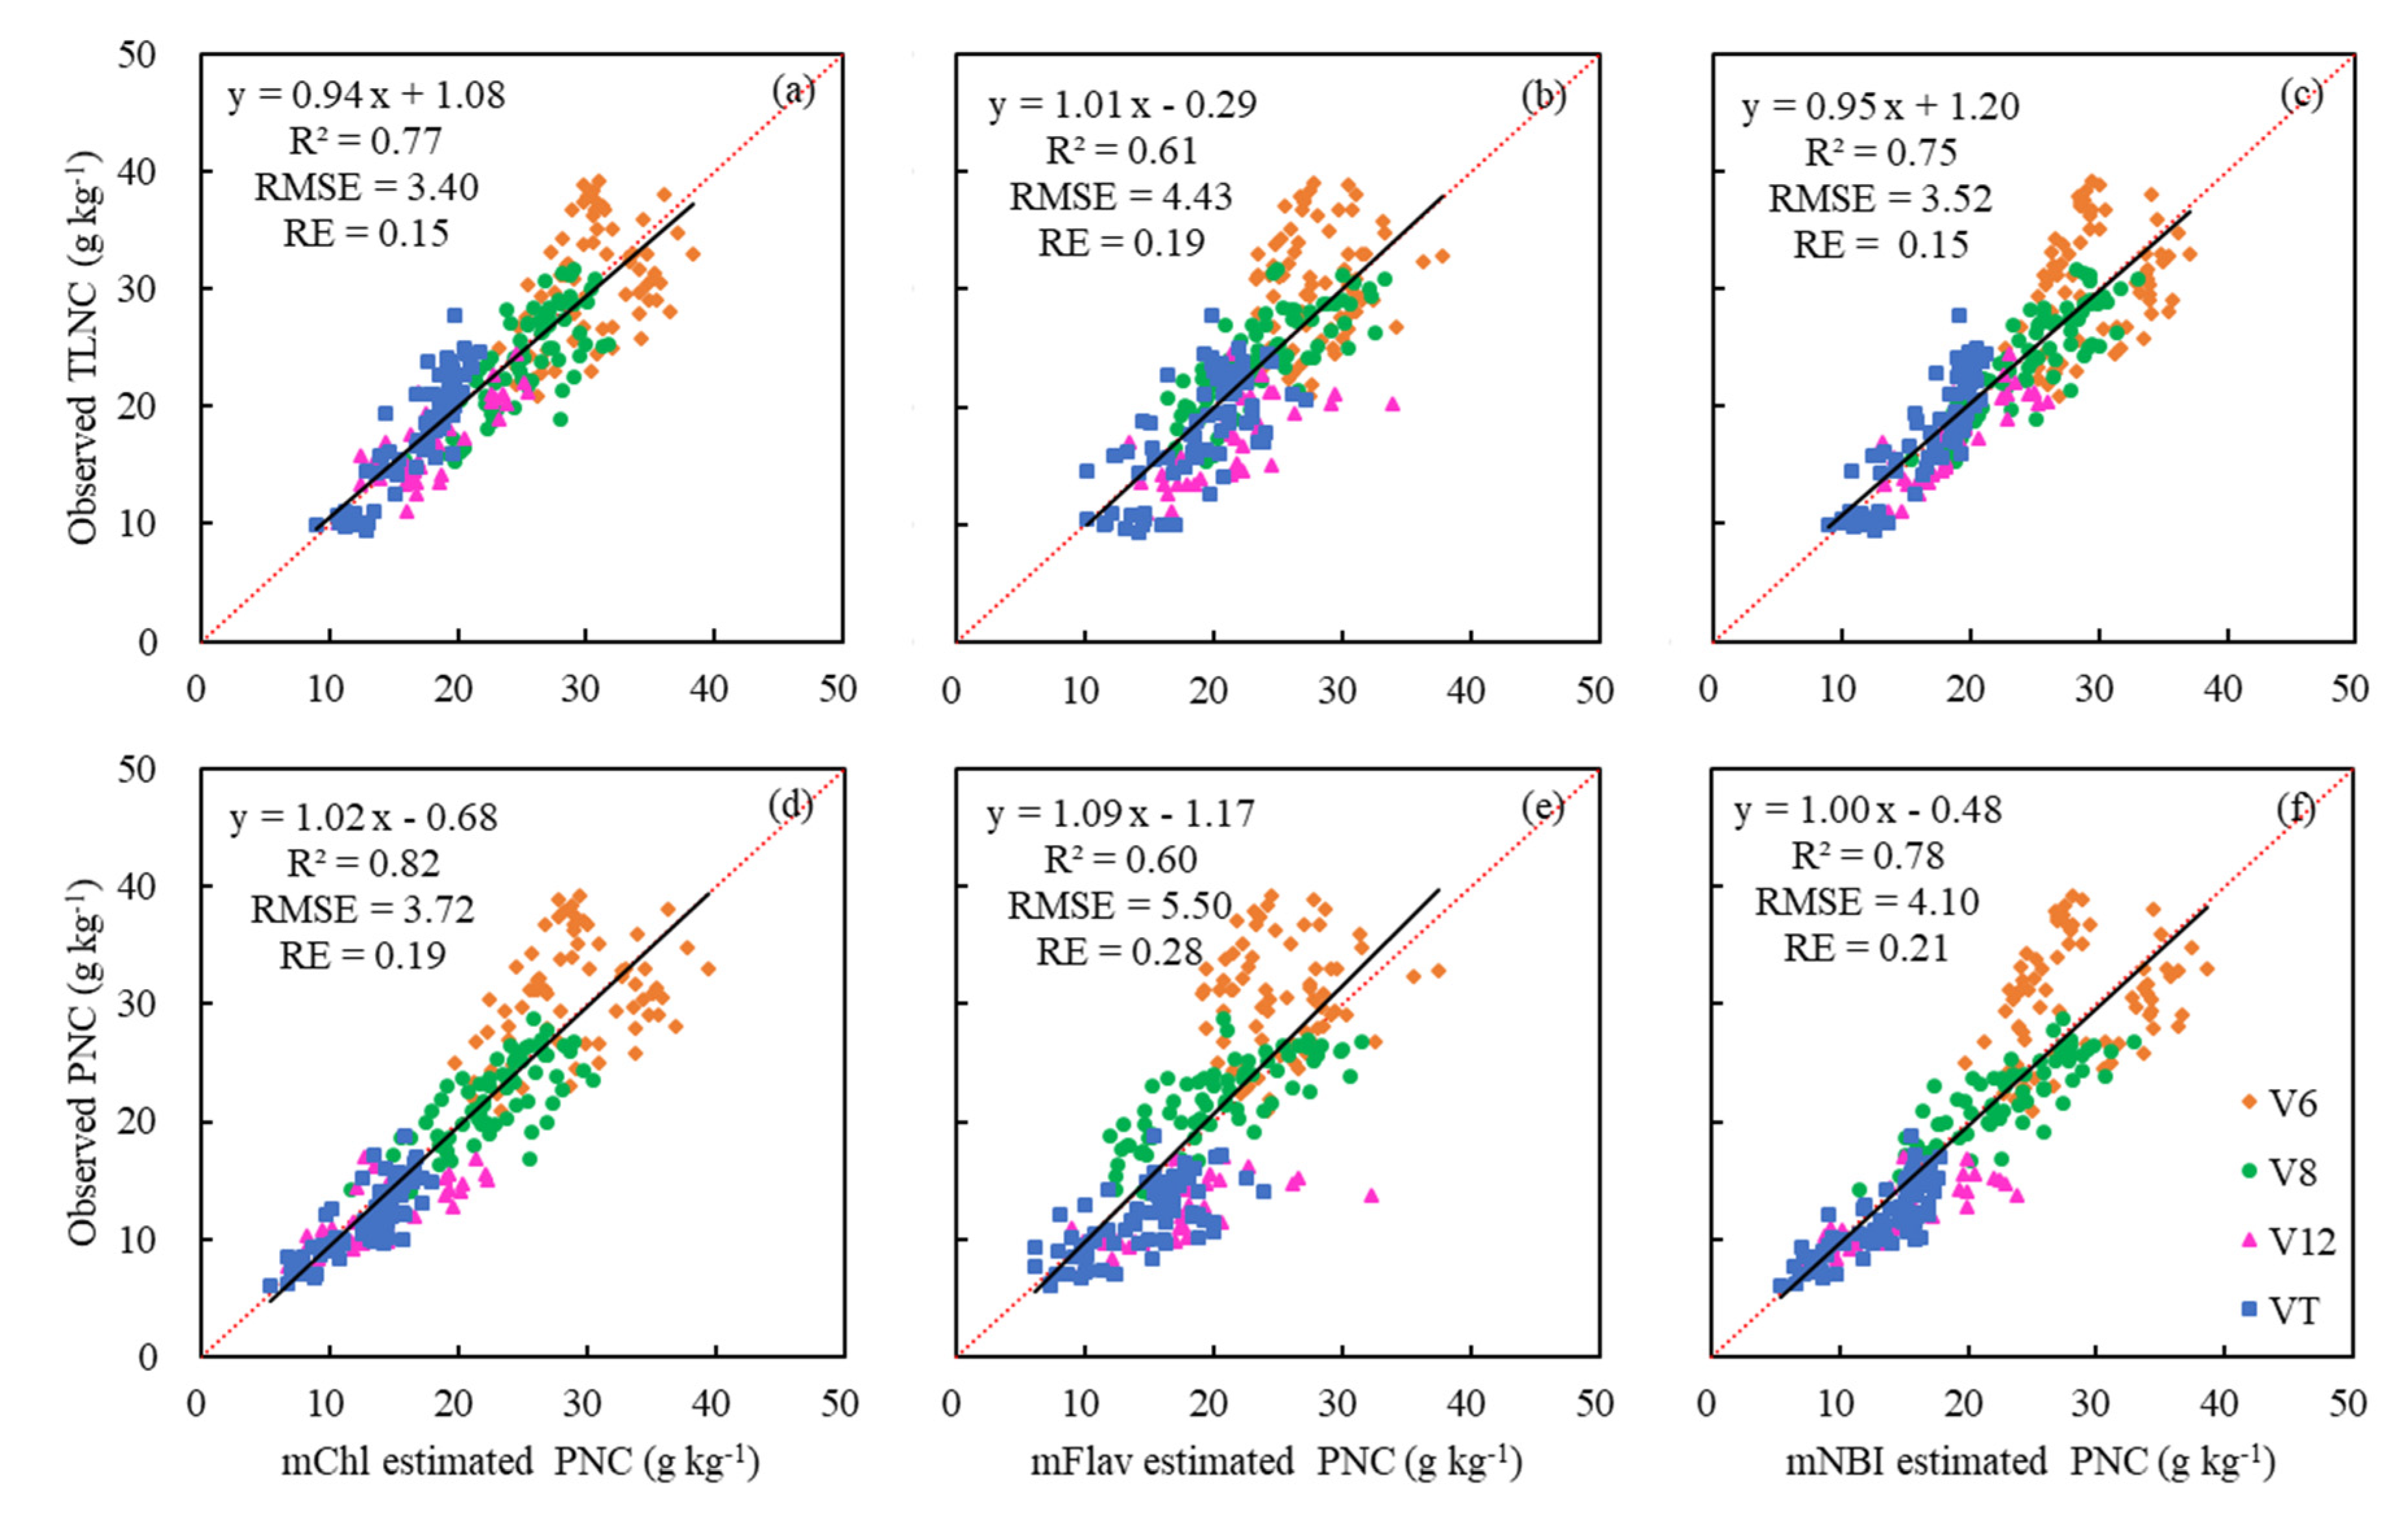
In order to establish good relationships between modified Dualex 4 parameters and PNC as well as TLNC, the above models describing their relationships were further evaluated with the validation dataset. The validation results of mChl for estimating TLNC and PNC were the best with the highest R2 (0.71–0.79 and 0.73–0.84) and the lowest RMSE (3.27–0.81 and 3.46–4.48) and RE (14%–16% and 17–23%) (Table 5). Although the mFlav showed a better relationship with TLNC and PNC than the original Flav, it still did not perform as well as the other two modified Dualex parameters in predicting TLNC and PNC, with the lowest R2 (0.42–0.53 and 0.40–0.53) and the highest RMSE (4.83–5.38 and 5.96–6.73) and RE (21%–23% and 30%–34%) (Table 5). For single leaf, mChl obtained from Leaf 1 predicted TLNC and PNC most accurately, while mFlav and mNBI obtained from Leaf 3 showed the highest accuracy among the three positioned leaves (Table 5). Besides, the results were further improved by averaging the mFlav and mNBI readings measured from three differently positioned leaves (Table 5 and Figure 8b,c,e,f). The data distribution for the V6 growth stage deviated from the 1:1 line more significantly than the other growth stages, which would influence the estimation results to some extent (Figure 8). Above all, the modified Dualex 4 parameters showed a better performance for direct PNC estimation across growth stages, but not for TLNC estimation, which implied that it was needless to estimate maize PNC by estimating TLNC using sensor readings acquired primarily from single leaves.
4. Discussion
4.1. Feasibility of Estimating Maize N Status Using Single Leaf-based Dualex 4 Parameters
The SLNC of the fully expanded three leaves selected in our study was linearly related to both TLNC and PNC, with high R2 values. Considering the good relationships between SLNC and TLNC and PNC (Figure 2), and the significant change trend of Dualex 4 parameters with the increase of N rate (Figure 3c and Figure 4c,f,i), this study verified that it would be possible to predict maize N status using the information from a single leaf of maize and be possible to predict PNC directly or indirectly by predicting TLNC first.
The Chl values elevated with an increasing N rate (Figure 4c), which conforms to the finding that leaf chlorophyll is strongly affected by leaf N [51,52,53]. Leaf N contributed a large proportion to plant photosynthesis [54]. However, as an indicator of epidermal flavonoids, a carbon-based secondary metabolite, Flav exhibited a reverse trend with the changes of N rate (Figure 4f) because the carbon-based metabolite would be produced under low N level and would consequently cause the enhanced synthesis of flavonoids [55,56]. As the ratio of Chl to Flav, NBI increased with N rate (Figure 4i) and has been considered to be a sensitive indicator of crop N status [13,28,44,57]. The results of this study indeed showed that the range of NBI variation was greater than that of Chl and Flav under different N rates (Figure 4c,f,i).
The Dualex 4 parameters’ good discrimination ability of different N rates and the saturation at high N levels (240 and 300 kg ha−1) (Figure 4) was in agreement with other studies using the fluorescence-based method [58]. The suggested optimal N rate for the experimental sites in our study was approximately 180–200 kg ha−1 [59], so the N rates of 240 and 300 kg ha−1 exceeded the optimal level. Some previous studies have concluded that fluorescence indices were insensitive to high crop N content in the range of optimal to excessive N levels [58,60]. In this study, as shown in Figure 3c, both TLNC and PNC varied clearly with the changes of N rate from 0 through 240 kg ha−1, but there was no significant difference between 240 and 300 kg ha−1 N rates. Thus, in this study, the saturation of Dualex 4 parameters on high N rates was closely related to the N status of maize, and we could not draw a similar conclusion that the fluorescence indices were insensitive to high N content here.
4.2. Main Factor(s) Affecting the Establishment of the General Model and the Best Parameter(s) for PNC Estimation
Compared with stems, leaves are more important for photosynthesis. However, maize plants grown in the Aeolian sandy soil field (Site 1) were much more vulnerable to water deficiency than maize plants grown in the Black soil field (Site 2). Due to the N accumulation in stems, the PNC obtained in the Aeolian sandy soil field increased when the N concentration of stems was taken into account. Therefore, the difference in PNC between the two fields vanished (Figure 3a). The significant variation observed in TLNC values but the similarity observed in PNC values in the two study sites (Figure 3a) implies that it may be more difficult to evaluate TLNC from different soil fields, and it would be more feasible to establish a PNC predicting model neglecting the effect of soil types. Nevertheless, it is necessary to distinguish soil types when estimating PNC indirectly by estimating TLNC first (Figure 4a,d,g).
The changes of TLNC or PNC as affected by growth stages (Figure 3b) have been verified in diverse crops in other studies [28,61,62]. This is why growth stages must be strictly defined and distinguished for N status evaluation in most studies. Thus, the growth stage plays an important role in establishing general models for PNC estimation according to the findings of this study.
Chl measured by Dualex 4 has been calibrated in μg cm−2 units [22], which means Chl is a proxy of surface-based N. However, the TLNC and PNC mentioned in this study were both calculated based on mass. The area-based LNC changes very little during the growing season due to the expression of area-based LNC forces changes in specific leaf areas [63]. The time we selected to conduct the sensing was before the reproductive phase, and there was no obvious redistribution of N from the leaves to the ears that would result in the significant reduction of LNC. Furthermore, the Dualex 4 only measures a green leaf surface area of 20 mm2 that would not exhibit too much variation of N concentration. Thus, the surface-based parameter Chl is relatively more stable than the mass-based TLNC and PNC (Figure 3b and Figure 4b).
Different from Chl, the epidermal Flav estimated by Dualex 4, which is the representative of total leaf Flav [27,64], is considered as a surrogate of dry leaf mass per area with no units [22]. Meyer et al. [23] reported the positive correlations between mass-based polyphenols (mainly Flav) and leaf mass per area for woody plants, which revealed the regularity of the decrease in Flav was caused by the increase in leaf dry mass. Thicker leaves had a larger leaf mass per area, and the accumulation of organic matter in leaves played the role of Flav dilution. In addition, a previous study has reported that the accumulation of Flav was highly sensitive to light intensity [65]. As the maize grows, the leaf area and canopy closure of the uppermost leaves gradually increase, resulting in increased degree of shading. This may limit the expression of Flav synthetic genes and lead to a reduction in flavonoid content in these leaves during later growth stages. More studies are still needed on the periodic changes of Flav.
As the ratio of Chl to Flav, NBI is equivalent to mass-based Chl (Chl g−1 dry mass). Since Chl is relatively stable and Flav showed a downward trend as the maize grew, it is easy to understand the reverse trend of NBI to Flav (Figure 4h). The inconsistent relationships between the original Dualex 4 parameters (Chl, Flav, and NBI) and TLNC or PNC at different growth stages led to poor model performance across the growth stages (Table 4 and Figure 6). This makes the original Dualex 4 parameters unfeasible for estimating TLNC and PNC across growth stages.
Varvel et al. [46] pointed out that it is effective to evaluate crop N status by calculating growing degree days (GDD) when a specific growth stage cannot be determined. Following the idea of Teal et al. [66], who predicted maize yield using normalized difference vegetation index (NDVI) and GDD, DAS was used together with Dualex 4 parameters in this study to explore the potential of real-time PNC estimation across growth stages. The results of this study indicated the relationships between the DAS-based modified Dualex 4 parameters and TLNC and PNC across growth stages were significantly improved and were simulated by power function models. Furthermore, this study revealed a stronger relationship between the modified parameters and PNC than TLNC. In addition, the good relations between SLNC and PNC implied that PNC could be directly estimated well using a leaf sensor instead of indirect estimation through TLNC (Table 5 and Figure 8). This indicates the great potential of leaf-based Dualex 4 for assessing plant N status, not just maize leaf N status.
It has been reported that polyphenols (Phen, including Flav) may be a more specific indicator of crop N status than Chl because of the sensitivity of Chl to sulfur stress [67]. Padilla et al. [58] demonstrated the strong linear relationships between Flav, measured by a Multiplex sensor, and cucumber (Cucumis sativus ‘Strategos’) N concentration (R2 = 0.87–0.95). Besides, some studies pointed out the superiority of NBI (or Chl/Phen) in N status estimation in a variety of crops, including maize [28,29,31,44,48,57,68]. However, mChl (Chl) performed best while mFlav (Flav) performed worst in this study.
The relatively poor performance of mFlav indicated the difficulty of estimating PNC accurately using Flav, while the difficulty for estimating Phen in leaves has been attributed to different solubility, distribution locations, and species varieties [23]. Flav has previously been shown to perform well in N status estimation for other crops such as vegetable, rice, and sweet cherry (Prunus avium L.) [49,52,68,69]. However, the relatively thick maize leaves could affect the transmittance of the light emitted by the sensor and then lead to the change of the parameter [22]. Measurements taken from both the adaxial (top) and abaxial (bottom) sides of the leaves may help improve maize PNC estimation by Flav, although the flavonoid contents in the adaxial and abaxial sides of the leaves are highly correlated in some crops [27,57]. Moreover, the change of Flav content is influenced by various factors in addition to N such as leaf thickness, light condition, water stress, pathogen attack, low temperature, and the onset of senescence [17,30,65,70]. Although affected by the poor performance of mFlav, the estimation results of mNBI-based models showed similar R2 values with mChl, indicating the good performance of NBI for N indices estimation. These results conform to the findings of some previous studies [27,28,29,31,44,49,57].
4.3. The Most Suitable Leaf Position for Sensing Measurements and PNC Estimation
We tested three differently positioned leaves at each growth stage in this study in order to understand their effects on evaluating maize N status. The changes of the Dualex 4-based parameters with leaf positions were relatively smaller than that with the growth stage and N rate. Nevertheless, there were slight differences among the three leaves, which consequently displayed different performance in PNC prediction.
It was noted that leaf Chl and Flav contents depended on leaf age (leaf position) induced by light conditions [71,72]. The photosynthetic photon flux density would decrease with increasing canopy depth during crop growth and canopy development [73]. The priority supplement of N in younger leaves (upper leaves) re-translocated from older leaves (lower leaves) leads to the preferential distribution of N to the upper leaves [74] and consequently leads to higher rates of canopy photosynthesis, which needs a higher content of Chl. The finding of higher Chl values in Leaf 1 (the uppermost leaf) than in Leaf 3 (the lowest leaf) was similar to the study results for rice [74,75]. Higher Flav contents in older leaves have been reported [71,76,77], similar to the results of this study. Besides, the decrease of leaf mass per area along with leaf thickness as leaf position declines, the limited sunlight in the lower leaves mentioned above caused the change of Flav with the leaf position. However, there was a slightly increasing tendency of Chl measurement in Leaf 2, which may be caused by the close locations of the three leaves. As the uppermost leaf (Leaf 1) was newly expanded soon after Leaf 2, the N concentration of these two leaves would not differ too much. In addition, the average values used in this analysis may help reduce some variations. The Flav is an N-free compound, so its continuous change with leaf positions was more distinct.
To diagnose crop N status quickly and effectively, the test frequency of a leaf sensor must be reduced. Thus, selecting the most appropriate leaf rather than several leaves of a plant for sensing measurement with high accuracy and reliability is important. The measurements taken from Leaf 1 for all three modified Dualex parameters provided the highest model R2 in TLNC and PNC predictions. The best performance of mFlav appeared in Leaf 3 in PNC estimation, and the mean values of three leaves improved the results significantly, but the results were not as good as the other two parameters. For mNBI, although the best result appeared in Leaf 3 too, it did not show a significant superiority over the results of the other two leaves. Thus, in conclusion, the measurement of Leaf 1 may be sufficient to estimate maize N status using Dualex 4-based mChl and mNBI whereas Leaf 3 is preferred to accurately estimate PNC using mFlav.
4.4. Implications for Practical Application and Future Research Needs
This study found that combining with DAS, the Dualex 4 leaf fluorescence sensor could be used to reliably estimate maize PNC across growth stages, even if only one leaf (uppermost) was sampled. The estimated PNC can then be compared with threshold or critical PNC values to diagnose maize N status by calculating N nutrition index (NNI) [41]. For this purpose, maize aboveground biomass will be needed and can be reliably estimated using active canopy sensors, like GreenSeeker or Crop Circle sensors [41,78]. Research is needed to develop methods to use Dualex 4 sensor to estimate NNI directly, as demonstrated for SPAD chlorophyll meter [79]. Based on the relationship between SPAD chlorophyll meter readings and PNC and the critical N concentration curve for maize, Yang et al. [80] established the critical or optimal chlorophyll meter (SPAD) reading curve. Measured chlorophyll meter readings can then be compared with critical chlorophyll meter readings at specific biomass to calculate NNI, without the need to estimate PNC. This is an innovative idea and should be tested with the Dualex sensor.
The relationship between leaf and canopy fluorescence parameters could be further investigated through the use of a simple model taking into account leaf fluorescence profile inside the canopy, structural variations of the canopy, and background reflection [81]. Such information can be useful to evaluate the possibility to use the proposed method in conjunction with remote sensing fluorescence measurements obtained from an unmanned aerial vehicle (UAV) [82], aerial or satellite remote sensing [83,84].
In theory, NBI combining both Chl and Flav should be more sensitive to crop N status than using Chl or Flav alone, as found by previous research [28,29,31,44,48,57,68]. However, NBI did not perform better than Chl in this study. Those previous studies either used an earlier model of Dualex sensor (cannot measure Chl) and chlorophyll meter to calculate NBI or used canopy fluorescence sensor Multiplex or studied other crops. Therefore, more studies are needed to confirm our results with maize and further evaluate the potential of improving corn N status diagnosis using both Chl and Flav information, as well as other related soil, weather, and management data.
5. Conclusions
This study demonstrated the reliability of maize PNC estimation by fluorescence parameters obtained from single leaves using a leaf sensor Dualex 4. The fluorescence parameter values did not exhibit significant variability under the two different soil conditions, which indicated the needlessness of establishing a soil-specific predicting model in this study, while the variations between the PNC and Dualex 4 parameters at different growth stages make it difficult to estimate PNC across all growth stages using the original Dualex 4 parameters. Nevertheless, the modified Dualex 4 parameters using the information of DAS overcame the problem caused by growth stage changes and allowed accurate estimation of PNC using a general model across growth stages. Among the three parameters obtained by Dualex 4, mChl and mNBI were more reliable indicators for PNC estimation. It was sufficient to take the fluorescence measurement from the uppermost leaf of maize. Further research needs to focus on improving the accuracy of PNC estimation in early growth stages and practical methods for maize N status diagnosis using proximal leaf fluorescence sensors.
Author Contributions
Y.M. and H.L. designed the experiment. R.D. conducted the experiment, performed the analysis, and wrote the original paper, X.W., Z.C., and W.Z. assisted in the experiment, plant and soil sampling, and sample processing. Y.M. and F.Y. reviewed and revised the manuscript. All authors have read and agreed to the published version of the manuscript.
Funding
This research was funded by the Key National Research and Development Program (2016YFD0200600; 2016YFD0200602), Norwegian Ministry of Foreign Affairs (SINOGRAIN II, CHN-17/0019), the Internationalization Training and Promotion Project of Graduate Students in China Agricultural University, and the UK Biotechnology and Biological Sciences Research Council (BB/P004555/1).
Acknowledgments
We would like to thank Guohua Mi, Zheng Fang, Xuezhi Yue, and Hainie Zha for their assistance during this study. We also would like to thank the local farmers for their cooperation in this research.
Conflicts of Interest
The authors declare no conflict of interest.
References
- FAO. Cultured Aquatic Species Information Programme, Epinephelus Coioides. Available online: http://www.fao.org (accessed on 28 June 2019).
- Gu, B.; Ju, X.; Wu, Y.; Erisman, J.W.; Bleeker, A.; Reis, S.; Smith, R.I. Cleaning up nitrogen pollution may reduce future carbon sinks. Glob. Environ. Chang. 2018, 48, 56–66. [Google Scholar] [CrossRef] [Green Version]
- Zhang, F.; Chen, X.; Vitousek, P. An experiment for the world. Nature 2013, 497, 33–35. [Google Scholar] [CrossRef] [PubMed]
- Jin, Z.; Archontoulis, S.V.; Lobell, D.B. How much will precision nitrogen management pay off? An evaluation based on simulating thousands of corn fields over the US corn-belt. Field Crop. Res. 2019, 240, 12–22. [Google Scholar] [CrossRef]
- Wang, X.; Miao, Y.; Dong, R.; Chen, Z.; Guan, Y.; Yue, X.; Fang, Z.; Mulla, D.J. Developing active canopy sensor-based precision nitrogen management strategies for corn in Northeast China. Sustainability 2019, 11, 706. [Google Scholar]
- Kyveryga, P.M.; Blackmer, A.M.; Zhang, J. Characterizing and classifying variability in corn yield response to nitrogen fertilization on subfield and field scales. Agron. J. 2009, 101, 269–277. [Google Scholar] [CrossRef]
- Muñoz-Huerta, R.F.; Guevara-Gonzalez, R.G.; Contreras-Medina, L.M.; Torres-Pacheco, I.; Prado-Olivarez, J.; Ocampo-Velazquez, R.V. A review of methods for sensing the nitrogen status in plants: Advantages, disadvantages and recent advances. Sensors 2013, 13, 10823–10843. [Google Scholar] [CrossRef] [PubMed]
- Corti, M.; Cavalli, D.; Cabassi, G.; Gallina, P.M.; Bechini, L. Does remote and proximal optical sensing successfully estimate maize variables? A review. Eur. J. Agron. 2018, 99, 37–50. [Google Scholar] [CrossRef]
- Pinter, P.J.; Hatfield, J.L.; Schepers, J.S.; Barnes, E.M.; Moran, M.S.; Daughtry, C.S.T.; Upchurch, D.R. Remote sensing for crop management. Photogramm. Eng. Remote. Sens. 2003, 69, 647–664. [Google Scholar] [CrossRef] [Green Version]
- Mulla, D.J. Twenty-five years of remote sensing in precision agriculture: Key advances and remaining knowledge gaps. Biosyst. Eng. 2013, 114, 358–371. [Google Scholar] [CrossRef]
- Nigon, T.J.; Mulla, D.J.; Rosen, C.J.; Cohen, Y.; Alchanatis, V.; Rud, R. Evaluation of the nitrogen sufficiency index for use with high resolution, broadband aerial imagery in a commercial potato field. Precis. Agric. 2014, 15, 202–226. [Google Scholar] [CrossRef]
- Delloye, C.; Weiss, M.; Defourny, P. Retrieval of the canopy chlorophyll content from Sentinel-2 spectral bands to estimate nitrogen uptake in intensive winter wheat cropping systems. Remote. Sens. Environ. 2018, 216, 245–261. [Google Scholar] [CrossRef]
- Tremblay, N.; Wang, Z.; Cerovic, Z.G. Sensing crop nitrogen status with fluorescence indicators. A review. Agron. Sustain. Dev. 2012, 32, 451–464. [Google Scholar] [CrossRef] [Green Version]
- Kovács, P.; Vyn, T.J. Relationships between ear-leaf nutrient concentrations at silking and corn biomass and grain yields at maturity. Agron. J. 2017, 109, 2898–2906. [Google Scholar] [CrossRef] [Green Version]
- Gaju, O.; Allard, V.; Martre, P.; Le Gouis, J.; Moreau, D.; Bogard, M.; Hubbart, S.; Foulkes, M.J. Nitrogen partitioning and remobilization in relation to leaf senescence, grain yield and grain nitrogen concentration in wheat cultivars. Field Crop Res. 2014, 155, 213–223. [Google Scholar] [CrossRef]
- Isfan, D.; Zizka, J.; D’Avignon, A.; Deschênes, M. Relationships between nitrogen rate, plant nitrogen concentration, yield and residual soil nitrate-nitrogen in silage corn. Commun. Soil Sci. Plant Anal. 1995, 26, 2531–2557. [Google Scholar] [CrossRef]
- Cerovic, Z.G.; Ghozlen, N.B.; Milhade, C.; Obert, M.; Debuisson, S.; Moigne, M.L. Nondestructive diagnostic test for nitrogen nutrition of grapevine (Vitis vinifera L.) based on Dualex leaf-clip measurements in the field. J. Agric. Food Chem. 2015, 63, 3669–3680. [Google Scholar] [CrossRef] [PubMed]
- Duan, D.; Zhao, C.; Li, Z.; Yang, G.; Yang, W. Estimating total leaf nitrogen concentration in winter wheat by canopy hyperspectral data and nitrogen vertical distribution. J. Integr. Agric. 2019, 18, 1562–1570. [Google Scholar] [CrossRef]
- Huang, S.; Miao, Y.; Zhao, G.; Yuan, F.; Ma, B.; Tan, C.; Yu, W.; Gnyp, M.L.; Lenz-Wiedemann, V.I.S.; Rascher, U.; et al. Satellite remote sensing-based in-season diagnosis of rice nitrogen status in Northeast China. Remote Sens. 2015, 7, 10646–10667. [Google Scholar] [CrossRef] [Green Version]
- Longchamps, L.; Khosla, R. Early detection of nitrogen variability in corn using fluorescence. Agron. J. 2014, 106, 511–518. [Google Scholar] [CrossRef]
- Heege, H.J.; Reusch, S.; Thiessen, E. Prospects and results for optical systems for site-specific on-the-go control of nitrogen-top-dressing in Germany. Precis. Agric. 2008, 9, 115–131. [Google Scholar] [CrossRef]
- Cerovic, Z.G.; Masdoumier, G.; Ghozlen, N.B.; Latouche, G. A new optical leaf-clip meter for simultaneous non-destructive assessment of leaf chlorophyll and epidermal flavonoids. Physiol. Plant. 2012, 146, 251–260. [Google Scholar] [CrossRef] [PubMed]
- Meyer, S.; Cerovic, Z.G.; Goulas, Y.; Montpied, P.; Demotes-Mainard, S.; Bidel, L.P.; Moya, I.; Dreyer, E. Relationships between optically assessed polyphenols and chlorophyll contents, and leaf mass per area ratio in woody plants: A signature of the carbon-nitrogen balance within leaves? Plant Cell Environ. 2006, 29, 1338–1348. [Google Scholar] [CrossRef] [PubMed]
- Cerovic, Z.G.; Ounis, A.; Cartelat, A.; Latouche, G.; Khosla, R. The use of chlorophyll fluorescence excitation spectra for the non-destructive in situ assessment of UV-absorbing compounds in leaves. Plant Cell Environ. 2002, 25, 1663–1676. [Google Scholar] [CrossRef]
- Barnes, P.W.; Searles, P.S.; Ballaré, C.L.; Ryel, R.J.; Caldwell, M.M. Non-invasive measurements of leaf epidermal transmittance of UV radiation using chlorophyll fluorescence: Field and laboratory studies. Physiol. Plant. 2000, 109, 274–283. [Google Scholar] [CrossRef]
- Dong, T.; Shang, J.; Chen, J.; Liu, J.; Qian, B.; Ma, B.; Morrison, M.J.; Zhang, C.; Liu, Y.; Shi, Y.; et al. Assessment of portable chlorophyll meters for measuring crop leaf chlorophyll concentration. Remote Sens. 2019, 11, 2706. [Google Scholar] [CrossRef] [Green Version]
- Cartelat, A.; Cerovic, Z.G.; Goulas, Y.; Meyer, S.; Lelarge, C.; Prioul, J.L.; Barbottin, A.; Jeuffroy, M.H.; Gate, P.; Agati, G.; et al. Optically assessed contents of leaf polyphenolics and chlorophyll as indicators of nitrogen deficiency in wheat (Triticum aestivum L.). Field Crop Res. 2005, 91, 35–49. [Google Scholar] [CrossRef]
- Padilla, F.M.; Peña-Fleitas, M.T.; Gallardo, M.; Thompson, R.B. Evaluation of optical sensor measurements of canopy reflectance and of leaf flavonols and chlorophyll contents to assess crop nitrogen status of muskmelon. Eur. J. Agron. 2014, 58, 39–52. [Google Scholar] [CrossRef]
- Tremblay, N.; Wang, Z.; Bélec, C. Evaluation of the Dualex for the assessment of corn nitrogen status. J. Plant Nutr. 2007, 30, 1355–1369. [Google Scholar] [CrossRef]
- Goulas, Y.; Cerovic, Z.G.; Cartelat, A.; Moya, I. Dualex: A new instrument for field measurements of epidermal ultraviolet absorbance by chlorophyll fluorescence. Appl. Opt. 2004, 43, 4488–4496. [Google Scholar] [CrossRef]
- Tremblay, N.; Wang, Z.; Bélec, C. Performance of Dualex in spring wheat for crop nitrogen status assessment, yield prediction and estimation of soil nitrate content. J. Plant Nutr. 2009, 33, 57–70. [Google Scholar] [CrossRef]
- Apostol, S.; Viau, A.A.; Tremblay, N.; Briantais, J.-M.; Prasher, S.; Parent, L.-E.; Moya, I. Laser-induced fluorescence signatures as a tool for remote monitoring of water and nitrogen stresses in plants. Can. J. Remote Sens. 2003, 29, 57–65. [Google Scholar] [CrossRef]
- Xu, J.; Cai, H.; Wang, X.; Ma, C.; Lu, Y.; Ding, Y.; Wang, X.; Chen, H.; Wang, Y.; Saddique, Q. Exploring optimal irrigation and nitrogen fertilization in a winter wheat-summer maize rotation system for improving crop yield and reducing water and nitrogen leaching. Agric. Water. Manage. 2020, 228, 105904. [Google Scholar] [CrossRef]
- Carolina, S.P.; Crossa, J.L.; Bonnett, D.; Yamaguchi-Shinozaki, K.; Reynolds, M.P. Phenotyping transgenic wheat for drought resistance. J. Exp. Bot. 2012, 63, 1799–1808. [Google Scholar] [CrossRef] [Green Version]
- Scharf, P.C.; Kitchen, N.R.; Sudduth, K.A.; Davis, J.G. Spatially variable corn yield is a weak predictor of optimal nitrogen rate. Soil Sci. Soc. Am. J. 2006, 70, 2154–2160. [Google Scholar] [CrossRef] [Green Version]
- Power, J.F.; Willis, W.O.; Grunes, D.L.; Reichman, G.A. Effect of soil temperature, phosphorus and plant age on growth analysis of barley. Agron. J. 1967, 59, 231–234. [Google Scholar] [CrossRef]
- Sarker, U.; Oba, S. Response of nutrients, minerals, antioxidant leaf pigments, vitamins, polyphenol, flavonoid and antioxidant activity in selected vegetable amaranth under four soil water content. Food Chem. 2018, 252, 72–83. [Google Scholar] [CrossRef]
- Lea, U.S.; Slimestad, R.; Smedvig, P.; Lillo, C. Nitrogen deficiency enhances expression of specific MYB and bHLH transcription factors and accumulation of end products in the flavonoid pathway. Planta 2007, 225, 1245–1253. [Google Scholar] [CrossRef]
- Shapiro, C. Using a chlorophyll meter to manage nitrogen applications to corn with high nitrate irrigation water. Commun. Soil Sci. Plant Anal. 1999, 30, 1037–1049. [Google Scholar] [CrossRef]
- Li, F.; Miao, Y.; Hennig, S.D.; Gnyp, M.L.; Chen, X.; Jia, L.; Bareth, G. Evaluating hyperspectral vegetation indices for estimating nitrogen concentration of winter wheat at different growth stages. Precis. Agric. 2010, 11, 335–357. [Google Scholar] [CrossRef]
- Xia, T.; Miao, Y.; Wu, D.; Shao, H.; Khosla, R.; Mi, G. Active optical sensing of spring corn for in-season diagnosis of nitrogen status based on nitrogen nutrition index. Remote Sens. 2016, 8, 605. [Google Scholar] [CrossRef] [Green Version]
- Li, F.; Miao, Y.; Feng, G.; Yuan, F.; Yue, S.; Gao, X.; Liu, Y.; Liu, B.; Ustin, S.L.; Chen, X. Improving estimation of summer maize nitrogen status with red edge-based spectral vegetation indices. Field Crops Res. 2014, 157, 111–123. [Google Scholar] [CrossRef]
- Gabriel, J.L.; Quemada, M.; Alonso-Ayuso, M.; Lizaso, J.; Martín-Lammerding, D. Predicting N status in maize with clip sensors: Choosing sensor, leaf sampling point, and timing. Sensors. 2019, 19, 3881. [Google Scholar] [CrossRef] [PubMed] [Green Version]
- Zhang, Y.; Tremblay, N.; Zhu, J. A first comparison of Multiplex® for the assessment of corn nitrogen status. J. Food. Agric. Environ. 2012, 10, 1008–1016. [Google Scholar]
- Huang, S.; Miao, Y.; Yuan, F.; Cao, Q.; Ye, H.; Lenz-Wiedemann, V.I.S.; Bareth, G. In-Season diagnosis of rice nitrogen status using proximal fluorescence canopy sensor at different growth stages. Remote Sens. 2019, 11, 1847. [Google Scholar] [CrossRef] [Green Version]
- Varvel, G.E.; Wilhelm, W.W.; Shanahan, J.F.; Schepers, J.S. An algorithm for corn nitrogen recommendations using a chlorophyll meter-based sufficiency index. Agron. J. 2007, 99, 701–706. [Google Scholar] [CrossRef] [Green Version]
- Yang, J.; Gong, W.; Shi, S.; Du, L.; Sun, J.; Song, S.; Chen, B.; Zhang, Z. Analyzing the performance of fluorescence parameters in the monitoring of leaf nitrogen content of paddy rice. Sci. Rep. 2016, 6, 28787. [Google Scholar] [CrossRef]
- Agati, G.; Foschi, L.; Grossi, N.; Guglielminetti, L.; Cerovic, Z.G.; Volterrani, M. Fluorescence-based versus reflectance proximal sensing of nitrogen content in Paspalum vaginatum and Zoysia matrella turfgrasses. Eur. J. Agron. 2013, 45, 39–51. [Google Scholar] [CrossRef]
- Zhang, K.; Liu, X.; Ma, Y.; Zhang, R.; Cao, Q.; Zhu, Y.; Cao, W.; Tian, Y. A comparative assessment of measures of leaf nitrogen in rice using two leaf-clip meters. Sensors 2020, 20, 175. [Google Scholar] [CrossRef] [Green Version]
- Nelson, D.W.; Sommers, L.E. Determination of total nitrogen in plant material. Agron. J. 1973, 65, 109–112. [Google Scholar] [CrossRef]
- Roca, L.F.; Romero, J.; Bohórquez, J.M.; Alcántara, E.; Fernández-Escobar, R.; Trapero, A. Nitrogen status affects growth, chlorophyll content and infection by Fusicladium oleagineum in olive. Crop Prot. 2018, 109, 80–85. [Google Scholar] [CrossRef]
- Padilla, F.M.; de Souza, R.; Peña-Fleitas, M.T.; Gallardo, M.; Giménez, C.; Thompson, R.B. Different responses of various chlorophyll meters to increasing nitrogen supply in sweet pepper. Front Plant Sci. 2018, 9, 1752. [Google Scholar] [CrossRef] [PubMed] [Green Version]
- Schlemmer, M.; Gitelson, A.; Schepers, J.; Ferguson, R.; Peng, Y.; Shanahan, J.; Rundquist, D. Remote estimation of nitrogen and chlorophyll contents in maize at leaf and canopy levels. Int. J. Appl. Earth Obs. 2013, 25, 47–54. [Google Scholar] [CrossRef] [Green Version]
- Evans, J.R. Photosynthesis and nitrogen relationships in leaves of C3 plants. Oecologia 1989, 78, 9–19. [Google Scholar] [CrossRef] [PubMed]
- Bragazza, L.; Freeman, C. High nitrogen availability reduces polyphenol content in Sphagnum peat. Sci. Total Environ. 2007, 377, 439–443. [Google Scholar] [CrossRef]
- Liu, W.; Zhu, D.W.; Liu, D.H.; Geng, M.J.; Zhou, W.B.; Mi, W.J.; Yang, T.W.; Hamilton, D. Influence of nitrogen on the primary and secondary metabolism and synthesis of flavonoids in Chrysanthemum morifolium Ramat. J. Plant Nutr. 2010, 33, 240–254. [Google Scholar] [CrossRef]
- Li, J.; Zhang, J.; Zhao, Z.; Lei, X.; Xu, X.; Weng, D.; Gao, Y.; Cao, L. Use of fluorescence-based sensors to determine the nitrogen status of paddy rice. J. Agric. Sci. 2013, 151, 862–887. [Google Scholar] [CrossRef]
- Padilla, F.M.; Peña-Fleitas, M.T.; Gallardo, M.; Thompson, R.B. Proximal optical sensing of cucumber crop N status using chlorophyll fluorescence indices. Eur. J. Agron. 2016, 73, 83–97. [Google Scholar] [CrossRef]
- Cui, Z.L.; Zhang, H.Y.; Chen, X.P.; Zhang, C.C.; Ma, W.Q.; Huang, C.D.; Zhang, W.F.; Mi, G.H.; miAo, Y.X.; Li, X.L.; et al. Pursuing sustainable productivity with millions of smallholder farmers. Nature 2018, 555, 363–366. [Google Scholar] [CrossRef]
- Richardson, A.D.; Duigan, S.P.; Berlyn, G.P. An evaluation of noninvasive methods to estimate foliar chlorophyll content. New Phytol. 2002, 153, 185–194. [Google Scholar] [CrossRef] [Green Version]
- Romero, I.; García-Escudero, E.; Martín, I. Leaf blade versus petiole analysis for nutritional diagnosis of Vitis vinifera L. cv. Tempranillo. Am. J. Enol. Vitic. 2012, 64, 50–64. [Google Scholar] [CrossRef]
- Romero, I.; García-Escudero, E.; Martín, I. Effects of leaf position on blade and petiole mineral nutrient concentration of Tempranillo grapevine (Vitis vinifera L.). Am. J. Enol. Vitic. 2010, 61, 544–550. [Google Scholar] [CrossRef] [Green Version]
- Ziadi, N.; Bélanger, G.; Gastal, F.; Claessens, A.; Lemaire, G.; Tremblay, N. Leaf nitrogen concentration as an indicator of corn nitrogen status. Agron. J. 2009, 101, 947–957. [Google Scholar] [CrossRef]
- Kolb, C.A.; Pfündel, E.E. Origins of non-linear and dissimilar relationships between epidermal UV absorbance and UV absorbance of extracted phenolics in leaves of grapevine and barley. Plant Cell Environ. 2005, 28, 580–590. [Google Scholar] [CrossRef]
- Agati, G.; Cerovic, Z.G.; Pinelli, P.; Tattini, M. Light-induced accumulation of ortho-dihydroxylated flavonoids as non-destructively monitored by chlorophyll fluorescence excitation techniques. Environ. Exp. Bot. 2011, 73, 3–9. [Google Scholar] [CrossRef]
- Teal, R.K.; Tubana, B.; Girma, K.; Freeman, K.W.; Arnall, D.B.; Walsh, O.; Raun, W.R. In-season prediction of corn grain yield potential using normalized difference vegetation index. Agron. J. 2006, 98, 1488–1494. [Google Scholar] [CrossRef] [Green Version]
- Samson, G.; Tremblay, N.; Dudelzak, A.E.; Babichenko, S.M.; Dextraze, L.; Wollring, J. Nutrient stress of corn plants: Early detection and discrimination using a compact multiwavelength fluorescent lidar. In Proceedings of the 4th EARSeL Workshop Lidar Remote Sensing of Land and Sea held during the 20th EARSeL Symposium, Dresden, Germany, 14–16 June 2000. [Google Scholar]
- Overbeck, V.; Schmitz, M.; Tartachnyk, I.; Blanke, M. Identification of light availability in different sweet cherry orchards under cover by using non-destructive measurements with a Dualex™. Eur. J. Agron. 2018, 93, 50–56. [Google Scholar] [CrossRef]
- Padilla, F.M.; Gallardo, M.; Peña-Fleitas, M.T.; De Souza, R.; Thompson, R.B. Proximal optical sensors for nitrogen management of vegetable crops: A review. Sensors 2018, 18, 2083. [Google Scholar] [CrossRef] [Green Version]
- Agati, G.; Brunetti, C.; Di Ferdinando, M.; Ferrini, F.; Pollastri, S.; Tattini, M. Functional roles of flavonoids in photoprotection: New evidence, lessons from the past. Plant Physiol. Biochem. 2013, 72, 35–45. [Google Scholar] [CrossRef]
- Louis, J.; Meyer, S.; Maunoury-Danger, F.; Fresneau, C.; Meudec, E.; Cerovic, Z.G. Seasonal changes in optically assessed epidermal phenolic compounds and chlorophyll contents in leaves of sessile oak (Quercus petraea): Towards signatures of phenological stage. Funct. Plant Biol. 2009, 36, 732–741. [Google Scholar] [CrossRef]
- Louis, J.; Genet, H.; Meyer, S.; Soudani, K.; Montpied, P.; Legout, A.; Dreyer, E.; Cerovic, Z.G.; Dufrêne, E. Tree age-related effects on sun acclimated leaves in a chronosequence of beech (fagus sylvatica) stands. Funct. Plant Biol. 2012, 39, 323–331. [Google Scholar] [CrossRef]
- Yang, H.; Li, J.; Yang, J.; Wang, H.; Zou, J.; He, J. Effects of nitrogen application rate and leaf age on the distribution pattern of leaf SPAD readings in the rice canopy. PLoS ONE 2014, 9, e92509. [Google Scholar] [CrossRef] [PubMed]
- Wang, S.; Zhu, Y.; Jiang, H.; Cao, W. Positional differences in nitrogen and sugar concentrations of upper leaves relate to plant N status in rice under different N rates. Field Crop Res. 2006, 96, 224–234. [Google Scholar] [CrossRef]
- Lin, F.F.; Qiu, L.F.; Deng, J.S.; Shi, Y.Y.; Chen, L.S.; Wang, K. Investigation of SPAD meter-based indices for estimating rice nitrogen status. Compu. Electron. Agric. 2010, 71S, 60–65. [Google Scholar] [CrossRef]
- Abdallah, S.B.; Rabhi, M.; Harbaoui, F.; Zar-kalai, F.; Lachâal, M.; Karray-Bouraoui, N. Distribution of phenolic compounds and antioxidant activity between young and old leaves of Carthamus tinctorius L. and their induction by salt stress. Acta Physiol. Plant. 2013, 35, 1161–1169. [Google Scholar] [CrossRef]
- Vagiri, M.; Conner, S.; Stewart, D.; Andersson, S.C.; Verrall, S.; Johansson, E.; Rumpunen, K. Phenolic compounds in blackcurrant (Ribes nigrum L.) leaves relative to leaf position and harvest date. Food Chem. 2014, 172, 135–142. [Google Scholar] [CrossRef] [PubMed]
- Mulla, D.J.; Miao, Y. Precision Farming. In Land Resources Monitoring, Modeling, and Mapping with Remote Sensing; Thenkabail, P.S., Ed.; CRC Press: Boca Raton, FL, USA, 2016. [Google Scholar]
- Ziadi, N.; Brassard, M.; Bélanger, G.; Claessens, A.; Tremblay, N.; Cambouris, A.N.; Nolin, M.C.; Parent, L.E. Chlorophyll measurements and nitrogen nutrition index for the evaluation of corn nitrogen status. Agron. J. 2008, 100, 1264–1273. [Google Scholar] [CrossRef]
- Yang, Y.; Timlin, D.J.; Fleisher, D.H.; Lokhande, S.B.; Chun, J.A.; Kim, S.H.; Staver, K.; Reddy, V.R. Nitrogen concentration and dry-matter accumulation in maize crop: Assessing maize nitrogen status with an allometric function and a chlorophyll meter. Commun. Soil Sci. Plant Anal. 2012, 43, 1563–1575. [Google Scholar] [CrossRef]
- Olioso, A.; Méthy, M.; Lacaze, B. Fluorescence as a Function of Canopy Structure and Leaf Fluorescence. Remote. Sens. Environ. 1992, 41, 239–247. [Google Scholar] [CrossRef]
- Garzonio, R.; di Mauro, B.; Colombo, R.; Cogliati, S. Surface reflectance and sun-induced fluorescence spectroscopy measurements using a small hyperspectral UAS. Remote Sens. 2017, 9, 472. [Google Scholar] [CrossRef] [Green Version]
- Coppo, P.; Taiti, A.; Pettinato, L.; Francois, M.; Taccola, M.; Drusch, M. Fluorescence imaging spectrometer (FLORIS) for ESA FLEX mission. Remote Sens. 2017, 9, 649. [Google Scholar] [CrossRef] [Green Version]
- Miao, Y.; Mulla, D.J.; Randall, G.W.; Vetsch, J.A.; Vintila, R. Combining chlorophyll meter readings and high spatial resolution remote sensing images for in-season site-specific nitrogen management of corn. Precis. Agric. 2009, 10, 45–62. [Google Scholar] [CrossRef]
Figure 1.
Daily precipitation (mm) and mean temperature (°C) during the growing season at the study site in 2016 and 2017.
Figure 1.
Daily precipitation (mm) and mean temperature (°C) during the growing season at the study site in 2016 and 2017.

Figure 2.
Relationships between single leaf N concentration (SLNC) obtained from three different leaves of a plant and total leaf N concentration (TLNC) and plant N concentration (PNC).
Figure 2.
Relationships between single leaf N concentration (SLNC) obtained from three different leaves of a plant and total leaf N concentration (TLNC) and plant N concentration (PNC).

Figure 3.
Total leaf N concentration (TLNC) and plant N concentration (PNC) as affected by different soil types (a), growth stages (b), and N rates (c). The different letters above the boxes indicate that the TLNC and PNC values differed significantly according to the least significant difference test at p ≤ 0.05.

Figure 4.
Dualex 4 parameters (chlorophyll concentration (Chl), leaf epidermal flavonoids (Flav), and N balance index (NBI)) as affected by different soil types, growth stages, and N rates. The different letters above the boxes indicate that the Dualex 4 parameter values differed significantly according to the least significant difference test at p ≤ 0.05.

Figure 5.
Modified Dualex 4 parameters (modified Chl (mChl) (a), modified Falv (mFlav) (b), and modified (mNBI)) (c) as affected by growth stage. Different letters above the boxes indicate that the modified Dualex 4 parameter values differed significantly according to the least significant difference test at p ≤ 0.05.

Figure 6.
Relationships between original Dualex 4 parameters (Chl (a,d), Flav (b,e), and NBI (c,f)) for the mean values of three differently positioned leaves and two N status indicators (TLNC (a–c) and PNC (d–f)) across growth stages. The models with the highest R2 are displayed, with L (e), P (a), and Q (d) indicating linear, power, and quadratic models, respectively.

Figure 7.
Relationships between modified Dualex 4 parameters (mChl, mFlav, and mNBI) for the mean values of three differently positioned leaves and two N status indicators (TLNC and PNC) across growth stages.
Figure 7.
Relationships between modified Dualex 4 parameters (mChl, mFlav, and mNBI) for the mean values of three differently positioned leaves and two N status indicators (TLNC and PNC) across growth stages.

Figure 8.
Validation results for the prediction of TLNC and PNC using the mean values of modified Dualex 4 parameters for three single-position leaves. Black and red lines indicate the regression and the 1:1 line, respectively.
Figure 8.
Validation results for the prediction of TLNC and PNC using the mean values of modified Dualex 4 parameters for three single-position leaves. Black and red lines indicate the regression and the 1:1 line, respectively.


Table 1.
Experimental set-up, plant sampling, and sensing stages in the experiment conducted in 2016 and 2017.
Table 1.
Experimental set-up, plant sampling, and sensing stages in the experiment conducted in 2016 and 2017.
| Site | Planting Date | Side Dressing Date | Harvest Date | Irrigation Date | Sampling and Sensing Stage |
|---|---|---|---|---|---|
| 2016 | |||||
| Site 1 | May 7th | Jul. 3rd (57 DAS) | Oct. 6th | Jul. 13–16th (70–73 DAS) | V8 (49 DAS *, 50 DAS), V12 (70 DAS *, 73 DAS), VT (78 DAS *, 81 DAS) |
| Site 2 | May. 5th | Jul. 4th (60 DAS) | Sep. 29th | No irrigation | V8 (50 DAS, 51 DAS *), V13 (72 DAS *), VT (78 DAS, 80 DAS *) |
| 2017 | |||||
| Site 1 | May. 4th | Jul. 3rd (60 DAS) | Oct. 3rd | Jul. 11–13th (69–71 DAS) | V4 (30 DAS *), V6 (40 DAS), V8 (56 DAS), V11 (65 DAS *), VT (84 DAS, 86 DAS *) |
| Site 2 | May. 3th | Jul. 2nd (60 DAS) | Oct. 2nd | No irrigation | V4 (29 DAS *), V6 (38 DAS), V8 (52 DAS), V11 (64 DAS *), VT (83 DAS, 85 DAS *) |
* Data acquired at these stages were used to plot the relationships between SLNC and TLNC or PNC.
Table 2.
The details of Dualex 4-based parameters.
| Parameters | Abbreviation | Algorithm |
|---|---|---|
| Chlorophyll | Chl | FRFR/RFR |
| Flavonoids | Flav | Log (FRFR/FRFUV) |
| Nitrogen balance index | NBI | Chl/Flav |
| Modified chlorophyll | mChl | Chl/DAS |
| Modified flavonoids | mFlav | Flav × DAS |
| Modified nitrogen balance index | mNBI | NBI/DAS2 |
Table 3.
Descriptive statistics for TLNC and PNC for calibration and validation datasets.
| Dataset | TLNC (g kg−1) | PNC (g kg−1) | ||||
|---|---|---|---|---|---|---|
| Mean | SD | CV (%) | Mean | SD | CV (%) | |
| Calibration dataset | ||||||
| n = 504 | 23.59 | 7.24 | 31 | 20.61 | 8.73 | 42 |
| Validation dataset | ||||||
| n = 252 | 23.08 | 7.07 | 31 | 19.91 | 8.68 | 44 |
Table 4.
Coefficients of determination (R2) for the relationships between Dualex 4-based parameters of three differently positioned leaves and two N status indicators (TLNC and PNC).
Table 4.
Coefficients of determination (R2) for the relationships between Dualex 4-based parameters of three differently positioned leaves and two N status indicators (TLNC and PNC).
| N Concentration (g kg−1) | Leaf Position | Chl | Flav | NBI | mChl | mFlav | mNBI | ||||||
|---|---|---|---|---|---|---|---|---|---|---|---|---|---|
| Model | R2 | Model | R2 | Model | R2 | Model | R2 | Model | R2 | Model | R2 | ||
| TLNC | Leaf 1 | Q | 0.34 | Q | 0.11 | P | 0.03 | P | 0.80 | P | 0.53 | P | 0.77 |
| Leaf 2 | Q | 0.34 | Q | 0.16 | P | 0.01 | P | 0.78 | P | 0.49 | P | 0.76 | |
| Leaf 3 | P | 0.18 | Q | 0.10 | Q | 0.01 | P | 0.75 | E | 0.50 | P | 0.74 | |
| PNC | Leaf 1 | Q | 0.20 | Q | 0.22 | Q | 0.03 | Q | 0.84 | P | 0.56 | P | 0.80 |
| Leaf 2 | Q | 0.18 | Q | 0.33 | Q | 0.07 | P | 0.83 | P | 0.49 | P | 0.79 | |
| Leaf 3 | Q | 0.10 | Q | 0.25 | Q | 0.09 | P | 0.78 | P | 0.50 | P | 0.75 | |
Note: Q: Quadratic model; P: Power model; E: Exponential model.
Table 5.
Validation results for the estimation of TLNC and PNC using modified Dualex 4 parameters for single-position leaves by the general estimation models across growth stages.
Table 5.
Validation results for the estimation of TLNC and PNC using modified Dualex 4 parameters for single-position leaves by the general estimation models across growth stages.
| N Concentration (g kg−1) | Leaf Position | mChl | mFlav | mNBI | ||||||
|---|---|---|---|---|---|---|---|---|---|---|
| R2 | RMSE | RE(%) | R2 | RMSE | RE(%) | R2 | RMSE | RE(%) | ||
| TLNC | Leaf 1 | 0.79 | 3.27 | 14 | 0.45 | 5.22 | 23 | 0.72 | 3.76 | 16 |
| Leaf 2 | 0.76 | 3.45 | 15 | 0.42 | 5.38 | 23 | 0.71 | 3.77 | 16 | |
| Leaf 3 | 0.71 | 3.81 | 16 | 0.53 | 4.83 | 21 | 0.73 | 3.65 | 16 | |
| PNC | Leaf 1 | 0.84 | 3.46 | 17 | 0.41 | 6.66 | 33 | 0.73 | 4.52 | 23 |
| Leaf 2 | 0.82 | 3.68 | 18 | 0.40 | 6.73 | 34 | 0.74 | 4.37 | 22 | |
| Leaf 3 | 0.73 | 4.48 | 23 | 0.53 | 5.96 | 30 | 0.75 | 4.29 | 22 | |
© 2020 by the authors. Licensee MDPI, Basel, Switzerland. This article is an open access article distributed under the terms and conditions of the Creative Commons Attribution (CC BY) license (http://creativecommons.org/licenses/by/4.0/).
Share and Cite
MDPI and ACS Style
Dong, R.; Miao, Y.; Wang, X.; Chen, Z.; Yuan, F.; Zhang, W.; Li, H. Estimating Plant Nitrogen Concentration of Maize Using a Leaf Fluorescence Sensor across Growth Stages. Remote Sens. 2020, 12, 1139. https://doi.org/10.3390/rs12071139
AMA Style
Dong R, Miao Y, Wang X, Chen Z, Yuan F, Zhang W, Li H. Estimating Plant Nitrogen Concentration of Maize Using a Leaf Fluorescence Sensor across Growth Stages. Remote Sensing. 2020; 12(7):1139. https://doi.org/10.3390/rs12071139
Chicago/Turabian StyleDong, Rui, Yuxin Miao, Xinbing Wang, Zhichao Chen, Fei Yuan, Weina Zhang, and Haigang Li. 2020. "Estimating Plant Nitrogen Concentration of Maize Using a Leaf Fluorescence Sensor across Growth Stages" Remote Sensing 12, no. 7: 1139. https://doi.org/10.3390/rs12071139
Note that from the first issue of 2016, this journal uses article numbers instead of page numbers. See further details here.