A Review of Remote Sensing for Environmental Monitoring in China


1
College of Geoscience and Surveying Engineering, China University of Mining and Technology, Beijing 100083, China
2
Ministry of Ecology and Environment Center for Satellite Application on Ecology and Environment, Beijing 100094, China
3
State Environmental Protection Key Laboratory of Satellite Remote Sensing, Beijing 100094, China
*
Author to whom correspondence should be addressed.
Remote Sens. 2020, 12(7), 1130; https://doi.org/10.3390/rs12071130
Submission received: 17 February 2020
/
Revised: 27 March 2020
/
Accepted: 30 March 2020
/
Published: 2 April 2020
Abstract
:The natural environment is essential for human survival and development since it provides water resources, land resources, biological resources and climate resources etc. As a developing country, China has witnessed a significant change in the natural environment in recent decades; and therefore, monitoring and mastering the status of the environment is of great significance. Due to the characteristics of large-scale and dynamic observation, remote sensing technology has been an indispensable approach for environmental monitoring. This paper reviews the satellite resources, institutions and policies for environmental monitoring in China, and the advances in research and application of remote sensing from five aspects: ecological index retrieval, environmental monitoring in protected areas, rural areas, urban areas and mining areas. The remote sensing models and methods for various types of environmental monitoring, and the specific applications in China are comprehensively summarized. This paper also points out major challenges existing at the current stage: satellite sensor problems, integrated use challenges of datasets, uncertainty in the retrieval process of ecological variables, scaling effect problems, a low degree of automation, the weak ability of forecasting and comprehensive analysis, and a lack of computational power for massive datasets. Finally, the development trend and future directions are put forward to direct the research and application of environmental monitoring and protection in the new era.
1. Introduction
Natural environment is a general term for water resources, land resources, biological resources and climate resources, which affects human beings’ survival and development. It is closely related to the sustainable development of society and economy. Since the Industrial Revolution, the intensity of the human use of natural resources has continuously increased with the rapid growth of populations, and in particular, the overexploitation of resources leading to the deterioration of the environment, has become greater and greater [1]. For example, the consumption of fossil fuels and the deforestation of forest resources accelerate global climate warming, and further lead to the extinction of biological species at an unprecedented rate. When the environmental load exceeds the limit that an ecosystem can bear, the ecosystem would gradually weaken and be exhausted. Therefore, natural environment monitoring is of great significance for the environmental resource protection and management, and the survival and development of human beings [2].
The commonly used ground-based monitoring is limited by regions and only suitable for point-based environmental monitoring in a small region. This method is time-consuming, costly and labor intensive. Due to the characteristics of large-scale and dynamic observation, remote sensing sensors are able to quickly acquire the wide spectral information of regional and even global targets, such that various ecological indicators can be obtained by data modeling and retrieval. As such, remote sensing has gradually been an indispensable approach to ecological monitoring, especially at a large or global scale.
As a developing country, China is experiencing a significant change in natural environment, and remote sensing is playing an important role in environmental monitoring and protection [3]. Many agencies carried out a large amount of work with remote sensing to monitor ecological status and change. As an example, Ministry of Ecology and Environment Center for Satellite Application on Ecology and Environment, has conducted a great amount work by using international satellite data such as Landsat, MODIS and China-launched satellite data such as HJ-1A, Gaofen-1, Gaofen-2 (more details can be seen in Section 2). They have become operational in many services including ecological index retrieval, human activity monitoring in protected areas, and environmental damage assessment and so on, which provides strong support for national environment management and decision-making. This is very useful for the official inspection on ecological and environmental protection, especially for the Green Shield Action established by seven state ministries. Two typical cases are environment degradation in the Qilian Mountain National Nature Reserve in Gansu Province and the illegal villa construction at the northern foot of the Qinling Mountain in Shaanxi Province. In addition, many studies and literatures documented the progress in many fields, such as ecological index retrieval [4,5,6], urban and rural area monitoring [7,8,9,10,11], and nature reserves monitoring [12,13,14]. However, few studies have systematically and comprehensively summarized the progress in environmental monitoring by remote sensing in China in recent decades.
This paper aims at reviewing the satellite resources, institutions and policies for environmental monitoring in China, and the advances in research and application of remote sensing from five aspects: ecological index retrieval, environmental monitoring in protected areas, rural areas, urban areas and mining areas (atmosphere and water environment monitoring will be introduced separately). This paper also points out major challenges existing in the current stage and puts forward the development trend and future directions, which is useful to direct the research and application of environmental monitoring and protection in the new era.
2. Satellite Resources, Institutions and Policies for Environmental Monitoring in China
2.1. Remote Sensing Satellite and Sensor Resources for Environmental Monitoring
Global and regional environmental monitoring relies heavily on remote sensing satellite and sensors which are capable of quickly collecting spatial and spectral information of large-extent entities on the Earth’s surface. Table 1 lists major satellite sensors used for environmental monitoring in China in recent decades. The studies on environmental monitoring by remote sensing in China before the year 2008 were mainly based on the datasets from international satellites, e.g., EOS-Terra, Envisat, Landsat, Quickbird and SPOT. Since then, China has accelerated scientific and technological research on satellites and sensors and has established a series of science and technology funding programs. Among them, a very important program is the High-Resolution Earth Observation Project (http://www.nmp.gov.cn/zxjs/ddgc/201012/t20101208_2125.htm), which has promoted the launch and application of Gaofen-1 to Gaofen-6 satellites. The series of Gaofen satellites include high spatial resolution, high spectral resolution, high temporal resolution and radar sensors. Currently, both international and domestic satellite datasets have played an important role in environmental monitoring research in China.
2.2. Major Research and Education Institutions Involved in Remote Sensing of the Environment
Many institutions are involved in the research and application of remote sensing in environmental monitoring in China, which can be categorized into three types: government agencies, research institutions and universities, as listed in Table 2. Since remote sensing technology has shown great advantages, many ministries or commissions of China’s central government have successively established remote sensing application agencies to specifically explore and implement applications of remote sensing technologies in their jurisdictions. For example, the Satellite Environment Center of the Ministry of Ecology and Environment is engaged in the application of remote sensing in ecosystem and environment monitoring. In addition, some research institutions and universities are conducting research into theories, methods and applications of remote sensing in various fields.
2.3. Major Remotely-Sensed Environmental Monitoring Policies
Protecting the environment is one of China’s basic national policies. To strengthen environment protection, Chinese central government has promulgated the new environmental protection law in 2014. The rule for Ecological Conservation Red Line (ECRL) was added to the law, and it designated ecological protection red lines in the areas such as key ecological function zones, environmentally sensitive zones and fragile areas where a strict protection is implemented. Besides this, the Ministry of Science and Technology of China has released an annual report on the remote sensing monitoring of the global environment every year since 2012, to contribute to global environmental monitoring. China began promoting remote sensing technologies in order to implement environmental monitoring effectively in recent years, and aimed at establishing the space–earth integration observation system for environmental monitoring. A series of science and technology funding programs have been implemented including the High-Resolution Earth Observation System Project, the Air Pollution Control Action Plan, the Eco-Environment Monitoring and the Assessment of the Belt and Road etc.
3. Advances in Remote Sensing for Environmental Monitoring
According to the management model of environmental monitoring by remote sensing in China, this paper describes the advances in remote sensing for environmental monitoring from five aspects: ecological index retrieval, environmental monitoring in protected areas, rural areas, urban areas and mining areas. The studies of environmental monitoring by remote sensing in China are summarized in Table 3.
3.1. Remote Sensing Retrieval of Ecological Indexes
Many ecological indexes based on remote sensing are proposed to reflect ecological status. This section introduces the remote sensing retrieval of a few basic ecological indexes, including vegetation index, soil/vegetation moisture, evapotranspiration and land surface temperature.
3.1.1. Vegetation Index
Vegetation indexes are effective and empirical indicators that reflect the status of vegetation on the ground and describe ecological conditions. The commonly used vegetation indexes include Ratio Vegetation Index (RVI), Normalized Difference Vegetation Index (NDVI), Environmental Vegetation Index (EVI), Green Vegetation Index (GVI), Perpendicular Vegetation Index (PVI), Soil Adjusted Vegetation Index (SAVI), and Difference Environmental Vegetation Index (DVIEVI) etc.
With the fast development of space technologies, remote sensing data are becoming more and more abundant. Some studies on vegetation indexes have been conducted in China focusing on the improvement of retrieval accuracy. One important aspect is appropriate for dataset selection. Different remote sensing datasets, e.g., Landsat TM&OLI, Gaofen-1 and MODIS, have different characteristics, such as spatial resolution, spectral range and resolution. This leads to different levels of retrieval accuracy [15]. Another important aspect is the use of band information, and some studies have compared the original band combination method, the principal component combination method, and the derivative band combination method to find out the best band combination for typical indexes [16,17]. In addition, investigating the impact factors of vegetation index retrieval and making adjustments are also an effective method of improving retrieval accuracy. For example, scholars found that the reflectance in the near infrared and shortwave infrared bands was sensitive to topographical variations, and carefully removed the topographic effects before using the non-band-ratio vegetation indexes [18]. There are some works focusing on the application of the vegetation index. For example, the vegetation coverage was extracted based on remote sensing images by vegetation indexes such as NDVI, EVI and SAVI [19]. Some scholars used MODIS vegetation index products combined with meteorological data to investigate the spatial and temporal changes of regional vegetation cover [20,21].
3.1.2. Soil and Vegetation Moisture
Soil moisture is a key component of the global water and energy exchange among hydrosphere, atmosphere and biosphere. A variety of methods have been proposed to retrieve soil moisture, which can fall into three categories: empirical models, semi-empirical models and physical models. The most widely used are empirical models including: the soil moisture retrieval model based on MODIS short-wave infrared spectral feature space [22,23], the active–passive remote sensing collaborative retrieval model based on the genetic neural network algorithm [24], the retrieval model based on the normalized spectral slope absorption index [25], and the soil moisture retrieval model based on red-near infrared spectral feature space [26,27]. The semi-empirical models include: a coupling model of soil moisture retrieval based on active–passive remote sensing [28], and a soil moisture retrieval model based on polarized reflection information [29,30]. Due to theoretical complexity, few studies focused on physical models. A typical model is based on the characteristics of bi-directional reflectance of soil, which simulates the soil reflectance under natural conditions, and establishes the relationship between soil bi-directional reflectance and soil water content [31].
Vegetation moisture is an indicator reflecting the growth of vegetation, and many vegetation moisture indexes have been presented. The most commonly used method is to first establish the functional relationship between the spectral index and the vegetation water content based on the ground measured values, and to further quantitatively retrieve vegetation moisture from remote sensing images [32,33,34]. For example, the leaf water content (LWC) of winter wheat in China’s Ningxia Region was estimated with spectral indexes considering MODIS data and ground observation data, and it was found that three indexes (Normalized Difference Water Index, Simple Ratio and Shortwave Infrared Perpendicular Water Stress Index) were significantly correlated with the LWC of winter wheat [35]. Another way is to make use of the optical properties of vegetation from a physical perspective. For example, [36] proposed a model for quantitatively retrieving the moisture content of a vegetation canopy based on the PROSAIL model using Hyperion hyperspectral data, which is effective for obtaining vegetation moisture content information in a wide area.
3.1.3. Evapotranspiration
Evapotranspiration is an important parameter in the surface energy cycle. Scholars use different models to calculate the amount of land surface evapotranspiration. Commonly used models include the Surface Energy Balance Algorithm for Land (SEBAL) model, the Surface Energy Balance System (SEBS) model, the Mapping Evapotranspiration at High Resolution with Internalized Calibration (METRIC) model, the hybrid models and the semi-empirical models.
The SEBAL model based on the land surface energy balance model shows a clear physical process. It first obtains the latent heat flux by calculating relevant components of surface energy balance, and then estimates the evapotranspiration [37]. The SEBAL model can be used for a wide range of satellite datasets. As an application case of international datasets, scholars estimated the evapotranspiration in Panjin City, Liaoning Province using the SEBAL model based on Landsat 8 satellite data [38]. In order to promote the application of domestic satellite data, researchers used HJ-1B and FY-3/VIRR datasets for evapotranspiration estimation. Experiments showed that the relative deviation between the estimation results and ground truth data was approximately 10%, which demonstrated the validity of China’s satellite data [39,40].
The SEBS model first calculates the atmospheric turbulent flux and evaporation ratio based on the surface energy balance equation, and then estimates the surface energy flux over a large area through a series of surface physical parameters obtained from remote sensing combined with the simultaneously observed meteorological data on the ground [41]. It can be used to estimate the daily evapotranspiration in a large area based on the satellite data and meteorological observation data [42]. Furthermore, scholars have tested its validity in estimating the evapotranspiration during different seasons [43]. Based on the estimation results of SEBS model, the relationships among the evapotranspiration and environmental factors can be quantitatively analyzed [44].
The METRIC model [45] is an evapotranspiration estimation method based on high resolution images and internal calibration. Through the analysis of METRIC model theory, the estimation accuracy can be further promoted by improving some model parameters, such as surface roughness parameter [46]. Some scholars also used the hybrid of METRIC model and other models, e.g., the hybrid of METRIC and SEBS model [47] and the hybrid of METRIC and SEBAL model [5].
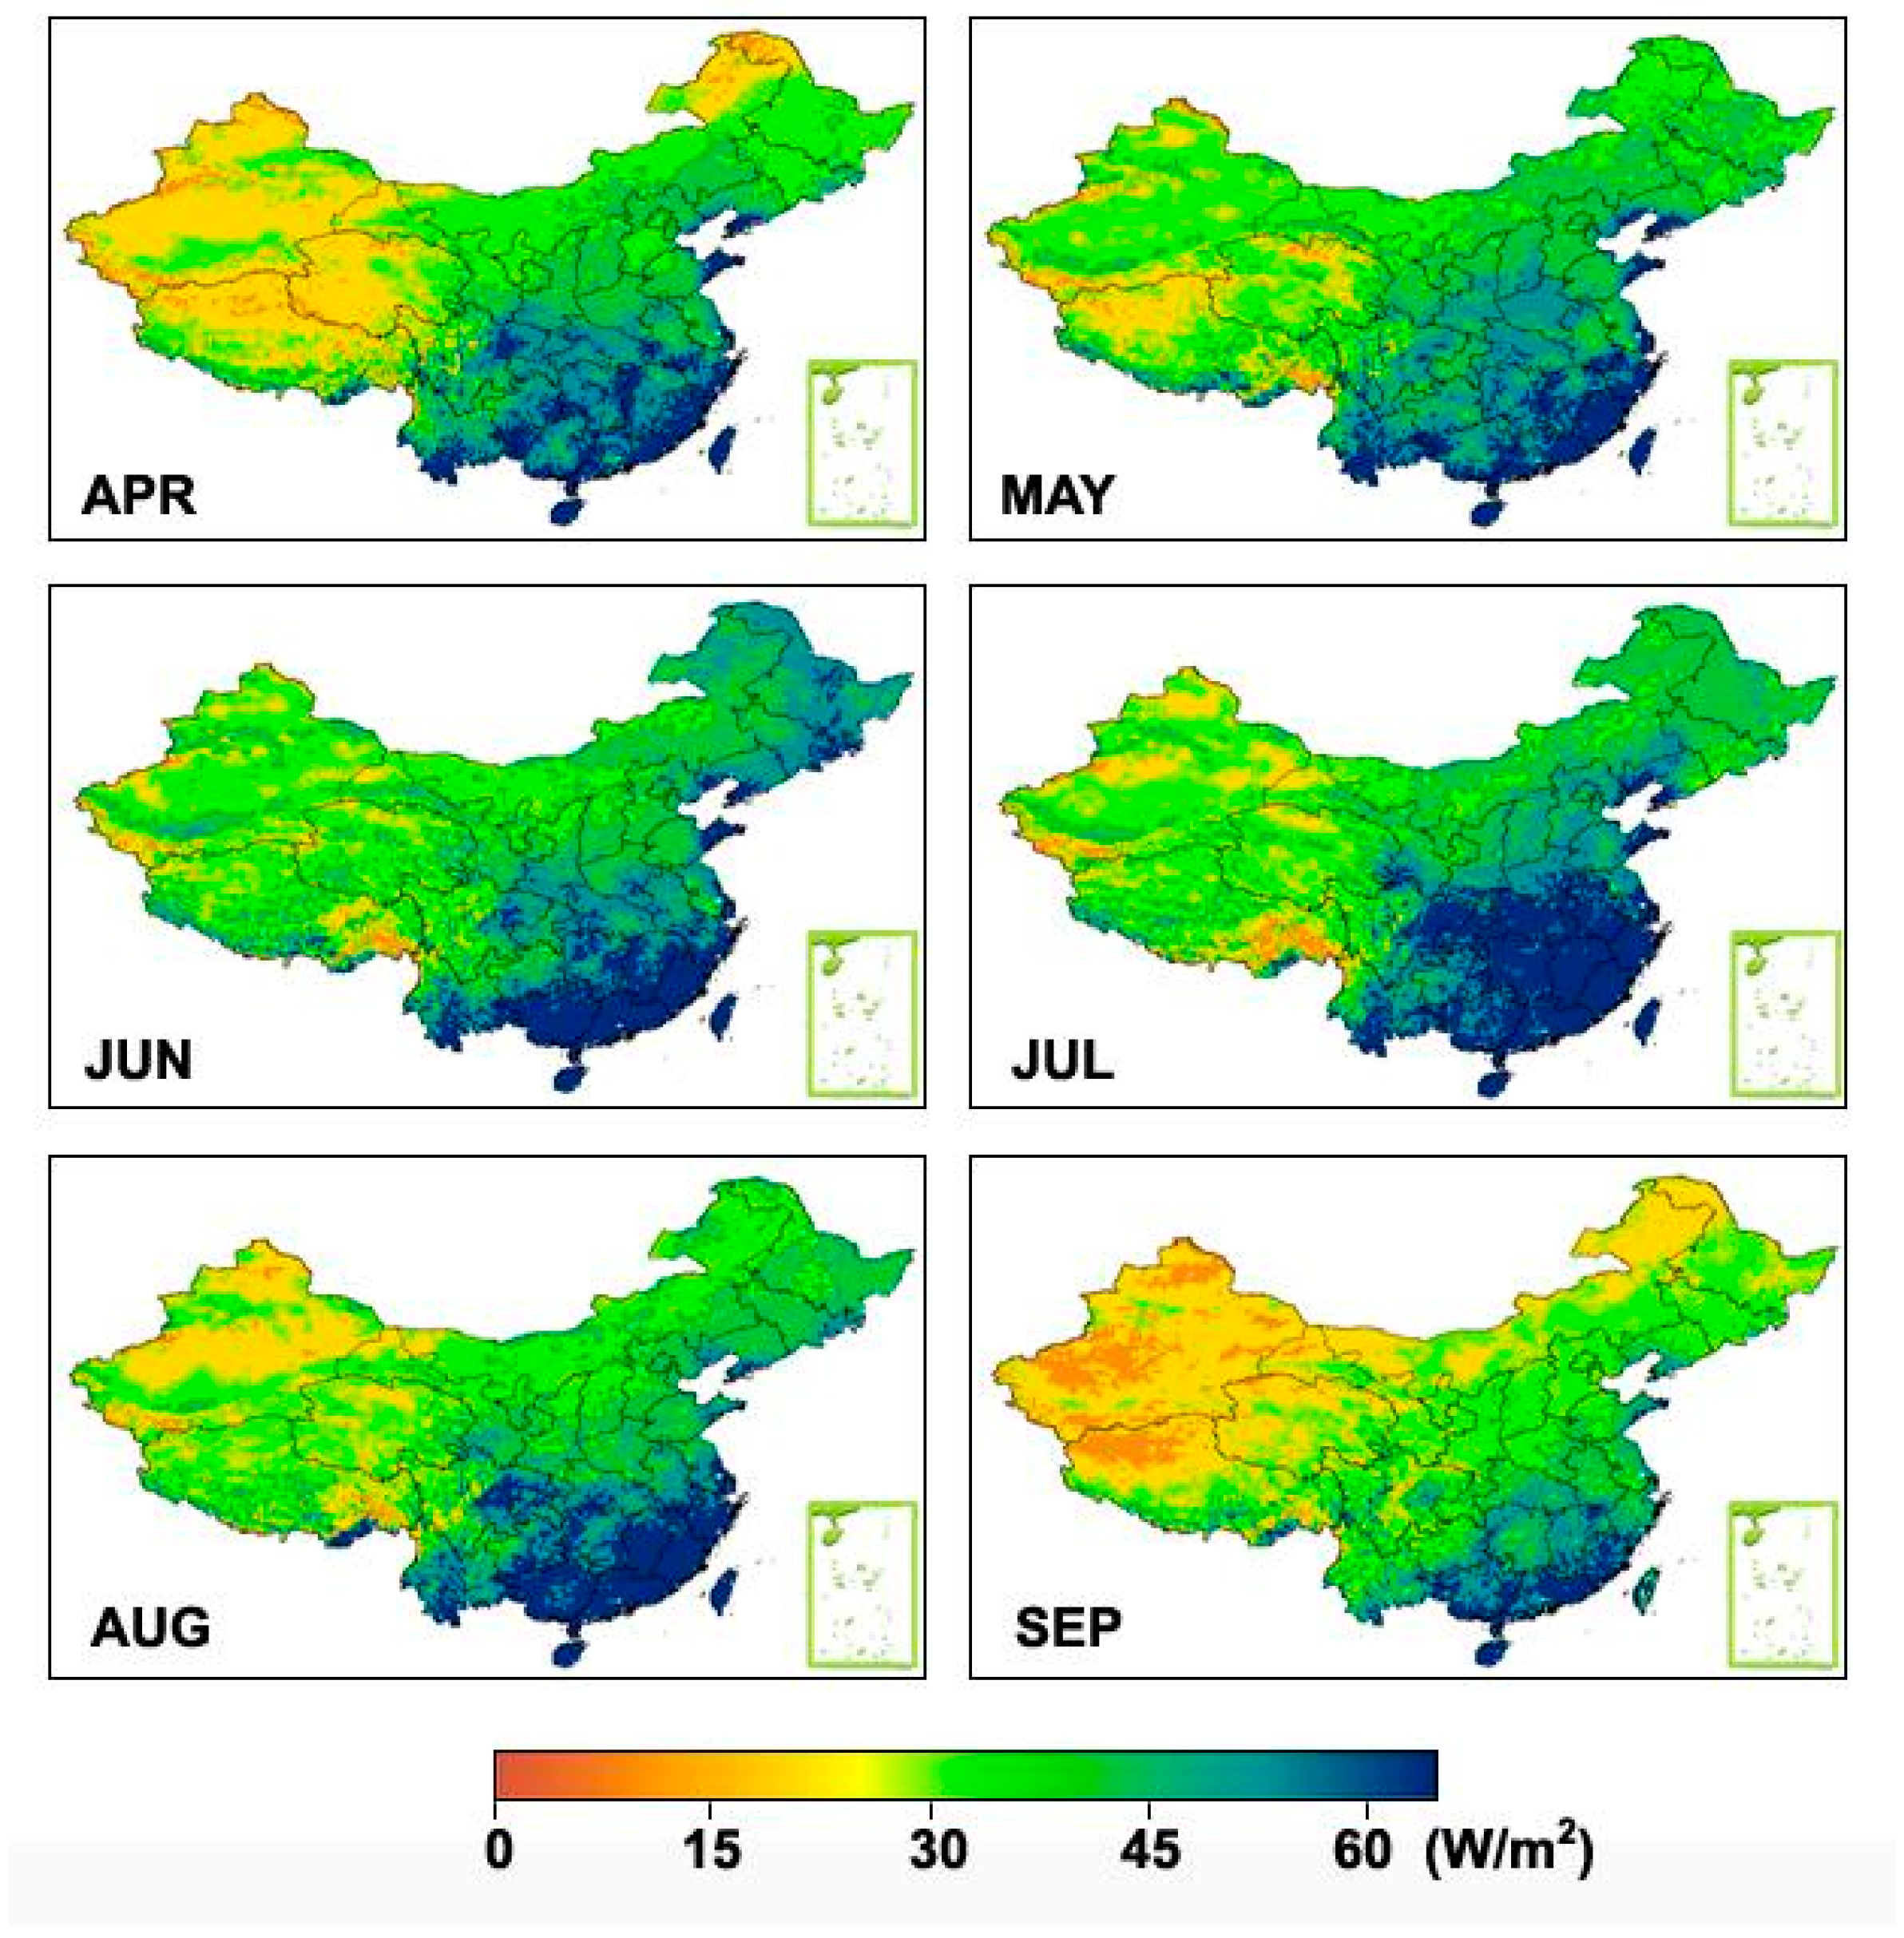
A semi-empirical model, i.e., the exponential evapotranspiration model, was proposed by [48] to estimate China’s evapotranspiration for April to September of 2004 by MODIS data, and experimental results validated that it was useful for monitoring China’s surface drought events. Figure 1 reveals the spatial patterns and temporal evolution trends of the monthly composites of daily evapotranspiration under both clear and cloudy sky conditions.
3.1.4. Land Surface Temperature
Land surface temperature (LST) is an indispensable parameter to study the exchange of matter and energy between surface and atmosphere, global ocean circulation, climate change anomalies and other aspects. This section will introduce three types of LST retrieval algorithms: the single-channel algorithm, the split-window algorithm and the neural network-based algorithm. The single-channel algorithms use a single thermal infrared channel data to retrieve surface temperature [49], and they can be categorized into two types. The empirical single-channel algorithms establish the empirical relationship between atmospheric parameters and near-surface atmospheric temperature [4], while the physical single-channel algorithms conduct atmospheric corrections using the radiative transfer equation and atmospheric profiles [50]. The split-window algorithms mainly use the linear combination of two adjacent infrared channels with different atmospheric absorption characteristics to eliminate atmospheric effects and retrieve land surface temperature [51]. For example, [52] proposed a split-window algorithm for surface temperature retrieval from the Advanced Spaceborne Thermal Emission and Reflection (ASTER) data based on the exponential simplification of the radiation transfer equation and Planck function. In order to make use of China’s high-resolution Gaofen-5 data, [53] developed a new nonlinear, four-channel split-window algorithm, and the experimental results are shown in Figure 2. As the neural network algorithms were widely used in remote sensing image processing, the neural network-based algorithm was proposed, which used appropriate band information as learning samples, and applied the deep dynamic learning neural network and the radiation transfer model to retrieve surface temperature [6].
3.2. Remote Sensing Monitoring of Protected Areas
Protected areas are the land or sea where biodiversity, natural and cultural resources are protected and preserved by law or other effective means. In China, protected areas include nature reserves, biodiversity conservation areas, ecologically functional areas, scenic spots, national forest parks and world natural & cultural heritage sites. This section will introduce the studies on remote sensing monitoring of the first three types, i.e., nature reserves, biodiversity conservation areas and ecological functional areas.
3.2.1. Nature Reserves
Nature reserves are special geographical entities designated to protect important ecosystems, save endangered species or protect natural historical heritages. They play a vital role in the sustainable development of ecological balance. Remote sensing for monitoring nature reserves has been implemented mainly from two aspects.
The first is to monitor land use/cover change (LUCC) in nature reserves. The international satellite datasets, especially the long time-series of Landsat images, were widely used for LUCC monitoring, either by conducting image classifications based on original satellite images [12] or by directly using available products such as EVI provided by NASA [54]. Besides that, scholars applied the domestic HJ-1A/1B CCD data to monitor the dynamics of LUCC and proved that the performance of HJ-1A/1B CCD data was similar to that of Landsat TM data [55].
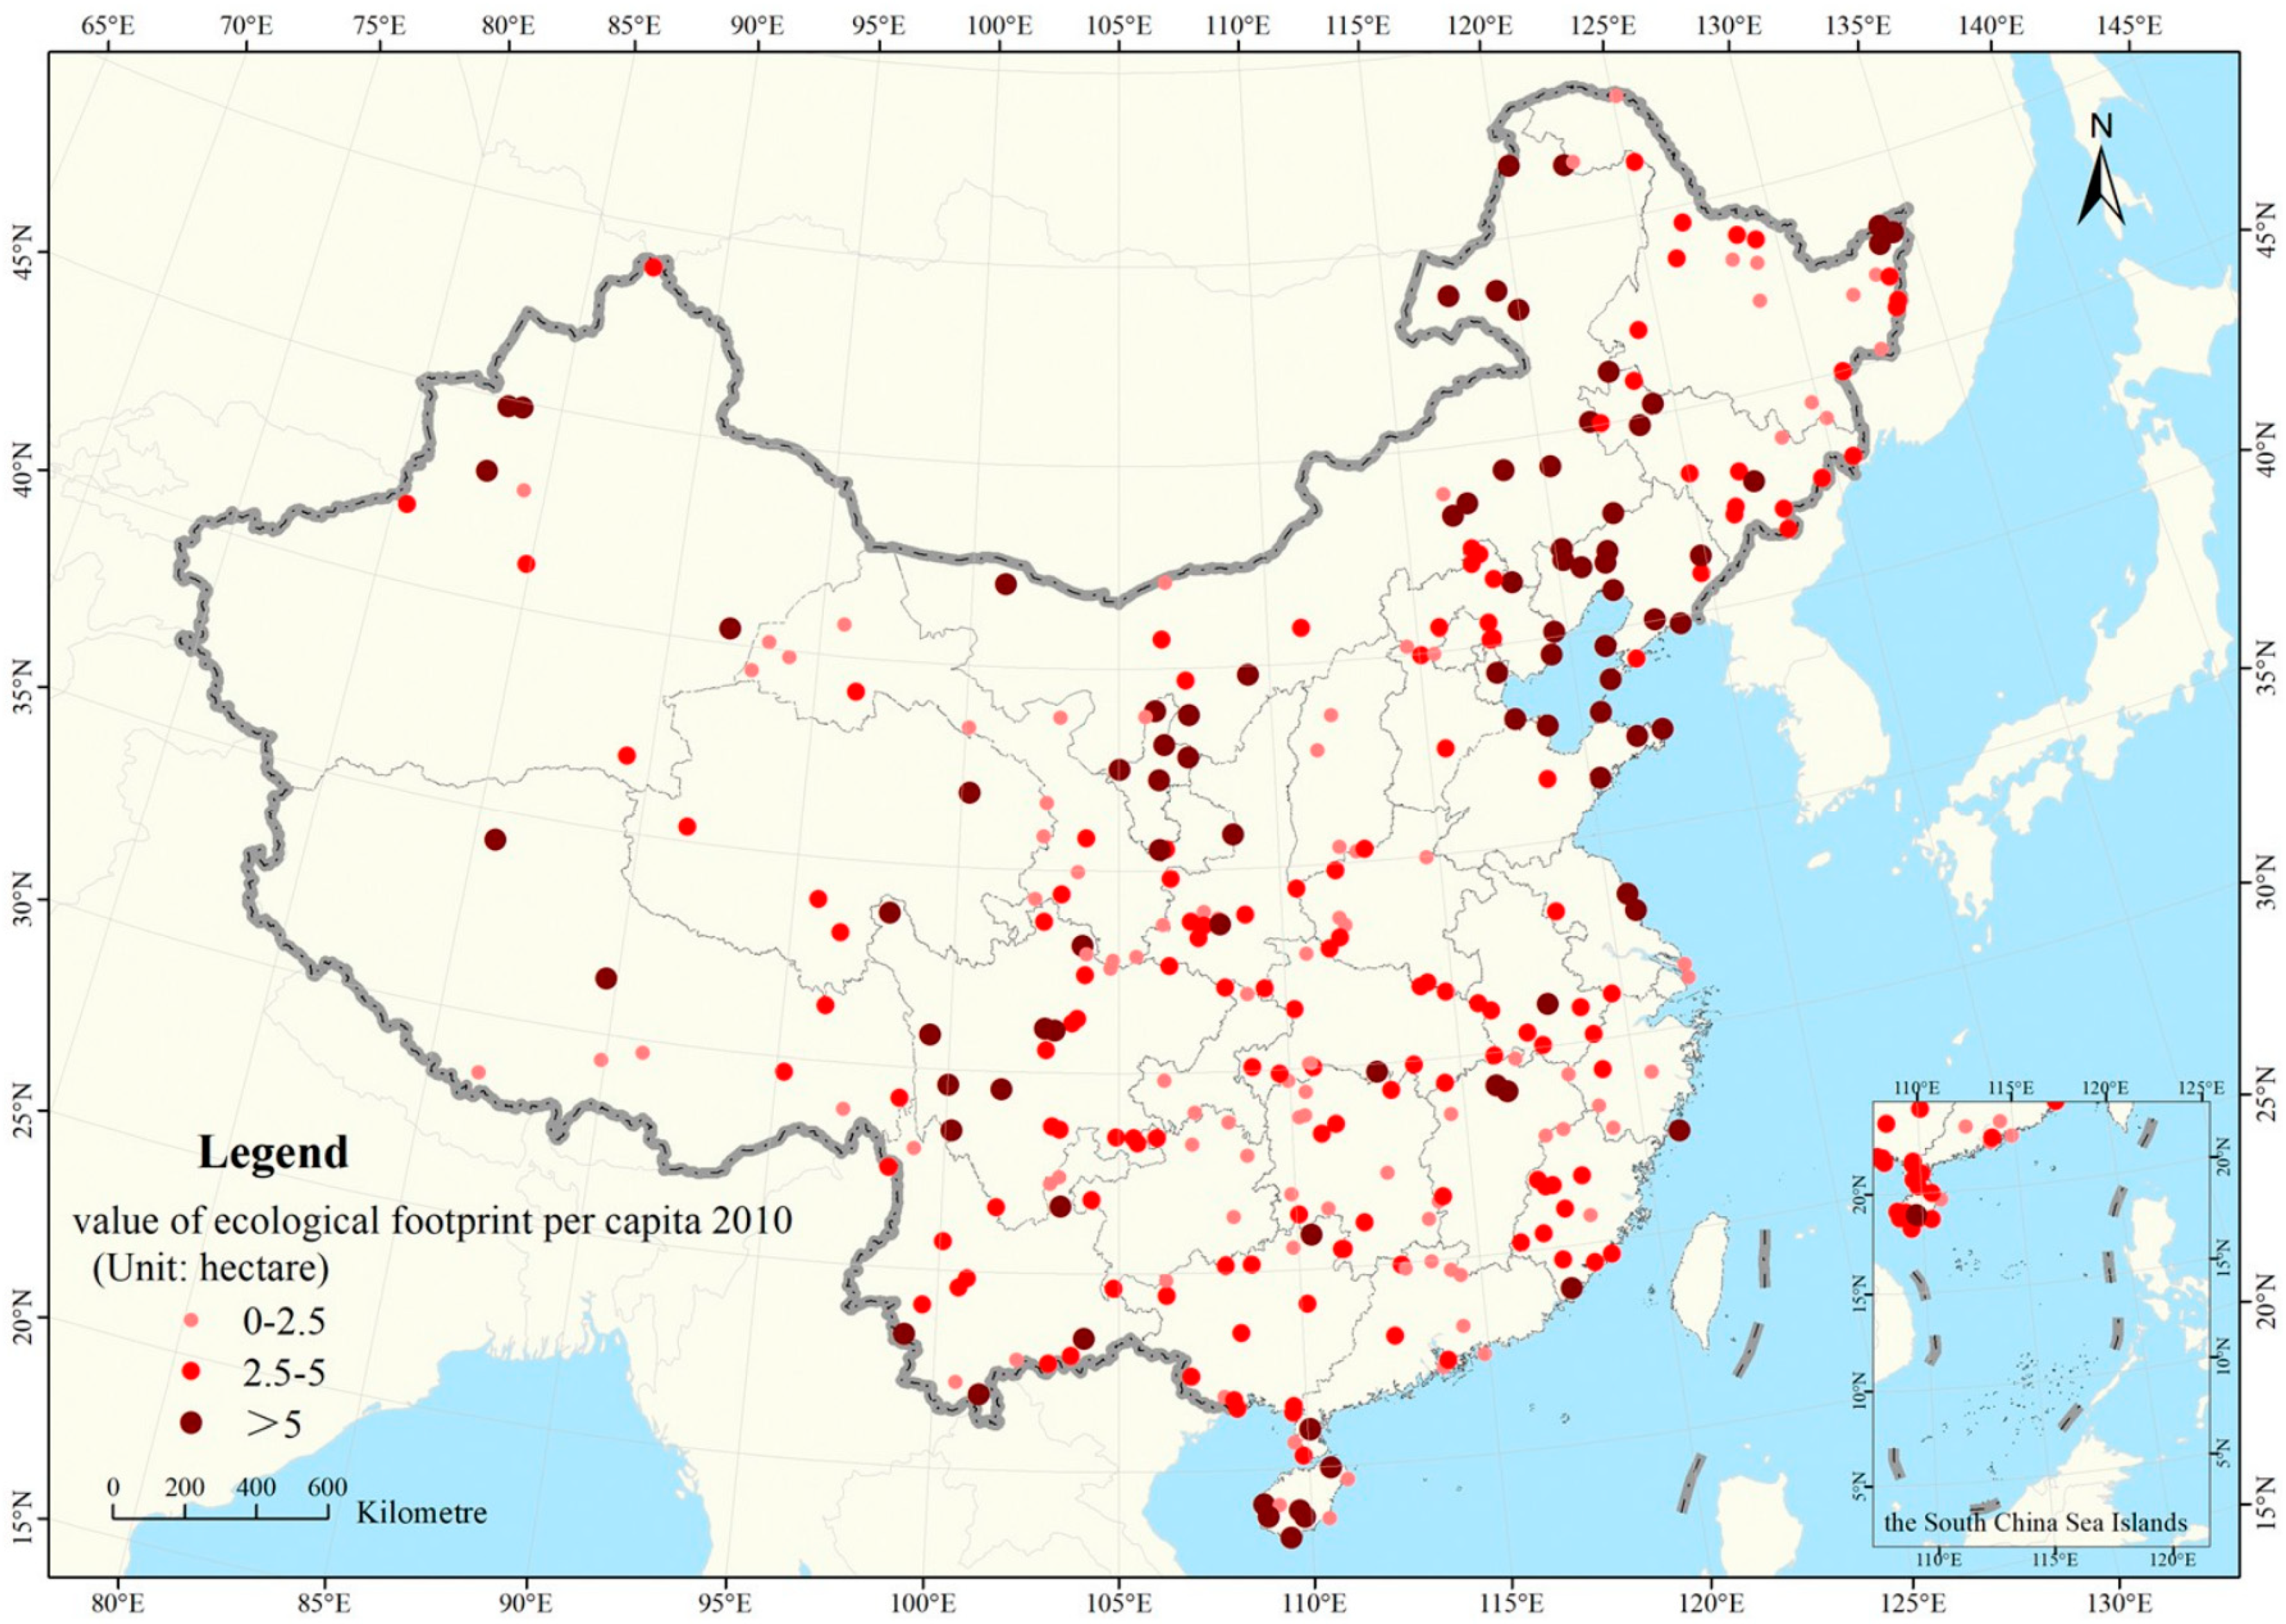
On the other hand, the ecological and environmental changes in nature reserves were analyzed by analyzing human activities. According to the characteristics of land use, the land types caused by human activities are classified based on remote sensing images, and then the human activities in nature reserves are analyzed by exploring the spatial distribution of those types of land [56,57]. These are the proxy analysis methods which take some specific types of land parcels as the proxy of human activities. Another type of method is to construct a human activity impact index based on the industrial, agricultural, tourism, traffic land classes and so on, and further to evaluate the impact of human activities on nature reserves [58,59]. In addition, some scholars tried the integrated use of remote sensing and location-aware data to analyze the impacts of human activity on the ecological status of nature reserves, which showed the possibility of evaluating human–land interaction at a fine-grained scale [1]. The ecological footprint model is also an effective way to evaluate the ecological change and its spatial distribution [60]. Figure 3 plots the ecological footprint of 319 National Nature Reserves of China in 2010.
3.2.2. Biodiversity Conservation Priority Areas
Biodiversity refers to the diversity of life in all forms, levels and unions of organisms on the Earth, generally including three levels: genetic diversity, species diversity, and ecosystem diversity. Remote sensing technologies are widely used to monitor human activities, biological species, biodiversity levels and vegetation cover in biodiversity conservation priority areas (BCPA). The human disturbance index can be defined on the basis of the remote sensing of land classification to monitor and assess the human disturbance in BCPA [61]. An example of biological species monitoring is to extract the invasive species named Canadian goldenrod using the spectral angle classification method from the HJ-1A HIS hyperspectral data in Yixing, Jiangsu Province [62]. Yang et al. [63] presented a monitoring and evaluation method for biodiversity at the county level, and monitored the temporal and spatial biodiversity changes in Nanzhang County of Hubei Province, China, as shown in Figure 4. Vegetation cover is also an important element of reflecting the ecological status of BCPA, and remote sensing plays a key role in monitoring the spatiotemporal change of vegetation cover [64].
3.2.3. National Key Ecological Functional Region
The National Key Ecological Functional Zones (NKEFZ) refers to the areas with special protection and restricted exploitation. They are set up to protect, restore and improve the important ecological functions of specific regions including regional water and soil conservation, wind and sand control, flood regulation and storage, and to maintain and improve their function to provide various ecological services and products. It is related to the coordinated development of economic, social and ecological protection in the region, and the balanced development of the western region and other regions in China [65]. Remote sensing can provide support for the monitoring and managing of national key ecological functional zones. An important work is to quantitatively assess the ecological services from human activities and climate. There are four types of national key ecological services, including water conservation, water and soil conservation, wind break and sand fixation, and biodiversity maintenance. These ecological services can be assessed by the models based on remote sensing datasets and ground-observed meteorological data [66], e.g., the water conservation service assessment as shown in Figure 5. Another important work is ecological function assessment. Remote sensing can be used to evaluate ecological functions from the following aspects: ecosystem distribution, landscape change and ecological function index [67]. Besides that, scholars monitored the change of ecological elements in NKEFZ during a special event such as an earthquake. For example, the vegetation coverage in China’s Qianfoshan National Forest Park was monitored using multi-temporal remote sensing images, and the forest damage and restoration condition was evaluated [68].
3.3. Remote Sensing Monitoring of Rural Areas
With the acceleration of China’s urbanization process, the rural economy has developed to a certain extent, but its developing methods are extensive, which has caused some negative impacts on its environment, such as the disorderly discharge of pollutants. The contents of rural environment monitoring mainly include solid waste, greenhouse film, soil pollution and aquaculture pollution.
The first is the solid waste monitoring. The interpretation signs of solid waste dumps on high-resolution images was established based on learning samples, and then the interpretation analysis and change detection of informal waste dumps were carried out through the human–computer interaction and automatic change detection methods [69,70]. The informal waste dumps can be easily identified by comparing with the authorized waste dump sites, and this method provides technical and data support for rural environment management.
Another method is research on greenhouse film monitoring, which is composed of three main types of methods. (1) The detection methods based on multi-source datasets. The coverage area of greenhouse film in the village areas of Guilin City was detected based on Google Earth high-resolution remote sensing images and DEM data [71]. (2) The index-based methods. A plastic greenhouse film index (PGI) was proposed by [72] based on the spectral, sensitivity, and separability analysis of plastic greenhouse films using medium-resolution images, and the PGI results in a sample area in Weifang City, Shandong Province, China is shown in Figure 6. (3) The machine learning methods. It was found by [73] that the support vector machine classification method works well for detecting plastic greenhouse film information.
Remote sensor monitoring of soil pollution is mainly based on hyperspectral images, because the hyperspectral remote sensing is able to obtain the quantitative information of soil composition (e.g., organic matter, minerals) due to the characteristics of high spectral resolution. A commonly used method is partial least squares regression modeling between the soil pollution concentration and hyperspectral data using the sample data from field work. The obtained model is then used to derive the pollution concentration in other locations [74,75]. Another method is stepwise regression modeling. First, the feature spectral bands is obtained by first derivative, inverse-log and continuum removing on original bands, and then the correlation between the soil pollution concentration and feature spectral bands is established using the sample data and applied for monitoring [76,77].
Scholars also conducted work on aquaculture monitoring by remote sensing. The information of aquaculture land can be extracted by various interpretation methods from high-resolution or medium-resolution images for multiple time periods, and the spatial and temporal evolution patterns of coastal aquaculture land are further studied using the models including single land use dynamic, gravity center of migration and landscape fragmentation [78,79].
3.4. Remote Sensing Monitoring of Urban Areas
At present, more than half of the world’s population lives in cities. As the urbanization process continues, this proportion will reach 66% in 2050, so the urban environment is vital to human survival. This section will elaborate on the progress of urban environment remote sensing monitoring in China from five aspects: urban heat island, urban green space, urban impervious surface, urban built-up area expansion and urban environment quality.
The research on urban heat islands is documented as follows. The first type of work was to study heat islands based on indexes. Scholars used the LST inversion algorithms to obtain urban surface temperature from remote sensing images, and then constructed indexes such as the urban heat island ratio index, and the thermal field variation index to evaluate the heat island intensity [80,81,82]. The second type of work investigated the pattern of the thermal environment from multi-period datasets. From the perspective of spatial dimensions, the spatial distribution characteristics of urban islands are analyzed, and from the perspective of temporal dimension, the evolution characteristics of urban islands with time are analyzed based on the urban LST at multiple periods [83,84]. Another important aspect of the research explored the driving mechanism of heat islands. On the one hand, the LST information was obtained from thermal bands and atmospheric parameters; and on the other hand, the land use and cover (industrial land, farmland, woodland), and landscape pattern were derived from optical bands. A correlation analysis was conducted among them to identify the important correlation factors relevant to heat islands [81,85].
Urban green space information is also an important indicator reflecting urban environment status. A commonly used method of extracting urban green space is the pixel-based classification method. For example, the method of stepwise hierarchical classification methods was adopted to extract the urban green area in Kunming City, and it was conducted in the unit of pixel [86]. In order to solve the “salt-and-pepper” phenomenon, an object-oriented urban green land extraction method was proposed by incorporating texture information [87]. Scholars also used the spectral mixing model for urban green space extraction. For example, the vegetation coverage can be extracted by the linear spectral mixing model based on Landsat ETM/ETM+ data [88,89]. In addition, the NDVI and pixel dichotomy models were used to retrieve the vegetation coverage of Guangzhou City based on Landsat 8 OLI data, and it was found that the dichotomy model was a more accurate method of monitoring vegetation coverage than statistical methods [90].
The impact of urban imperviousness on urban temperature or water cycling cannot be ignored. In the urban environment, a pixel is assumed to be the mix of multiple components (endmembers), and the spectral value of a pixel is the linear combination of spectral values of every endmember. Therefore, most scholars use the linear spectral unmixing model to extract imperious surface cover from remote sensing images. Furthermore, the relationship between the impervious surface and the surface temperature in cities was studied to provide scientific reference for urban planning and environmental evaluation [91,92,93,94,95]. Considering that most existing methods compute the impervious surface ratio according to multi-level administrative units rather than watersheds, [96] proposed to carry out urban hydrological modeling and impermeability ratio calculation on multi-level units through the interconnection of multiple urban water systems by calculating the dynamic impermeability based on urban DEM analysis as shown in Figure 7.
Another type of work is to monitor the expansion of urban built-up areas. A large number of studies were conducted on urban built-up area extraction and expansion monitoring from coarse, medium and high-resolution remote sensing images, but most of the recent advances are focused on the high-resolution approaches or fusion approaches based on multisource datasets [97]. For instance, a fusion approach based on the use of multisource remotely sensed data, i.e., the DMSP-OLS nighttime light data, the MODIS land cover product and Landsat 7 ETM+ images, was proposed by [98] in order to accurately extract urban built-up areas. In addition, [10] developed an urban built-up area extraction method to better differentiate suburban boundaries and ensure the integrity of land cover types, with the impervious surface of Beijing shown in Figure 8.
The remote sensing assessment of urban environment quality refers to evaluating urban environment quality based on a variety of environment indicators that can be obtained by remote sensing. [99] constructed the remote sensing environment index based on four indicators: greenness, humidity, dryness and heat, and used it to evaluate the environment quality of Weinan City in 1995–2015 using Landsat data. In contrast, [100] established an environment index based on the net primary productivity, vegetation fraction, LST and bareness fraction, and evaluated the dynamic changes of environment quality in Yixing city, Jiangsu Province.
3.5. Remote Sensing Monitoring of MiningAreas
The exploitation of mineral resources is destructive to the mining area and the surrounding environment. In the process of open-pit mining, the mines occupy a large area of forests, grasslands, and farmlands, etc. In addition, soil erosion may be caused in these areas with a certain slope. Remote sensing can effectively monitor the environment in mining areas and provide a scientific basis for the effective restoration of the environment.
On the one hand, remote sensing is used to monitor ecological damage and its impacts on the mining area environment during the mining process. An important monitoring object is vegetation and landscape pattern. Scholars used the vegetation index and landscape index to reflect the ecological status from remote sensing images and to evaluate the impact of mining processes on different mining scales and stages, and on different types of vegetation [101,102,103]. Land degradation is also a type of ecological damage caused by mining. The analytic hierarchical process method was used to build up an evaluation index system of land degradation, which is useful for evaluating the intensity of land degradation [104]. Moreover, the soil pollution can be monitored. For example, a product band transformation method was proposed by [105] to study the relationship between the soil zinc concentration and spectral value of ASTER data. Remote sensing can also help monitor the dynamic distribution of coal and gangue. The spectral reflectance characteristics of coal and gangue were first calculated by machine learning from a number of positive and negative samples, and then used to extract the distribution of coal and gangue in real time [106]. A typical application case was the Heidaigou coal mine in Northwestern China (Figure 9).
Many approaches to the land reclamation of mine sites have been conducted to relieve the damaging effects of coal mining and restore the landscape and its immediate surroundings. Remote sensing can be used to monitor the restoration effect on a landscape pre and post reclamation. Based on landscape ecological theories, remote sensing and GIS technology can be used to construct a landscape ecological quality assessment model to quantitatively evaluate the eco-environment status in the coal mining area and its spatial–temporal change as the restoration measures continues [107,108,109,110,111]. The evaluation is conducted from various aspects including grass cover, forest cover, wetland cover, landscape fragmentation, biological abundance, river density and so on.
4. Discussion
4.1. Major Challenges of Remote Sensing of Environment in China
Although a lot work has been done in remote sensing for environmental monitoring in China, including launching a series of satellites, conducting much research work and making positive policies, some challenges still need to be paid attention to.
(1) Satellite sensor problems. There is a lack of thermal infrared sensors with short revisit cycles and wide imaging swath in China’s remote sensing satellite system. The performance of thermal infrared sensors (such as signal-to-noise ratio) needs to be improved, otherwise it would affect the accuracy of parameter inversion. In addition, more hyperspectral satellite sensors are in need, especially the ones with larger imaging swath.
(2) Integrated use challenge of remote sensing datasets. China is a vast country with very different natural and climatic conditions across regions. For example, the northwestern region is the Gobi landform with few clouds, while the southwestern region could contain cloudy and rainy mountainous regions at the same time. There is an urgent need for the integrated use of various kinds of remote sensing datasets to satisfy such a geographically heterogeneous country. Currently, the environmental monitoring by remote sensing is mainly based on multi-spectral data with only a limited number of wide bands, while the hyperspectral, microwave and Laser Detection and Ranging (LIDAR) data are not fully applied. Therefore, the performance of monitoring and evaluating environment status is limited.
(3) Uncertainty in the remote sensing of ecological variables. For instance, since a mixed pixel contains several materials, the retrieved land surface temperature is the average of materials within the mixed pixel. What’s more, the retrieval models are usually simplified and empirical, which further enlarges the uncertainty.
(4) Scaling effect problems. As for temporal scale, remote sensing observation is instantaneous, but the application analysis is usually conducted at a daily rate. Currently, the linear relationship is commonly used to transfer the instantaneous scale to the daily scale. However, the changes in temperature, wind speed, humidity and surface roughness make the actual situation more complicated. As for the spatial scale, most of the retrieving models assume a uniform surface, but the surface is highly heterogeneous. It is difficult to accurately represent the physical status of a region using only a few site observation data as the inputs of models. In addition, the authenticity test is important to verify the applicability of remote sensing retrieving models and model optimization. At present, the ground truth data are point-observation data, thus it is difficult to verify the pixel-unit remote sensing estimation results using the point-observation ground truth data.
(5) Low degree of automation. Few products can be used for operational application in environment monitoring. The applications in the fields of monitoring natural reserve, biodiversity reserve, environmental damage and environmental status assessment, are relatively automated. Most of others depend on semi-automatic processes which require many manual interpretations.
(6) Weak ability of forecasting and comprehensive analysis. Remote sensing of the environment focuses more on monitoring, but the ability to predict environmental trends is insufficient, and the comprehensive ability to analyze the quality and status of environment based on remote sensing is still lacking.
(7) Lack of computational power for massive remote sensing data. In many application cases of environmental monitoring, the number of remote sensing images is significantly large, especially for large-extent and high-frequency monitoring needs. Although the Google Earth Engine is a possible solution to this problem, we still have a long way to go.
4.2. Outlook of Remote Sensing of Environment in China
Although China has made great achievements in improving the environment, it still now faces serious environmental pressure. The environmental degradation occurs frequently due to economically motivated activities. To maintain environmental safety, lucid waters and lush mountains, it is very necessary for China to strengthen the protection and supervision of the environment with remote sensing technology, especially for the China Ecological Conservation Red Line (ECRL), implying the areas which have especially important ecological functions and must be carefully protected. Currently, the Ministry of Ecology and Environment of China, is carrying out remote sensing supervision for ECRL and national parks [112].
Nevertheless, in view of the existing problems, the following directions are issued so as to promote the technological development and meet the requirements of national environment management.
(1) Promoting multi-source data fusion. Multi-source remote sensing data can make up for the shortcomings of the single type of data on temporal resolution, spatial resolution or spectral resolution and provide complementary information. Therefore, how to estimate ecological index using multi-source data fusion including remote sensing data, ecological data, environmental data, meteorological data, social and economic data, is an important direction.
(2) Improving the retrieval accuracy of remote sensing parameters. Considering the uncertainty of the remote sensing retrieval process, the accuracy of ecological parameter retrieval is improved by optimizing models and developing land surface data assimilation systems. Presently, the ecological index retrieval is mainly based on the relationship between remote sensing data and ground-measured data. Verification relies on measured data, but there are also errors in the process of obtaining in-situ data. Thus, the accurate evaluation of model retrieval and how to reduce the dependence degree of retrieval models on ground-measured data are research directions in the future.
(3) Modelling of scale effect. The scale effect is the main problem that remote sensing of the environment needs to face. The accuracy of remote sensing retrieval is related to the spatial and temporal resolution of the dataset used. Therefore, it is necessary to select an appropriate spatiotemporal scale according to the requirements, and further select an available remote sensing dataset.
(4) Improving the level of production automation. Besides the accuracy of products, the state and the public also have high requirements in the timeliness of products in many application scenarios, which directly impacts the quality of applications. A focus of future work will be to increase the automation level of remote sensing products through process optimization, customized function development and aggregating computational resources.
(5) Enhancing the ability of forecasting and comprehensive analysis, shifting remote sensing of the environment from monitoring to a synthetic ability with monitoring and forecasting, and strengthening the comprehensive analysis of results are important directions for future work.
(6) Promoting open access to satellite datasets. At present, China’s satellite data resources are mainly concentrated in the China Center for Resources Satellite Data and Application, and a few ministries and agencies. The colleges, research institutions and the public have a relatively poor accessibility to domestic satellite data. It is necessary to formulate relevant policies and protocols to increase the openness of satellite data, to promote applications, and to enhance information dissemination.
(7) Implementing ECRL supervision by remote sensing. There is an urgent need to supervise the ECRL in constructing the national ecological safety and ecological civilization, which can effectively restrain ecological damage in China and provide a reference for other countries.
Author Contributions
J.L. and S.Z. conceived and designed the review, and wrote most of the manuscript. Y.P., R.X. and X.S. collected the materials. C.Z. wrote Section 2.2, Section 3.1.1 and Section 3.5. All authors provided critical feedback on the manuscript. All authors have read and agreed to the published version of the manuscript.
Funding
This research was funded by the National Key R&D Program of China (No. 2017YFB0503905), National Natural Science Foundation of China (No. 41901291), the Major Projects of High Resolution Earth Observation Systems of National Science and Technology (No. 05-Y30B01-9001-19/20-1) and Yueqi Young Scholar Project of China University of Mining and Technology at Beijing.
Conflicts of Interest
The authors declare no conflict of interest.
References
- Li, J.; Zhang, Y.; Qin, Q.; Yan, Y. Investigating the Impact of Human Activity on Land Use/Cover Change in China’s Lijiang River Basin from the Perspective of Flow and Type of Population. Sustainability 2017, 9, 383. [Google Scholar] [CrossRef] [Green Version]
- Muraoka, H.; Ishii, R.; Nagai, S.; Suzuki, R.; Motohka, T.; Noda, H.M.; Hirota, M.; Nasahara, K.N.; Oguma, H.; Muramatsu, K. Linking Remote Sensing and In Situ Ecosystem/Biodiversity Observations by “Satellite Ecology”; Springer: Tokyo, Japan, 2012; pp. 277–308. [Google Scholar]
- Zhao, S.; Wang, Q.; Li, Y.; Liu, S.; Wang, Z.; Zhu, L.; Wang, Z. An overview of satellite remote sensing technology used in China’s environmental protection. Earth Sci. Inform. 2017, 10, 137–148. [Google Scholar] [CrossRef]
- Zhao, S.; Qin, Q.; Zhang, F.; Wang, Q.; Yao, Y.; You, L.; Jiang, H.; Cui, R. Research on Using a Mono-Window Algorithm for Land Surface Temperature Retrieval from Chinese Satellite for Environment and Natural Disaster Monitoring(HJ-1B) Data. Spectrosc. Spectr. Anal. 2011, 31, 1552–1556. [Google Scholar] [CrossRef]
- Lian, J.; Huang, M.; Li, X.; Liu, W. Evapotranspiration estimation for oasis transect in middle reach of Heihe river basin based on remote sensing. Trans. Chin. Soc. Agric. Eng. 2014, 30, 120–129. [Google Scholar] [CrossRef]
- Mao, K.; Yang, J.; Han, X.; Tang, S.; Yuan, Z.; Gao, C. Retrieving land surface temperature based on deep dynamic learning NN algorithm and radiation transmission model. China Agric. Inform. 2018, 30, 47–57. [Google Scholar] [CrossRef]
- Yue, W.; Xu, J.; Xu, L. An analysis on eco-environmental effect of urban land use based on remote sensing images: A case study of urban thermal environment and NDVI. Acta Ecol. Sin. 2006, 26, 1450–1460. [Google Scholar] [CrossRef]
- Liu, G.; Zhang, L.; Zhang, Q. Trajectory and Driving Forces of Change in Farmland in Nanjing During the Period From 1985 to 2010. J. Ecol. Rural Environ. 2013, 29, 688–694. [Google Scholar] [CrossRef]
- Xiao, J.; Liao, X.; Wang, T. Cultivated Land Use Changes in Hunan Based on Remote Sensing. Hunan Agric. Sci. 2014, 52–54. [Google Scholar] [CrossRef]
- Meng, Q.; Zhang, L.; Sun, Z.; Meng, F.; Wang, L.; Sun, Y. Characterizing spatial and temporal trends of surface urban heat island effect in an urban main built-up area: A 12-year case study in Beijing, China. Remote Sens. Environ. 2018, 204, 826–837. [Google Scholar] [CrossRef]
- Zhao, S.; Liu, S.; Liu, Q.; Wu, Y.; Wu, D. Progress of Urban Ecological Environment Monitoring by Remote Sensing in China. Ecol. Environ. Sci. 2019, 28, 1261–1271. [Google Scholar] [CrossRef]
- Nie, Y.; Zhang, Y.; Liu, L.; Zhang, J. Monitoring Glacier Change Based on Remote Sensing in the Mt. Qomolangma National Nature Preserve,1976-2006. Acta Geogr. Sin. 2010, 65, 13–28. [Google Scholar]
- Li, R.; Zhu, B.; Tong, X.; Yue, Y.; Gan, H.; Wan, S. Change analysis in Hainan Dongzhai Wetland Reserve based on remote sensing data obtained during 2002-2013. Remote Sens. Land Resour. 2017, 29, 149–155. [Google Scholar] [CrossRef]
- Zhao, Y.; De, S.; Bao, Y.; Yang, W.; Zhao, C.; Bai, Y.; Zhao, Y. Dynamic Monitoring of Fractional Vegetation Cover of Eco-Function Area of Grassland on Northern Foot of Yinshan Mountains through Remote Sensing Technology. Res. Environ. Sci. 2017, 30, 240–248. [Google Scholar] [CrossRef]
- Wang, C.; Zhang, D.; Ren, W. Comparison of Vegetation Coverage Extracting Based on MODIS Data. J. Atmos. Environ. Opt. 2010, 05, 457–462. [Google Scholar] [CrossRef]
- Zhai, T.; Jin, G.; Deng, X.; Li, Z.; Wang, Y. Study of vegetation information extraction method based on Landsat8 satellite images. Sci. Surv. Mapp. 2016, 41, 126–131. [Google Scholar] [CrossRef]
- Zhao, B.; Zhang, Y. Study on Vegetation Information Extraction Method Based on Landsat-8 OLI Images. Geomat. Spat. Inf. Technol. 2018, 41, 79–82. [Google Scholar]
- Zhu, G.; Liu, Y.; Ju, W.; Chen, J. Evaluation of topographic effects on four commonly used vegetation indices. J. Remote Sens. 2013, 17, 210–234. [Google Scholar]
- Gao, G.; Yang, B.; Wang, L.; Cheng, L.; Li, D. Comparison of methods for extracting vegetation information from GF-1. Agric. Technol. 2017, 37, 46–47. [Google Scholar] [CrossRef]
- Qi, J.; Niu, S.; Ma, L.; He, H. Spatio-Temporal Variation of Vegetation Cover in Shule River Valley During 2000-2014. J. Ecol. Rural Environ. 2016, 32, 757–766. [Google Scholar] [CrossRef]
- Li, L.; Tian, M.; Liang, H.; Chen, Y.; Feng, C.; Qu, K.; Qian, J. Spatial and Temporal Changes of Vegetation Coverage and Influencing Factors in Hulun Buir Grassland During 2000-2016. J. Ecol. Rural Environ. 2018, 34, 584–591. [Google Scholar] [CrossRef]
- Zhao, S.; Yang, Y.; Qiu, G.; Qin, Q.; Yao, Y.; Xiong, Y.; Li, C. Remote detection of bare soil moisture using a surface-temperature-based soil evaporation transfer coefficient. Int. J. Appl. Earth Obs. Geoinf. 2010, 12, 351–358. [Google Scholar] [CrossRef]
- Yao, Y.; Qin, Q.; Zhao, S.; Shen, X.; Sui, X. New Index for Soil Moisture Monitoring Based on ∆Ts-Albedo Spectral Information. Spectrosc. Spectr. Anal. 2011, 31, 1557–1561. [Google Scholar] [CrossRef]
- Yu, F.; Zhao, Y.; Li, H. Soil moisture retrieval based on GA-BP neural networks algorithm. J. Infrared Millim. Waves 2012, 31, 283–288. [Google Scholar] [CrossRef]
- Zheng, X.; Sun, Y.; Qin, Q.; Ren, H.; Gao, Z.; Wu, L.; Meng, Q.; Wang, J.; Wang, J. Bare Soil Moisture Inversion Model Based on Visible-Shortwave Infrared Reflectance. Spectrosc. Spectr. Anal. 2015, 35, 2113–2118. [Google Scholar] [CrossRef]
- Gao, Z.; Wang, J.; Zheng, X.; Sun, Y.; Qin, Q. Soil Moisture Monitoring Based on Angle Dryness Index. Spectrosc. Spectr. Anal. 2016, 36, 1378–1381. [Google Scholar] [CrossRef]
- Li, J.; Dong, H.; Wang, X.; You, L. Reconstructing missing data in soil moisture content derived from remote sensing based on optimum interpolation. Remote Sens. Land Resour. 2018, 30, 45–52. [Google Scholar] [CrossRef]
- Yu, F.; Zhao, Y. A new semi-empirical model for soil moisture content retrieval by ASAR and TM data in vegetation-covered areas. Sci. China-Earth Sci. 2011, 54, 1955–1964. [Google Scholar] [CrossRef]
- Zhao, S.; Zhang, C.; Xiong, Y.; Xiong, W.; You, D.; Li, Y. Soil Moisture Mapping Using two Scenes SAR Imagery Without Knowing Information on Surface Parameters. J. Indian Soc. Remote Sens. 2016, 44, 651–656. [Google Scholar] [CrossRef]
- Zhang, Y.; Yu, Y.; Zhao, H.; Xuan, J. Retrieval method of soil moisture based on polarized information. Infrared Laser Eng. 2018, 47, 206–211. [Google Scholar] [CrossRef]
- Cheng, J.; Ji, W.; Zhou, Y.; Shi, Z. Soil bidirectional reflectance characteristics as affected by soil moisture. Acta Pedol. Sin. 2011, 48, 255–262. [Google Scholar]
- Li, Y.; Yang, W.; Tong, L.; Jian, J.; Gu, X. Remote Sensing Quantitative Monitoring and Analysis Fuel Moisture Content Based on Spectral Index. Acta Opt. Sin. 2009, 29, 1403–1407. [Google Scholar] [CrossRef]
- Pan, P.; Yang, W.; Jian, J.; Dai, X. Remote Sensing Retrieval Model of Vegetation Moisture Content Based on Spectral Index: A Case Study in Maoergai of Mibjiang River’ Upstream. Remote Sens. Inf. 2013, 28, 69–73. [Google Scholar]
- Wen, Y.; Huang, C.; Lu, L.; Gu, J. Theretrieval of Vegetation Water Content based on ASTER Images in Middle of Heihe River Basin. Remote Sens. Technol. Appl. 2015, 30, 876–883. [Google Scholar] [CrossRef]
- Zhao, S.; Wang, Q.; Yao, Y.; Du, S.; Zhang, C.; Li, J.; Zhao, J. Estimating and Validating Wheat Leaf Water Content with Three MODIS Spectral Indexes: A Case Study in Ningxia Plain, China. J. Agric. Sci. Technol. 2016, 18, 387–398. [Google Scholar]
- Song, X.; Ma, J.; Li, X.; Leng, P.; Zhou, F.; Li, S. Estimation of vegetation canopy water content using Hyperion hyperspectral data. Spectrosc. Spectr. Anal. 2013, 33, 2833–2837. [Google Scholar] [CrossRef]
- Bastiaanssen, W.G.; Menenti, M.; Feddes, R.A.; Holtslag, A.A.M. A remote sensing surface energy balance algorithm for land (SEBAL): 1. Formulation. J. Hydrol. 1998, 212, 198–212. [Google Scholar] [CrossRef]
- Yu, W.; Ji, R.; Xu, D.; Jia, Q.; Feng, R.; Sun, L.; Wu, J.; Zhang, Y. Daily evapotranspiration estimation of Panjin wetland based on SEBAL model and its distribution characteristics. Sci. Soil Water Conserv. 2017, 15, 8–15. [Google Scholar] [CrossRef]
- Zhang, N.; Wang, W.; Wang, Y. Remote Sensing Estimation of Land Surface Evapotranspiration Based on HJ-1B Data and SEBAL Model. Geospat. Inf. 2013, 11, 69–73. [Google Scholar] [CrossRef]
- Zhao, H.; Zhao, Y.; Li, F.; Zhang, H. Modelling evapotranspiration in provincial regions based on FY-3/VIRR remote sensing data. Trans. Chin. Soc. Agric. Eng. 2014, 30, 111–118. [Google Scholar] [CrossRef]
- Su, B. The Surface Energy Balance System (SEBS) for Estimation of Turbulent Heat Fluxes. Hydrol. Earth Syst. Sci. 1988, 6, 85–99. [Google Scholar] [CrossRef]
- Yang, Y.; Feng, Z.; Zhou, J. Evapotranspiration in Heihe River Basin based on SEBS model. J. Lanzhou Univ. 2008, 44, 1–6. [Google Scholar] [CrossRef]
- Ma, Q.; Liu, X.; Li, Y.; Wang, Y.; Wu, J. Estimation and Spatio-Temporal Distribution of Evapotranspiration in Small-Scaled Catchments in Subtropics of China Based on Landsat 8 Data. J. Ecol. Rural Environ. 2016, 32, 901–907. [Google Scholar] [CrossRef]
- Wen, Y.; Guo, Q.; Wang, Y. Evapotranspiration and the Factors Affecting It in Chakou Basin Studied with the SEBS Model. J. Irrig. Drain. 2018, 37, 80–87. [Google Scholar] [CrossRef]
- Allen, R.G.; Tasumi, M.; Trezza, R. Satellite-Based Energy Balance for Mapping Evapotranspiration with Internalized Calibration (METRIC)—Model. Hydrol. Earth Syst. Sci. 2007, 4, 380–394. [Google Scholar] [CrossRef]
- Yu, J.; Yao, Y.; Zhao, S.; Jia, K.; Zhang, X.; Zhao, X.; Sun, L. Estimating latent heat flux over farmland from Landsat images using the improved METRIC model. Remote Sens. Land Resour. 2018, 30, 83–88. [Google Scholar] [CrossRef]
- He, L.; Wang, Y.; Bie, Q.; Fang, J.; Zhao, C. Estimation of field evapotranspiration in the middle reaches of Heihe River basin based on SEBS-METRIC Method. J. Lanzhou Univ. 2013, 49, 504–510. [Google Scholar] [CrossRef]
- Yao, Y.; Qin, Q.; Fadhil, A.M.; Li, Y.; Zhao, S.; Liu, S.; Sui, X.; Dong, H. Evaluation of EDI derived from the exponential evapotranspiration model for monitoring China’s surface drought. Environ. Earth Sci. 2011, 63, 425–436. [Google Scholar] [CrossRef]
- Qin, Z.; Karnieli, A.; Berliner, P. A mono-window algorithm for retrieving land surface temperature from Landsat TM data and its application to the Israel-Egypt border region. Int. J. Remote Sens. 2001, 22, 3719–3746. [Google Scholar] [CrossRef]
- Meng, X.; Li, H.; Du, Y.; Cao, B.; Liu, Q.; Li, B. Retrieval and validation of the land surface temperature derived from Landsat 8 data: A case study of the Heihe River Basin. J. Remote Sens. 2018, 22, 857–871. [Google Scholar] [CrossRef]
- Zhu, Z.; Cheng, P.; Gui, X.; Teng, Y.; Tong, C. Overview of Surface Temperature Inversion Algorithm. Geomat. Spat. Inf. Technol. 2016, 39, 70–75. [Google Scholar]
- Sun, J.; Zhao, P.; Ye, Q. A Split-window Algorithm for Retrieving Land Surface Temperature from ASTER Data. Remote Sens. Technol. Appl. 2012, 27, 728–734. [Google Scholar]
- Ye, X.; Ren, H.; Liu, R.; Qin, Q.; Liu, Y.; Dong, J. Land Surface Temperature Estimate from Chinese Gaofen-5 Satellite Data Using Split-Window Algorithm. IEEE Trans. Geosci. Remote Sens. 2017, 55, 5877–5888. [Google Scholar] [CrossRef]
- Kan, A.; Wang, X.; Gao, Z.; LI, G. Vegetation spatio-temporal changes and driving factors in the Mt. Qomolangma Nature Reserve in 2000-2007. Ecol. Environ. Sci. 2010, 19, 1261–1271. [Google Scholar] [CrossRef]
- Liu, Q.; Liu, G.; Huang, C.; Zong, X. Using Remote Sensing Data to Monitor Dynamic Changes of Nature Reserve of the Yellow River Delta. Chin. Agric. Sci. Bull. 2010, 26, 376–381. [Google Scholar]
- Zhang, H.; Zang, S.; Zhang, Y.; Su, D.; Xie, R. Research on the impact of land use activities on nature reserves: Heilongjiang Province as a case. Environ. Sci. Technol. 2015, 38, 271–276. [Google Scholar] [CrossRef]
- Liu, X.; Li, J.; Liu, Y.; Liu, H.; Wen, R. Method for supervising and assessing of human activities in nature reserve based on sky and earth. China Environ. Sci. 2016, 36, 3135–3142. [Google Scholar] [CrossRef]
- Xu, W.; Qin, W.; Liu, X.; Xia, X.; Zhou, D.; Fan, L.; Jiang, M. Status Quo of Distribution of Human Activities in the National Nature Reserves. J. Ecol. Rural Environ. 2015, 31, 802–807. [Google Scholar] [CrossRef]
- Wang, K.; Tang, Y.; Wang, L.; Xinghua, W.U.; Yang, S. The monitoring and evaluation of protective effectiveness in Shibalichangxia Nature Reserve of Hubei based on Remote Sensing technology. J. Cent. China Norm. Univ. 2015, 49, 929–935. [Google Scholar] [CrossRef]
- Liu, X.; Fu, J.; Jiang, D.; Luo, J.; Sun, C.; Liu, H.; Wen, R.; Wang, X. Improvement of Ecological Footprint Model in National Nature Reserve Based on Net Primary Production (NPP). Sustainability 2018, 11, 16. [Google Scholar] [CrossRef] [Green Version]
- Liu, H.; Gao, J.; Zhang, H.; Ma, X.; Xu, X. Human Disturbance Monitoring and Assessment in the Biodiversity Conservation Priority Area China. J. Geo-Inf. Sci. 2017, 19, 1456–1465. [Google Scholar] [CrossRef]
- Wan, H.; Wang, C.; Li, Y.; Qiao, W.; Jing, L.; Liu, X. Monitoring an invasive plant using hyperspectral remote sensing data. Trans. Chin. Soc. Agric. Eng. 2010, 26, 59–63. [Google Scholar] [CrossRef]
- Yang, H.; Li, Y.; Hong, Y.; Zhu, H. Biodiversity Monitoring and Assessment Using Remote Sensing Technology at County’s Scale. Remote Sens. Technol. Appl. 2015, 30, 1138–1145. [Google Scholar] [CrossRef]
- Zhang, Z.; Xiong, K.; Huang, D. Analysis on the Spatiotemporal Change and Influence Factors of Vegetation Cover in Fanjingshan Mountain over the Last 30 Years. Res. Soil Water Conserv. 2018, 25, 183–189. [Google Scholar] [CrossRef]
- Huang, Y.; Zhao, C.; Yang, H.; Ding, F.; LI, Z. Spatial distribution and aggregation analysis of human activity in national key ecological function regions in China. Resour. Sci. 2016, 38, 1423–1433. [Google Scholar] [CrossRef]
- Zhai, J.; Yuping, L.; Peng, H.; Tong, X.; Cao, G. Water Conservation Service Assessment and Its Spatiotemporal Features in National Key Ecological Function Zones. Adv. Meteorol. 2016, 2016, 1–11. [Google Scholar] [CrossRef] [Green Version]
- Li, X. Ecological Function Evaluation of Changbai Mountain Ecological Function Area. Master’s Thesis, Yanbian University, Yanbian, China, 2016. [Google Scholar]
- Wang, Y.; Chen, H.; Wang, P. The Ecological Environment Change Monitoring in Earthquake Disaster Area Based on Remote Sensing. Surv. Mapp. 2018, 41, 76–78. [Google Scholar]
- Liu, Y.; Ren, Y.; Wei, C.; Wang, A.; Zhou, H.; Chi, Y. Study on monitoring of informal open-air solid waste dumps based on Beijing-1 images. J. Remote Sens. 2009, 13, 320–326. [Google Scholar] [CrossRef]
- Wang, C.; Yin, S.; Meng, B.; Ma, W.; Zhu, L.; Wu, C. Analysis of the non-regular garbage sites in the region of Beijing, Tianjin and Hebei using remote sensing monitoring images. Chin. High Technol. Lett. 2016, 26, 799–807. [Google Scholar] [CrossRef]
- Jiang, M.; Li, W.; Wen, J. Application of Satellite Image and Digital Elevation Model in Rural Environmental Quality Monitoring. Environ. Monit. China 2014, 30, 184–187. [Google Scholar] [CrossRef]
- Yang, D.; Chen, J.; Zhou, Y.; Chen, X.; Chen, X.; Cao, X. Mapping plastic greenhouse with medium spatial resolution satellite data: Development of a new spectral index. ISPRS-J. Photogramm. Remote Sens. 2017, 128, 47–60. [Google Scholar] [CrossRef]
- Qu, R.; Nie, Y.; Zhang, Y.; Xiong, W.; Lou, Q.; Teng, J. Study on Extraction of Plasticulture Basing on GF-1 of High Resolution Image of China. Environ. Sustain. Dev. 2018, 43, 66–69. [Google Scholar]
- Liu, H.; Zhang, L. A predictive model for the hyperspectral character of saltmarsh soil to its heavy metal content at Chongming Dongtan. Acta Ecol. Sin. 2007, 08, 3427–3434. [Google Scholar] [CrossRef]
- Cai, D.; Wu, Q.; Cao, X.; Meng, Y.; Zhou, L.; Liu, S.; Zhang, L. Quantitative Retrieval of Soil Heavy Metal Content in Longkou Wastewater Irrigation Area Based on HJ1A-HSI Images. Saf. Environ. Eng. 2015, 22, 33–39. [Google Scholar] [CrossRef]
- Gong, S.; Wang, X.; Shen, R.; Liu, Z.; Li, Y. Study on Heavy Metal Element Content in the Coastal Saline Soil by Hyperspectral Remote Sensing. Remote Sens. Technol. Appl. 2010, 25, 169–177. [Google Scholar]
- Xiao, J.; Wang, Y.; Zhao, W. Study on Soil Cd Monitoring in Sewage Irrigation Area by Hyperspectral Remote Sensing. South North Water Transf. Water Sci. Technol. 2013, 11, 62–66. [Google Scholar]
- Xu, Y.; Zhang, Z.; Wang, X.; Wen, Q.; Liu, F.; Li, N. Remote Sensing Monitoring and Temporal Variation Analysis of Coastal Aquaculture in Shandong Province in the Recent Three Decades. J. Geo-Inf. Sci. 2014, 16, 482–489. [Google Scholar] [CrossRef]
- Xia, L.; Liu, Z.; Xu, S. Estimation on pollution load and analysis on spatial characteristics of mariculture in Zhelin Bay. Guangdong Agric. Sci. 2017, 44, 151–157. [Google Scholar] [CrossRef]
- Luo, X.; Liu, M. Application analysis on the urban heat environment monitoring of Chongqing using HJ-1B satellite remotely sensed data. Sci. Sin. 2011, 41, 108–116. [Google Scholar] [CrossRef]
- Zhang, H.; Xu, H.; Li, L.; Fan, Y. Analysis of the Relationship between Urban Heat Island Effect and Urban Expansion in Chengdu, China. J. Geo-Inf. Sci. 2014, 16, 70–78. [Google Scholar] [CrossRef]
- Hou, H.; Ding, F.; Li, Q. Remote Sensing Analysis of Changes of Urban Thermal Environment of Fuzhou City in China in the Past 20 Years. J. Geo-Inf. Sci. 2018, 20, 385–395. [Google Scholar] [CrossRef]
- Chen, J.; Yang, X. A Study of Remote Sensing Monitoring of Urban Thermal Environment Based on ASTER Data. Remote Sens. Land Resour. 2011, 19, 100–105. [Google Scholar] [CrossRef] [Green Version]
- Liu, L.; Li, C.; Yin, J.; Zhao, J. Monitoring of Urban Thermal Environment in Shanghai Area from 1995 to 2012 Using Thermal Satellite Remote Sensing. Infrared Technol. 2016, 38, 53–58. [Google Scholar]
- Xu, S.; Li, F.; Zhang, L.; Zhou, L. Spatiotemporal changes of thermal environment landscape pattern in Changsha. Acta Ecol. Sin. 2015, 35, 3743–3754. [Google Scholar] [CrossRef] [Green Version]
- Huang, L. Study on Dynamic Monitoring Method of Urban Greening Land. Master’s Thesis, Kunming University of Science and Technology, Kunming, China, 2009. [Google Scholar]
- Meng, J.; Wang, J. Monitoring of urban ecological land use based on Gaofen-1 data. Sci. Surv. Mapp. 2016, 41, 33–37. [Google Scholar] [CrossRef]
- Zhang, C.; Yu, H.; Gong, P.; Ju, W. Relationship Between Land Brightness Temperature and Vegetation Abundance in Wuhan City. Sci. Geogr. Sin. 2009, 29, 740–744. [Google Scholar] [CrossRef]
- Tang, Z.; Zheng, H.; Ren, Z.; Cui, M.; He, X. Spatial and temporal changes to urban surface thermal landscape patterns: A case study of Changchun City. Acta Ecol. Sin. 2017, 37, 3264–3273. [Google Scholar] [CrossRef] [Green Version]
- Xiong, C. Vegetation Coverage Based on Landsat8 Images in Guangzhou. Ecol. Environ. Sci. 2015, 38, 383–386. [Google Scholar] [CrossRef]
- Xu, Y.; Liu, Y. Study on the thermal environment and its relationship with impervious surface in Beijing city using TM image. Ecol. Environ. Sci. 2013, 22, 639–643. [Google Scholar] [CrossRef]
- Tang, F.; Xu, H. Quantitative Relationship Between Impervious Surface and Land Surface Temperature Based on Remote Sensing Technology. J. Jilin Univ. 2013, 43, 1987–1996. [Google Scholar] [CrossRef]
- MaiMaiTiJiang, M.; Kasimu, A. Study on Land Surface Characteristics and Its Relationship with Land Surface Thermal Environment of Typical City in Arid Region. Ecol. Environ. Sci. 2015, 24, 1865–1871. [Google Scholar] [CrossRef]
- Chen, W.; Gao, X.; Liu, R.; He, Z. An Analysis on Urban Impervious Surface and Its Relation with Thermal Environments Based on Landsat 8. Geomat. Spat. Inf. Technol. 2015, 38, 92–95. [Google Scholar]
- Wang, Z.; Dong, B.; Chen, D. Surface Parameters Analysis of Shenyang Urban Heat Island Based on Landsat. Geomat. Spat. Inf. Technol. 2018, 41, 4–7. [Google Scholar]
- Shao, Z.; Fu, H.; Li, D.; Altan, O.; Cheng, T. Remote sensing monitoring of multi-scale watersheds impermeability for urban hydrological evaluation. Remote Sens. Environ. 2019, 232, 111338. [Google Scholar] [CrossRef]
- Gong, J.; Liu, C.; Huang, X. Advances in urban information extraction from high-resolution remote sensing imagery. Sci. China Earth Sci. 2020, 63, 463–475. [Google Scholar] [CrossRef]
- Ma, X.; Li, C.; Tong, X.; Liu, S. A New Fusion Approach for Extracting Urban Built-up Areas from Multisource Remotely Sensed Data. Remote Sens. 2019, 11, 2516. [Google Scholar] [CrossRef] [Green Version]
- Song, H.; Xue, L. Dynamic monitoring and analysis of ecological environment in Weinan City, Northwest China based on RSEI model. Chin. J. Appl. Ecol. 2016, 27, 3913–3919. [Google Scholar] [CrossRef]
- Wang, Z.; Li, J.; Yang, Y.; Li, H.; Wu, M.; Wang, K.; Shi, X.; Shi, W.; Xie, B. Quantitative Assess the Dynamic Change of Urban Ecological Environment Based on Remote Sensing-A Case Study in Yixing City, Jiangsu Province. J. Ningxia Univ. 2017, 38, 294–301. [Google Scholar]
- Wu, L.; Ma, B.; Liu, S. Analysis to vegetation coverage change in Shendong mining area with SPOT NDVI data. J. China Coal Soc. 2009, 34, 1217–1222. [Google Scholar] [CrossRef]
- Yao, F.; Guli, J.; Bao, A.; Zhang, J.; Li, C.; Liu, J. Damage assessment of the vegetable types based on remote sensing in the open coalmine of arid desert area. China Environ. Sci. 2013, 33, 707–713. [Google Scholar]
- Zha, D.; Shen, Z.; Liu, Z.; Liao, B.; Wang, W. Changes of ecological environment in the Dexing copper mine based on TM images. Remote Sens. Land Resour. 2015, 27, 109–114. [Google Scholar] [CrossRef]
- Yao, W.; Yu, J.; Lu, Y. Investigation and Assessment of Artificial Influencing Factors of Land Degradation in Shendong Coal Mining Area Based on ZY-3 Satellite Data. J. Ecol. Rural Environ. 2016, 32, 355–360. [Google Scholar] [CrossRef]
- Song, T.; Fu, X.; Chen, Y.; Wei, Y.; Wang, Q.; Cheng, X. Remote Sensing Inversion of Soil Zinc Pollution in Gejiu Mining Area of Yunnan. Remote Sens. Technol. Appl. 2018, 33, 88–95. [Google Scholar] [CrossRef]
- He, D.; Le, B.; Xiao, D.; Mao, Y.; Shan, F.; Ha, T. Coal mine area monitoring method by machine learning and multispectral remote sensing images. Infrared Phys. Technol. 2019, 103. [Google Scholar] [CrossRef]
- Xu, J.; Zhao, H.; Yin, P.; Wu, L.; Li, G. Landscape ecological quality assessment and its dynamic change in coal mining area: A case study of Peixian. Environ. Earth Sci. 2019, 78, 708. [Google Scholar] [CrossRef]
- Li, X.; Li, S.; Gao, J. Aanlysis on Dynamic Change of Eco-Environmental Quality in Kailuan Mining Subsidence Area. Adv. Mater. Res. 2012, 433–440, 1433–1436. [Google Scholar] [CrossRef]
- Fu, X. Monitoring of Vegetation Coverage Variation Based on Multi-Temporal Remote Sensing Data in Shendong Centre. Environ. Monit. China 2014, 30, 186–190. [Google Scholar] [CrossRef]
- Liu, Y.; Hou, E.; Yue, H. Dynamic monitoring and trend analysis of vegetation change in Shendong mining area based on MODIS. Remote Sens. Land Resour. 2017, 29, 132–137. [Google Scholar] [CrossRef]
- Wang, G.; Qiu, K. Dynamic Monitoring of Vegetation Coverage in Huainan Mining Area Based on MODIS NDVI. Bull. Surv. Mapp. 2018, 33–40. [Google Scholar] [CrossRef]
- Gao, J. How China will protect one-quarter of its land. Nature 2019, 569, 457. [Google Scholar] [CrossRef] [Green Version]
Figure 1.
Monthly composites of daily evapotranspiration for April to September of 2004 over China [48].
Figure 1.
Monthly composites of daily evapotranspiration for April to September of 2004 over China [48].

Figure 2.
Land surface temperature retrieval from GF-5 simulation images in two sites. (a) YingKe site; (b) Liuyuan site [53].
Figure 2.
Land surface temperature retrieval from GF-5 simulation images in two sites. (a) YingKe site; (b) Liuyuan site [53].

Figure 3.
Spatial distribution of average ecological footprint in National Nature Reserves in 2010 [60].
Figure 3.
Spatial distribution of average ecological footprint in National Nature Reserves in 2010 [60].

Figure 4.
Results of biodiversity comprehensive assessment in Nanzhang County of Hubei Province, China in the year of 2010 (a) and 2010 (b) [63].
Figure 4.
Results of biodiversity comprehensive assessment in Nanzhang County of Hubei Province, China in the year of 2010 (a) and 2010 (b) [63].

Figure 5.
Spatial distribution and change of water conservation in national key ecological function zones. (a) The year of 2000; (b) the year of 2014 [66].
Figure 5.
Spatial distribution and change of water conservation in national key ecological function zones. (a) The year of 2000; (b) the year of 2014 [66].

Figure 6.
Plastic greenhouse mapping by the plastic greenhouse film index (PGI)-based model in a sample area in Weifang City, Shandong Province, China [72].
Figure 6.
Plastic greenhouse mapping by the plastic greenhouse film index (PGI)-based model in a sample area in Weifang City, Shandong Province, China [72].

Figure 7.
Impervious surfaces area maps of Wuhan City from 1987 to 2017 [96].
Figure 7.
Impervious surfaces area maps of Wuhan City from 1987 to 2017 [96].

Figure 8.
Biophysical composition index distribution (A) and impervious surface distribution (B) [10].
Figure 8.
Biophysical composition index distribution (A) and impervious surface distribution (B) [10].

Figure 9.
Application of the tree root based multi-layer extreme learning machine model in opencast Heidaigou coal mine area [106].
Figure 9.
Application of the tree root based multi-layer extreme learning machine model in opencast Heidaigou coal mine area [106].


Table 1.
Major satellite sensors used for environmental monitoring in China.
| Satellite | Sensor | Spectral Range (μm) | Spatial Resolution (m) | Revisit Time (day) | Swath Width (km) | Launch Time | Country |
|---|---|---|---|---|---|---|---|
| EOS-Terra/Aqua | MODIS | 0.62–14.38 | 250/500/1000 | 0.5 | 2330 | 1999/2002 | USA |
| Aster | 0.52–11.65 | 15/30/90 | 16 | 60 | 1999 | Japan | |
| NOAA-TIROS-N NOAA-7–19 | AVHRR | 0.55–12.5 | 1100 | 6 | 2800 | 1978.10–2009.2 | USA |
| Landsat (1–8) | MSS | 0.5–1.1 | 80 | 18 | 185 | 1972.7–1984.3 | USA |
| TM | 0.45~2.35 | 30/60/120 | 16 | 185 | 1982.7–1984.3 | USA | |
| ETM+ | 0.45~0.90 | 15/30/60 | 16d | 185*170 | 1999.4 | USA | |
| OLI | 0.433–1.39 | 15/30/60 | 16d | 170*180 | 2013.2 | USA | |
| TIRS | 10.6–11.2 11.5–12.5 | 100 | 16d | 170*180 | 2013.2 | USA | |
| IKONOS-2 | OSA | 0.45–0.9 | 0.82/3.28 | 1–3 | 11.3 | 1999.9 | USA |
| Quickbird | BGIS | 0.45–0.9 | 0.61/2.44 | 1–6 | 16.5 | 2001.10 | USA |
| GeoEye | GIS | 0.45–0.92 | 0.41/1.65 | 3 | 15.2 | 2008.9 | USA |
| Envisat | ASAR | C band | 10/30/150/1000 | 35 | 5/100/400 | 2002.3 | Europe |
| Sentinel-1 | SAR | C band | 5*20/ 5*5/ 5*5/20*40 | 12 | 20/80/250/400 | 2014.4 | Europe |
| Sentinel-2 | MSI | 0.4~2.4 | 10/20/60 | 10d | 290 | 2016.6 2017.3 | Europe |
| SPOT(1–3) | HRV | 0.50–0.89 | 10/20 | 26 | 60 | 1986.2 | France |
| SPOT 4 | HRVIR | 0.50–1.75 | 10/20 | 26 | 60 | 1998.3 | France |
| VGT | 0.45–1.75 | 1150 | 26 | 2250 | 1998.3 | France | |
| SPOT 5 | HRG | 0.48–1.75 | 2.5/5/10/20 | 26 | 60 | 2002.5 | France |
| VGT | 0.45–1.75 | 1150 | 26 | 2250 | 2002.5 | France | |
| SPOT 6 | NAOMI | 0.45–0.89 | 1.5/6 | 26 | 60×60 | 2012.9 | France |
| SPOT 7 | NAOMI | 0.45–0.89 | 1.5/6 | 26 | 60 | 2014.6 | France |
| Rapid Eye | MSI | 0.4–0.85 | 5 | 1 | 77 | 2008.8 | Germany |
| RADARSAT 1 | SAR | C band | 8–100 | 1–3 | 20/50/75/100/ 150/170/300/500 | 1995.11 | Canada |
| RADARSAT 2 | SAR | C band | 1–100 | 1–3 | 18/20/50/75/100/ 150/170/300/500 | 2007.12 | Canada |
| ALOS-1 | PRISM | 0.52–0.77 | 2.5 | 2 | 70 | 2006.1 | Japan |
| AVNIR-2 | 0.42–0.89 | 10 | 2 | 70 | 2006.1 | Japan | |
| PALSAR | L band | 7–100 | 2 | 20–350 | 2006.1 | Japan | |
| ALOS-2 | PALSAR-2 | L band | 1–100 | 14 | 25/50–70/350/490 | 2014.5 | Japan |
| HJ-A | CCD | 0.43–0.90 | 30 | 4 | 360 | 2008.9 | China |
| HSI | 0.43–0.52 | 100 | 4 | 50 | 2008.9 | China | |
| HJ-B | CCD | 0.43–0.90 | 30 | 4 | 360 | 2008.9 | China |
| IRS | 0.43–0.52 | 150/300 | 4 | 720 | 2008.9 | China | |
| HJ-C | SAR | S band | 5/20 | 31 | 40/100 | 2012.11 | China |
| ZY-1-02C | HRC/PMS | 0.50–0.89 | 2.36/5/10 | 3–5 | 54/60 | 2011.11 | China |
| ZY-3-01/02 | PMS/MUX | 0.45–0.89 | 2.1/5.8 | 3–5 | 51 | 2012.1 2016.5 | China |
| Gaofen-1 | PMS/WFV | 0.45–0.9 | 2/8/16 | 2–4 | 60/800 | 2013.4 | China |
| Gaofen -2 | PMS/MSS | 0.45–0.9 | 1/4 | 5 | 45 | 2014.8 | China |
| Gaofen -3 | SAR | C band | 1–500 | 1.5–3 | 10–650 | 2016.8 | China |
| Gaofen -4 | PMI | 0.45–0.9 3.5–4.1 | 50/400 | 20 seconds | 400 | 2015.12 | China |
| Gaofen -5 | AHSI | 0.45–2.5 | 30 | 51 | 60 | 2018.5 | China |
| VIMI | 0.45–12.5 | 20/40 | 51 | 60 | |||
| Gaofen -6 | PMS/WFV | 0.45–0.9 | 2/8/16 | 2–4 | 60/800 | 2018.6 | China |
Table 2.
Major institutions involved in remote sensing of environment in China.
| Institutions | City | Fields |
|---|---|---|
| National Remote Sensing Center of China | Beijing | Remote sensing technology management |
| Satellite Environment Center, Ministry of Ecology and Environment | Beijing | Remote sensing of ecology and environment |
| Land Satellite Remote Sensing Application Center, Ministry of Natural Resource | Beijing | Remote sensing of land resource |
| National Satellite Ocean Application Service, Ministry of Natural Resource | Beijing | Remote sensing of ocean |
| National Satellite Meteorological Centre, China Meteorological Administration | Beijing | Remote sensing of meteorology |
| National Disaster Reduction Center, Ministry of Emergency Management | Beijing | Application of remote sensing in disaster reduction |
| China Center for Resources Satellite Date and Application | Beijing | Remote sensing data acquisition and management |
| Aerospace Information Research Institute, Chinese Academy of Sciences | Beijing | Comprehensive research in remote sensing |
| Research Center for Eco-Environmental Sciences, Chinese Academy of Sciences | Beijing | Remote sensing of environment and ecosystem |
| Institute of Geographic Sciences and Natural Resources Research, Chinese Academy of Sciences | Beijing | Application of remote sensing in natural resource |
| Institute of Tibetan Plateau Research, Chinese Academy of Sciences | Beijing | Remote sensing of environment and geology |
| Institute of Atmospheric Physics, Chinese Academy of Sciences | Beijing | Remote sensing of atmosphere |
| Chinese Academy of Forestry | Beijing | Remote sensing of forestry |
| Chinese Academy of Agricultural Sciences | Beijing | Remote sensing of agriculture |
| Nanjing Institute of Geography & Limnology, Chinese Academy of Sciences | Nanjing | Remote sensing of environment |
| Institute of Soil Science, Chinese Academy of Sciences | Nanjing | Application of remote sensing in soil science |
| Peking University | Beijing | Education |
| Tsinghua University | Beijing | Education |
| Beijing Normal University | Beijing | Education |
| University of Chinese Academy of Sciences | Beijing | Education |
| China University of Mining and Technology | Beijing and Xuzhou | Education |
| China University of Geosciences | Beijing and Wuhan | Education |
| Beihang University | Beijing | Education |
| Capital Normal Univeristy | Beijing | Education |
| Wuhan University | Wuhan | Education |
| Central South University | Changsha | Education |
| Tongji University | Shanghai | Education |
| Sun Yat-sen University | Guangzhou | Education |
| Nanjing University | Nanjing | Education |
| Chang’an University | Xi’an | Education |
| Liaoning Technical University | Fuxin | Education |
| Xi‘an University of Science and Technology | Xi’an | Education |
| Shandong University of Science and Technology | Qingdao | Education |
| Hohai University | Nanjing | Education |
| Lanzhou Jiaotong University | Lanzhou | Education |
| Zhengzhou University | Zhengzhou | Education |
| Southwest Jiaotong University | Chengdu | Education |
Table 3.
Studies of environmental monitoring by remote sensing in China.
| Field of Monitoring | Monitoring Element | Methods and Algorithms | Remote Sensing Datasets Used | Accuracy |
|---|---|---|---|---|
| Ecological index retrieval | Vegetation index | Band combination method, principal component combination method, derivative band combination method etc. | Landsat TM/ETM+/OLI, Gaofen-1, MODIS | 78%–94.55% [15,16,17,18,19,20,21] |
| Soil moisture | Empirical models, semi-empirical models, physical models | MODIS, Landsat TM, Envisat-1 ASAR | MRE = 17.5%–32.8% [22,23,24,25,26,27,28,29,30,31] | |
| Vegetation moisture | Regression model, vegetation moisture index | Landsat ETM+, ASTER, Hyperion, MODIS | RMSE < 0.794 kg/m2 [32,33,34,35,36] | |
| Evapotranspiration | SEBAL model, SEBS model, METRIC model, semi-empirical model | HJ-IB, FY-3, Landsat TM, MODIS | MRE ≤ 12% [37,38,39,40,41,42,43,44,45,46,47,48] | |
| Land surface temperature | Single-channel algorithm, split-window algorithm, neural network-based algorithms | HJ-1B, ASTER, Landsat TM/ETM+/TIRS, MODIS | RMSE ≤ 2K [6,49,50,51,52,53] | |
| Protected area monitoring | Land use/cover change | Automatic image classification, visual interpretation | Landsat TM/ETM+/OLI, HJ-1, SPOT, World View-2 CBERS, ALOS, Gaofen-1 | ≥80% [54,55] |
| Human activity | Human activity impact index, visual interpretation | [56,57,58,59,60,61] | ||
| Biodiversity level, biological species, vegetation et al. | Spectral angle classification method | HJ-1A, Landsat TM/ETM+ | [62,63,64,65,66,67,68] | |
| Rural area monitoring | Solid waste | Human-computer interaction interpretation | Beijing-1, Gaofen-1/2 | 90%–95% [69,70] |
| Greenhouse film | PGI index, support vector machine classification | Gaofen-1, Landsat ETM+, Quickbird-2 | ≥90% [71,72,73] | |
| Soil pollution | Partial least squares regression method | Hyperion, HJ-1A HSI | MRE < 15% [74,75,76,77] | |
| Aquaculture | Human-computer interaction interpretation, object-oriented analysis and spectral eigenvalue method | Landsat TM/ETM+/OLI, CBERS, HJ-1 CCD | ≥80% [78,79] | |
| Urban area monitoring | Urban heat island | Land surface temperature retrieval algorithms | HJ-1B, ASTER, Landsat TM/ETM+/TIRS, MODIS | RMSE ≤ 2K [80,81,82,83,84,85] |
| Urban green space information | Stepwise hierarchical method, pixel dichotomy model, mono-window algorithm | Landsat ETM+/OLI, Quickbird, ALOS, Gaofen-1 | >90% [86,87,88,89,90] | |
| Urban impervious surface | Linear spectral unmixture analysis, dynamic impermeability analysis | Landsat TM/ETM+, urban DEM | RMSE < 0.02 [91,92,93,94,95,96] | |
| Expansion of urban built-up areas | Object-oriented classification | Landsat 8, Quickbird, Gaofen-1 | Around 90% [10,97,98] | |
| Urban environment quality | Environment indicator | Landsat dataset | [99,100] | |
| Mining area monitoring | Ecological damage and impact | Image interpretation, linear regression | SPOT 4/5, Quickbird, Landsat TM/ETM+, ZY-3, ASTER | ≥85% [101,102,103,104,105,106] |
| Ecological restoration | Ecological index, pixel dichotomy model | Landsat TM/ETM+, HJ-1A CCD, MODIS | [107,108,109,110,111] |
© 2020 by the authors. Licensee MDPI, Basel, Switzerland. This article is an open access article distributed under the terms and conditions of the Creative Commons Attribution (CC BY) license (http://creativecommons.org/licenses/by/4.0/).
Share and Cite
MDPI and ACS Style
Li, J.; Pei, Y.; Zhao, S.; Xiao, R.; Sang, X.; Zhang, C. A Review of Remote Sensing for Environmental Monitoring in China. Remote Sens. 2020, 12, 1130. https://doi.org/10.3390/rs12071130
AMA Style
Li J, Pei Y, Zhao S, Xiao R, Sang X, Zhang C. A Review of Remote Sensing for Environmental Monitoring in China. Remote Sensing. 2020; 12(7):1130. https://doi.org/10.3390/rs12071130
Chicago/Turabian StyleLi, Jun, Yanqiu Pei, Shaohua Zhao, Rulin Xiao, Xiao Sang, and Chengye Zhang. 2020. "A Review of Remote Sensing for Environmental Monitoring in China" Remote Sensing 12, no. 7: 1130. https://doi.org/10.3390/rs12071130
Note that from the first issue of 2016, this journal uses article numbers instead of page numbers. See further details here.