1. Introduction
Landslides can be considered as processes that move earth and rock downwards by sliding, falling and flowing in response to the extant conditions [
1]. Within a span of seven years from 2004 to 2010, a total of 2620 landslides were recorded globally, which led to the loss of 32,322 lives [
2]. In India, most of the highlands are affected by landslides and rainfall is identified as the major triggering factor in the Himalayas and Western Ghats [
3,
4,
5,
6]. The rise in population demands for the urbanization in high-altitude regions, which are usually susceptible to mass movements; therefore, when such places become densely populated areas, landslides cause severe fatalities. Recent changes in climate are also worsening the situation, with an increase in high intensity rainfalls and the consequent triggering of rapid mass movements [
7,
8], such as the debris flows, which occurred in Wayanad district in the state of Kerala during 2018 and 2019. The region is affected by a number of debris flows, with run-out distances as long as 3 km. Most of the slope failures that occurred during the 2018 monsoon also occurred during the 2019 monsoon as well. Thus, the increasing vulnerability of the region emphasizes the need for landslide early warning systems (LEWS) to forecast future events. Research has been carried out for establishing LEWS using the relationship between rainfalls and landslides in the Indian Himalayas [
9,
10,
11,
12], but detailed investigations for the Western Ghats have not been conducted yet. A LEWS should be developed on a regional scale for Wayanad district, incorporating monitoring tools and rainfall thresholds so that warnings can be issued to authorities and the local community. As a first step, this study focuses on establishing intensity–duration thresholds for the study area using statistical analysis.
Rainfall thresholds can be defined as a critical state of rainfall parameters from which an effect or result (landslides) can happen [
13]. The minimum quantity of accumulated rainfall parameters which are required to trigger a landslide event will define the rainfall threshold for a region. Empirical and process-based approaches are widely used by researchers for developing rainfall thresholds [
8,
14,
15,
16,
17,
18,
19,
20,
21,
22,
23]. The definition of a process-based threshold is associated with detailed site investigations and precise measurements. This approach is suitable for local scale or site-specific studies where the hydro-meteo-geological parameters can be monitored with required accuracy. Owing to the difficulties in estimating such parameters on a regional scale, this research focuses on an empirical approach to derive the rainfall thresholds using historical data. A rainfall event is usually characterized by three parameters: rainfall event (E), intensity (I), and duration (D). An event rainfall is the total accumulated amount of rainfall during a period of continuous precipitation, dubbed the duration of rainfall. The classical definition of intensity of rainfall is the average rate of precipitation usually expressed in mm/h or mm/day. Intensity–duration thresholds were first established by considering 73 landslides in several parts of the world by Caine in 1980 [
24]. The definition of threshold, considering the minimum boundary, was then followed by researchers across the globe for analyzing local, regional and global scale thresholds [
25,
26,
27,
28,
29,
30]. Moreover, high intensity rainfalls are often associated with landslides in hilly areas [
31] and when an empirical approach is pursued in regional scale studies, rainfall is more influential that site and slope characteristics [
31,
32,
33]. For defining the minimum boundary or threshold, different statistical approaches can be used [
34]. In literature, different definitions are adopted to calculate the intensity used in threshold analysis, such as mean intensity of an event [
24], peak intensity [
25] or most extreme intensity of sub-events [
23].
Deducing the rainfall event associated with the occurrence of a landslide is the key factor in determining the threshold conditions. A recent review highlights that rain gauges are the most widely used instrument to collect rainfall data [
35]. The selection of rain gauge in data-scarce regions are mostly forced, as the nearest rain gauge is selected based on spatial constraints and minor refinements [
5,
35,
36]. In some studies, when rain gauge density is very small, landslides outside a specific radius from rain gauges are discarded, thus further reducing the amount of available data [
37]. Moreover, some scholars observed that the threshold definition can be very sensitive to some boundary conditions, such as the rain gauge selection and characteristics or the delimitation of alert zones [
22,
38].
This research focuses on the effect of different approaches of analysis, including different definitions of rainfall intensity and different rain gauge configurations by using the database developed for the study area of Kerala (India). The term “approach” is used in this study, denoting the process of identification of a rainfall event which results in a landslide. The objective is to understand how the identification of rainfall parameters can affect the development of the rainfall threshold on both local and regional scales. Being one of the most followed approaches, the reliability of developing rainfall thresholds based on the nearest rain gauge is used as a benchmark and quantitatively compared with other strategies.
2. Description of Study Area
Kerala state is located in the southernmost part of the Indian subcontinent which is characterized by all the three physiographic division: coastal plains, midlands and highlands. The geomorphic features vary from coastal plains below sea level to mountain peaks with an elevation of 2695 metres. In addition, 40% of the state’s area is occupied by the Western Ghats, the most significant orographic feature of Indian Peninsula [
39]. The Western Ghats is a humid forested area where debris flows, initiated by rainfall, being the primary agents of landscape evolution [
40]. Torrential rains during the months of June, July and August 2018 triggered around 341 major landslides across ten districts of the state [
41]. Wayanad district was one of the worst affected districts which suffered severe socioeconomic setbacks due to these landslides. About 36.74% of the net cropped area of the district was damaged in the disaster [
41]. Most of the locations that were affected in the 2018 landslide disaster were reactivated during the 2019 monsoon also, making the situation critical.
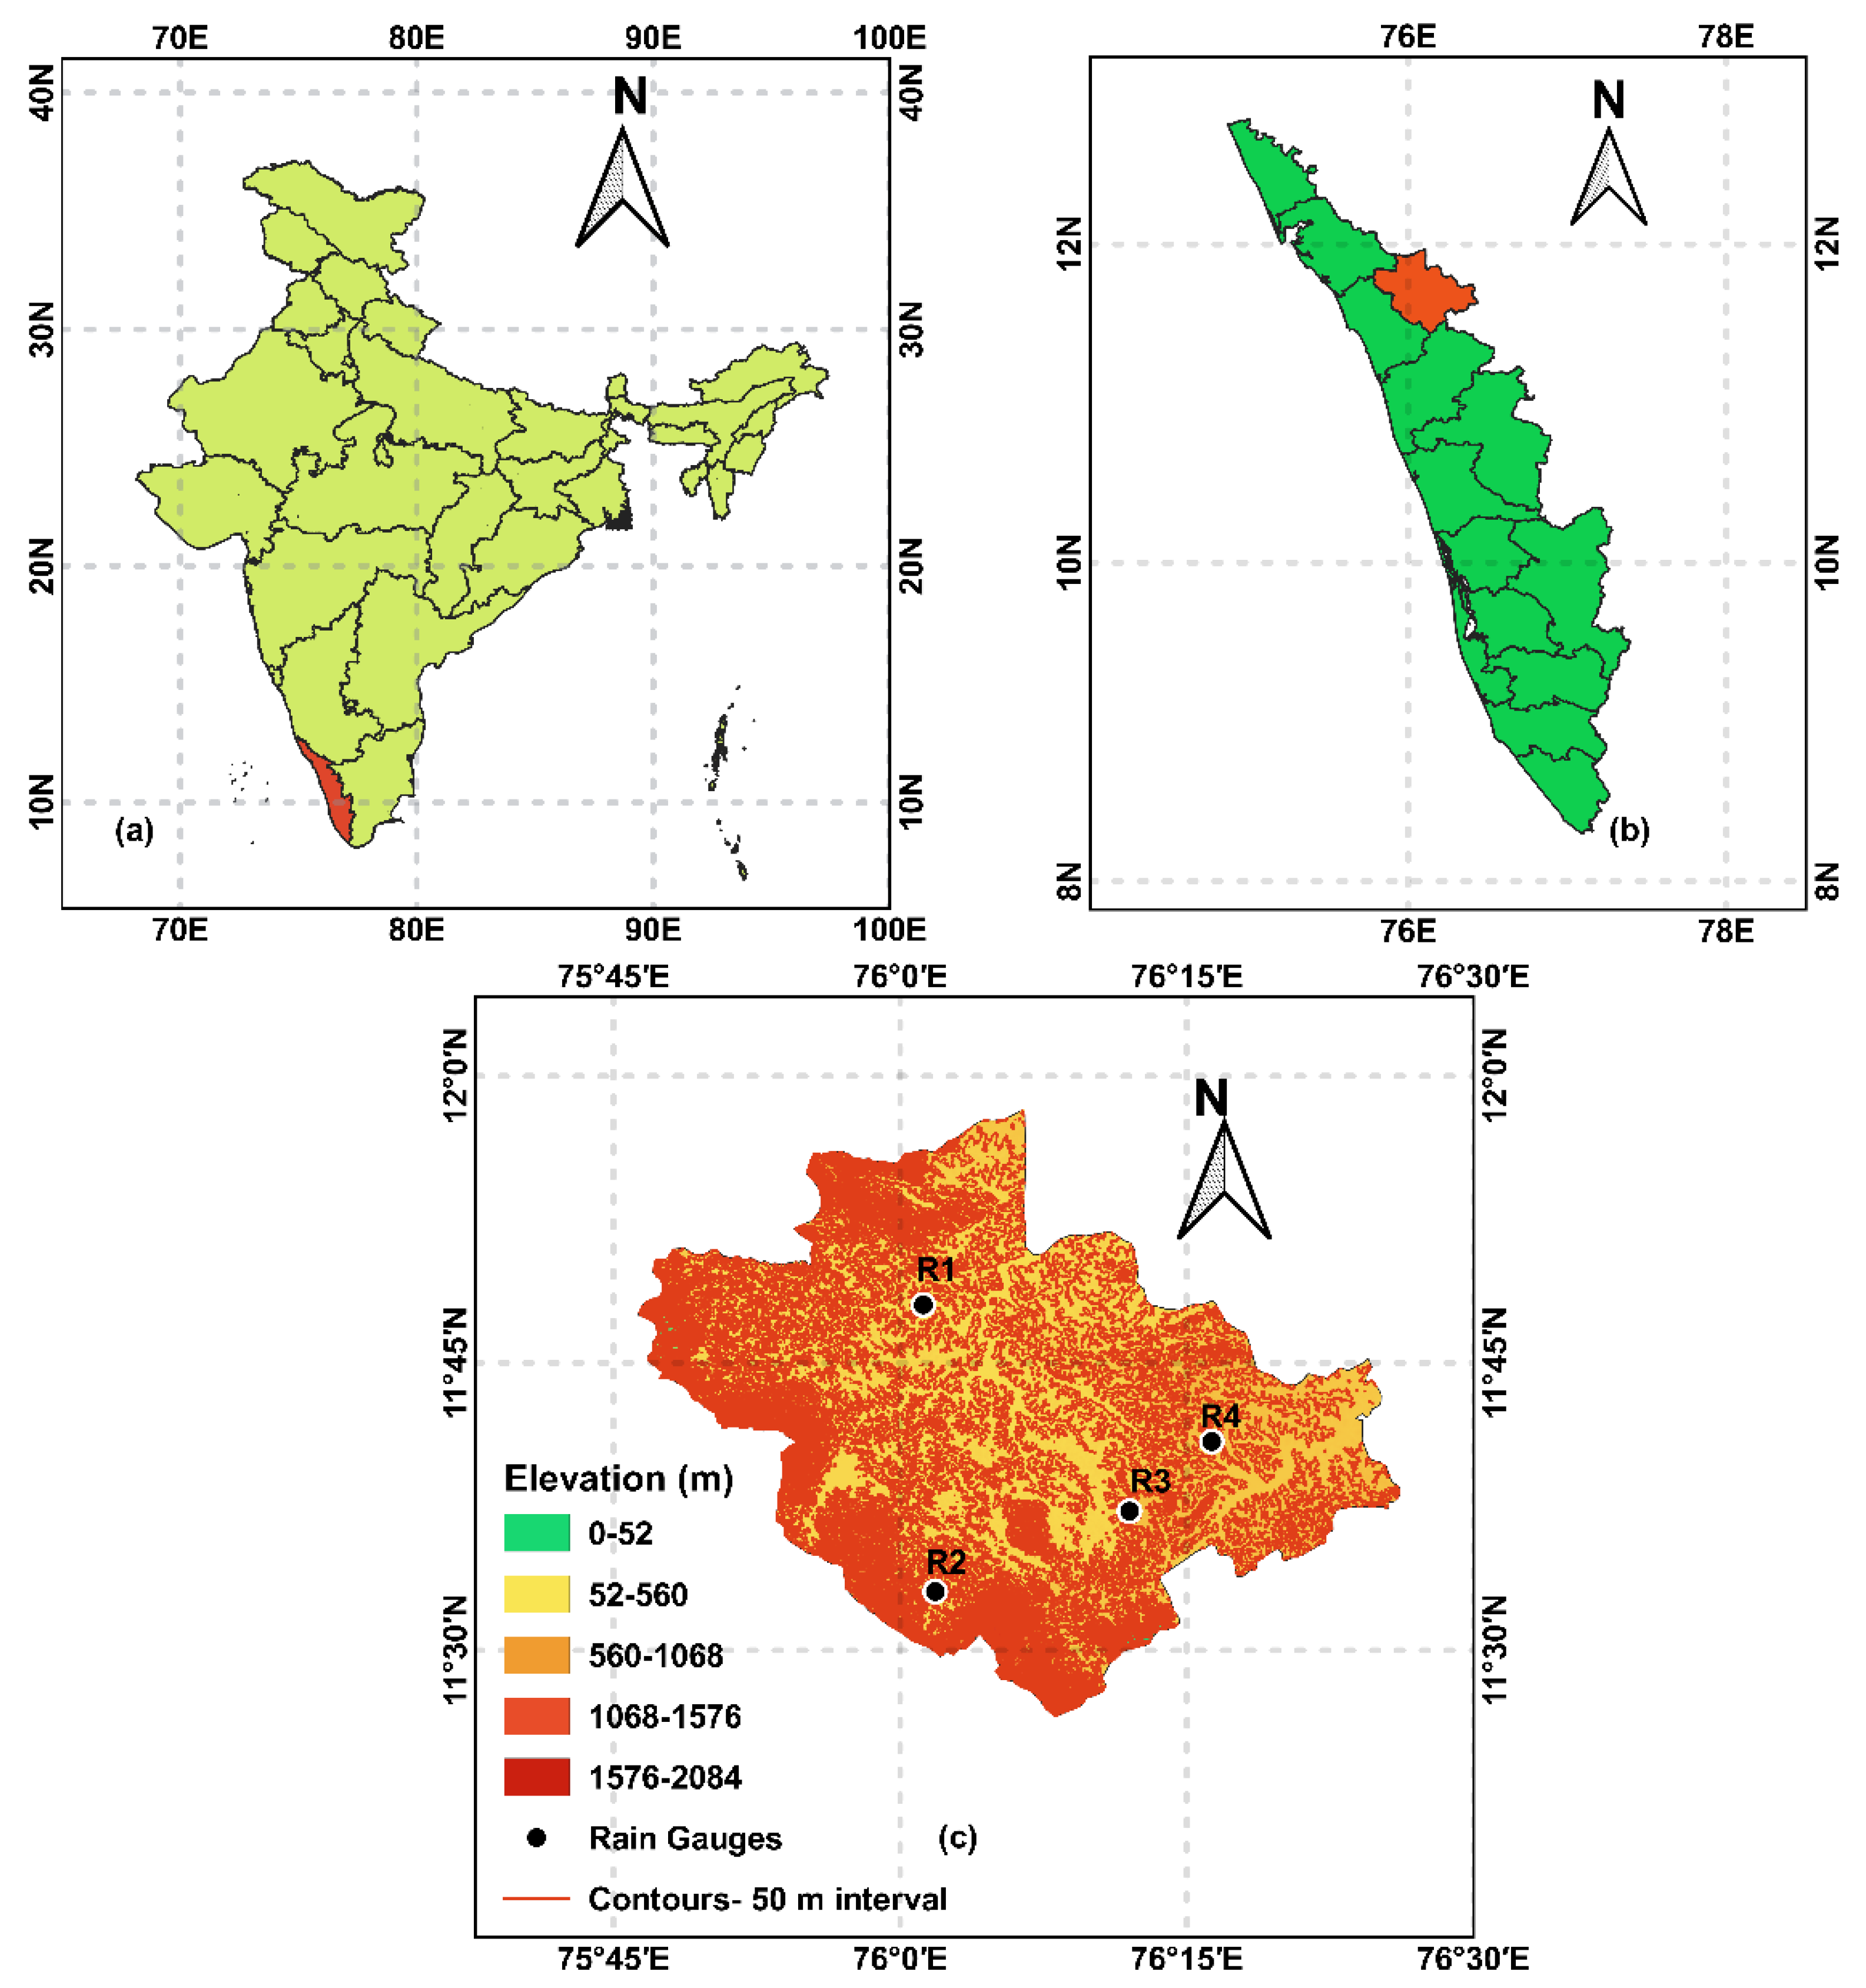
The 2130 km
2 area of Wayanad district lies between 11°30’ N to 12°3’ N latitudes and 75°39’ E to 76°30’ E longitudes, as shown in
Figure 1. Geologically, the district can be divided into four sectors: peninsular gneissic complex, migmatite complex, charnockite group and the Wayanad group in north-central, south-central, southern and northern parts respectively [
42]. Wayanad group rocks are found on the northern side as bands. Charnockite rocks form the hilly terrains of south and southeast parts of Wayanad, with narrow bands of pyroxene granulite and magnetite quartzite within charnockite. Biotite hornblende gneiss found over large parts of south-central Wayanad represents the migmatite complex.
The altitude of the district ranges up to 2084 m above sea level (
Figure 1). The high altitude Western Ghats and the denuded Wayanad Plateau constitutes the physiography of the region. The plateau of Wayanadu is sloping towards the east and is bordered by isolated structural hills in the east. Most of the district is drained by the Kabani River and its tributaries. The river which flows to the east, along with its tributaries, contributed to the major carvings in the landscape of the catchment.
The topography of the region consists of features ranging from rugged high ranges to flood plains [
42]. Hill ranges in the west, northwest and south-western parts of Wayanad can be classified as high ranges with rugged topography, occupied with dense forests with steep slopes. The eastern hills of the districts are high ranges with moderately rugged topography, with an elevation ranging from 1000 m to 1400 m. The valleys between high ranges are formed by the process of deposition and erosion. The flood plains of the region form productive aquifers, and the alluvial thickness of more than 10 m are typical in such plains. This topographical diversity increases the chances of landslides in the region.
Four major soil types are found common in Wayanad district [
42]. Reddish-brown lateritic soil, formed due to the tropical climatic conditions, has its particle size ranging from clay to silt, with minor coarse fractions. Mananthavady, Kalpetta and Sulthan Bathery areas are rich in forest soil, formed by weathering under forest cover. Deep brownish hydromorphic soil is seen in the undulating topography in the district. This type of soil is formed by transportation and sedimentation of hill slope materials. Alluvial soils are found along the riverbanks, consisting of sandy and clayey fractions. During the monsoon, landslides are frequent in the region and they can be considered as the main geomorphological process, shaping the landscape.
2.1. Landslides in Wayanad
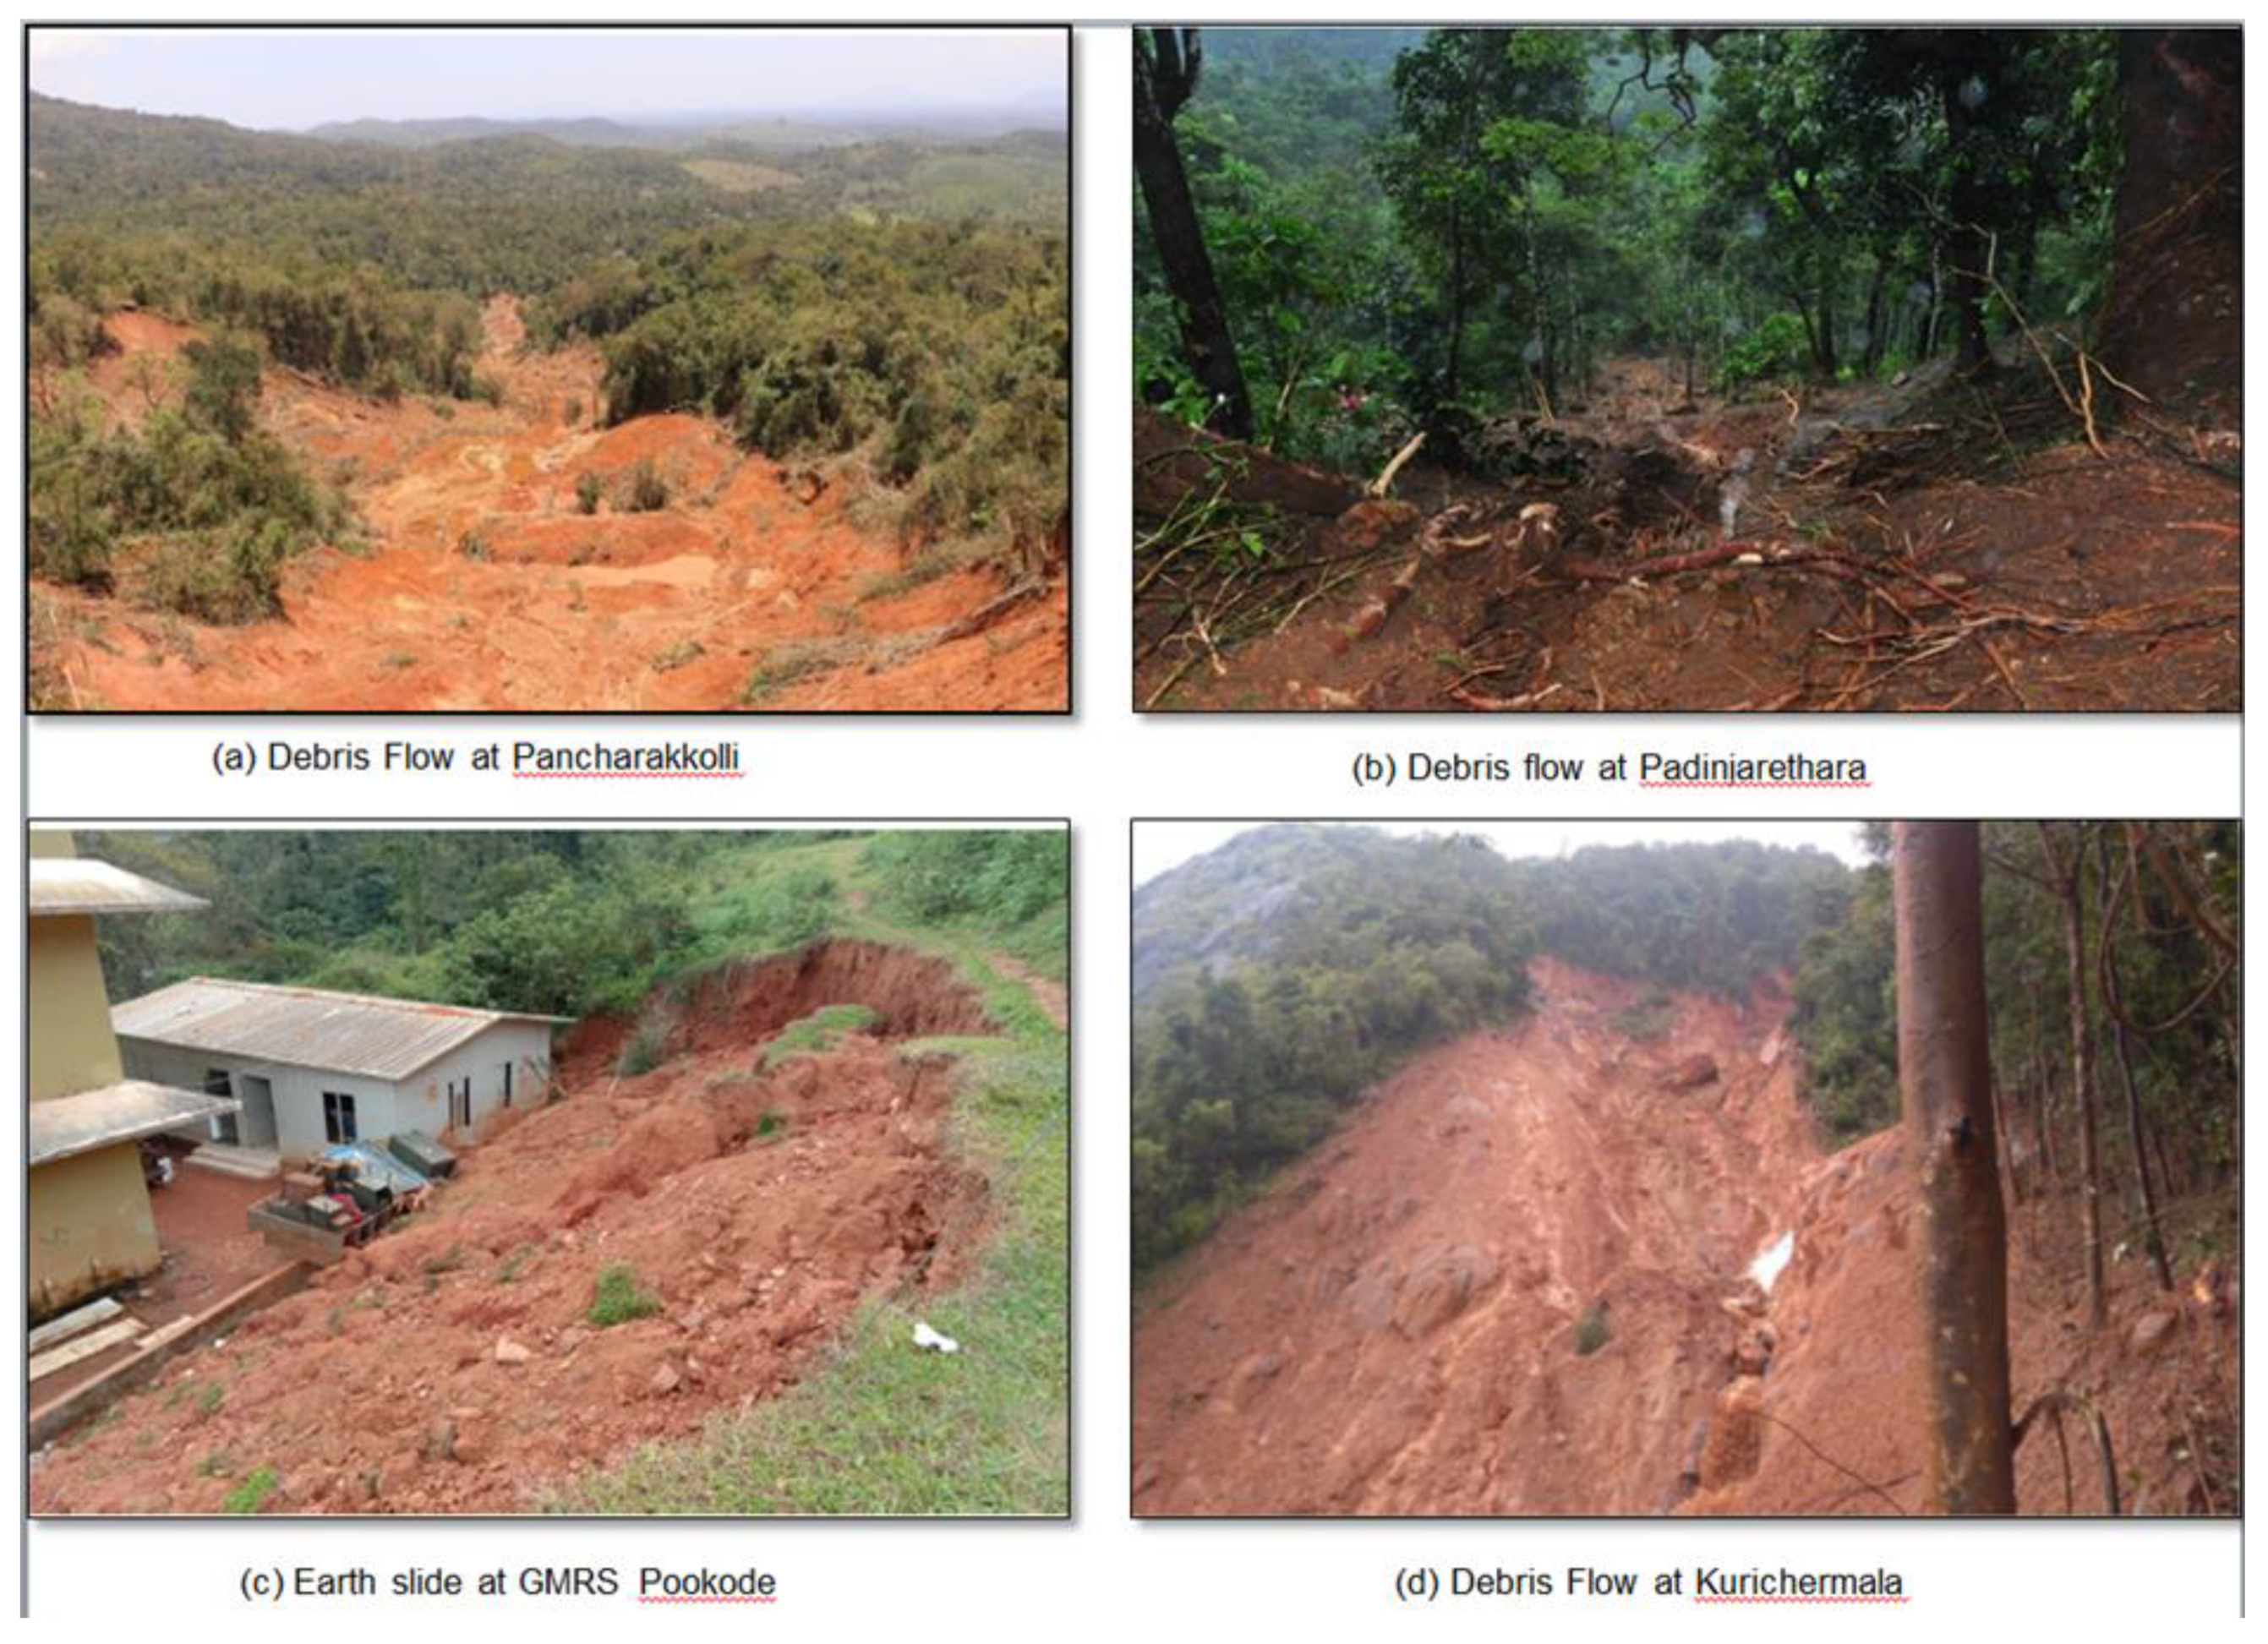
The types of landslides observed in the study region are mainly debris flows or slides of rapid to very rapid nature. A general agreement is that such landslides are triggered by high-intensity rainfalls. Hence, intensity and duration are the two parameters based on which rainfall thresholds are derived from in this study. A threshold line in the form of power-law is derived for the region using frequentist approach for the study area. Images of some of the landslide events that occurred during the 2018 monsoon in the study region are shown in
Figure 2, pointing to the typology of landslides observed in the study area. In the debris flow that occurred in Pancharakkolli (
Figure 2a), 10 acres of land comprising of 4 acres forest and 6 acres agricultural land was lost. A total of nine houses were damaged in the course, out of which five were completely destroyed. In Padinjarethara (
Figure 2b), four debris flows were initiated from the forest area and caused a severe loss of agricultural land. A total of 10 acres of land was lost and 24 families were affected by the disaster. Several translational and rotational earth slides also occurred during the 2018 monsoon (
Figure 2c). Such events have substantially decreased the stability of existing slopes and have affected the functionality of buildings and roads. The debris flow that occurred in Kurichermala (
Figure 2d) was the largest in terms of the run-out, where around 150 acres of land (130 acres tea estate and 20 acres agricultural land) was washed out along with the debris. A total of 17 families lost their homes in the disaster [
44]. The high elevation zones in the district is characterized by long and large volume debris flows (
Figure 2a,b,d) owing to the high regolith thickness combined with slope steepness. In zones of low elevation, debris/earth slides are observed as riverbank failures and cut slope failures.
Concerning landslide data, a variety of methods can be combined to obtain inventories as complete and detailed as possible, including direct surveys, newspapers, internet news and official reports from technical or administration offices [
27,
35,
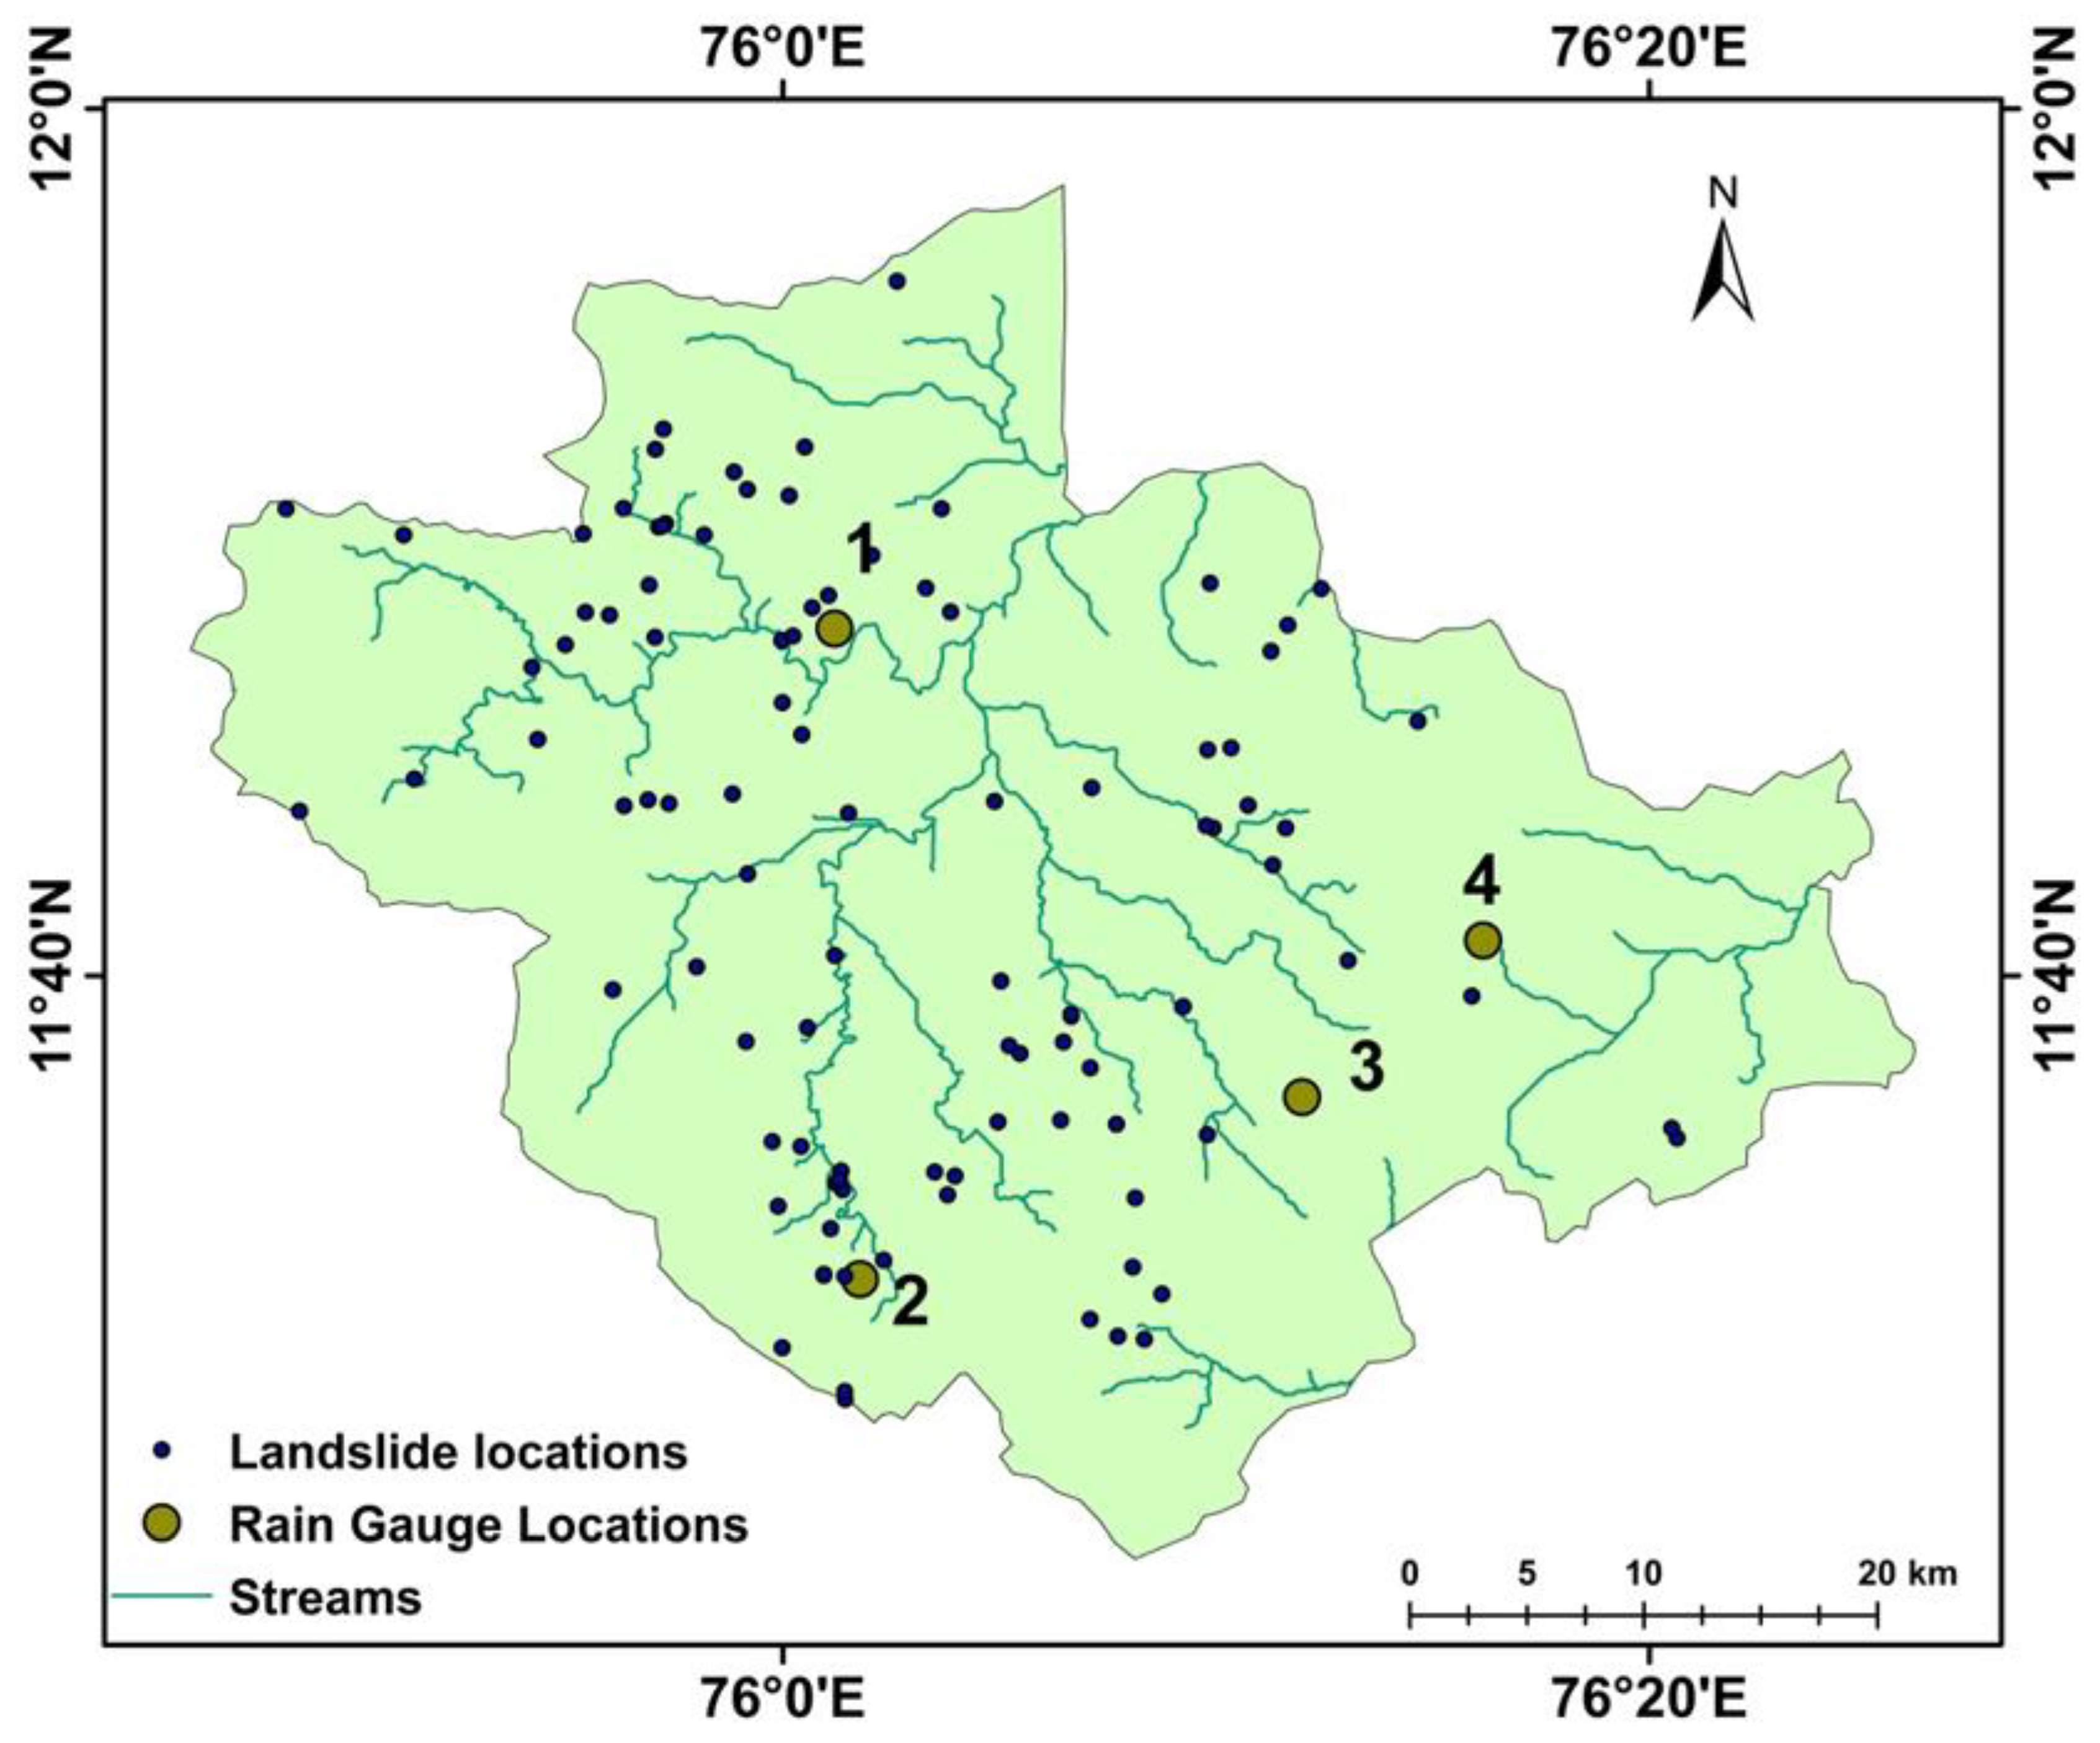
45]. In this study, the details of landslide events that occurred during the study period (2010–2018) were collected from reports of the Geological Survey of India, District Soil Conservation Office Wayanad and media reports. The spatial distribution of 123 landslide events identified are plotted in
Figure 3, along with the drainage map of Wayanad. Most of the landslide locations are close to the streams in the region, at higher elevations. The landslides that occurred in the low-lying regions often took place under anthropogenic influences, along cuts and slopes or along a riverbank, triggered during rainfalls. The database consists of the location, date of initiation and typology of the landslide. The precision of the location and time reported is subject to the availability of data from the report. The dates of occurrences of landslides were collected from the government reports with daily accuracy. When the dates were not mentioned clearly, as in the case of media reports, the event was assumed to occur one day before the reporting date. Locations were deduced with a spatial accuracy of the nearest mentioned place in the reports, i.e., the names of villages in most cases. A general idea about the landslide typology was available from most of the reports, but the details of the mode of failure were not available. Another constraint with the available reports is their bias towards the fatalities. As the high altitude and unstable slopes are mostly within the forest or less occupied areas, any possible slope failure in such areas is not reported by the media or government reports. As the objective of the study is also to aid in LEWS to reduce the impact of disaster on the population, ignoring such events is acceptable.
2.2. Rain Gauges and Rainfall in Wayanad
For threshold analyses, the starting point is the collection of rainfall and landslide data [
27,
35]. Concerning rainfall, despite some recent advances relying on radar measurements, rain gauge is by far the most commonly used method of measurement in threshold analysis [
35]. Therefore, rainfall data with the best possible temporal accuracy (daily time steps) were collected from 4 rain gauge stations maintained in the area by the India Meteorological Department (IMD) [
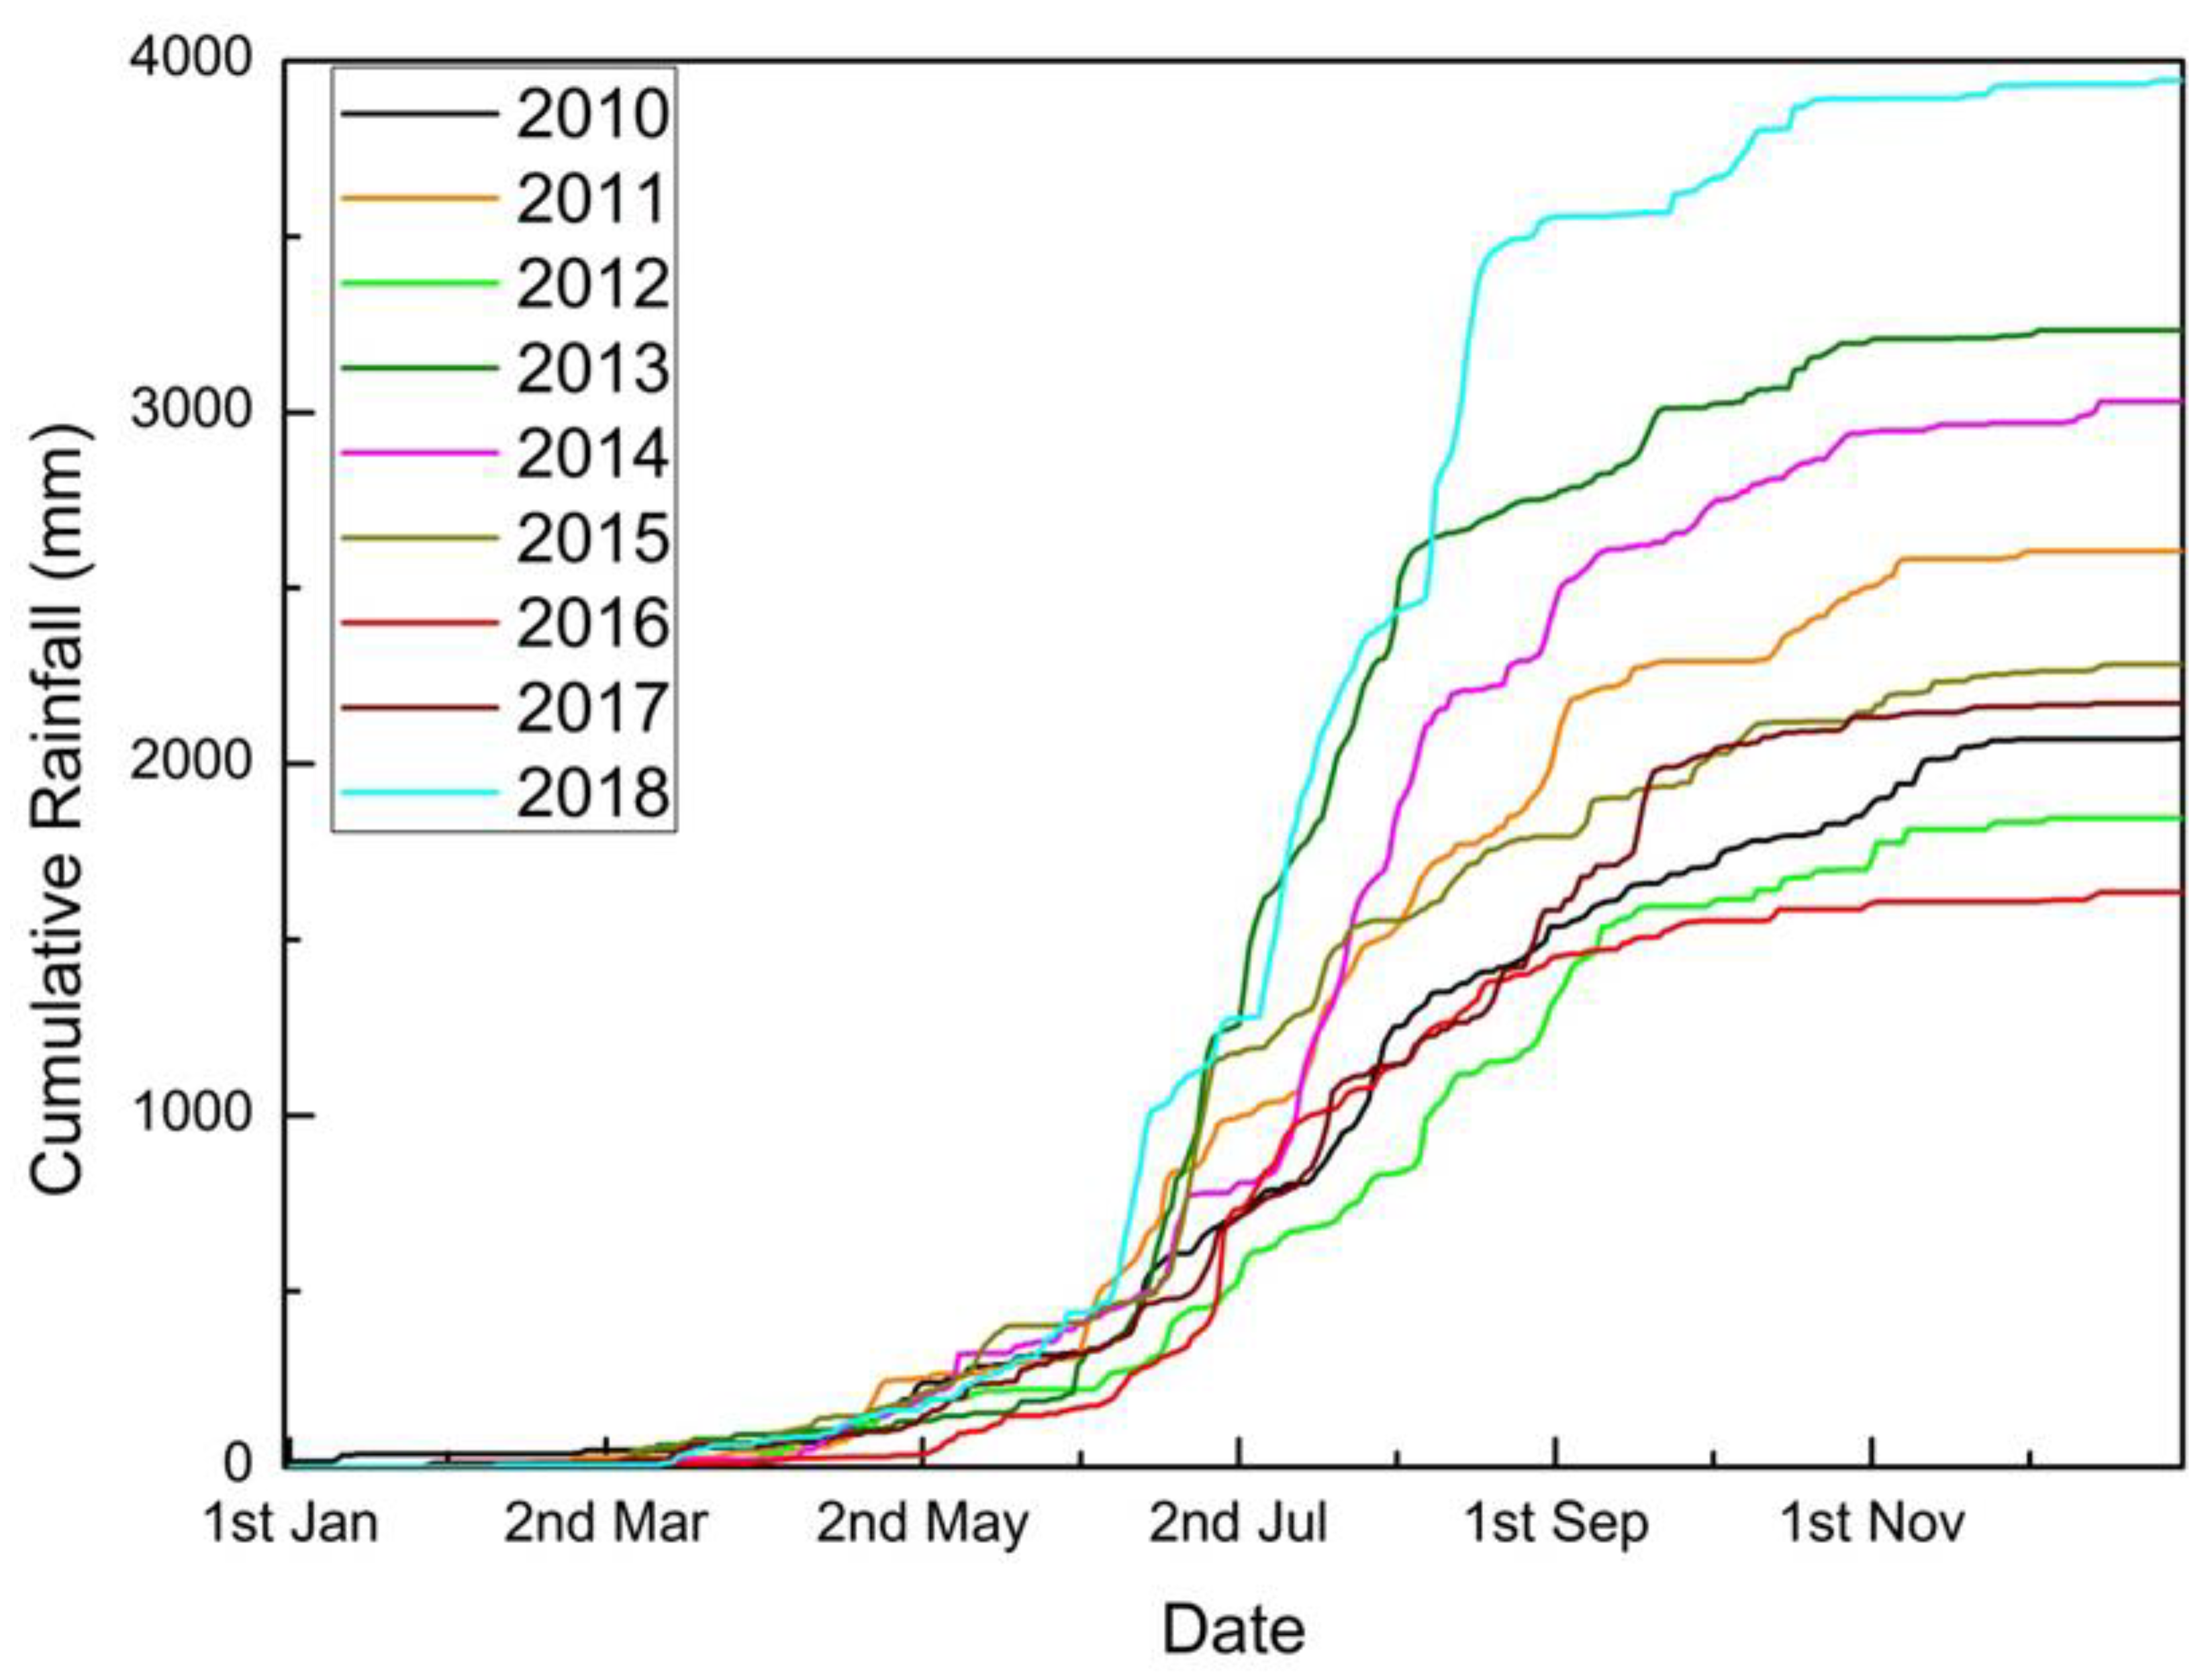
46]. The data from 2010 to 2018 are used to carry out the analysis for Wayanad district. The locations of the rain gauge stations are Mananthavady (R1), Vythiri (R2), Ambalavayal (R3) and Kuppadi (R4). The annual cumulative rainfall during the study period is shown in
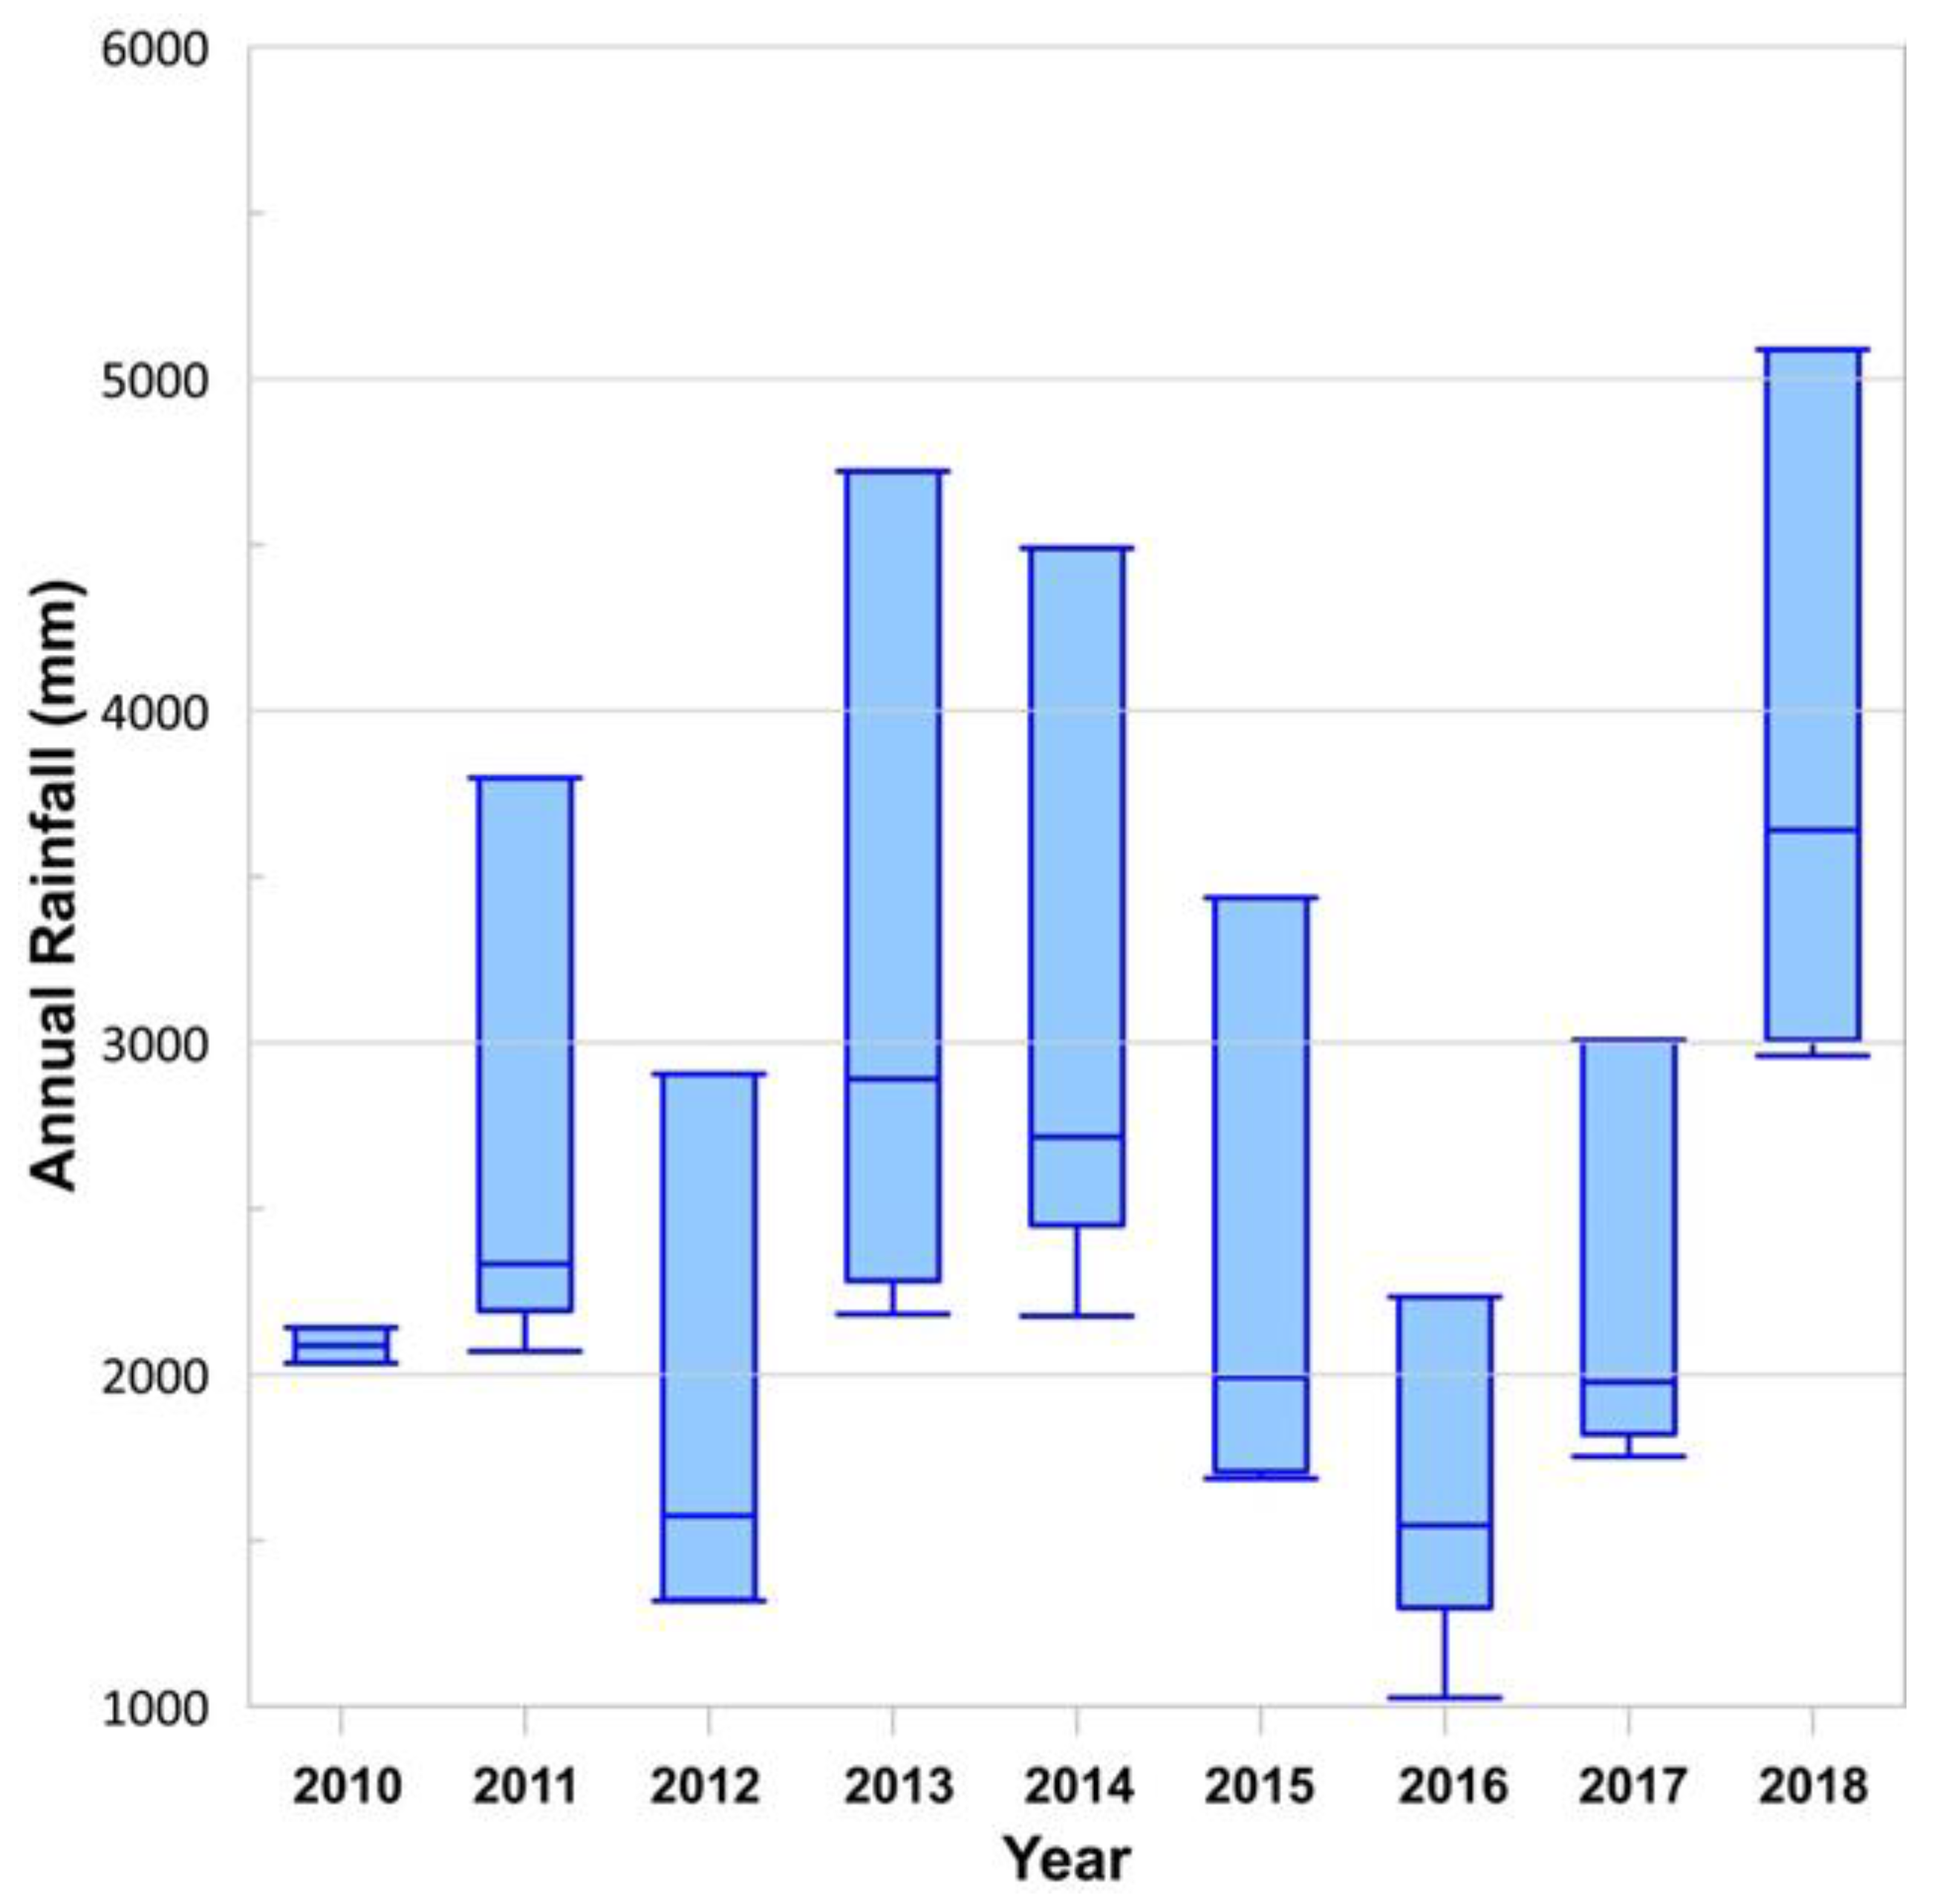
Figure 4. Maximum rainfall was observed in the year of 2018 with a cumulative rainfall of 3832 mm.
The decision on choosing the rain gauge or source of rainfall data is an important step in threshold definition. The variation of annual rainfall in four rain gauge stations is depicted in
Figure 5. During the study period, R3 and R4 recorded minimum annual rainfalls, and in most of the cases, the annual precipitations recorded at these two gauges were comparable. R1 received a higher amount of rainfall than R3 and R4, while R2 recorded the maximum rainfall in all the 9 years considered. The study can be refined with the availability of rainfall data of better spatial and temporal resolution. The variation in annual rainfall as observed in
Figure 5 stresses the difference in meteorological conditions of the four rain gauge areas and the need for separate local scale thresholds.
2.3. Approaches Used to Configure the Threshold Analysis
In this study, different approaches were considered for deriving intensity–duration thresholds. The method of choosing rain gauges based on the nearest rain gauge is still one of the simplest and, although criticized, widely used methods [
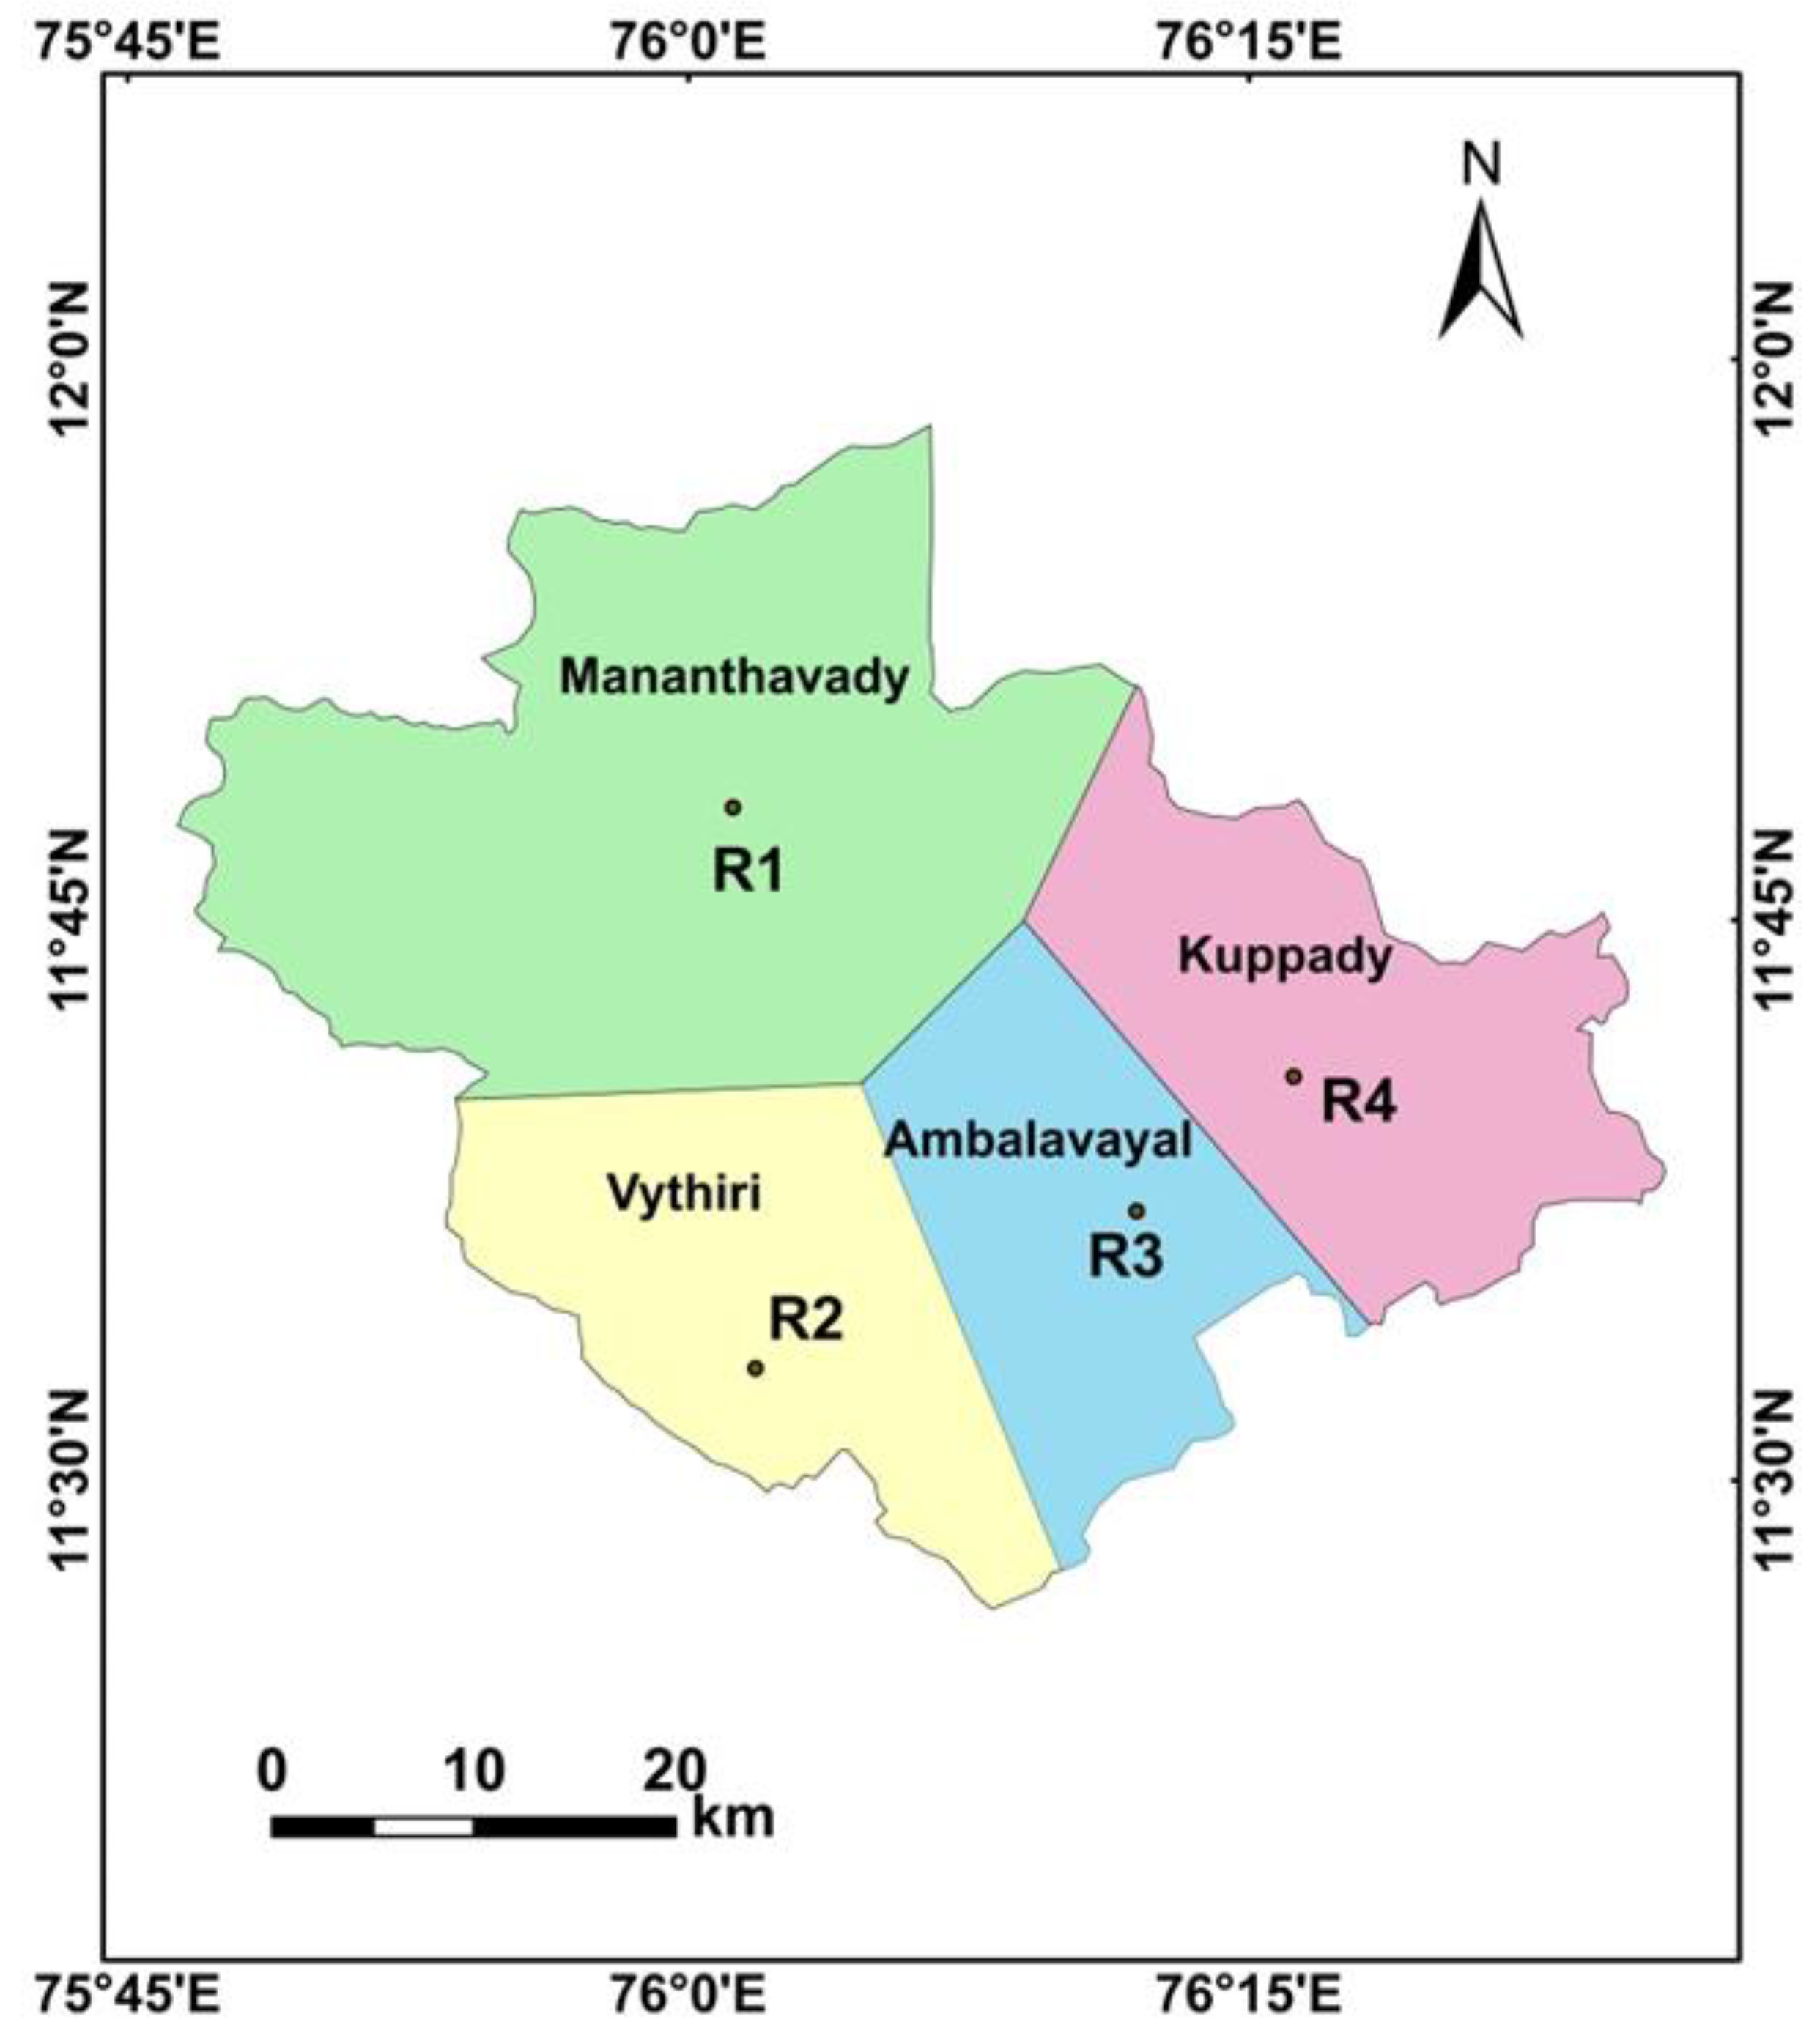
35]. To correlate each landslide to the nearest rain gauge, the district was divided into four zones, based on the spatial distribution of rain gauges, by means of the Thiessen polygons technique, as shown in
Figure 6. The method is based on a proximal mapping in which the estimate of rainfall at any point is considered equal to the observation of the nearest sampling point in the area [
47]. Based on the location of the landslides, the triggering rainfall was identified using the data from the rain gauge stations, using different approaches. Since the temporal resolution of available rainfall data is one day, multiple landslides within the same polygon that occurred on the same day were counted as a single landslide event for the definition of intensity–duration threshold. The first approach was based on a regional scale, where the nearest rain gauge was chosen as the reference gauge and data from all four rain gauges are merged to establish one single regional scale threshold (merged threshold).
Considering the vastness of area and geographical settings, the measurement from the nearest available rain gauge could underestimate the threshold as the localized convective storms might not be recorded at the rain gauge location [
35]. Hence, another approach was adopted in which the rain gauge which records the maximum average intensity was chosen as the reference gauge, irrespective of the spatial distribution (Imax threshold).
In the third approach, the peak daily intensity observed from the beginning of landslide event was considered for the analysis instead of the average intensity (Peak I threshold). The reason for a deviation from the conventional average intensity approach is the possible avoidance of the underestimation of thresholds due to the low density of rain gauges.
Lastly, analyses were conducted separately on a local scale, so that four thresholds were derived separately for each polygon (R1, R2, R3 and R4 thresholds).
Separate intensity–duration thresholds were defined for each approach with different exceedance probabilities of 5%, 2.5%, 1% and 0.05% to find the best suited method.
3. Results
3.1. Statistical Analysis
According to Caine [
24], intensity–duration thresholds are defined as a power-law in the following form:
where I is the mean intensity, expressed in mm h
−1, D is the duration in hours and α and β are empirically derived parameters. α is the scaling constant, which defines the intercept, and β defines the slope of the power-law curve. In this study, two rainfall events are considered separate if there is no precipitation for a minimum period of 24 hours (one day) in between, and the frequentist method is adopted to establish a regional scale threshold for Wayanad district.
This approach uses the least square method to find the best fit line [
34]. Taking into account the variation of intensity values, the values were first log-transformed to avoid problems in fitting the data. In a log vs. log plot, the data is fitted using a straight line with the equation
which is equivalent to the power-law in Equation (1). From Equation (2), the values of α and β can be calculated, as Logα is the intercept and β is the slope of the straight line.
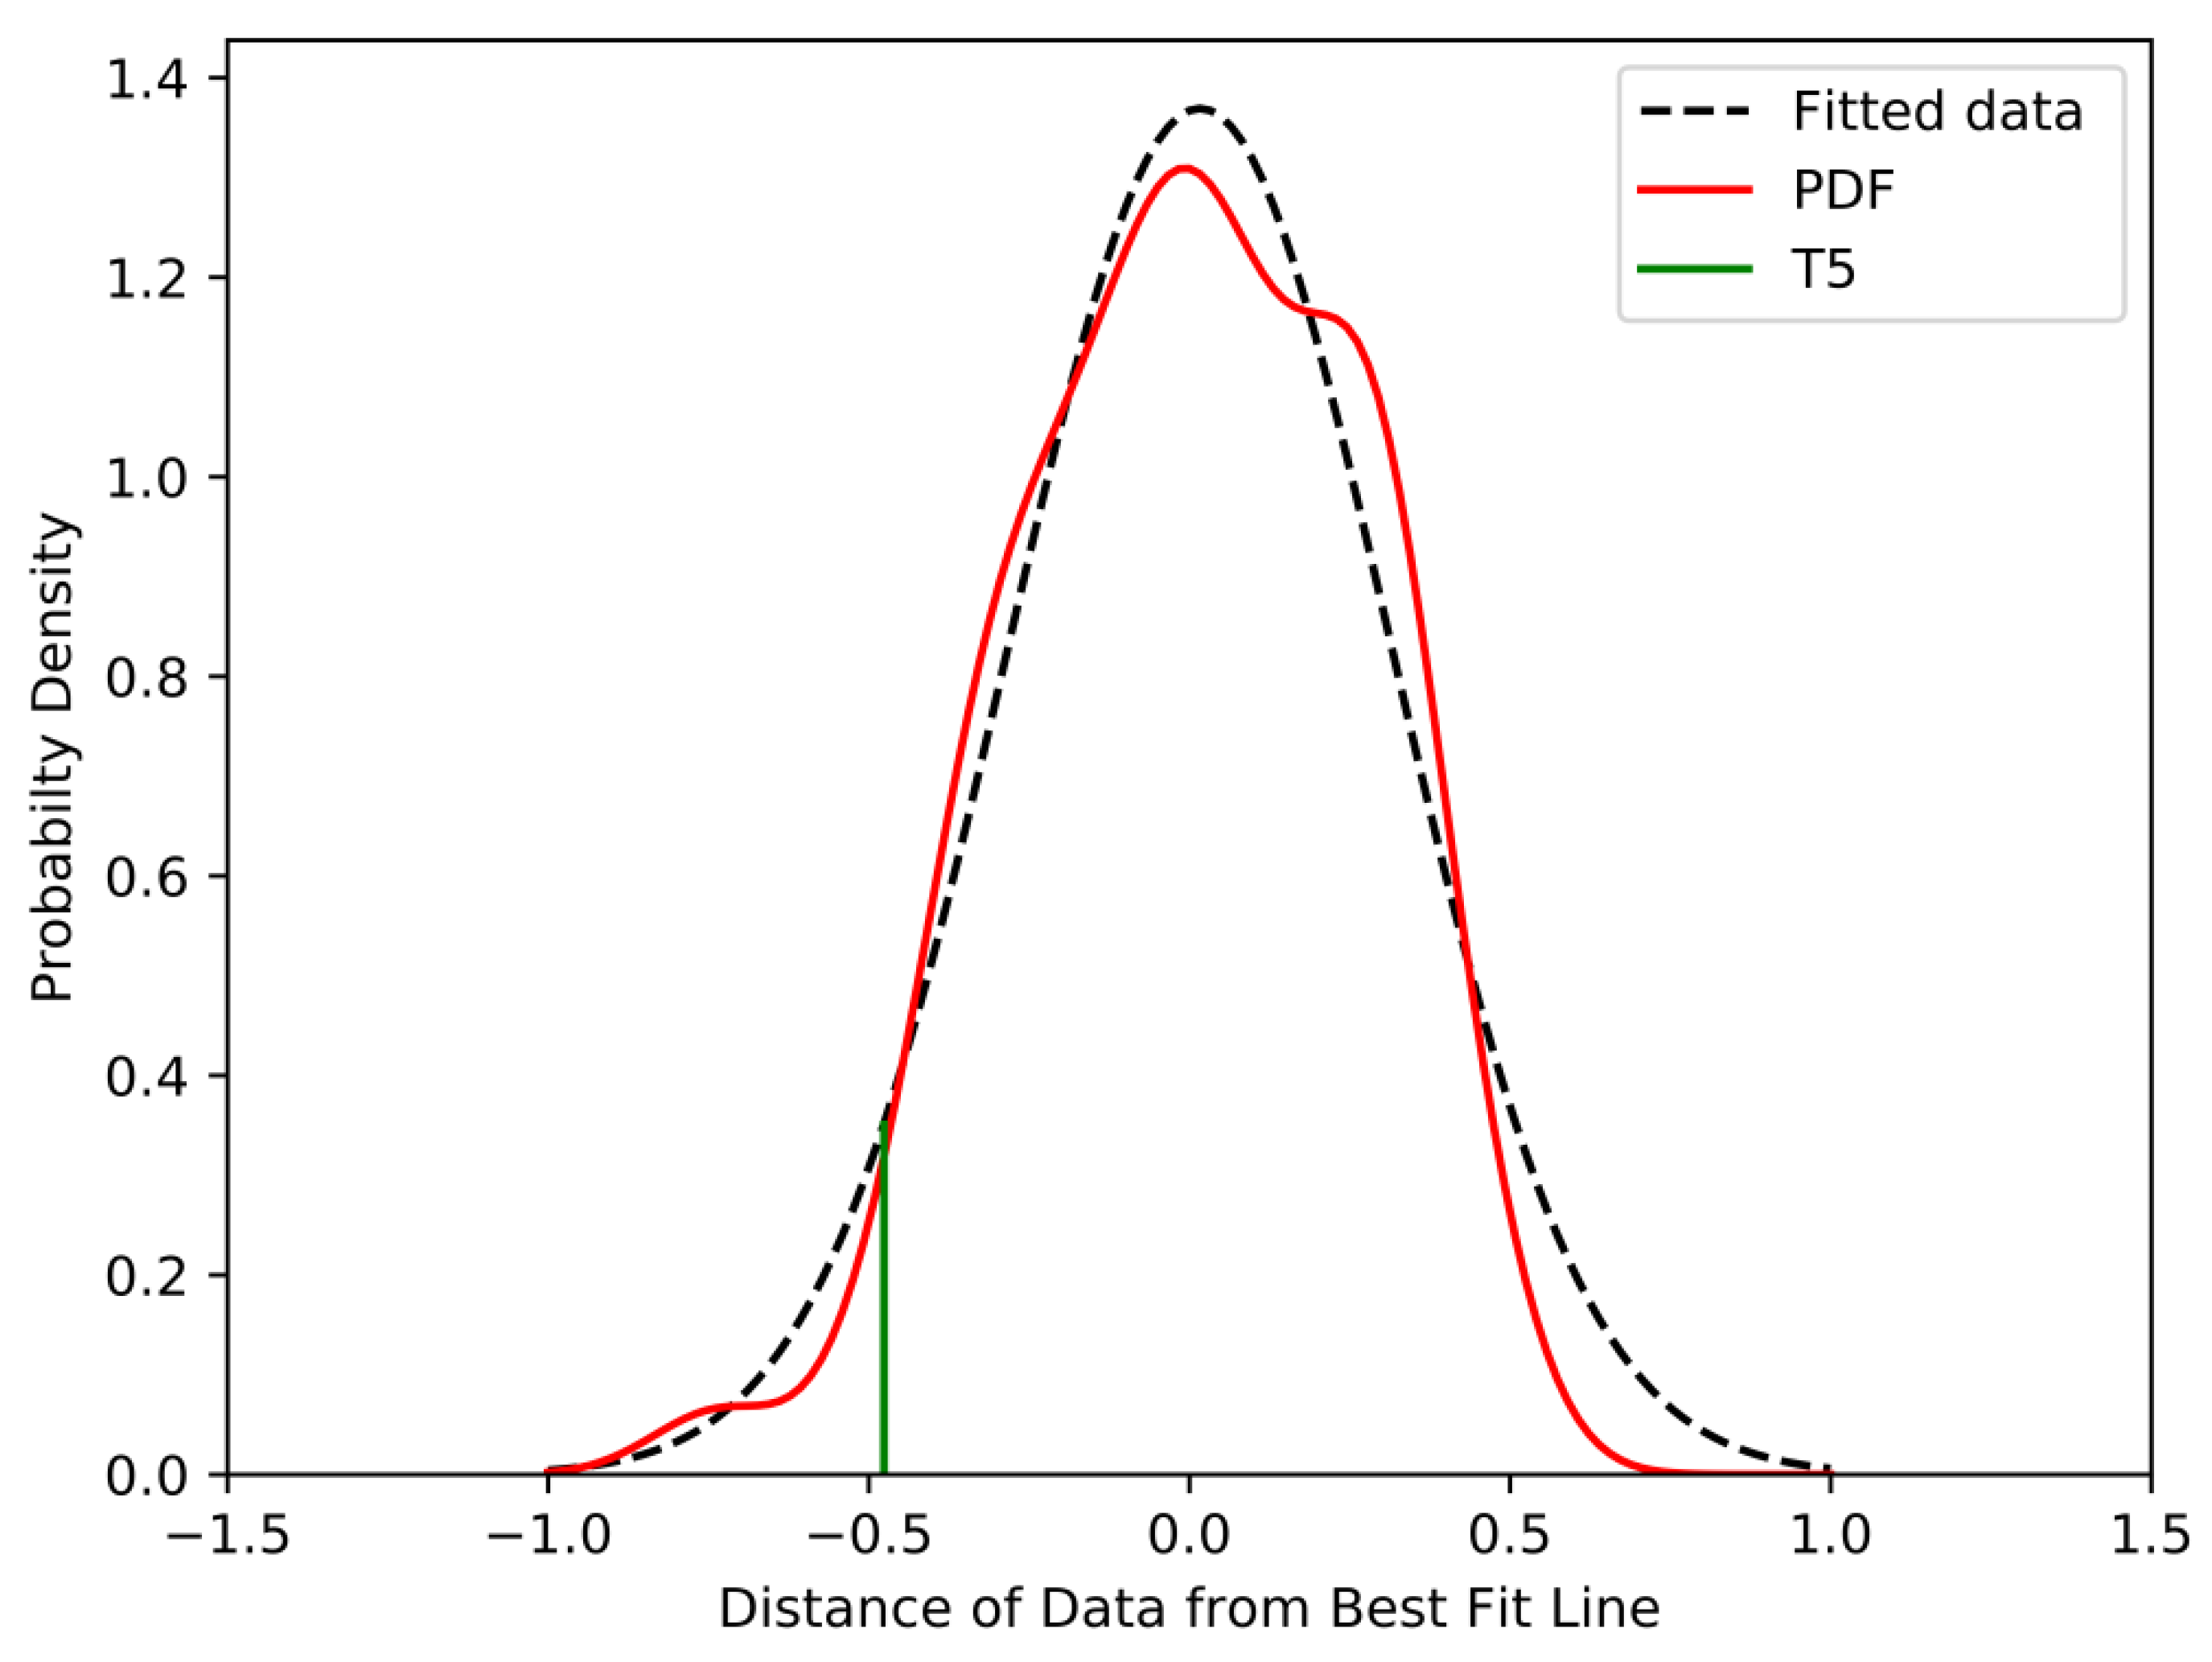
The difference in y coordinates of each event with the best fit line is then calculated and termed as δI, which is obtained by the following equation:
where Log I
f(D) is the y co-ordinate on best-fit line, and Log I(D) is the mean intensity associated with each event. The distribution of δI is then fitted using a kernel density function of the form.
The data are found to follow a distribution similar to the standard Gaussian distribution. The Gaussian fit of the probability density function is shown in
Figure 7 as the dotted line. The threshold lines of different exceedance probabilities were calculated using the fitted distribution of δI. The distance Δ between the best-fit line and the T line is used to calculate the intercept of threshold line in the log vs. log plot. An exceedance probability of 5% indicates that the probability of occurrence of landslides below this threshold is less than 5% [
34]. The threshold of 5% exceedance is plotted according to the shift Δ.
3.2. Empirical Thresholds
Among the 123 landslide events recorded in the study period, 51 events occurred within the first polygon Mananthavady, 36 events in the second polygon Vythiri, 15 events in the third polygon Ambalayavayal and 21 events within the last polygon, Kuppadi. As described earlier, four different approaches were used to define thresholds using the Frequentist method for the study area.
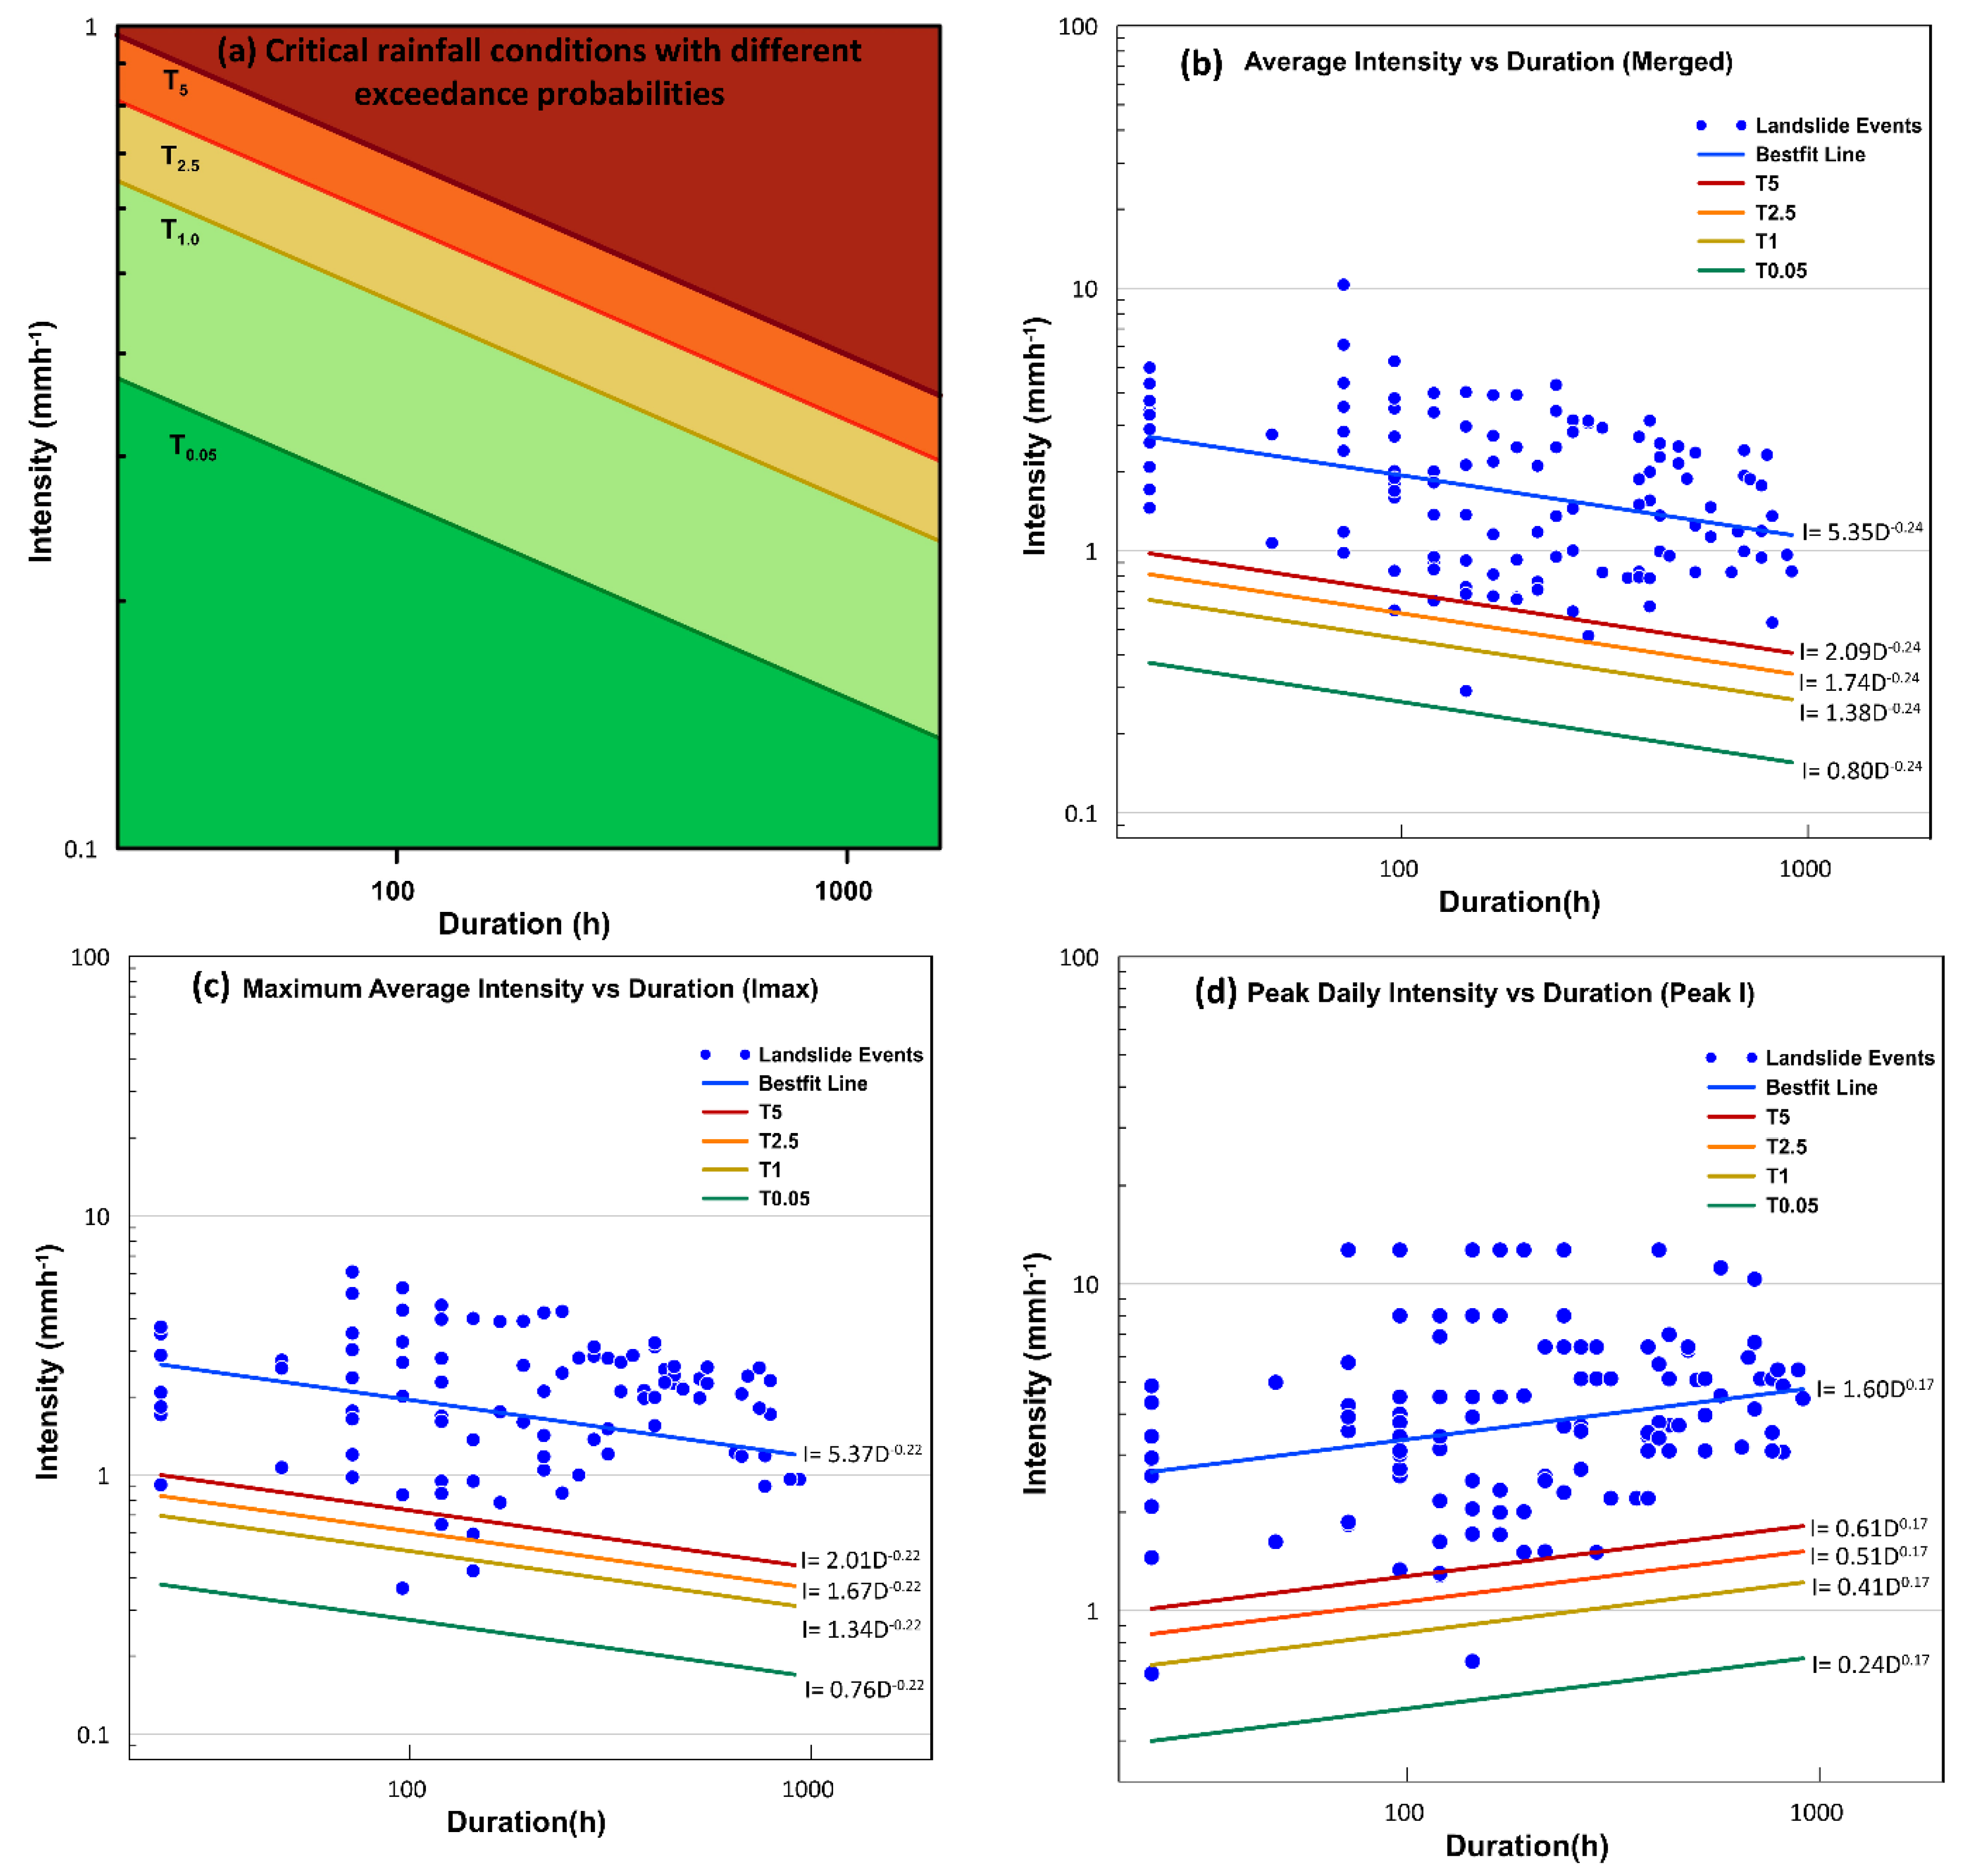
Using the frequentist approach, thresholds of several exceedance probabilities are defined for the study area (
Figure 8a). Out of the 123 landslide events considered for the analysis, 5% of events are expected to fall below the T5 line, 2.5% below the T2.5 line and 1% events are below T1 line. No events are expected to fall below the threshold line of 0.05% exceedance probability for such a small dataset, which makes the line well below the possible critical conditions. All defined threshold lines are observed to follow this pattern.
For Wayanad district, new rainfall thresholds were defined for possible landslide initiation, based on the frequentist approach. All three regional scale thresholds are following the pattern as depicted in
Figure 8a, in terms of percentage events below each threshold line. The merged thresholds have the highest slope of −0.24 but lesser intercept values than Imax thresholds. For Imax thresholds, the rainfall event with maximum average intensity among the four rain gauge stations was considered for analysis. In most of the cases, it was observed that the nearest rain gauge recorded the maximum average precipitation, and, in some cases, other rain gauges were chosen for analysis. Thus, the intercept of the threshold is slightly higher than that of merged data with a lesser slope. The peak I threshold follows a pattern which is different from the power-law form associated to intensity–duration thresholds as described in the work of Caine [
24]: the resulting slope of the threshold is a positive value. The reason for this could be that in the meteo-climatic setting of the study area, the total duration (D) of the main event and the peak intensity registered in one of the sub-events are completely independent and the relationship among them leads to an equation form that does not follow the power-law form discovered by Caine. On the contrary, the longer the main rainfall event, the higher the possibility of more intense bursts of rain, hence the positive exponent of the power-law function reported in
Figure 8d.
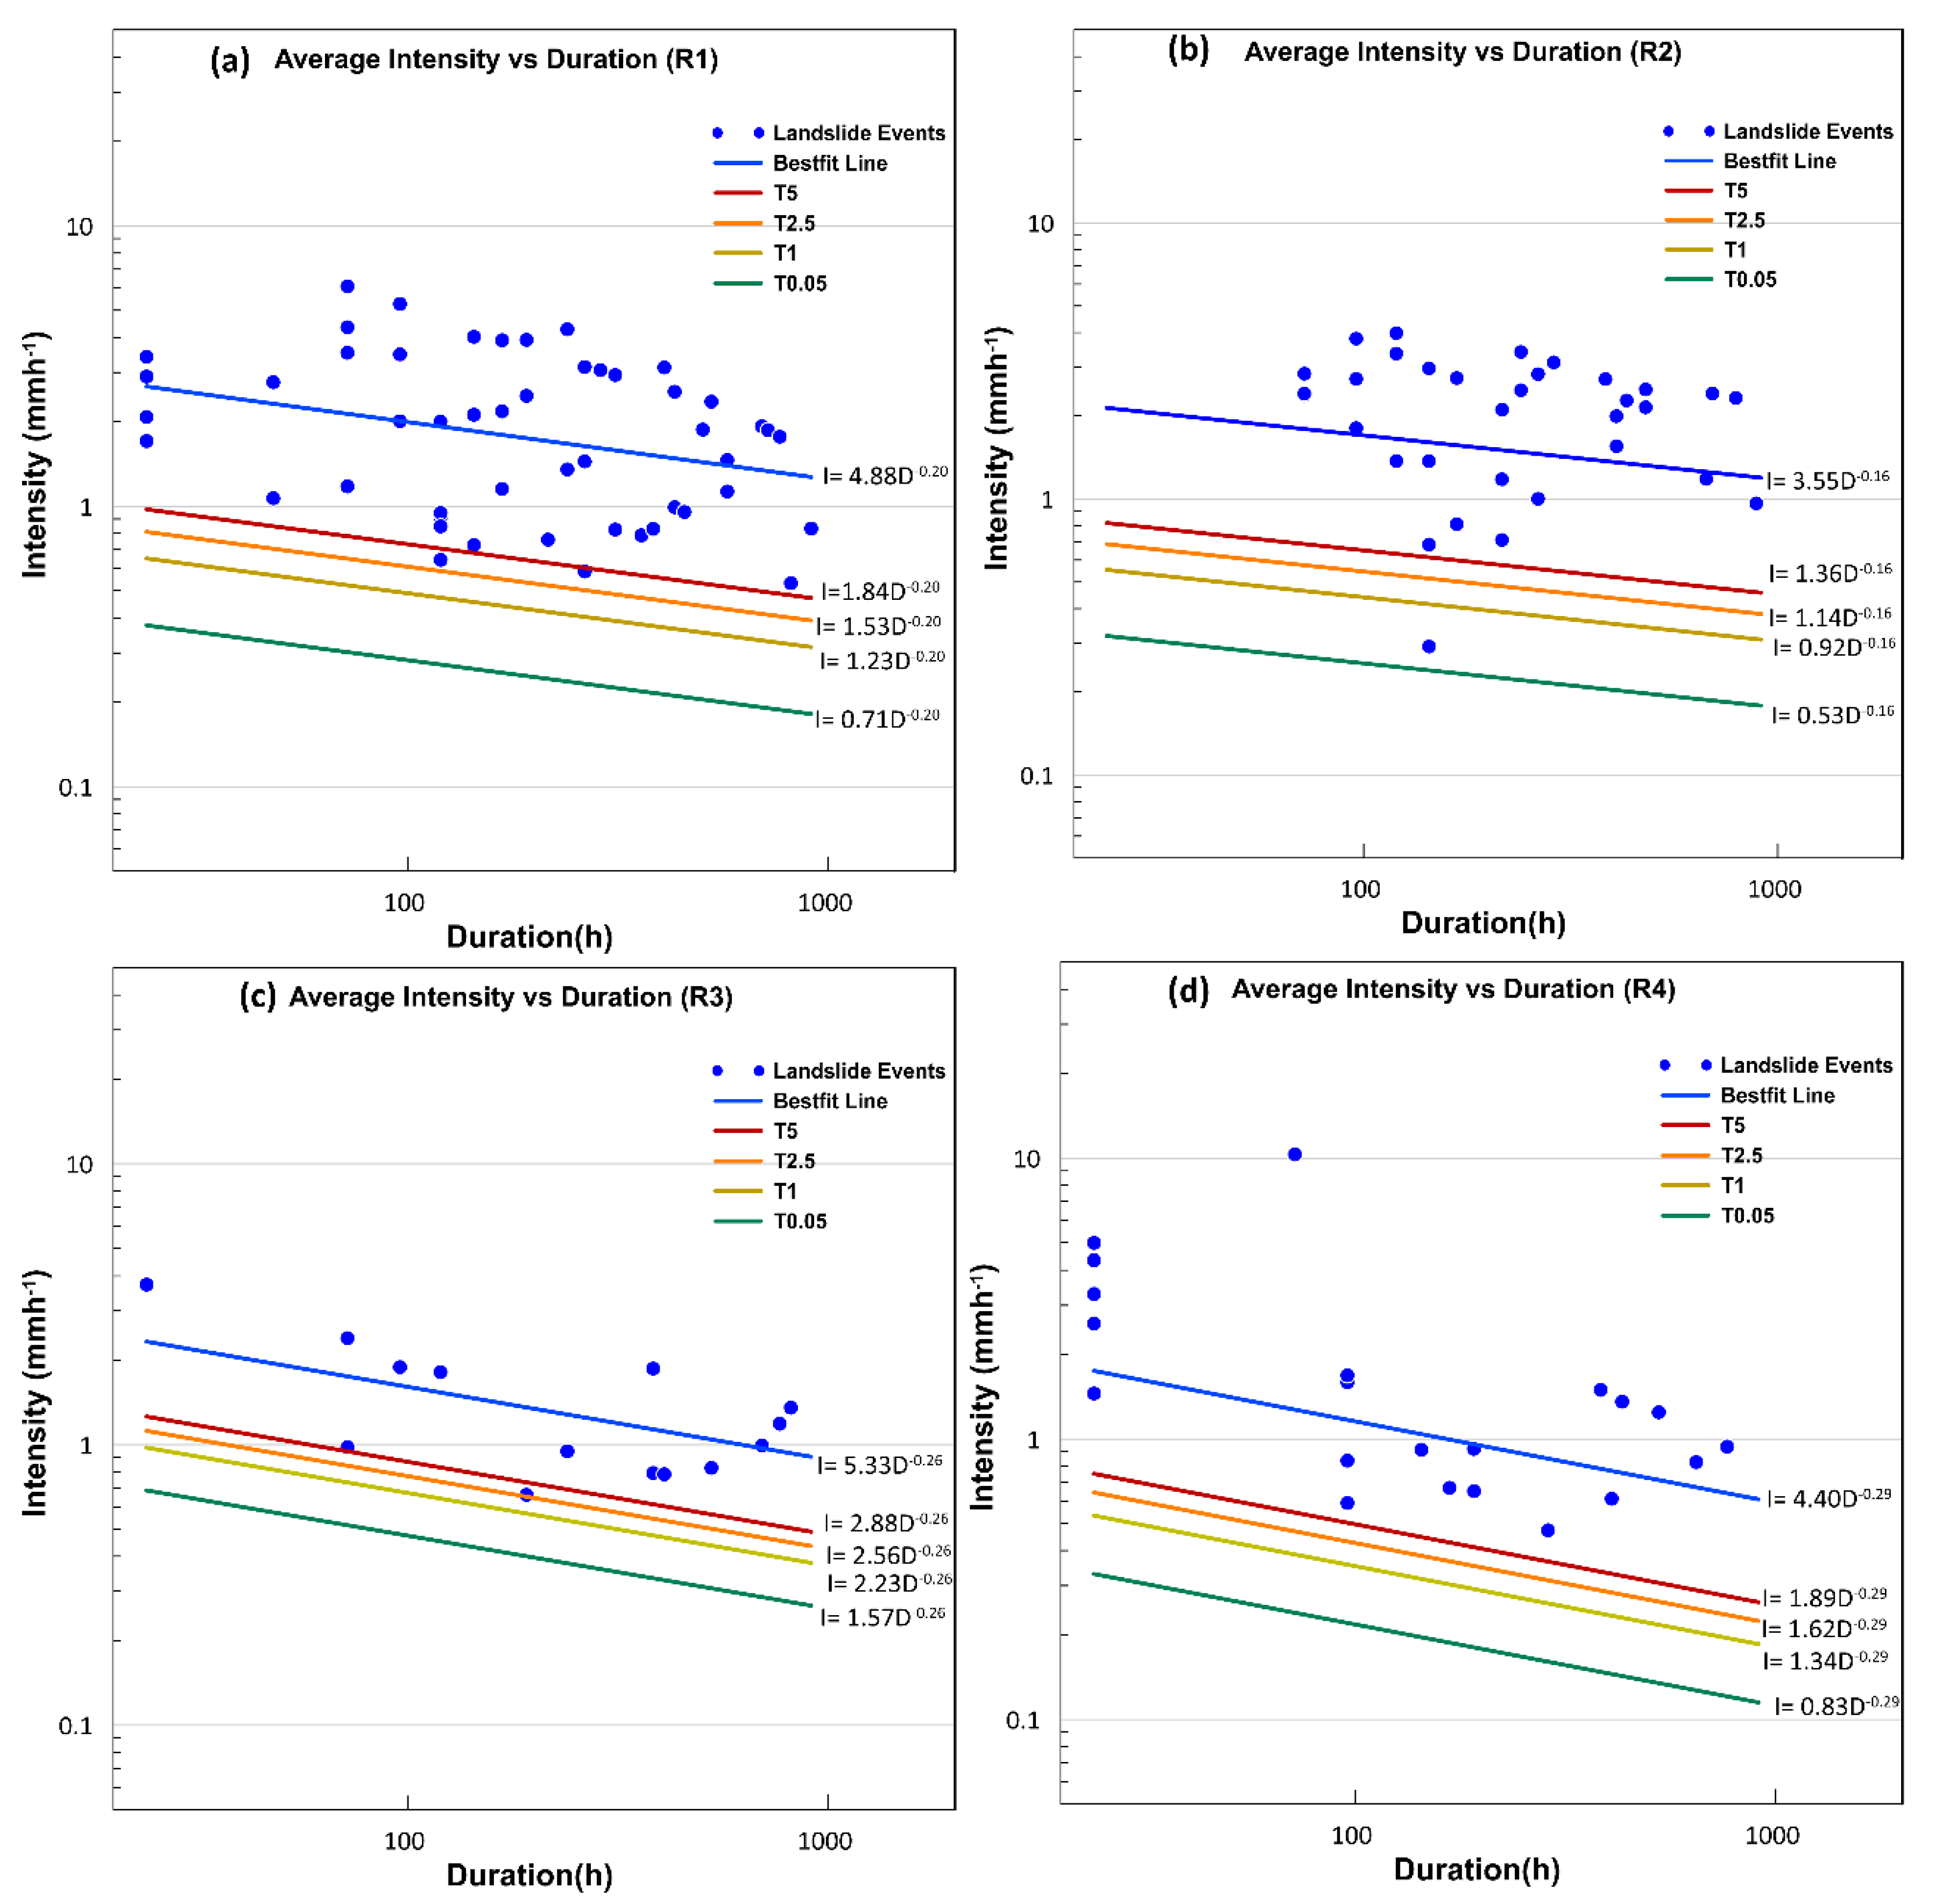
From
Figure 9, it can be inferred that the rainfall conditions that triggered landslides in the four separate polygons are slightly different from each other. Polygon 1 (Manathavady) covers the maximum area and most of the landslide incidences are found to be located within the boundary. The rainfall parameters that triggered landslides in Polygon 1 and Polygon 2 are characterized by relatively higher intensity, and hence the slope of threshold curves is less than that of the merged data. These regions are affected by large flows as the high-altitude regions in the district falls within these polygons. In Polygon 3 (Ambalavayal), the number of events is the least and the observed events were the results of relatively higher intensity rainfalls. In Polygon 3 and Polygon 4 (Kuppadi), most of the incidences recorded were earth slides and cut slope failures. These polygons are at lesser elevations, with moderate to low dissected plateau geomorphological conditions, and the slope failures are induced by anthropogenic activities in the pursuit of infrastructure development. Since the number of events considered in each polygon is lower, the percentage distribution of landslides below each threshold line is slightly different from that shown in
Figure 8a. For a better comparison of the threshold pattern, all thresholds were plotted on the same graph for all the four exceedance probabilities as shown in
Figure 10. This helps for an easy comparison of the defined thresholds at each level of exceedance.
From
Figure 10, it can be observed that for all exceedance levels, the relative positions of all the defined thresholds follow a similar pattern. Peak I and R3 thresholds are much higher than all the other thresholds. At lesser durations, Peak I thresholds are observed to be lower than R3 and the reverse is observed during higher durations. R4 thresholds are the lowest in all cases, as the region is characterized by less intensity rainfalls. R2 thresholds are conservative at lesser durations, but as the duration increases, the threshold curve crossed merged, Imax and R1 thresholds. R1 thresholds are observed to be in close similarity with the Imax values as at some exceedance probabilities, R1 is higher than both Imax and merged thresholds and generally at higher durations, the threshold becomes more conservative. The Imax thresholds are always higher than that of the merged thresholds with similar values at low durations. The shift between the two threshold lines increases as the duration increases.
4. Discussions
Choosing the best suited method from the obtained observations demands a detailed analysis of the effect of thresholds on the study area. Separate analyses were conducted for occurrences of landslides in each polygon using statistics. As pointed out in a recent study, statistical attributes are reliable parameters that can be used to compare different methodologies for the definition of threshold [
48]. When the available information about the distribution of rainfall is coarse, the possibilities for underestimating the threshold values are higher. From an operational point of view, this could possibly lead to a number of false alarms. Hence, it is important to complete quantitative analysis using statistical attributes. The attributes are calculated using a confusion matrix, comparing the prediction of each defined threshold and the occurrence of landslides. Everyday prediction of thresholds during the study period (2010–2018) was used for the verification of the thresholds. True positives are counted when the threshold is crossed, and a landslide is reported on the day. If no landslides are reported when a threshold is crossed, it is counted as a false positive. Similarly, if landslides are reported without the crossing of threshold, it is considered as a missed alarm and counted as a false negative. When thresholds are not exceeded and landslides are not reported, true negatives are counted.
A perfect model would predict all the landslides correctly without any false positives or false negatives. The performances of our tests are far from perfection, but the main objective of this work is to discuss the results in a relative way to compare the different approaches used for threshold analysis. The higher the number of true positives and true negatives, the better the model. Here, we use derived parameters like efficiency, sensitivity, specificity and the likelihood ratio for a better understanding of the relative performance of different thresholds. The aforementioned statistics can help optimize the threshold model configuration, identifying a balance between false and missed alarms prediction. The results are summarized in
Table 1 below.
The higher number of false positives in all the cases points towards less positive prediction power of the model. The very high number of true negatives in comparison with the order of other parameters increases the efficiency of the model. It can be stated that the thresholds are conservative in nature with much lower false negatives, and the Negative Predictive Power is very close to one in all the cases. As expected, with the decrease in exceedance probability, the number of false positives is increasing, which reduces the efficiency considerably. If the exceedance probability increases by more than 5, the number of missed alarms will increase beyond 5%, which is also not acceptable. Hence, when defining a threshold, a 5% exceedance probability can be considered.
A perfect prediction model should have the sensitivity and specificity values as one. Sensitivity is a key towards the true positive rate of the model, and specificity is an indication towards the true negative rate. In this study, T0.05 thresholds have sensitivity values as one, but this happens at the cost of very low specificity values, which is not acceptable. The likelihood ratio can be considered as the term which considers the effect of both sensitivity at the same time and can be taken as a reliable parameter for comparison of different methods [
49]. It can be understood from the analysis that Imax thresholds have the maximum likelihood ratio in three different exceedance probabilities. At the same time, in each polygon, the separate thresholds derived perform well. Hence, this study proposes a regional scale threshold of 5% exceedance probability using the Imax approach and four separate thresholds for each polygon operating on a local scale.
If polygons defined thresholds as lower than the merged dataset (R2 and R4), single regional scale thresholds perform better than the separate polygon-wise threshold due to a lower number of false alarms. In the other two polygons, polygon-wise thresholds (R1 and R3) can be opted over the regional scale thresholds. Separate local scale thresholds have the advantage of more uniform climatic and geological conditions, but the lower number of events used for calibration especially in R3 and R4 is the major constraint in the definition. However, while creating a single dataset for the whole region, the merged approach of considering the nearest rain gauge is less likely to be adopted than the Imax approach. In case of peak I approach, the occurrence of high intensity rainfalls in the beginning of rainfall event will produce a false alarm which will be sustained throughout the event, predicting the possibility of a landslide. Even though the defined thresholds appear to be higher than all the other approaches, this method is not found to be effective in reducing false alarms.
These results are useful to understand the sensitivity of I–D threshold models to some boundary conditions such as the rain gauge selection, the intensity definition and the strategy of subdividing the area into independent alert zones. Unfortunately, the derived thresholds are not ready to be operated into a LEWS, but still the results highlighted the shortcomings that could be addressed with future improvements. For instance, it would be very useful to use rainfall with higher temporal resolutions (e.g., hourly) and to take into account the effect of antecedent rainfall conditions during the monsoon season by using some state-of-the-art approaches like weighted antecedent precipitation indexes [
49,
50,
51] or soil moisture estimates [
21].
5. Conclusions
A new landslide catalogue was prepared for Wayanad district, Kerala, India, compiling information from different data sources. The catalogue consists of landslide events that happened from 2010 to 2018 in the district. With the available data, rainfall events associated with each landslide was identified using the data from four rain gauges located at different places in the district.
The catalogue was used to determine intensity–duration thresholds on regional and local scales, which is the first attempt of its kind for the study area. Four different approaches were adopted in the study to develop intensity–duration thresholds by varying the selection of rain gauge, area considered and definition of rainfall parameters. After the analysis, it can be concluded that on a regional scale, selecting the rain gauge based on maximum average intensity (Imax) performs better than choosing the nearest rain gauge. Four separate thresholds for each polygon considered are also proposed in this study.
On a regional scale, with 5% exceedance probability, a rainfall of intensity 1mm h−1 of a one-day duration is potent enough to trigger landslides in Wayanad district. It is also observed that Mananthavady and Vythiri polygons are more susceptible to landslides than the other two regions. The intensity of rainfall of a one-day duration which can possibly trigger a landslide in the Mananthavady, Vythiri, Ambalavayal and Kuppady polygons are 0.97 mm h−1, 0.82 mm h−1, 1.26 mm h−1 and 0.75 mm h−1 respectively. The Ambalavayal polygon can be considered as a relatively less vulnerable region with a lower number of landslide events and higher threshold values.
The study emphasizes the importance of the preparation of landslide catalogues and determination of rainfall thresholds for Wayanad region. An effective LEWS is an immediate requirement in the region, and the study has to be further enhanced with state-of-the-art models developed for other parts in the world. The existing model can also be conceptually modified using precise field monitoring techniques as well. Attempts must be made to reduce the false alarms to develop an operational rainfall threshold model to function as a Landslide Early Warning System for the region.
Author Contributions
Conceptualization, M.T.A., S.S. and N.S.; methodology, M.T.A. and S.S.; data curation, M.T.A.; writing—original draft preparation, M.T.A. and A.R.; writing—review and editing, S.S., B.P. and N.S.; supervision, N.S. and B.P; funding acquisition, S.S. All authors have read and agreed to the published version of the manuscript.
Funding
Florence University, in the framework of the project SAMUELESEGONIRICATEN20.
Acknowledgments
The authors express their sincere gratitude to Geological Survey of India, Kerala SU, District Soil Conservation Office Wayanad and Kerala State Disaster Management Authority (KSDMA) for their support throughout the study.
Conflicts of Interest
The authors declare no conflict of interest.
References
- Griffiths, J.S.; Whitworth, M. Engineering geomorphology of landslides. In Landslides: Types, Mechanisms and Modeling; Clague, J.J., Stead, D., Eds.; Cambridge University Press: Cambridge, UK, 2015; pp. 172–186. ISBN 9780511740367. [Google Scholar]
- Petley, D. Global patterns of loss of life from landslides. Geology 2012, 40, 927–930. [Google Scholar] [CrossRef]
- Soja, R.; Starkel, L. Extreme rainfalls in Eastern Himalaya and southern slope of Meghalaya Plateau and their geomorphologic impacts. Geomorphology 2007, 84, 170–180. [Google Scholar] [CrossRef] [Green Version]
- Kuriakose, S.L.; Jetten, V.G.; van Westen, C.J.; Sankar, G.; van Beek, L.P.H. Pore water pressure as a trigger of shallow landslides in the Western Ghats of Kerala, India: Some preliminary observations from an experimental catchment. Phys. Geogr. 2008, 29, 374–386. [Google Scholar] [CrossRef]
- Abraham, M.T.; Pothuraju, D.; Satyam, N. Rainfall Thresholds for Prediction of Landslides in Idukki, India: An Empirical Approach. Water 2019, 11, 2113. [Google Scholar] [CrossRef] [Green Version]
- Dikshit, A.; Satyam, D.N. Estimation of rainfall thresholds for landslide occurrences in Kalimpong, India. Innov. Infrastruct. Solut. 2018, 3, 24. [Google Scholar] [CrossRef]
- Gariano, S.L.; Guzzetti, F. Landslides in a changing climate. Earth Sci. Rev. 2016, 162, 227–252. [Google Scholar] [CrossRef] [Green Version]
- Martelloni, G.; Segoni, S.; Fanti, R.; Catani, F. Rainfall thresholds for the forecasting of landslide occurrence at regional scale. Landslides 2012, 9, 485–495. [Google Scholar] [CrossRef] [Green Version]
- Teja, T.S.; Dikshit, A.; Satyam, N. Determination of Rainfall Thresholds for Landslide Prediction Using an Algorithm-Based Approach: Case Study in the Darjeeling Himalayas, India. Geosciences 2019, 9, 302. [Google Scholar] [CrossRef] [Green Version]
- Dikshit, A.; Satyam, N.; Pradhan, B. Estimation of Rainfall—Induced Landslides Using the TRIGRS Model. Earth Syst. Environ. 2019, 3, 575–584. [Google Scholar] [CrossRef]
- Dikshit, A.; Satyam, N. Probabilistic rainfall thresholds in Chibo, India: Estimation and validation using monitoring system. J. Mt. Sci. 2019, 16, 870–883. [Google Scholar] [CrossRef]
- Abraham, M.T.; Satyam, N.; Pradhan, B.; Alamri, A.M. Forecasting of Landslides Using Rainfall Severity and Soil Wetness: A Probabilistic Approach for Darjeeling Himalayas. Water 2020, 12, 804. [Google Scholar] [CrossRef] [Green Version]
- Berti, M.; Martina, M.L.V.; Franceschini, S.; Pignone, S.; Simoni, A.; Pizziolo, M. Probabilistic rainfall thresholds for landslide occurrence using a Bayesian approach. J. Geophys. Res. Earth Surf. 2012, 117. [Google Scholar] [CrossRef] [Green Version]
- Capparelli, G.; Calabria, U.; Tiranti, D.; Calabria, U. Forecasting of landslides induced by rainfall—F. La. IR hydrological model application on Piemonte Region (NW Italy). Geophys. Res. Abstr. 2007, 9, 02298. [Google Scholar]
- Zhou, W.; Tang, C. Rainfall thresholds for debris flow initiation in the Wenchuan earthquake-stricken area, southwestern China. Landslides 2014, 11, 877–887. [Google Scholar] [CrossRef]
- Capparelli, G.; Tiranti, D. Application of the MoniFLaIR early warning system for rainfall-induced landslides in Piedmont region (Italy). Landslides 2010, 7, 401–410. [Google Scholar] [CrossRef]
- Capparelli, G.; Versace, P. FLaIR and SUSHI: Two mathematical models for early warning of landslides induced by rainfall. Landslides 2011, 8, 67–79. [Google Scholar] [CrossRef]
- Lagomarsino, D.; Segoni, S.; Fanti, R.; Catani, F. Updating and tuning a regional-scale landslide early warning system. Landslides 2013, 10, 91–97. [Google Scholar] [CrossRef]
- Rosi, A.; Canavesi, V.; Segoni, S.; Dias Nery, T.; Catani, F.; Casagli, N. Landslides in the Mountain Region of Rio de Janeiro: A Proposal for the Semi-Automated Definition of Multiple Rainfall Thresholds. Geosciences 2019, 9, 203. [Google Scholar] [CrossRef] [Green Version]
- Rosi, A.; Peternel, T.; Jemec-Auflič, M.; Komac, M.; Segoni, S.; Casagli, N. Rainfall thresholds for rainfall-induced landslides in Slovenia. Landslides 2016, 13, 1571–1577. [Google Scholar] [CrossRef]
- Segoni, S.; Rosi, A.; Lagomarsino, D.; Fanti, R.; Casagli, N. Brief communication: Using averaged soil moisture estimates to improve the performances of a regional-scale landslide early warning system. Nat. Hazards Earth Syst. Sci. 2018, 18, 807–812. [Google Scholar] [CrossRef] [Green Version]
- Segoni, S.; Rosi, A.; Fanti, R.; Gallucci, A.; Monni, A.; Casagli, N. A regional-scale landslide warning system based on 20 years of operational experience. Water 2018, 10, 1297. [Google Scholar] [CrossRef] [Green Version]
- Segoni, S.; Rossi, G.; Rosi, A.; Catani, F. Landslides triggered by rainfall: A semi-automated procedure to define consistent intensity-duration thresholds. Comput. Geosci. 2014, 63, 123–131. [Google Scholar] [CrossRef]
- Caine, N. The rainfall intensity-duration control of shallow landslides and debris flows: An update. Geogr. Ann. Ser. A Phys. Geogr. 1980, 62, 23–27. [Google Scholar]
- Aleotti, P. A warning system for rainfall-induced shallow failures. Eng. Geol. 2004, 73, 247–265. [Google Scholar] [CrossRef]
- Crosta, G.B.; Frattini, P. Rainfall thresholds for soil slip and debris flow triggering. In Proceedings of the EGS 2nd Plinius Conference on Mediterranean Storms, Siena, Italy, 16–18 October 2001; pp. 463–487. [Google Scholar]
- Guzzetti, F.; Peruccacci, S.; Rossi, M.; Stark, C.P. Rainfall thresholds for the initiation of landslides in central and southern Europe. Meteorol. Atmos. Phys. 2007, 98, 239–267. [Google Scholar] [CrossRef]
- Guzzetti, F.; Peruccacci, S.; Rossi, M.; Stark, C.P. The rainfall intensity-duration control of shallow landslides and debris flows: An update. Landslides 2008, 5, 3–17. [Google Scholar] [CrossRef]
- Ma, T.; Li, C.; Lu, Z.; Bao, Q. Rainfall intensity-duration thresholds for the initiation of landslides in Zhejiang Province, China. Geomorphology 2015, 245, 193–206. [Google Scholar] [CrossRef]
- Guo, X.; Cui, P.; Li, Y.; Ma, L.; Ge, Y.; Mahoney, W.B. Intensity-duration threshold of rainfall-triggered debris flows in the Wenchuan Earthquake affected area, China. Geomorphology 2016, 253, 208–216. [Google Scholar] [CrossRef]
- Lazzari, M.; Piccarreta, M. Landslide disasters triggered by extreme rainfall events: The case of montescaglioso (Basilicata, Southern Italy). Geosciences 2018, 8, 377. [Google Scholar] [CrossRef] [Green Version]
- Marc, O.; Stumpf, A.; Malet, J.P.; Gosset, M.; Uchida, T.; Chiang, S.H. Initial insights from a global database of rainfall-induced landslide inventories: The weak influence of slope and strong influence of total storm rainfall. Earth Surf. Dyn. 2018, 6, 903–922. [Google Scholar] [CrossRef] [Green Version]
- Segoni, S.; Rosi, A.; Rossi, G.; Catani, F.; Casagli, N. Analysing the relationship between rainfalls and landslides to define a mosaic of triggering thresholds for regional scale warning systems. Nat. Hazards Earth Syst. Sci. 2014, 2, 2185–2213. [Google Scholar] [CrossRef]
- Brunetti, M.T.; Peruccacci, S.; Rossi, M.; Luciani, S.; Valigi, D.; Guzzetti, F. Rainfall thresholds for the possible occurrence of landslides in Italy. Nat. Hazards Earth Syst. Sci. 2010, 10, 447–458. [Google Scholar] [CrossRef]
- Segoni, S.; Piciullo, L.; Gariano, S.L. A review of the recent literature on rainfall thresholds for landslide occurrence. Landslides 2018, 15, 1483–1501. [Google Scholar] [CrossRef]
- Palenzuela, J.A.; Jiménez-Perálvarez, J.D.; Chacón, J.; Irigaray, C. Assessing critical rainfall thresholds for landslide triggering by generating additional information from a reduced database: An approach with examples from the Betic Cordillera (Spain). Nat. Hazards 2016, 84, 185–212. [Google Scholar] [CrossRef]
- Winter, M.G.; Dent, J.; Macgregor, F.; Dempsey, P.; Motion, A.; Shackman, L. Debris flow, rainfall and climate change in Scotland. Q. J. Eng. Geol. Hydrogeol. 2010, 43, 429–446. [Google Scholar] [CrossRef]
- Marra, F.; Destro, E.; Nikolopoulos, E.I.; Zoccatelli, D.; Dominique Creutin, J.; Guzzetti, F.; Borga, M. Impact of rainfall spatial aggregation on the identification of debris flow occurrence thresholds. Hydrol. Earth Syst. Sci. 2017, 21, 4525–4532. [Google Scholar] [CrossRef] [Green Version]
- Kuriakose, S.L. Physically-based dynamic modelling of the effect of land use changes on shallow landslide initiation in the Western Ghats of Kerala, India. Ph.D. Thesis, University of Twente, Enschede, The Netherlands, 2010. [Google Scholar]
- Iida, T. A stochastic hydro-geomorphological model for shallow landsliding due to rainstorm. Catena 1999, 34, 293–313. [Google Scholar] [CrossRef] [Green Version]
- United Nations Development Programme. Kerala Post Disaster Needs Assessment Floods and Landslides-August 2018; United Nations Development Programme: Thiruvananthapuram, India, 2018. [Google Scholar]
- Department of Mining and Geology. District Survey Report of Minor Minerals; Department of Mining and Geology: Thiruvananthapuram, India, 2016.
- CartoDEM. Available online: https://bhuvan-app3.nrsc.gov.in/data/download/index.php (accessed on 20 August 2019).
- District Soil Conservation Office. Details of Landslip Damages in Agricultural Lands of Different Panchayats of Idukki District during the Monsoon 2018; District Soil Conservation Office: Wayanad, India, 2018.
- Battistini, A.; Segoni, S.; Manzo, G.; Catani, F.; Casagli, N. Web data mining for automatic inventory of geohazards at national scale. Appl. Geogr. 2013, 43, 147–158. [Google Scholar] [CrossRef]
- India Meteorological Department (IMD). Available online: http://dsp.imdpune.gov.in/ (accessed on 3 May 2019).
- Tabios, G.Q.; Salas, J.D. A Comparative Analysis of Techniques for Spatial Interpolation of Precipitation. JAWRA J. Am. Water Resour. Assoc. 1985, 21, 365–380. [Google Scholar] [CrossRef]
- Lagomarsino, D.; Segoni, S.; Rosi, A.; Rossi, G.; Battistini, A.; Catani, F.; Casagli, N. Quantitative comparison between two different methodologies to define rainfall thresholds for landslide forecasting. Nat. Hazards Earth Syst. Sci. 2015, 15, 2413–2423. [Google Scholar] [CrossRef] [Green Version]
- Ponziani, F.; Pandolfo, C.; Stelluti, M.; Berni, N.; Brocca, L.; Moramarco, T. Assessment of rainfall thresholds and soil moisture modeling for operational hydrogeological risk prevention in the Umbria region (central Italy). Landslides 2012, 9, 229–237. [Google Scholar] [CrossRef]
- Glade, T.; Crozier, M.; Smith, P. Applying probability determination to refine landslide-triggering rainfall thresholds using an empirical Antecedent Daily Rainfall Model. Pure Appl. Geophys. 2000, 157, 1059–1079. [Google Scholar] [CrossRef]
- Chen, G.; Zhao, J.; Yuan, L.; Ke, Z.; Gu, M.; Wang, T. Implementation of a Geological Disaster Monitoring and Early Warning System Based on Multi-source Spatial Data: A Case Study of Deqin County, Yunnan Province. Nat. Hazards Earth Syst. Sci. 2017, 1–15. [Google Scholar] [CrossRef] [Green Version]
© 2020 by the authors. Licensee MDPI, Basel, Switzerland. This article is an open access article distributed under the terms and conditions of the Creative Commons Attribution (CC BY) license (http://creativecommons.org/licenses/by/4.0/).

 ,
, 


