Flood Control Versus Water Conservation in Reservoirs: A New Policy to Allocate Available Storage


Civil Engineering Department: Hydraulics, Energy and Environment, Universidad Politécnica de Madrid, ES 28040 Madrid, Spain
*
Author to whom correspondence should be addressed.
Water 2020, 12(4), 994; https://doi.org/10.3390/w12040994
Submission received: 6 February 2020
/
Revised: 21 March 2020
/
Accepted: 26 March 2020
/
Published: 1 April 2020
(This article belongs to the Special Issue Water Resources Management Models for Policy Assessment)
Abstract
:The aim of this study is to contribute to solving conflicts that arise in the operation of multipurpose reservoirs when determining maximum conservation levels (MCLs). The specification of MCLs in reservoirs that are operated for water supply and flood control may imply a reduction in the volume of water supplied with a pre-defined reliability in the system. The procedure presented in this study consists of the joint optimization of the reservoir yield with a specific reliability subject to constraints imposed by hydrological dam safety and downstream river safety. We analyzed two different scenarios by considering constant or variable initial reservoir level prior to extreme flood events. In order to achieve the global optimum configuration of MCLs for each season, we propose the joint optimization of three variables: minimize the maximum reservoir level (return period of 1000 years), minimize the maximum released outflow (return period of 500 years) and maximize the reservoir yield with 90% reliability. We applied the methodology to Riaño Dam, jointly operated for irrigation and flood control. Improvements in the maximum reservoir yield (with 90% reliability) increased up to 10.1% with respect to the currently supplied annual demand (545 hm3) for the same level of dam and downstream hydrological safety. The improvement could increase up to 26.8% when compared to deterministic procedures. Moreover, dam stakeholders can select from a set of Pareto-optimal configurations depending on if their main emphasis is to maintain/increase the hydrological safety, or rather to maintain/increase the reservoir yield.
1. Introduction
Owing to increasingly risk-averse societies, stronger hydrological safety requirements are being imposed on existing dams in order to fulfil new regulations and prevent dam failures [1]. This problem can be addressed with two different kinds of technical solutions: hard solutions, as the alteration of dam spillways or elevation of dam crest and soft solutions, as the allocation of additional flood control volumes in the reservoir. Hard solutions increase the flood control capacity while maintaining the reservoir storage available for water supply. However, their main drawback is the need to allocate resources for infrastructure works. On the other hand, the implementation of soft solutions is easier and quicker, but can reduce the available volume to supply water with a specific reliability in a water system.
Allocation of flood control volume is addressed by defining a maximum conservation level (MCL), also known as flood-limited water level [2] or flood control level. MCL is the maximum operating level that the reservoir is allowed to reach under regular operation conditions. This reservoir level is below or equal to the maximum normal operating level (MNL) and can vary along the seasons of the year.
MCL is the most significant parameter in the trade-off established between flood control and water supply when increasing flood control volumes by soft solutions [3]. Traditionally, practitioners defining MCL only focused on hydrological dam and downstream safety. They frequently neglected other purposes of the reservoir, such as water supply and the economic consequences derived from loss of water yield reliability [4].
Some authors [3,5,6] have focused on accounting simultaneously for both regular (associated to water supply purposes of the reservoir) and flood control dam operations when defining MCLs. These studies analyzed hydrological dam safety by applying deterministic procedures, in which the return period associated to dam and downstream safety is assumed to be equal to the one associated to the flood event. Several authors [7,8] pointed out that hydrological dam safety and downstream safety should be assessed by analyzing the return periods of the maximum reservoir water levels and maximum outflows respectively.
Another relevant factor is that practitioners usually define MCLs assuming that the reservoir is at the maximum level under normal operating conditions prior to flood arrival [9,10,11]. This hypothesis results in conservative hydrological safety assessments. However, it can reduce the volume of water available to satisfy the demands of the water supply system because it influences the definition of MCLs. Accounting for the variability of the initial reservoir level in a hydrological dam and its downstream safety leads to more realistic results [8,12,13,14], which consequently can improve the definition of MCLs. Within this study, we propose a stochastic methodology to determine seasonal MCLs. The methodology combines three main innovative aspects:
- Stochastic assessment of hydrological dam and downstream river safety through return periods related to maximum reservoir levels and maximum outflows.
- Determination of MCLs that increase/maintain the water yield for a specific reliability while maintaining/improving hydrologic dam safety.
Determination of MCLs accounting for the variability of initial reservoir level prior to flood events.The methodology is illustrated through its application to a gated spillway dam located in Spain.
2. Materials and Methods
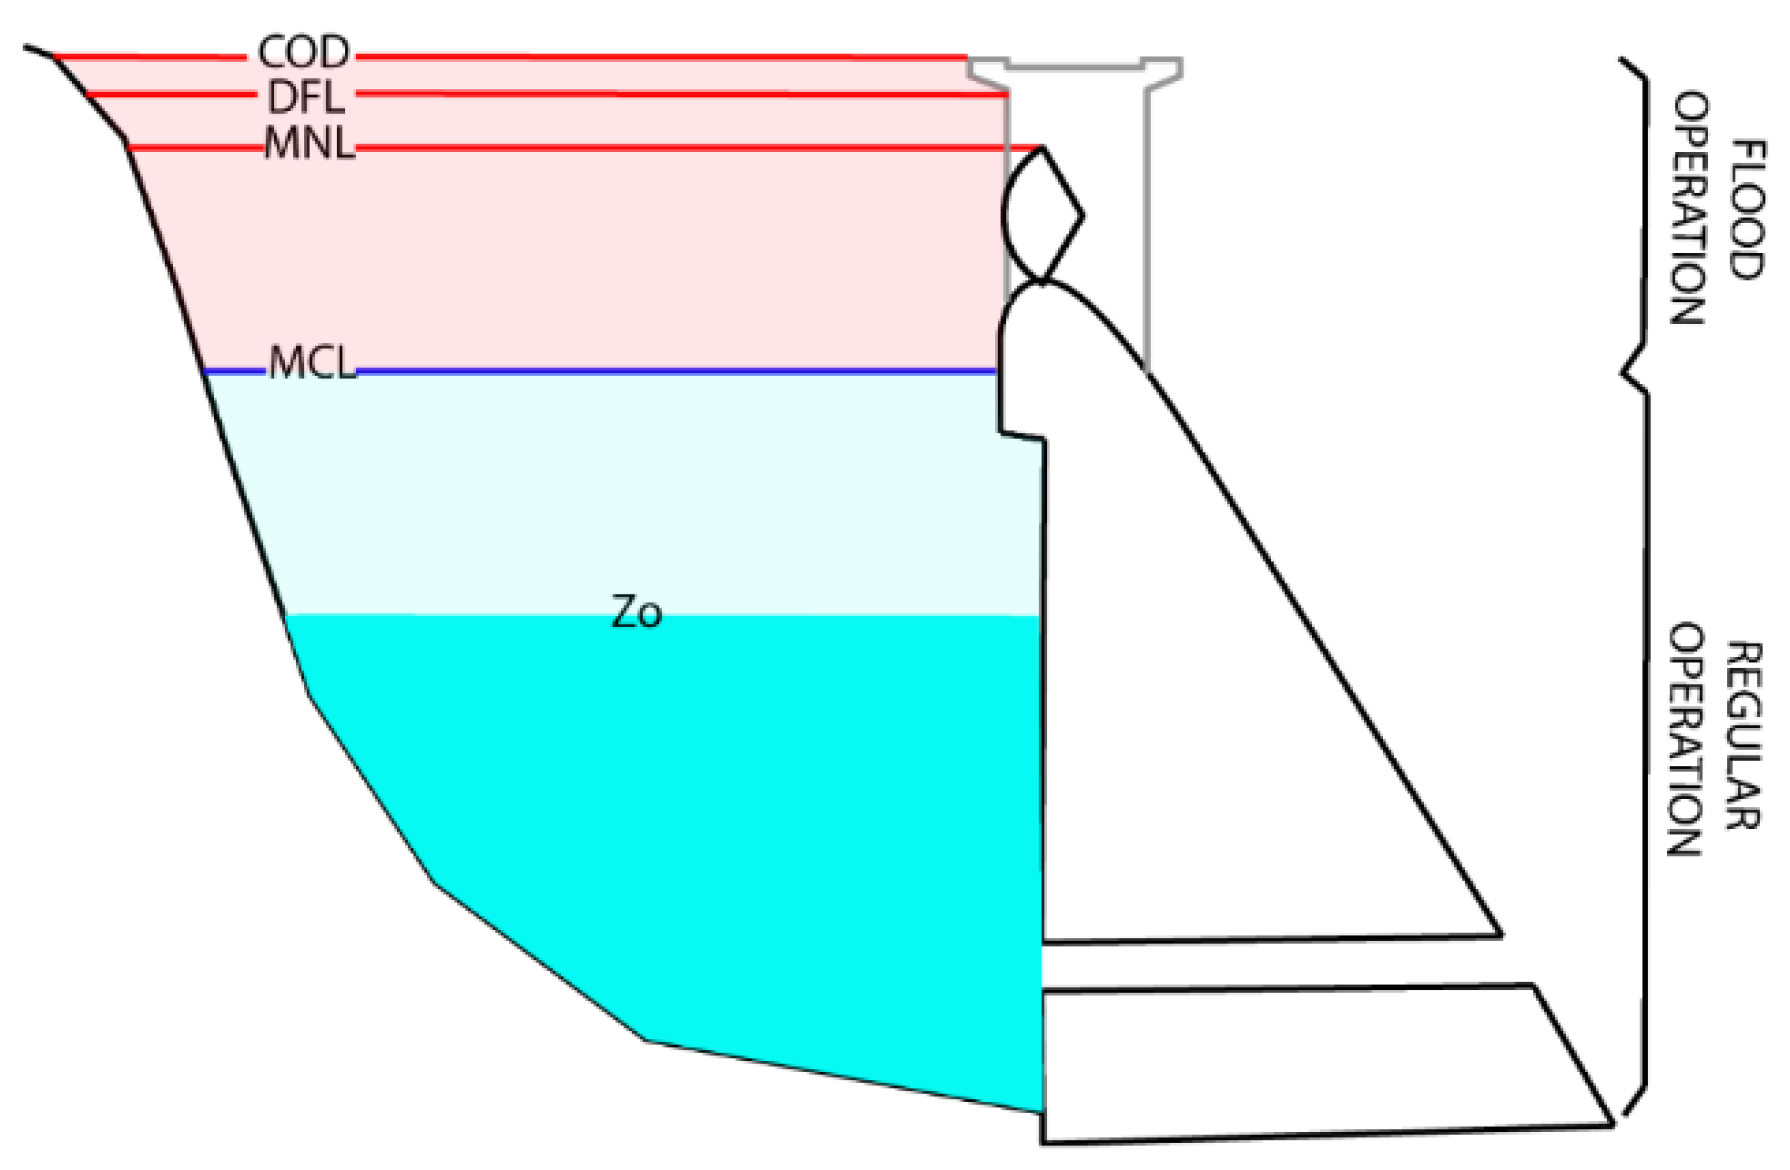
Maximum conservation levels represent the linking variable between flood control operation and water conservation operation of the reservoir (Figure 1).
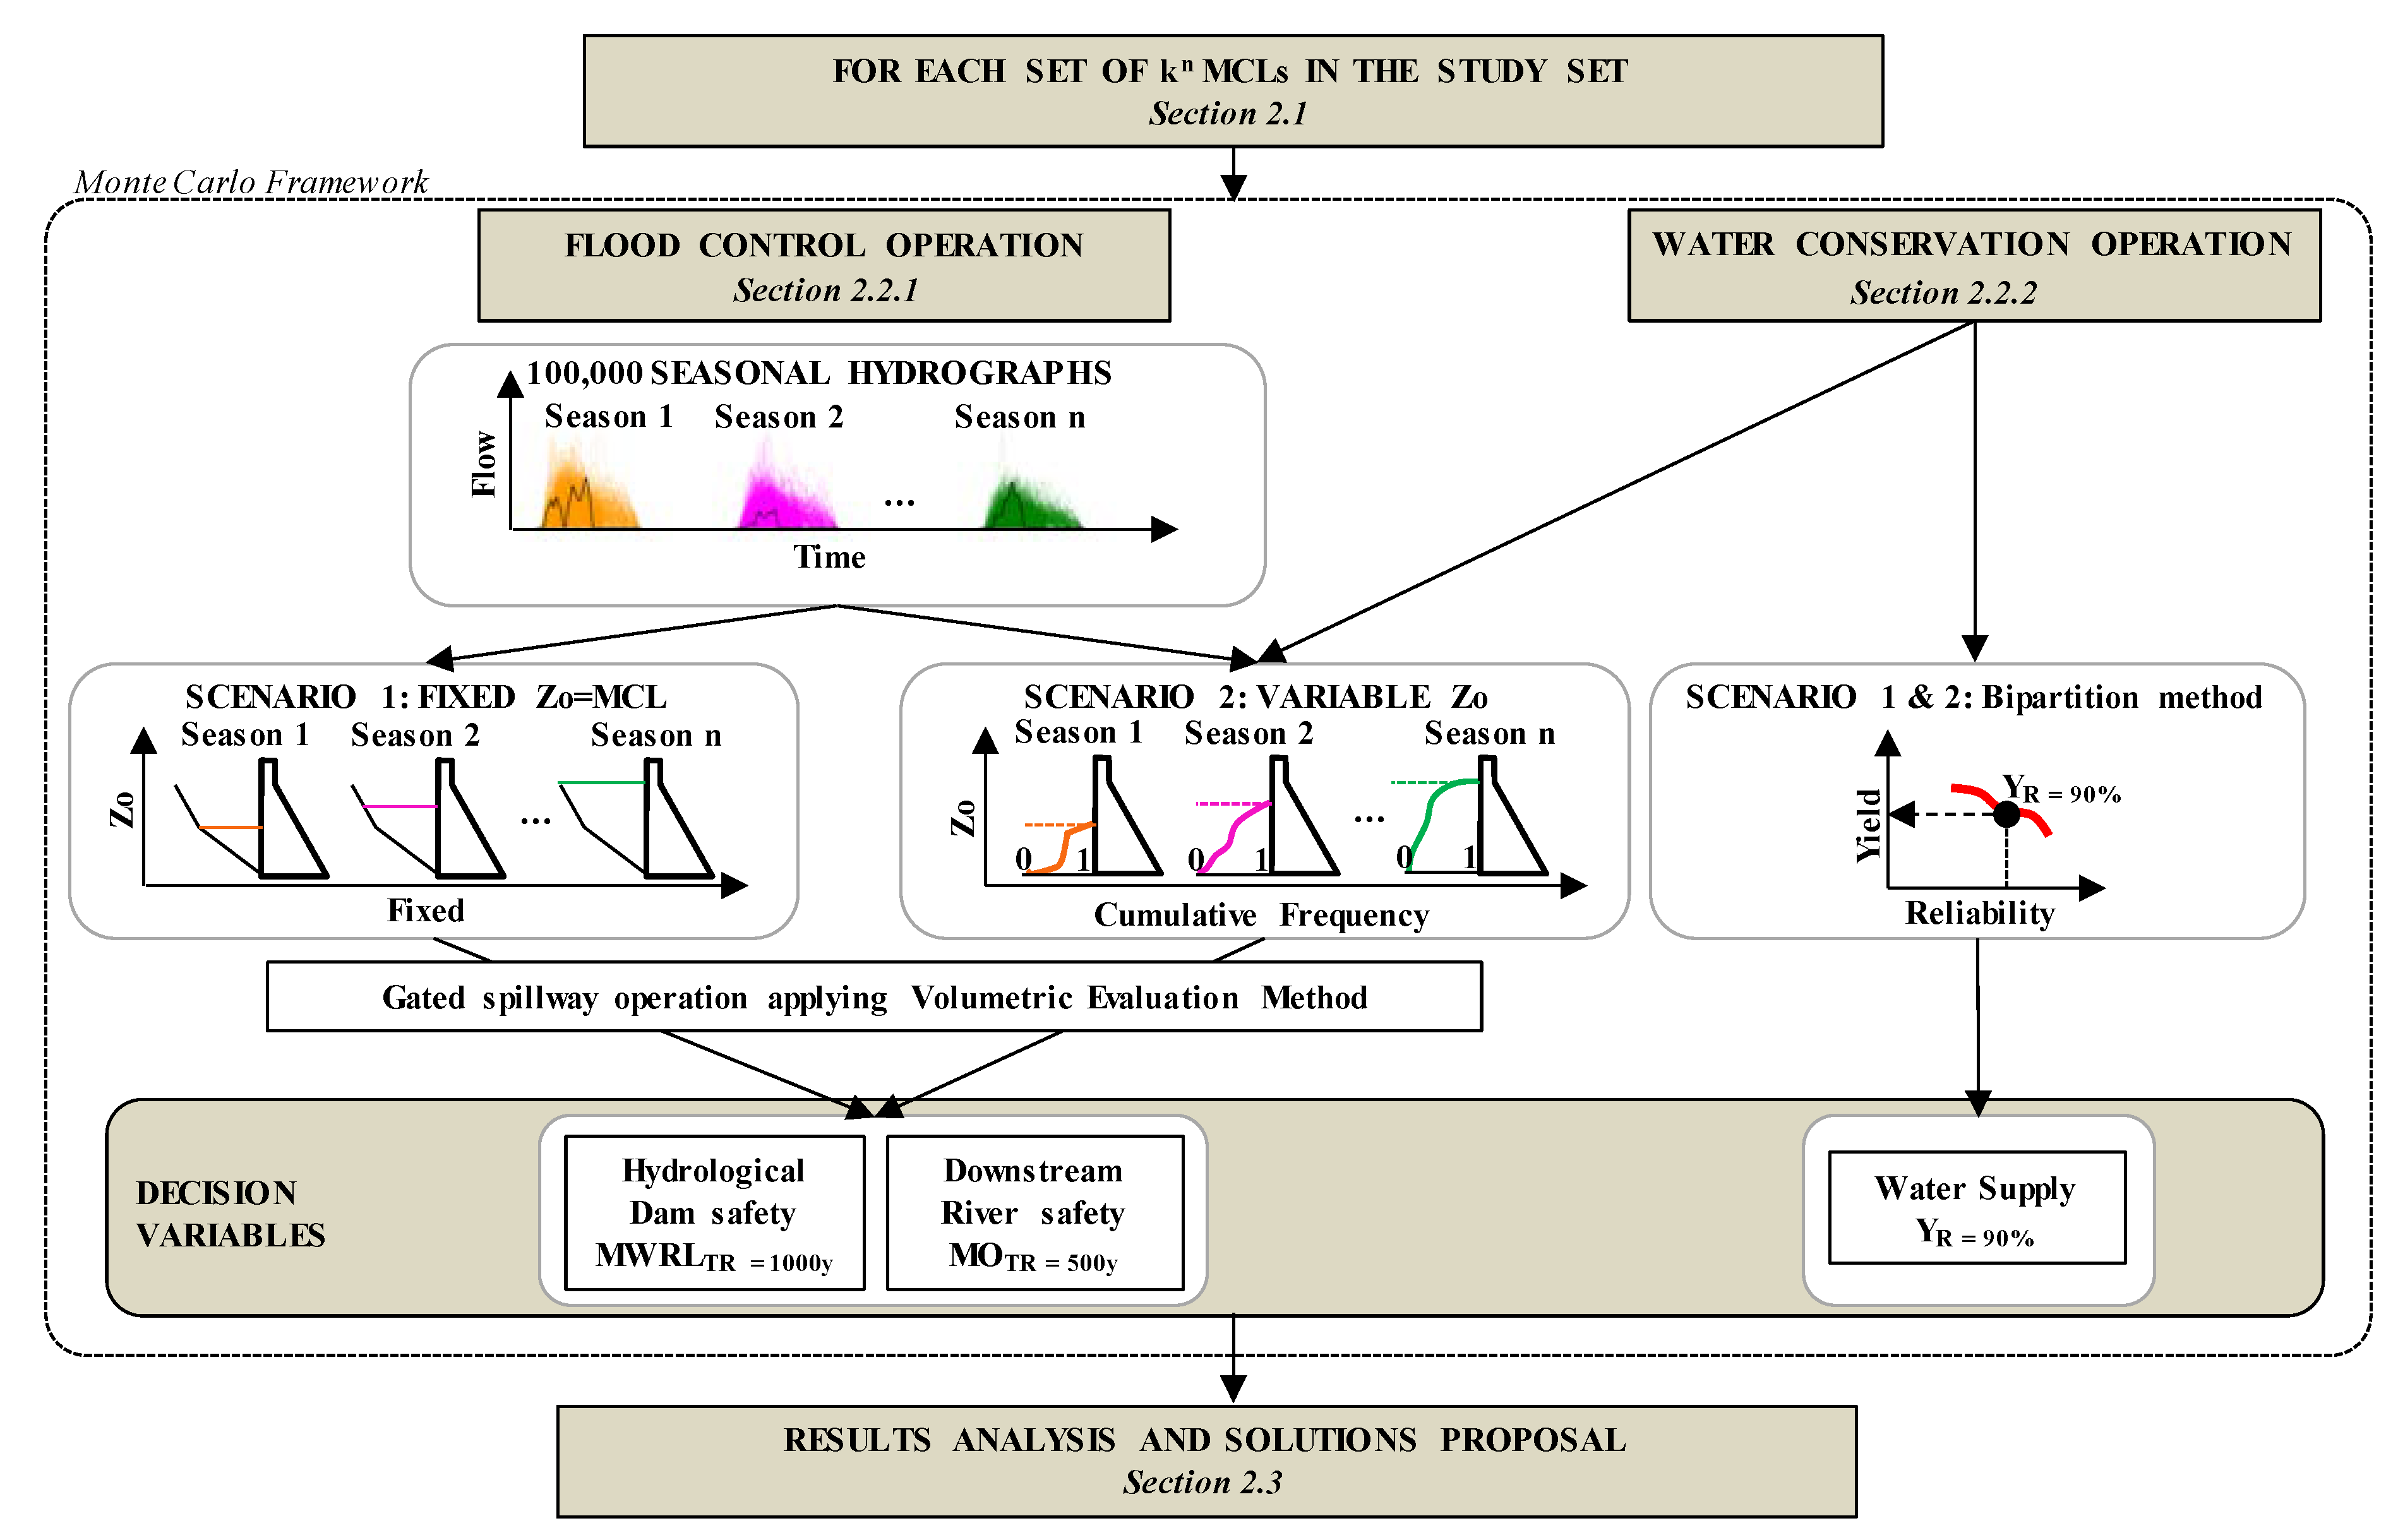
We propose a stochastic methodology to obtain the optimal set of seasonal MCLs accounting for both hydrological safety (dam and downstream) and water supply with a specific reliability. Figure 2 shows a scheme relating the main elements and procedures developed and applied in the methodology.
2.1. Study Set of Seasonal Maximum Conservation Levels
We defined a study set of seasonal MCLs representative of all possible configurations. The number of possible configurations of MCLs varies according to the number of seasons identified (n) and the number of possible maximum conservation levels selected (k) for a proper discretization. As the season of the MCLs matters (it is not the same to have the same MCL in one season or another), the number of possible configurations is kn. The number of seasons is defined as described in Section 2.2.1.
2.2. Reservoir Operation Simulations
For each configuration of seasonal MCLs of the study set, we carried out two different reservoir operation simulations: simulation of flood control operation and simulation of water conservation operation.
2.2.1. Simulation of Flood Control Operation
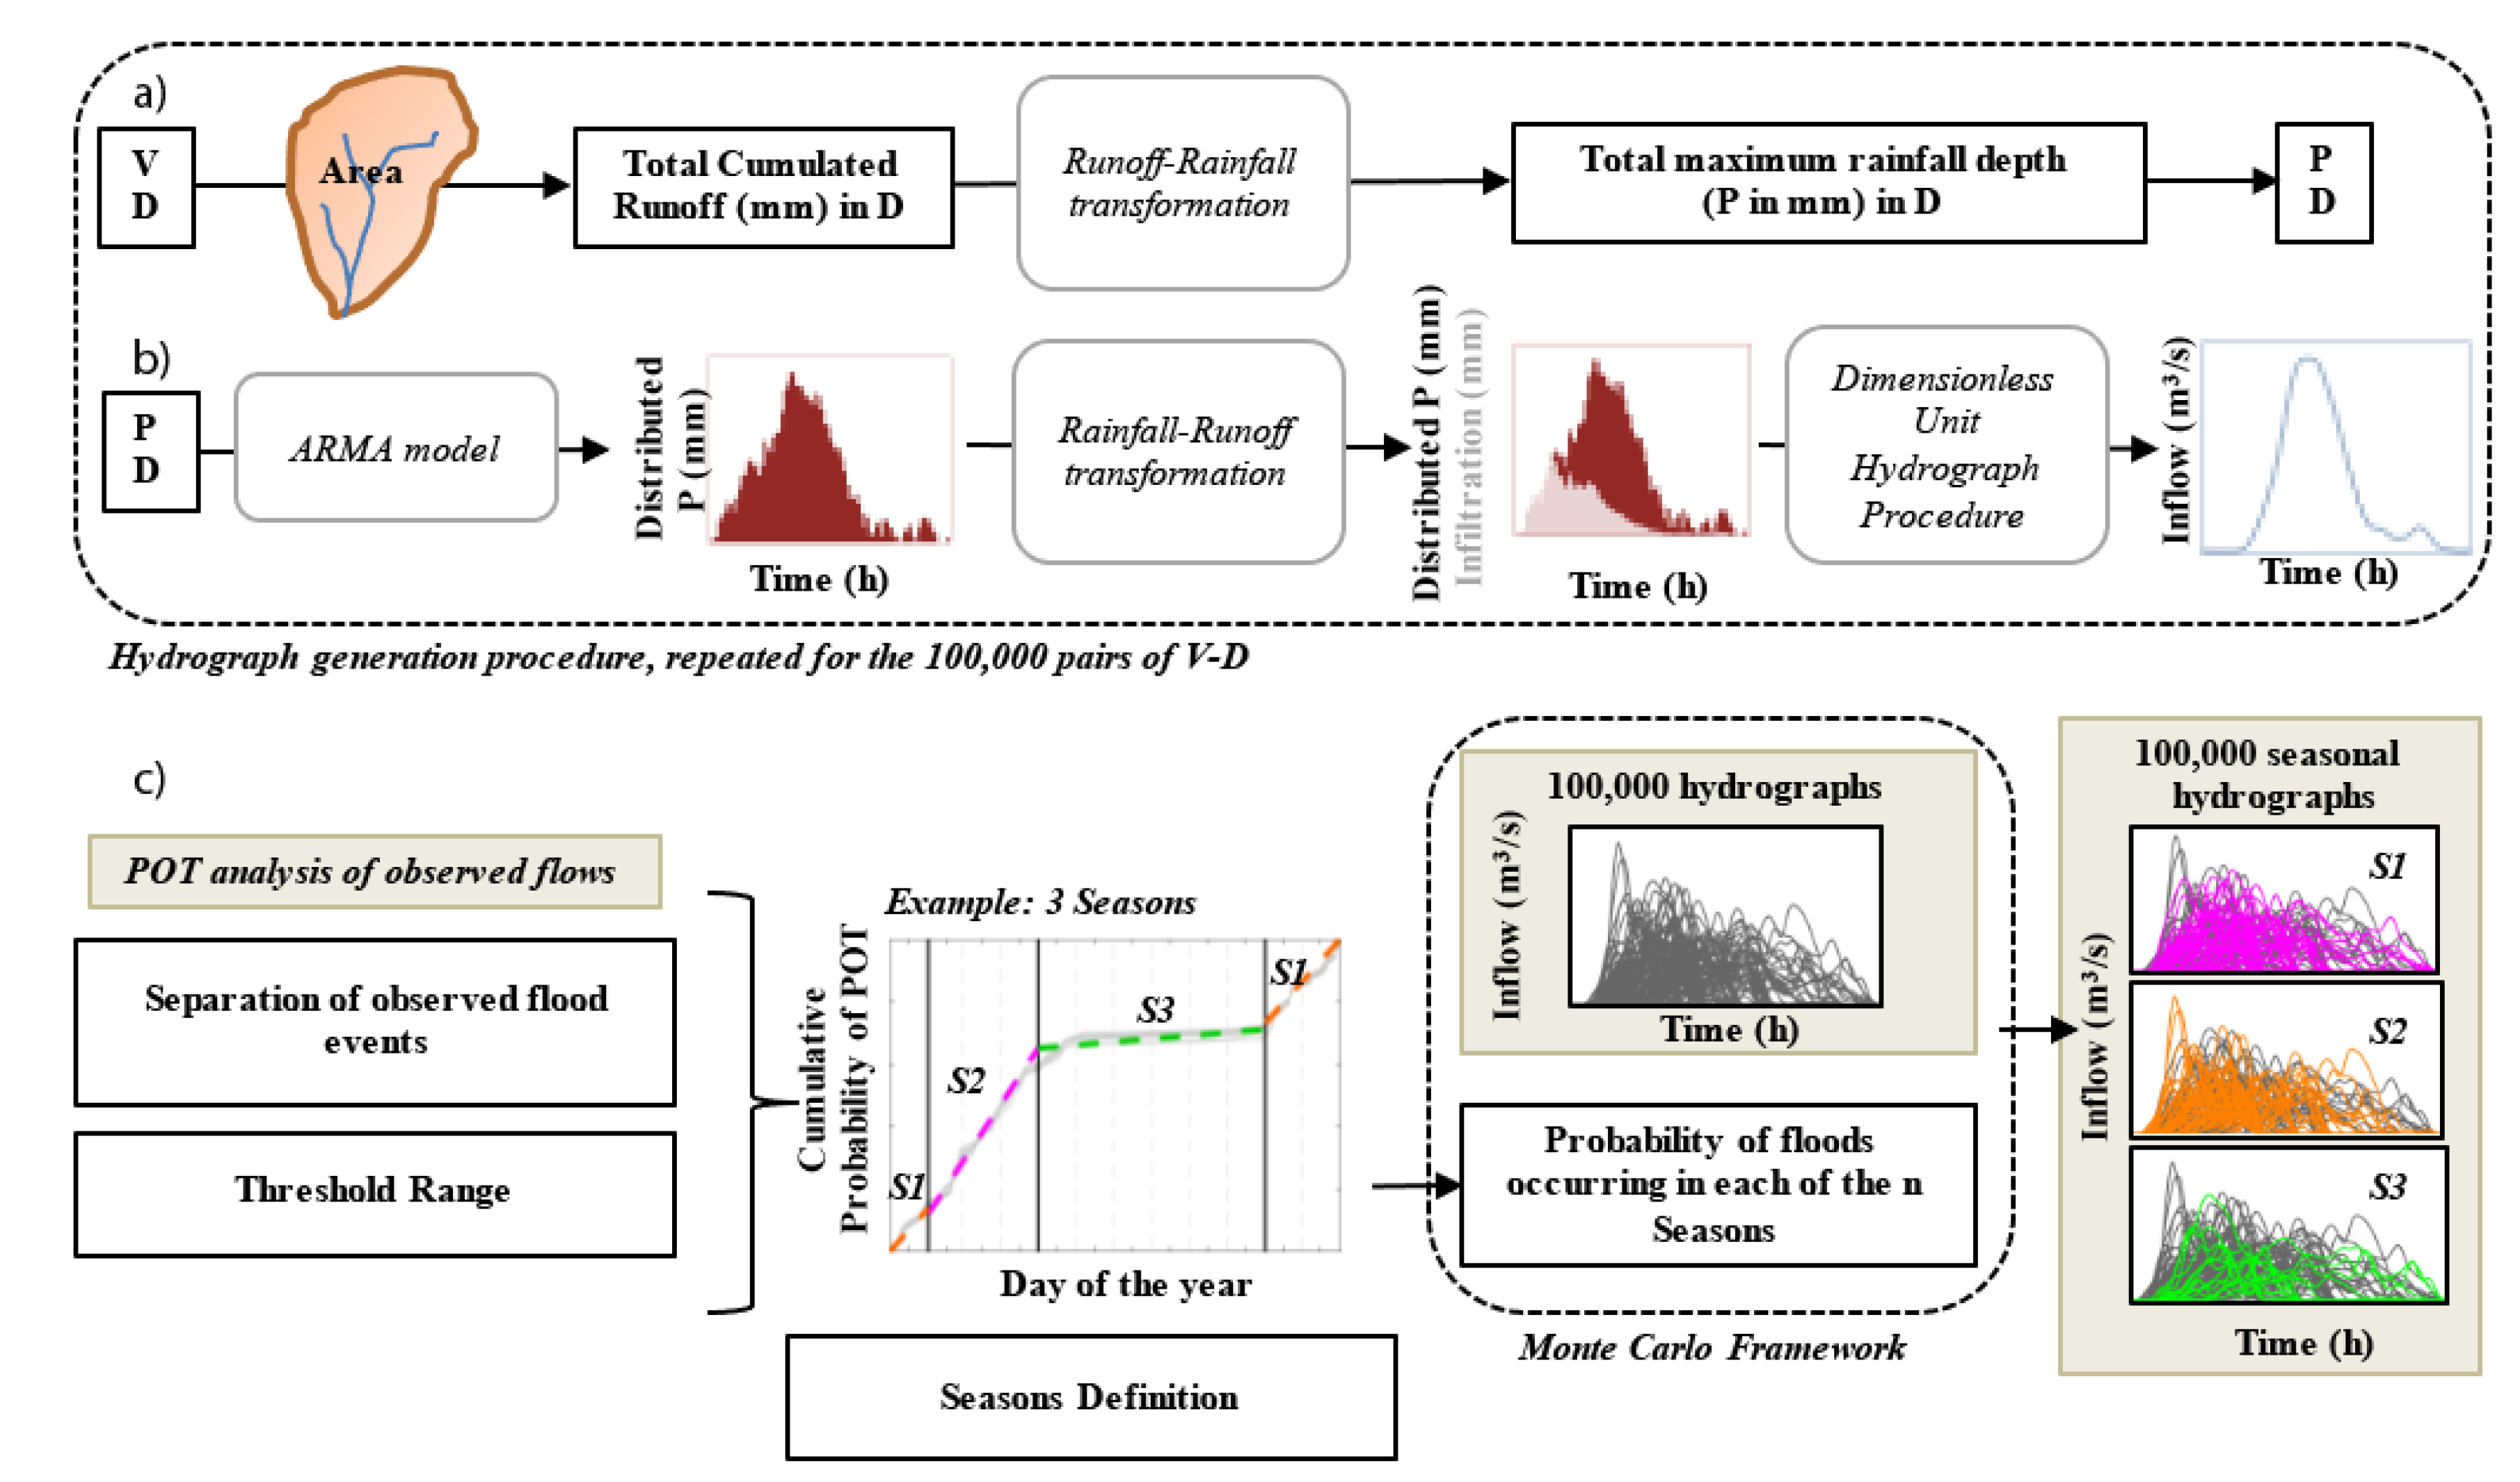
Gabriel-Martin et al. [13] presented a stochastic methodology that enabled us to obtain stochastic inflow hydrographs representative of the observed daily annual floods (Figure 3). The main steps used to generate the inflow hydrographs were as follows:
- Generation of 100,000 pairs of flood duration (D) with their associated maximum annual flood volume (V). Pairs of 100,000 flood event durations were generated following the empirical probability distribution of historical floods. For each element of the 100,000 generated durations, the corresponding hydrograph volume was obtained following the probability distribution of the associated duration within a Monte Carlo framework.
- Generation of 100,000 values of cumulated precipitation depth. The value of the cumulated net precipitation was obtained by dividing the volume of each hydrograph by the area of the study basin. By applying the curve number method inversely [15] to the cumulated net precipitation, the value of the cumulated precipitation depth was obtained (Figure 3a)
- Generation of 100,000 hourly-distributed hydrographs. By applying the curve number method [15] and the soil conservation service dimensionless unit hydrograph procedure [15], 100,000 hydrographs were generated, which followed the empirical probability distributions of volume and duration (Figure 3b).
A detailed description of the method to generate representative hydrographs can be found in Gabriel-Martin et al. [13]. Each hydrograph was associated to one of the seasons defined (Figure 3c). We identified the distinct seasons by applying a graphical test to the observed daily inflows proposed by Ouarda [16] and Ouarda et al. [17]. This test was based on a peak-over-threshold (POT) analysis. In order to identify the seasons, Ouarda et al. [17] tested different threshold values while assuring independence between the selected POT. We applied the criteria recommended by Lang et al. [18] to define the range of threshold values to be considered and the criteria proposed by the Water Resources Council [19] to assure the independence between two consecutive floods. We plotted the cumulative empirical probability of POT during the year against the time of the year for each threshold value tested. The slope changes within the plot indicated the significant seasons. A detailed description of the method to identify the seasons can be found in Gabriel-Martin et al. [20] and is summarized in Figure 3c.
For each configuration of MCLs, we obtained the maximum water level in the reservoir corresponding to a return period of 1000 years (MWRLTR=1000y) and the maximum outflow corresponding to a return period of 500 years (MOTR=500y). These values correspond to the set of 100,000 seasonal maximum annual inflow hydrographs generated by Gabriel-Martin et al. [13,20]. The analysis was carried out in two different scenarios of the initial reservoir level prior to the flood event (Zo) (Figure 2):
- Scenario 1 (Sc.1): Zo is constant and corresponds to the seasonal MCL. The reservoir is assumed to be at its maximum operating level when the maximum annual flood occurs.
- Scenario 2 (Sc.2): Zo is variable, and the reservoir can be at any level when the maximum annual flood occurs. Zo is randomly sampled from the cumulative probability distribution of Zo associated to the season of occurrence of the maximum annual flood event. This distribution is obtained from the simulation of the water conservation operation of the reservoir (Section 2.2.2).
2.2.2. Simulation of Water Conservation Operation
We considered the yield reliability (YR) as the ratio of total volume supplied and the total volume demanded [23,24,25,26] during the period analyzed. For each configuration of MCLs (k), we obtained the reservoir yield with a reliability of 90% (YR = 90%) and the cumulative probability distribution of Zo, by developing a monthly water balance model. Reservoir storage is large compared to monthly inflows, and thus the monthly time scale is appropriate. The model manages the dam as an isolated element and applies rules of operation validated in Gabriel-Martin et al. [13]. The water balance considers time series of monthly inflows, environmental flow restrictions, evaporation rates, monthly demand distribution, storage–area–height reservoir curves, and dead storage volume (data extracted from “Duero National Water Master Plan” [27]). The main purpose of the reservoir is irrigation and therefore we adopted a required yield reliability of 90% (YR = 90%,) which is adequate for irrigation demands in the region [28].
To identify the maximum amount of water that can be supplied to satisfy a regular demand with a specified reliability, a bipartition method was applied. Excessive values of demands were set (for example, similar to mean monthly runoff) and the simulation was carried out. The deficits were obtained and specified yield reliability requirements were checked. If the specified reliability requirements were not fulfilled, the demand was reduced by half and simulated again. If the specified reliability requirements were satisfied, half of the difference was added and simulated again and so on, until the deficit (or gain) was smaller than a pre-set tolerance (e.g., 0.1 hm3/year). In addition, we simulated the operation of the reservoir with the associated mean annual current demand. We repeated the procedure for both Sc.1 and Sc.2 scenarios.
2.3. Results Analysis and Solutions Proposal
In order to propose the optimal configurations of MCLs within the case study, as exposed, we selected three main decision variables: MWRLTR = 1000y, MOTR = 500y, and YR = 90%. We assumed that the MCLs configuration would not fulfil the standards if MWRLTR=1000y was above the design flood level (DFL) and/or MOTR = 500y was greater than the emergency flow (OEMER). We compared MWRLTR=1000y, MOTR = 500y, and YR = 90% for all the configurations in the study set of MCLs by identifying configurations that are non-inferior solutions (Pareto framework) in terms of maximum volume of water supplied (with a specific yield reliability of 90%) and hydrological safety.
Determination of Possible MCLs by Applying a Pareto Analysis
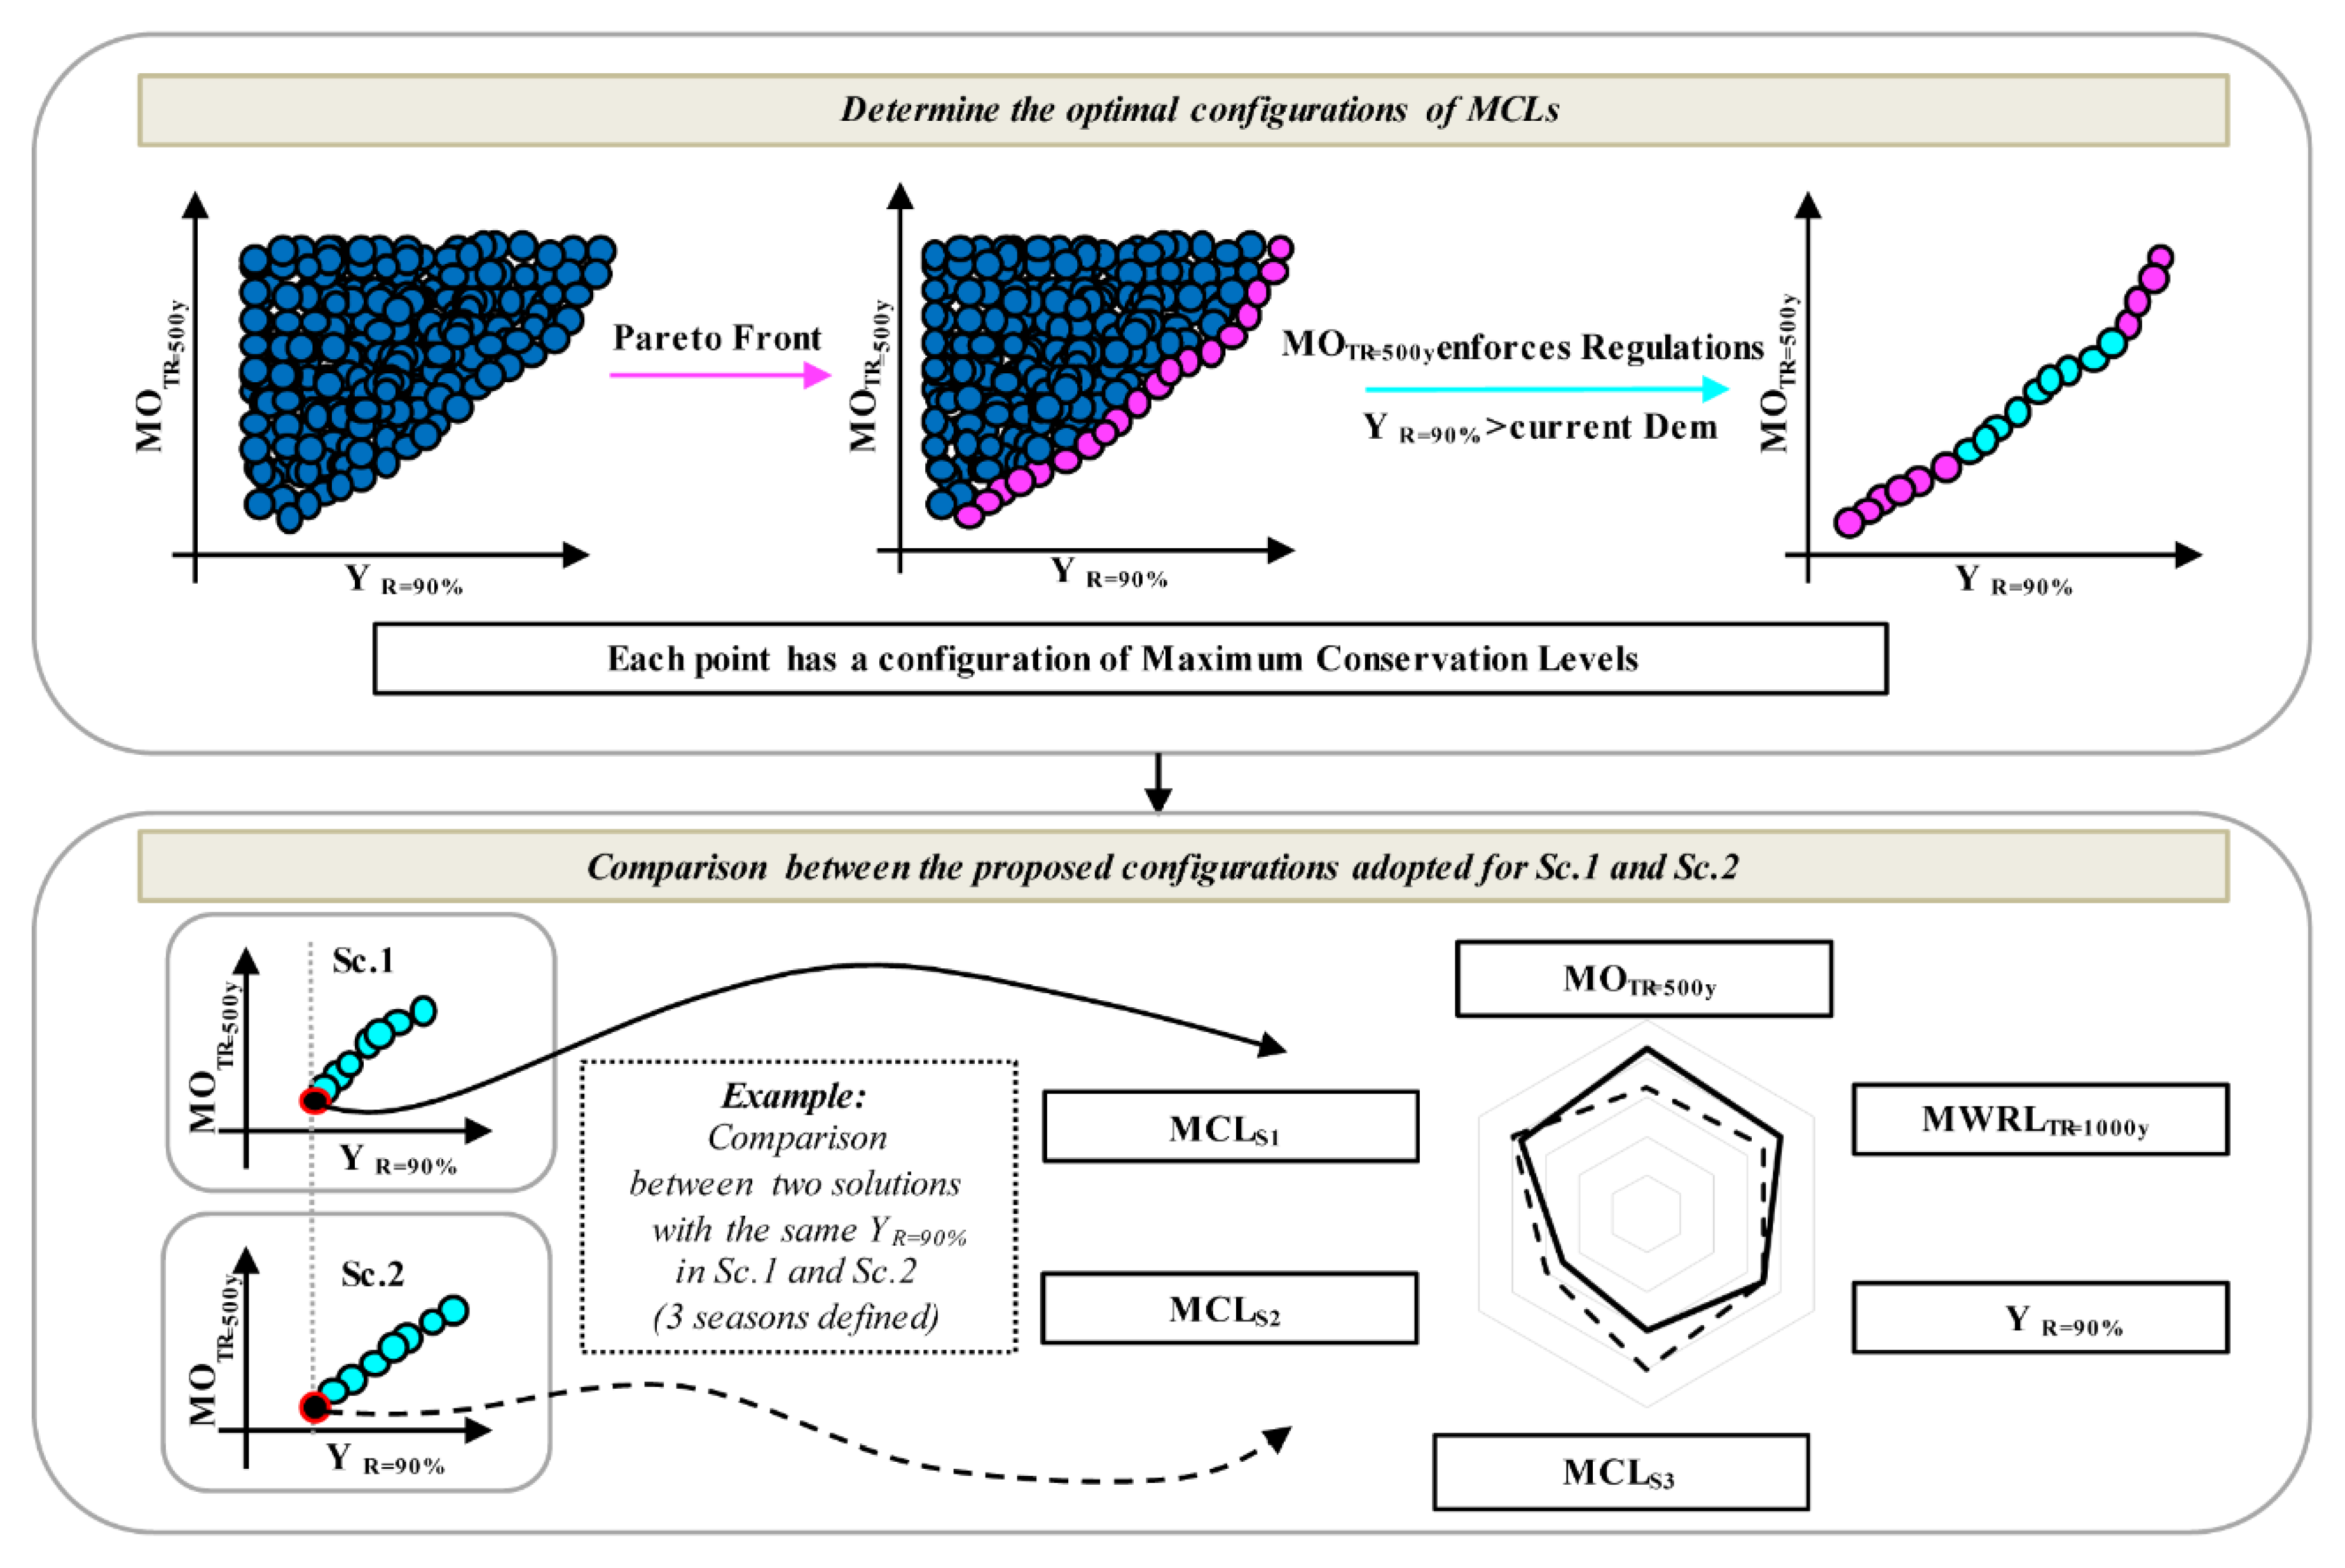
The selected variables for conducting the Pareto analysis were MOTR = 500y and YR = 90% (Figure 4). In this study, we assumed that higher levels in the reservoir (and above MNL) imply greater outflows. This assumption is always fulfilled either for dams with fixed crest spillways or if the VEM is applied in gated spillways (as in this study). It should be noted that this assumption may not hold for all possible specific characteristics of dams, all rules of operation adopted, or all specific values adopted for the hydrological dam and downstream safety. Moreover, in this study, the outflow corresponding to the DFL condition is higher than that corresponding to OEMER, that is, the MOTR = 500y is the most restrictive variable. Therefore, for each scenario (Sc.1 or Sc.2), we had a set of kn MCLs configurations with kn pairs of values MOTR = 500y and YR = 90%. The purpose was to obtain the configurations of MCLs that minimize the value of MOTR = 500y while maximizing YR = 90%, which implies a two-objective minimization problem (Equation (1)):
in which xi = [MCLS1, MCLS2, …, MCLSn], f1(xi) = [MOTR=500yi] and f2(xi) = [–YR=90%i]; being i = 1,2…, kn. The solution of Equation (1) consisted of a set of non-dominated solutions. Therefore, following the procedure proposed in Chong and Zak [29] we conducted the mentioned analysis. Once the non-dominated solutions were identified for Sc.1 and Sc.2, we eliminated from both scenarios those that did not fulfil the hydrological safety regulation standards (both for MWRLTR = 1000y and/or MOTR = 500y) and those providing a YR = 90% lower than the annual demand that is currently satisfied. Afterwards, we compared the proposed solutions, providing dam stakeholders with a set of possible configurations depending on whether their main objective was to increase hydrological dam and downstream river safety or increase the water supply with a specific reliability within the system.
Min{f1(xi), f2(xi)},
2.4. Case Study
We applied the methodology to Riaño Dam (Table 1). It belongs to the Esla basin water resources system, which is managed by the Duero River Basin Authority (west region of mainland Spain). The main purpose of the reservoir is irrigation. The mean monthly water demands for irrigation/urban water supply are as follows (in hm3): April 10.9/0.08, May 54.5/0.08, June 81.7/0.08, July 158/0.16, August 147.1/0.16, and September 92.6/0.16. From October to March, the demands were 0/0.08 hm3. The capacity of the reservoir is 651 hm3 at MNL (the maximum reservoir level that water might reach under normal operating conditions) [30], with a bottom dead storage of 78 hm3. The main characteristics of the Riaño Reservoir and its basin are summarized in Table 1.
Riaño Dam has two spillways. The main spillway is controlled by two tainter gates, each eight meters wide and seven meters high. There is a second spillway for emergency purposes. It is a fixed-crest spillway with the crest located at the MNL. Riaño Dam also has two bottom and two intermediate outlets, which we assumed were closed during the floods. Flood damage analyses summarized in the Dam Master Plan concluded that discharges above 700 m3/s (OEMER) could produce damage over urban settlements with more than five inhabitants and infrastructures in the downstream reach. The following data were used to perform the study:
- Simulation of flood control operation. Besides the flood control structures and dam configuration shown, we used 30 years of unaltered daily flow series data from a gauge located right downstream the Riaño reservoir (from the years 1954 to 1984 and prior to the existence of the dam). With this time series, the 100,000 seasonal synthetic flood hydrographs were generated.
- Simulation of water conservation operation. We used a monthly time series of naturalized inflows from 1940 to 2013, environmental flow restrictions, evaporation rates, monthly demand distribution, storage–area–height reservoir curves and dead storage volume (all data obtained from the Duero River Basin Management Plan [27]) and the reservoir characteristics previously stated.
2.5. Limitations of the Methodology
We applied this methodology to one basin and dam configuration. This might limit the generalization of the results obtained. Furthermore, the water resources management model focused on the regular operation of the dam as an isolated element. This methodology could be extended to take into consideration the interaction with other infrastructures within the system, using suitable water resources management models (e.g., AQUATOOL [31] and WEAP [32]).
3. Results and Discussion
3.1. Determination of the Study Set of MCLs to be Analyzed
We studied a set of MCLs that ranged from 651 hm3 (volume at MNL) to 400 hm3. For the sake of simplicity, we estimated the flood hydrograph volume of Tr = 5000 years (247 hm3) and defined a maximum flood control volume of 251 hm3. We discretized the ranges of reservoir volumes in intervals of 5 hm3. Thus, we defined a set of k = 51 possible MCLs per season (associated to a volume in the reservoir of 400, 405, …, 645, 651 hm3).
According to Gabriel-Martin et al. [20], three characteristic seasons (regarding maximum annual floods) were identified for the location of Riaño: season 1 (S1) from the beginning of November to the end of January; season 2 (S2) from the beginning February to the end of April; and season 3 (S3) from the beginning of May to the end of October. Therefore, as n = 3 seasons, we had a set of 513 = 132,651 configurations of MCLs per scenario analyzed (Sc.1 and Sc.2.)
3.2. Simulation of the Water Conservation and Flood Operation of the Dam
Once the configurations of MCLs were defined, for each configuration we obtained the values of MWRLTR = 1000y and MOTR = 500y by simulating the flood operation of the reservoir for Sc.1 and Sc.2. By simulating the water conservation operation of the reservoir, we obtained YR = 90%. Figure 5 shows the values of MWRLTR = 1000y, MOTR = 500y, and YR = 90% with respect to the MCLs of each season.
Figure 5a shows that variation of MCLs in S1 did not affect YR=90%. This is because the water demands associated with the reservoir in S1 were less than 1% of the annual demand (Da), and, as the irrigation season in the Riaño system extends from May to September (98% of Da), the reservoir was able to recover the reduced volume in S1 within the months previous to irrigation (February, March, and April). Figure 5b,d shows that, for the case of Sc.1, the effects of MCLs were similar in the three seasons in terms of hydrological dam safety (Figure 5b) and downstream river safety (Figure 5d). However, in Sc.2 (Figure 5c,e), as regular operation was linked to the flood control operation by the initial reservoir level, MCLs in S1 and S3 did not affect either the hydrological dam safety or downstream river safety. Variations of MCLS2 are the main affection to values MWRLTR = 1000y and MOTR = 500y in Figure 5c,e, respectively.
3.3. Solutions Proposal
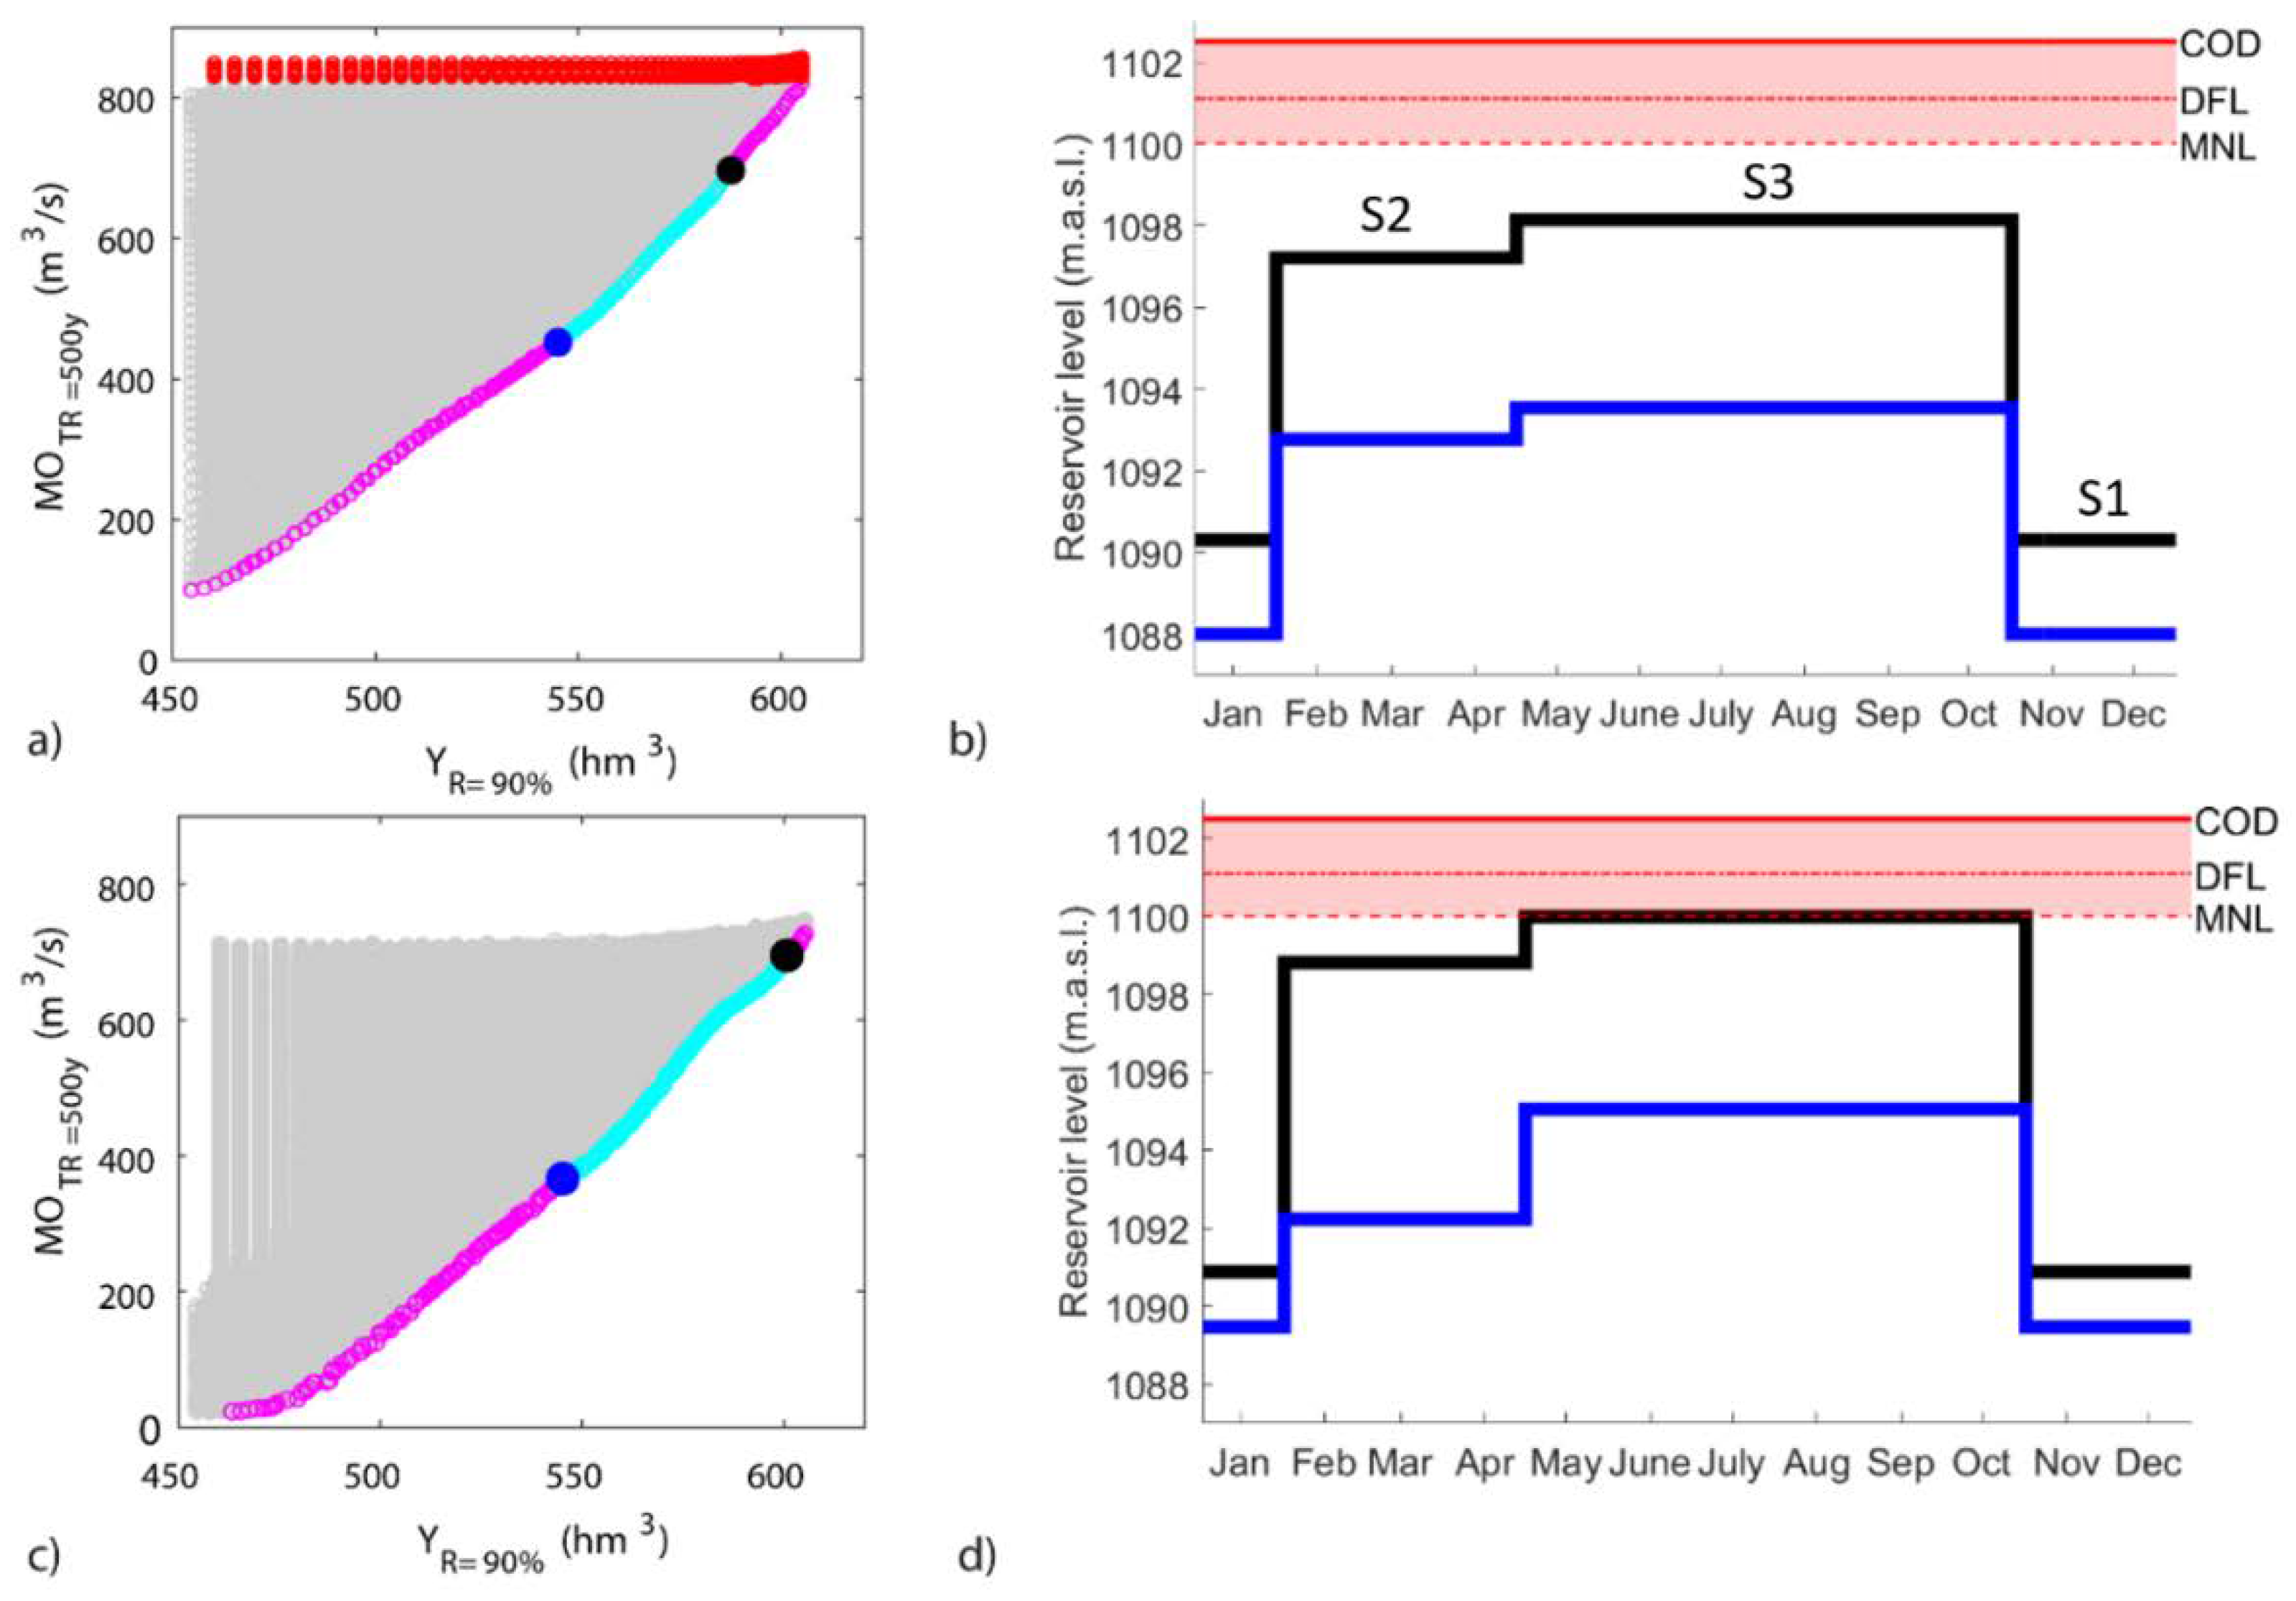
First, we identified the configurations which did not fulfil hydrological dam safety (MWRLTR = 1000y > DFL) and/or downstream safety (MOTR = 500y > OEMER.) in both scenarios. A total of 826 configurations (0.6% of 132,651 configurations) had a value of MWRLTR = 1000y higher than DFL in Sc.1 (red dots in Figure 6a), while none of the configurations had MWRLTR = 1000y values higher than the DFL in Sc.2 (Figure 6c). It should be noted that the 826 configurations that did not fulfil hydrological dam safety in Sc.1 also did not fulfil the downstream safety condition. On the other hand, 59,013 configurations (44.5% of the total number of configurations) had a value of MOTR = 500y higher than OEMER. in Sc.1, whereas 4944 (3.7%) in Sc.2 (Figure 6a,c) shows the pair of values YR = 90% and MOTR = 500y (grey points) for each analyzed configuration in Sc.1 and Sc.2, respectively.
In Sc.1, the Pareto-solutions consisted of 277 configurations (Figure 6a, magenta points). One those, 98 configurations satisfied the following: YR = 90% ≥ Da, MOTR = 500y ≤ OEMER, and MWRLTR = 1000y ≤ DFL (proposed solutions, cyan in Figure 6a). For the same analysis in Sc.2, we identified 247 configurations (magenta points in Figure 6c) and 135 (cyan points in Figure 6c), respectively. For both scenarios, the extreme proposed solutions were identified. On one hand, in the case of MOTR = 500y = OEMER = 700 m3/s (Figure 6a,c, black point), YR = 90% = 587 hm3 (for Sc.1) and 600 hm3 (for Sc.2) representing an improvement (compared to Da) of 7.7% and 10.1%, respectively. On the other hand, in the case of YR = 90% = Da = 545 hm3 (Figure 6a,c, dark blue point), MOTR = 500y = 452 m3/s (for Sc.1) and 366 m3/s (for Sc.2) representing a 64.2% and 52.3% of OEMER, respectively. It is important to point out that, in the case of using a deterministic procedure focused on hydrological dam and downstream safety (conventional procedure), any studied configuration of MCLs could be a potential solution (grey dots within Figure 6a,c). Thus, if MOTR = 500y = OEMER, the proposed stochastic procedure presented improvements of up to 146 hm3 (26.8% of Da) compared to the worst regular operation configuration (YR = 90% = 454 hm3 in Sc.1, Figure 6a). The corresponding configurations of MCLs for the extreme proposed solutions are represented in Figure 6b (Sc.1) and Figure 6d (Sc.2) with the same color scheme as in Figure 6a,c, respectively. In both scenarios, the highest MCLs were associated with S3, while the lowest was associated with S1.
3.4. Comparison between the Proposed Configurations in the Two Scenarios
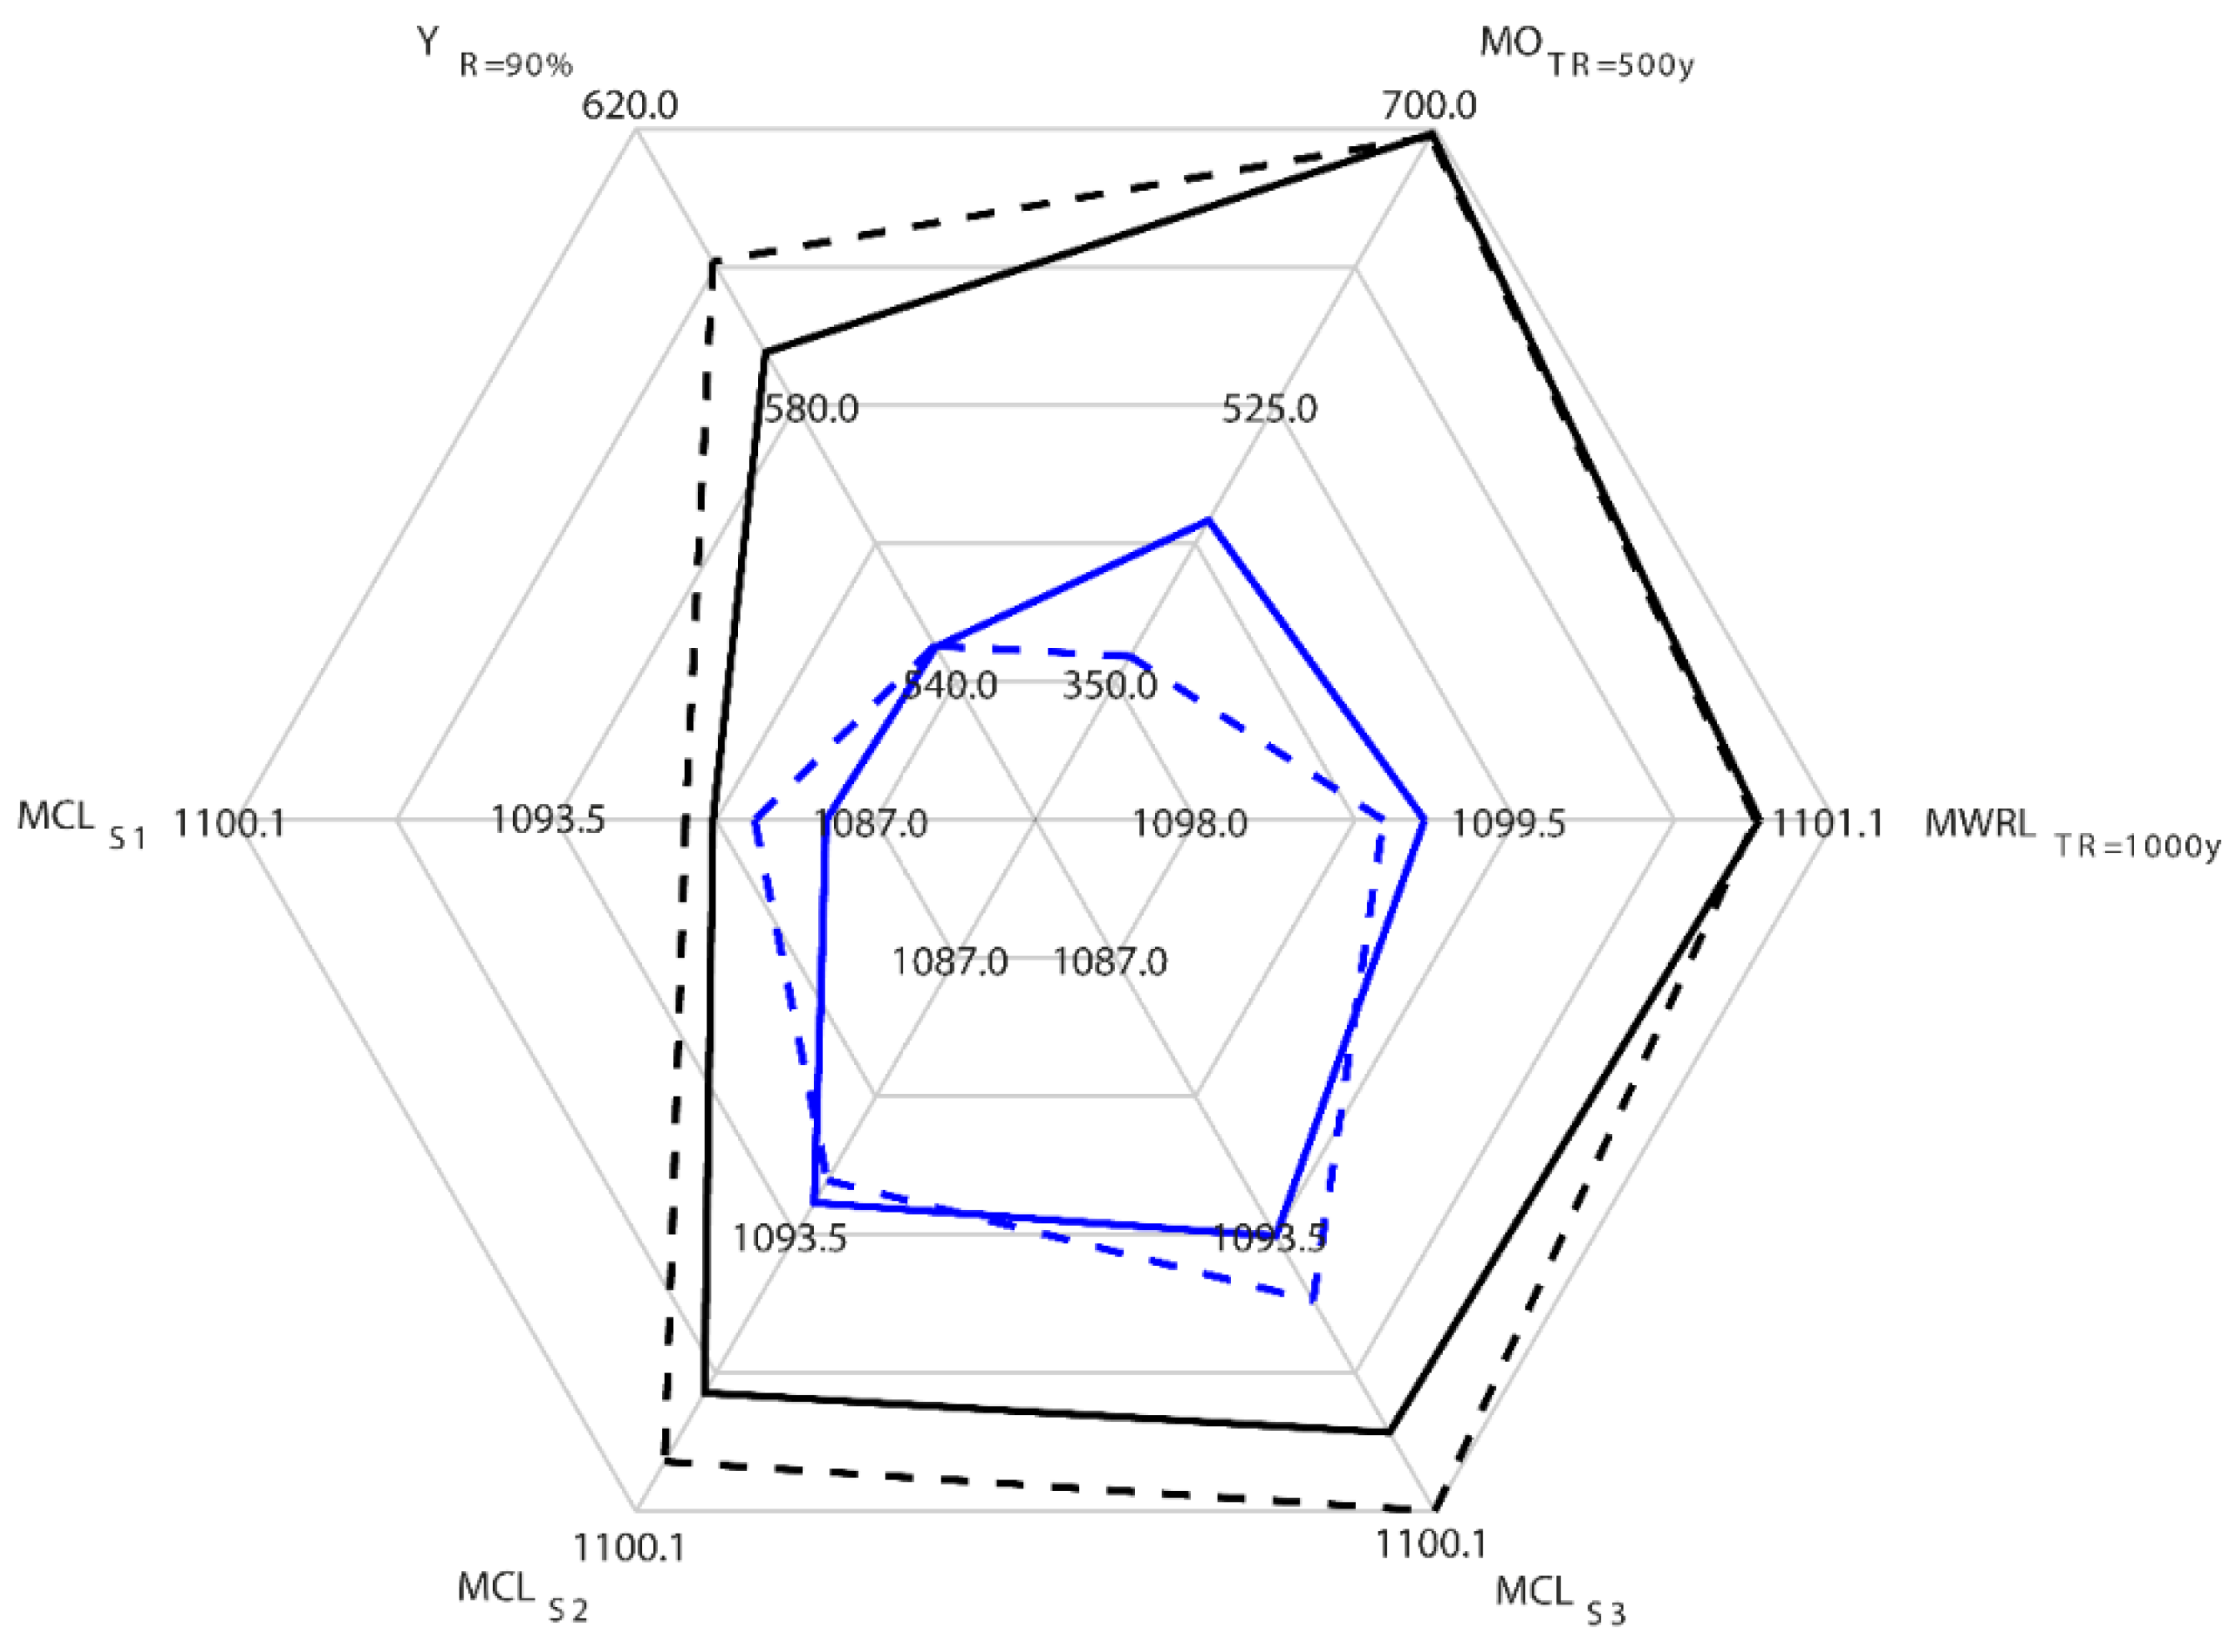
We compared the limit proposed solutions in both scenarios (Sc.1 and Sc.2; Figure 7). In the case of MOTR = 500y = OEMER = 700 m3/s, MWRLTR = 1000y was 1100.6 m.a.s.l. The hydrological dam and downstream river safety were invariant for Sc.1 and Sc.2. However, higher MCLs were obtained for Sc.2, which increased the YR = 90% of the system. In the case of YR = 90% = Da = 545 hm3, the differences between Sc.2 and Sc.1 for MWRLTR = 1000y and MOTR = 500y were 0.2 m.a.s.l and 86 m3/s, respectively. Moreover, the MCL of season two were lower when the variable initial reservoir level was considered. This is because of the increase of MCLs in the other seasons. Despite this, the demand supplied with a reliability of 90% was the same, accounting for lower values of MWRLTR=1000y and MOTR = 500y if variable initial level was considered.
Within the framework of the present study, accounting for the variability of initial reservoir level implied a reduction of flood control volumes (increase of MCLs) maintaining the risk of overtopping and downstream river safety. Consequently, the volume for satisfying the demands increased, providing a more reliable system in terms of regular operation.
4. Conclusions
The main conclusions extracted from this study are as follow:
- The use of a stochastic methodology allowed us to assess hydrological dam safety and downstream safety by obtaining the frequency curves of outflow and maximum reservoir water levels, while accounting for the variability in hydrological loads with respect to deterministic procedures. As a drawback, it implied a more complex procedure and computational effort.
- We proposed a set of 98 non-inferior solutions while considering the initial reservoir level equal to the MCL for each season and 135 possible configurations while considering variable initial reservoir level. From the proposed configurations, dam stakeholders are able to decide which configuration to use depending on whether their preference is to increase dam and downstream hydrological safety or to increase water supply (with a specific reliability) in the water resources system. In the Riaño case study, the presented procedure showed improvements in the regular operation that satisfied an increase of up to 10.1% of the current annual demand of 545 hm3 (with a reliability of 90%) while maintaining the same level of hydrological dam safety.
- Accounting for initial reservoir variability resulted in the possibility of supplying an extra demand of 13 hm3 (2.4% of the current annual demand) compared to the optimal solution without accounting for initial reservoir level variability.
- The proposed stochastic procedure can improve the results obtained by deterministic procedures, increasing supply up to 26.8% of the current annual demand, from the worst regular operation configuration (not accounting for initial reservoir level variability) to the optimal configuration (accounting for initial reservoir level variability) of MCLs.
Author Contributions
Conceptualization, I.G.-M., A.S.-W., D.S. and L.G.; Data curation, I.G.-M. and A.S.-W.; Formal analysis, I.G.-M., A.S.-W., D.S. and L.G.; Funding acquisition, A.S.-W.; Investigation, I.G.-M., A.S.-W., D.S. and L.G.; Methodology, I.G.-M., A.S.-W., D.S. and L.G.; Resources, A.S.-W.; Software, I.G.-M.; Visualization, I.G.-M.; Writing – original draft, I.G.-M.; Writing – review & editing, A.S.-W., D.S. and L.G. All authors have read and agreed to the published version of the manuscript.
Funding
Universidad Politécnica de Madrid: VJIDOCUPM19AFSW.
Acknowledgments
The authors acknowledge the computer resources and technical assistance provided by the Centro de Supercomputación y Visualización de Madrid (CeSViMa) and the funds from Universidad Politécnica de Madrid in the framework of their Program “Ayudas para contratos predoctorales para la realización del doctorado en sus escuelas, facultad, centro e institutos de I+D+i” and “ayudas a proyectos de I+D de investigadores posdoctorales”.
Conflicts of Interest
The authors declare no conflict of interest.
References
- Bocchiola, D.; Rosso, R. Safety of Italian dams in the face of flood hazard. Adv. Water Resour. 2014, 71, 23–31. [Google Scholar] [CrossRef]
- Li, X.; Guo, S.L.; Liu, P.; Chen, G.Y. Dynamic control of flood limited water level for reservoir operation by considering inflow uncertainty. J. Hydrol. 2010, 391, 124–132. [Google Scholar] [CrossRef]
- Xie, A.; Liu, P.; Guo, S.; Zhang, X.; Jiang, H.; Yang, G. Optimal Design of Seasonal Flood Limited Water Levels by Jointing Operation of the Reservoir and Floodplains. Water Resour. Manag. 2018, 32, 179–193. [Google Scholar] [CrossRef]
- Solera-Solera, A.; Morales-Torres, A.; Serrano-Lombillo, A. Cost estimation of freeboard requirements in water resources management. In Risk Analysis, Dam Safety, Dam Security and Critical Infrastructure Management; CRC Press: Boca Raton, FL, USA, 2012; pp. 9–14. [Google Scholar]
- Ouyang, S.; Zhou, J.; Li, C.; Liao, X.; Wang, H. Optimal design for flood limit water level of cascade reservoirs. Water Resour. Manag. 2015, 29, 445–457. [Google Scholar] [CrossRef]
- Moridi, A.; Yazdi, J. Optimal Allocation of Flood Control Capacity for Multi-Reservoir Systems Using Multi-Objective Optimization Approach. Water Resour. Manag. 2017, 31, 4521–4538. [Google Scholar] [CrossRef]
- Michailidi, E.M.; Bacchi, B. Dealing with uncertainty in the probability of overtopping of a flood mitigation dam. Hydrol. Earth System Sci. 2017, 21, 2497. [Google Scholar] [CrossRef] [Green Version]
- Micovic, Z.; Hartford, D.N.D.; Schaefer, M.G.; Barker, B.L. A non-traditional approach to the analysis of flood hazard for dams. Stoch. Environ. Res. Risk Assess. 2016, 30, 559–581. [Google Scholar] [CrossRef]
- USACE. Flood Control by Reservoirs. International Hydrological Decade; USACE: Washington, DC, USA, 1976; Volume 7. [Google Scholar]
- Sordo-Ward, A.; Garrote, L.; Martín-Carrasco, F.; Bejarano, M.D. Extreme flood abatement in large dams with fixed-crest spillways. J. Hydrol. 2012, 466-467, 60–72. [Google Scholar] [CrossRef] [Green Version]
- Sordo-Ward, A.; Garrote, L.; Bejarano, M.D.; Castillo, L.G. Extreme flood abatement in large dams with gate-controlled spillways. J. Hydrol. 2013, 498, 113–123. [Google Scholar] [CrossRef]
- Carvajal, C.; Peyras, L.; Arnaud, P.; Boissier, D.; Royet, P. Probabilistic Modeling of Floodwater Level for Dam Reservoirs. J. Hydrol. Eng. 2009, 14, 223–232. [Google Scholar] [CrossRef]
- Gabriel-Martin, I.; Sordo-Ward, A.; Garrote, L.; Castillo, L.G. Influence of initial reservoir level and gate failure in dam safety analysis. Stochastic approach. J. Hydrol. 2017, 550, 669–684. [Google Scholar] [CrossRef]
- Gabriel-Martin, I.; Sordo-Ward, A.; Garrote, L.; Granados, I. Hydrological Risk Analysis of Dams: The Influence of Initial Reservoir Level Conditions. Water 2019, 11, 461. [Google Scholar] [CrossRef] [Green Version]
- USDA Soil Conservation Service. National Engineering Handbook; Section 4; Hydrology. U.S. Department of Agriculture: Washington, DC, USA, 1972. [Google Scholar]
- Ouarda, T.B.M.J.; Ashkar, F.; Ejabi, N. Peaks over threshold model for seasonal flood variations. In Engineering hydrology (Proc. of the Symposium of San Francisco, California, 25–30 July); Kuo, C.Y., Ed.; ASCE Publication: San Francisco, CA, USA, 1993; pp. 341–346. [Google Scholar]
- Ouarda, T.B.M.J.; Cunderlik, J.M.; St-Hilaire, A.; Barbet, M.; Brunear, P.; Bobée, B. Data-based comparison of seasonality-based regional flood frequency methods. J. Hydrol. 2006, 330, 329–339. [Google Scholar] [CrossRef]
- Lang, M.; Ouarda, T.B.M.J.; Bobee, B. Towards operational guidelines for over-threshold modeling. J. Hydrol. 1999, 225, 103–117. [Google Scholar] [CrossRef]
- USWRC. Guidelines for Determining Flood Flow Frequency; United States Water Resources Council, Bulletin 17, of the Hydrology Subcommittee: Washington, DC, USA, 1976. [Google Scholar]
- Gabriel-Martin, I.; Sordo-Ward, A.; Garrote, L. Influence of initial reservoir level on the allocation of seasonal maximum conservation levels. Ingeniería del agua 2018, 22, 225–238. [Google Scholar] [CrossRef]
- Girón, F. The evacuation of Floods during the Operation of Reservoirs. In Transactions Sixteenth International Congress on Large Dams; Report 75; International Commission on Large Dams (ICOLD): San Francisco, CA, USA, 1988; Volume 4, pp. 1261–1283. [Google Scholar]
- Sordo-Ward, A.; Gabriel-Martin, I.; Bianucci, P.; Garrote, L. A Parametric Flood Control Method for Dams with Gate-Controlled Spillways. Water 2017, 9, 237. [Google Scholar] [CrossRef] [Green Version]
- Chavez-Jimenez, A.; Lama, B.; Garrote, L.; Martin-Carrasco, F.; Sordo-Ward, A.; Mediero, L. Characterisation of the sensitivity of water resources systems to climate change. Water Resour. Manag. 2013, 27, 4237–4258. [Google Scholar] [CrossRef]
- Sordo-Ward, A.; Bianucci, P.; Garrote, L.; Granados, A. The influence of the annual number of storms on the derivation of the flood frequency curve through event-based simulation. Water 2016, 8, 335. [Google Scholar] [CrossRef] [Green Version]
- Sordo-Ward, A.; Granados, A.; Iglesias, A.; Bejarano, M.D. Adaptation Effort and Performance of Water Management Strategies to Face Climate Change Impacts in Six Representative Basins of Southern Europe. Water 2019, 11, 1078. [Google Scholar] [CrossRef] [Green Version]
- Sordo-Ward, A.; Granados, I.; Iglesias, A.; Garrote, L. Blue Water in Europe: Estimates of Current and Future Availability and Analysis of Uncertainty. Water 2019, 11, 420. [Google Scholar] [CrossRef] [Green Version]
- CHD (Confederación Hidrográfica del Duero). Plan hidrológico de la parte española de la D.H.Duero (2015–2021); Official Report of the Ministry of Agriculture, Food and Environment of Spain: Valladolid, Spain, 2015. [Google Scholar]
- Garrote, L.; Iglesias, A.; Granados, A.; Mediero, L.; Martin-Carrasco, F. Quantitative assessment of climate change vulnerability of irrigation demands in Mediterranean Europe. Water Resour. Manag. 2015, 29, 325–338. [Google Scholar] [CrossRef]
- Chong, E.; Zak, S.H. An introduction to Optimization; John Wiley & Sons: Hoboken, NJ, USA, 2004. [Google Scholar]
- International Commission on Large Dams (ICOLD). Technical Dictionary on Dams: A Glossary of Words and Phrases Related to Dams; ICOLD: Paris, France, 1994; p. 365. [Google Scholar]
- Andreu, J.; Capilla, J.; Sanchís, E. AQUATOOL, a generalized decision support system for water-resources planning and management. J. Hydrol. 1996, 177, 269–291. [Google Scholar] [CrossRef]
- Yates, D.; Sieber, J.; Purkey, D.; Huber-Lee, A. WEAP21–A Demand-, Priority-, and Preference-Driven Water Planning Model. Part 1: Model characteristics. Water Int. 2005, 30, 487. [Google Scholar] [CrossRef]
Figure 1.
Conceptual scheme representing the role of maximum conservation levels (MCLs). COD represents the level of the crest of dam, DFL the design flood level, MNL the maximum normal operating level, and Zo the reservoir level prior to the flood event. Volume above MCL corresponds to the flood control operation volume and below MCL corresponds to the water conservation operation volume.

Figure 2.
Scheme of the methodology proposed.

Figure 3.
The procedure to generate the ensemble of inflow hydrographs (a,b) and its seasonal characterization (c). D represents the flood durations, whereas V represents the maximum annual flood. S1, S2, and S3 represent the different seasons.
Figure 3.
The procedure to generate the ensemble of inflow hydrographs (a,b) and its seasonal characterization (c). D represents the flood durations, whereas V represents the maximum annual flood. S1, S2, and S3 represent the different seasons.

Figure 4.
Scheme of the procedure for solutions proposal.

Figure 5.
Representations of the 132,651 values of MWRLTR = 1000y, MOTR = 500y, and YR = 90% for each of the seasons (S1, S2, and S3). MCLS1, MCLS2, and MCLS3 represent the maximum conservation levels in S1, S2, and S3 respectively. (a) Representation of the values YR=90%, with a color bar, which are the same in Sc.1 (initial reservoir level equal to MCL) and Sc.2 (variable initial reservoir level). (b,c) Representation of the values MWRLTR=1000y with a color bar in Sc.1 (b) and Sc.2 (c). (d,e) Representation of the values MOTR = 500y with a color bar in Sc.1 (d) and Sc.2 (e).

Figure 6.
(a,c) Grey dots represent pair of values YR = 90% and MOTR = 500y for Sc. 1 and Sc.2, respectively. Red dots (a) represent the configurations in which MWRLTR = 1000y > DFL. Magenta dots indicate the pareto front. Cyan dots represent the proposed solutions. The black dot represents the solution that maximizes the water volume supplied with a reliability of 90% and MOTR = 500y = OEMER. The blue dot represents the solution that minimizes the maximum outflow released (being YR = 90% = Da). (b,d) MCLs for each month/season which corresponds to the proposed solutions previously selected (blue and black lines correspond to blue and black dots in (a) and (c)), for Sc.1 and Sc.2, respectively. The red dashed line represents the maximum normal level (MNL), the red dashed–dotted line represents the design flood level (DFL), and the red continuous line represents the crest of dam (COD).

Figure 7.
Spider plot comparing the value of the maximum conservation levels for different seasons (MCLsx), MWRLTR = 1000y, MOTR = 500y, and YR = 90%. In black, solutions that maximize the volume supplied with MOTR = 500y = OEMER. In blue, the solutions that supply the current annual demand minimize the maximum outflow released. The continuous line corresponds to Sc.1 and the dashed line to Sc.2.


Table 1.
Main characteristics of the Riaño basin, dam, and reservoir.
| Basin Features | Value | Dam Features | Value |
|---|---|---|---|
| Basin area | 582 km2 | Maximum normal level (MNL) | 1100.1 m |
| Concentration time | 11 h | Design flood level (DFL) | 1101.1 m |
| Mean annual Runoff | 680 hm3 | Crest of dam (COD) | 1102.5 m |
| Annual Current Demand (Da) | 545 hm3 | Gated spillway capacity at MNL | 621 m3/s |
| Emergency downstream flow (OEMER) | 700 m3/s | Auxiliary spillway capacity at DFL | 98.7 m3/s |
© 2020 by the authors. Licensee MDPI, Basel, Switzerland. This article is an open access article distributed under the terms and conditions of the Creative Commons Attribution (CC BY) license (http://creativecommons.org/licenses/by/4.0/).
Share and Cite
MDPI and ACS Style
Gabriel-Martin, I.; Sordo-Ward, A.; Santillán, D.; Garrote, L. Flood Control Versus Water Conservation in Reservoirs: A New Policy to Allocate Available Storage. Water 2020, 12, 994. https://doi.org/10.3390/w12040994
AMA Style
Gabriel-Martin I, Sordo-Ward A, Santillán D, Garrote L. Flood Control Versus Water Conservation in Reservoirs: A New Policy to Allocate Available Storage. Water. 2020; 12(4):994. https://doi.org/10.3390/w12040994
Chicago/Turabian StyleGabriel-Martin, Ivan, Alvaro Sordo-Ward, David Santillán, and Luis Garrote. 2020. "Flood Control Versus Water Conservation in Reservoirs: A New Policy to Allocate Available Storage" Water 12, no. 4: 994. https://doi.org/10.3390/w12040994
Note that from the first issue of 2016, this journal uses article numbers instead of page numbers. See further details here.