A 20-Year MODIS-Based Snow Cover Dataset for Svalbard and Its Link to Phenological Timing and Sea Ice Variability


NORCE Norwegian Research Centre AS, P.O. Box 6434, 9294 Tromsø, Norway
*
Author to whom correspondence should be addressed.
Remote Sens. 2020, 12(7), 1123; https://doi.org/10.3390/rs12071123
Submission received: 4 March 2020
/
Revised: 27 March 2020
/
Accepted: 31 March 2020
/
Published: 1 April 2020
(This article belongs to the Special Issue Earth Observation (EO), Remote Sensing (RS), and Geoinformation (GI) Applications in Svalbard)
Abstract
:The climate in Svalbard has been warming dramatically compared with the global average for the last few decades. Seasonal snow cover, which is sensitive to temperature and precipitation changes, is therefore expected to undergo both spatial and temporal changes in response to the changing climate in Svalbard. This will in turn have implications for timing of terrestrial productivity, which is closely linked to the disappearance of seasonal snow. We have produced a 20-year snow cover fraction time series for the Svalbard archipelago, derived from MODIS (Moderate Resolution Imaging Spectroradiometer) Terra data to map and identify changes in the timing of the first snow-free day (FSFD) for the period 2000–2019. Moreover, we investigate the influence of sea ice concentration (SIC) variations on FSFD and how FSFD is related to the start of the phenological growing season in Svalbard. Our results revealed clear patterns of earlier FSFD in the southern and central parts of the archipelago, while the northernmost parts exhibit little change or trend toward later FSFD, resulting in weaker trends in summer and winter duration. We found that FSFD preceded the onset of the phenological growing season with an average difference of 12.4 days for the entire archipelago, but with large regional variations that are indicative of temperature dependence. Lastly, we found a significant correlation between variations of time-integrated SIC and variations in FSFD, which maximizes when correlating SIC northeast of Svalbard with FSFD averaged over Nordaustlandet. Prolonged sea ice cover in the spring was correlated with late snow disappearance, while lower-than-average sea ice cover correlated with early snow disappearance, indicating that proximity to sea ice plays an important role in regulating the timing of snow disappearance on land through influencing the regional air temperature and therefore rate of spring snowmelt.
1. Introduction
Seasonal snow cover evolves continually due to meteorological factors affecting the physical properties of the seasonal snowpack. As such, seasonal snow cover may be considered a sensitive indicator of climate change. During the last few decades, the Arctic in particular has experienced twice the rate of warming compared with the global average, also referred to as the Arctic amplification [1,2]. Warming has been linked to loss of Arctic sea ice cover [3,4,5,6], as larger areas of open water absorb greater amounts of solar radiation, which is re-emitted as long-wave radiation and warms the lower troposphere. Sea ice loss is also accelerating [7], resulting in an overall reduction in albedo, which serves to amplify snow-temperature feedback processes [8]. In particular, sea ice loss north of the Svalbard archipelago has been found to be more pronounced during winter than summer [9], and the air temperature is expected to increase on average by 3–4 °C on the west coast, while even greater temperature increases of up to 6–8 °C are expected to occur in the northeastern regions by the end of the 21st century. Wintertime warming is expected to be stronger than in other seasons [10,11,12], accompanied by increased precipitation as sea ice loss enhances surface evaporation and moisture transport. Winter warming in combination with greater precipitation has meant that rain-on-snow events during winter have also become more frequent in the most recent decades [13,14,15] in Svalbard. Such events cause the formation of basal ice layers at the ground surface, which negatively affects the food availability for grazing animals [16] since their potential food supply is essentially locked off.
Trends of increasing temperature and precipitation on Svalbard have been associated with significant changes in seasonal snow cover during the last few decades. These changes include an upward trend in the equilibrium line altitude (ELA) of perennial snow, later onset of snow in response to autumn warming [17], earlier disappearance of seasonal snow, shorter duration of snow cover and both a decrease in and earlier timing of maximum snow depth [18]. Traditional methods for snow cover change monitoring include in-situ point measurements of snow depth as well as combining snowpack modeling with regional climate models [17]. While models have been used to provide estimates of snow cover at large spatial scales, in-situ measurements are time consuming and limited in spatial extent where long-term and large-scale monitoring of snow cover changes are desirable. On the other hand, remote sensing methods are an effective tool for providing measurements from which snow cover fraction can be derived [19] at spatial resolutions on the order of 1 km and over large areas. For example, imaging spectrometers such as the Advanced Very High Resolution Radiometer (AVHRR), Moderate Resolution Imaging Spectroradiometer (MODIS) and the Visible Infrared Imaging Radiometer Suite (VIIRS) have been utilized for this purpose since as far back as 1982, providing a large archive of measurements that cover periods long enough for identifying climate-related trends in snow cover characteristics. These sensors provide observations at daily time scales as long as the surface is not obscured by cloud cover and is illuminated by sunlight. Methods also exist for remotely sensing snow cover that are not dependent on cloud-free conditions or solar illumination; one such example is the use of Synthetic Aperture Radar (SAR), which has been used to detect and map the occurrence of wet snow cover [20]. However, a weakness of using SAR is that it cannot distinguish dry snow from bare ground, which limits its uses during winter when dry snow cover largely dominates. Passive microwave radiometers are also utilized to obtain daily information on snow cover but typically suffer from substantially poorer resolution (~20 km), and measurements are therefore subject to a greater degree of uncertainty in complex terrain such as along coastlines and in mountainous areas, where the scale size of features is typically smaller than the spatial resolution. Instruments with low spatial resolution are thus not optimal for studies of snow cover over Svalbard, which is predominantly made up of mountainous terrain and fjords. Active microwave systems such as the QuikSCAT SeaWinds scatterometer instrument are also sensitive to liquid water content in snow and as such have been successfully exploited in earlier studies to map the timing of total melt days and summer melt onset over glaciated areas of Svalbard [21,22]. However, while the onset of snowmelt can give an indication of when snow volume begins to decrease systemically, it does not provide information on when snow has completely disappeared, which is important for phenological processes.
A remote sensing technique that exploits MODIS Terra data together with temporal interpolation methods that correct for presence of cloud cover has been developed for mapping snow cover characteristics over Northern Scandinavia [23], demonstrating an approach that can address challenges related to Arctic weather and the absence of solar illumination for several months of the year. It is therefore a primary goal of this study to use the MODIS Terra dataset for the period 2000–2019 and adapt this method for application to the Svalbard archipelago, in order to study changes and trends in patterns of snow cover disappearance, duration and onset.
Since snowmelt is driven by temperature changes, it follows that in a warming climate, ecosystems with seasonal snow cover may experience earlier plant development of some of the species as snow disappears earlier [24]. The onset of the growing season on Svalbard has been studied and mapped using a method based on MODIS Terra surface reflectance products [25] for the period 2000–2013. Based on this relatively short period, the authors noted only a very weak delayed onset of 1.3 days for the whole of Svalbard. Other studies have alluded to similarities between spatial patterns of snow season duration and growing season duration for Northern Scandinavia, but they did not present a quantitative examination of the relationship between those two parameters [23]. Hence, the secondary goal of this study is to evaluate how the timing of snow disappearance affects the timing of the growing season in Svalbard at MODIS pixel resolution scale. Moreover, we wish to establish whether the relationship between snow disappearance and growing season onset is changing as a result of the ongoing warming trends in the Arctic. This knowledge is important since it is already well known that earlier snow disappearance may expose vulnerable plants to low temperatures, leading to frost damage and negative impacts on plant growth and productivity [26,27,28]. Indeed, at Arctic latitudes it has been shown that earlier snowmelt due to warming leads to earlier onset of plant growth but has varied effects on overall plant production [29].
Proximity to sea ice is known to affect air temperature on adjacent land masses [30], thereby constituting an indirect factor that also influences the timing of snowmelt and disappearance and hence onset of the phenological growing season. Indeed, an anticorrelation between September sea ice extent and total number of melt days was found under a study of two glaciated archipelagos in the Russian High Arctic [31] using multiple passive and microwave sensor data. Other studies have discussed the apparent link between variability in the sea ice edge and onset of snowmelt in Svalbard [21], though this relationship was not quantitatively established. On the other hand, a decline in sea ice may lead to mass growth in certain glaciated regions on Svalbard due to enhanced wintertime precipitation resulting from increased evaporation over open water [32,33]. Outside of Svalbard, a link between sea ice decline in the Barents Sea and more severe Eurasian winter snowfall has been reported, which was attributed to increased frequency of atmospheric blocking patterns and cold air advection [34]. There is therefore a complex relationship between variations and trends in Arctic sea ice cover that affects regional temperature and precipitation trends and consequently wintertime snow cover and timing of snow disappearance in spring, which in turn controls onset of growth. Our final goal of this study is therefore to quantify how sea ice concentration around Svalbard is related to the timing of snow disappearance in Svalbard, which is derived by optical remote sensing. In summary, the main objectives of this paper are as follows: firstly, to map snow cover fraction over Svalbard for the period 2000–2019 by applying earlier developed algorithms for estimating and mapping snow cover fraction using MODIS Terra data (MOD10A1 at 500 m resolution); secondly, to calculate the timing of snow disappearance and onset for each year to further derive trends of snow cover change over 20 years; thirdly, to study how the timing of snow disappearance was related to both timing of plant phenology processes and sea ice variability around Svalbard. Moreover, we aim to quantify the observed relationships at both local and regional scale and for the entire Svalbard archipelago.
2. Materials and Methods
2.1. Study Area
The Svalbard archipelago is located in the Arctic ocean, approximately halfway between the northernmost point of the Norwegian mainland and the North Pole. It consists of a group of nine islands, of which the largest is Spitsbergen. The Svalbard archipelago covers a total area of 61,000 km2 of which 60% is glaciated, 30% is covered by barren rock and the remaining 10% is covered by vegetation. The largest glacier, Austfonna, is situated on the island Nordaustlandet. The archipelago spans latitudes between 74–81°N and longitudes ranging from 10–35°E, which means both midnight sun and polar night can dominate for large parts of the year. In the administrative center Longyearbyen, polar night conditions are present from 26 October until 15 February, with midnight sun from 20 April to 23 August. To the west of the archipelago, the West Spitsbergen Current brings warm salty water from the Atlantic Ocean northwards, resulting in milder climate than experienced at similar latitudes elsewhere. Meteorological data recorded at Svalbard Airport, close to Longyearbyen, show that the mean annual temperature in the period of study (2000–2019) ranges from −6.1 °C (2003) to 0 °C (2016), while annual precipitation ranges from a minimum of 142.1 mm (2005) up to 310 mm (2016).
Figure 1 presents an overview of the Svalbard archipelago showing both the vegetated part of the land and the locations of six selected meteorological stations from where data were collected, while in Figure 2 we present an illustration of the research scheme, datasets and procedures that are used and carried out in this study.
2.2. MODIS Terra Dataset
2.2.1. Snow Cover Fraction Algorithm
In this study we used the 2000–2019 NASA MODIS/Terra Snow Cover Daily L3 Global 500 m Grid, Version 6 (MOD10A1). This product provides Normalized Difference Snow Index (NDSI) as a daily product [35]. Snow cover fraction (hereafter, SCF) can be derived from NDSI using a universal approach [36] defined by Equation (1):
Equation (1) was originally developed for use with version 5 of the MODIS dataset but is nevertheless compatible with the upgraded version 6. We masked out areas that corresponded to cloud cover, ocean and winter darkness, and we converted projection to WGS 1984 UTM Zone 33N. Then, we used a multitemporal interpolation technique (c.f. Section 2.2.2) to fill the gaps due to missing observations. We processed daily images beginning from 1 March, 2000 (DOY 60) to 1 November, 2019 (DOY 306). With the exception of a few days, in particular DOY 166–183 in 2001, daily datasets have been available for the whole period. Due to the absence of solar illumination during the polar night period, the MOD10A1 is only produced between 1 March to 1 November for the entire Svalbard archipelago. In this study we are primarily interested in studying the temporal characteristics of the seasonal snow cover in the periglacial landscape. We therefore used a vegetation map produced from classification of Landsat TM/ETM+ data [37] to mask out inland water bodies and glaciated areas.
2.2.2. Temporal Interpolation Methods to Obtain a Cloud-Free Climatology
Due to the high cloud cover fraction over Svalbard, which is on average 85% for all areas over the 20-year period, there is a need to interpolate between cloud-free pixels to obtain useful estimates of SCF. Several methods have been discussed in detail in literature [20,21], which includes the use of both pure temporal interpolation between cloud-free pixels, a combination of spatial filtering and temporal interpolation and also combinations of the two aforementioned methods joined with multisensor fusion [38]. In the current approach, we processed MODIS Terra data using temporal interpolation as outlined in the technique developed by Malnes et al. [23] for Northern Scandinavia using a small modification to account for the higher latitude of the Svalbard archipelago. We assumed that the entire land area is snow covered on DOY = 365 (366) each year as a boundary condition. Due to interpolation, this assumption will force all land pixels to have 100% snow cover fraction late in the autumn, irrespective of the last observation. By applying the interpolation operator to the MODIS time series, we obtained an entirely cloud-free time series that can be used to estimate total SCF for the entire Svalbard archipelago. On average, the number of cloud-free samples per year per pixel is 52 ± 16 days for the entire time series, based on the period of 240 available days where the polar night mask does not apply. Some regions however, predominantly in the northern parts of Spitsbergen and over Austfonna, had very few cloud-free samples per year (c.f. Figure A1). Since the absolute minimum number of pixels required to obtain interpolated estimates is three, there are ultimately some pixels in these regions with missing SCF estimates for certain years.
2.2.3. First and Last Day of Snow
The timing of snow disappearance and onset, which we will refer to using the snow metrics first snow-free day (FSFD) and the last snow-free day (LSFD), are defined as the days when SCF falls below or rises above 50%, respectively. The algorithm of Malnes et al. [23] additionally constrains the window for FSFD and LSFD detection to the periods between DOY 90–230 and DOY 230–306, respectively, and the corresponding SCF must remain below (above) 50% for a minimum of 10 days after the estimated date in order for the result to be retained. The requirement on SCF to remain below (above) the 50% threshold for at least 10 days was imposed to avoid detecting short-lived fluctuations in SCF around the threshold (e.g., due to late season snowfall or snowmelt), while the constraints on date for detection of FSFD and LSFD were applied to avoid problems resulting from low solar angle. The latest date for detection of LSFD was set to DOY 306 (1 November), which marks the approximate start of the polar night in Svalbard when optical data cannot be used to infer information on the snow cover.
The estimates of FSFD and LSFD were further used to estimate the length of summer and the length of winter, for which trends will be studied over the 20-year period. For the purpose of this study, the length of summer LS is defined as the difference between LSFD and FSFD from the same year, while the length of winter LW is the difference between LSFD from the previous year and FSFD from the current year.
2.2.4. Accuracy of SCF and Derived Snow Metrics
The MODIS NDSI single-day accuracy has been assessed by numerous authors on a global scale [35,36,39]. In the majority of studies, comparisons with in-situ snow depth data recorded at meteorological stations and with high resolution optical data such as those obtained by the Landsat and Sentinel-2 satellites are accepted as the best way to assess the accuracy. To assess the accuracy of interpolated gap-filled time series, the average number of days between cloud-free observations was used as a proxy for the accuracy of the interpolated snow product [19,23]. We adopted this approach to assess the uncertainty incurred in the estimates of FSFD and LSFD by calculating the number of days since the last cloud-free observation. The average number of cloud-free days for our estimates of the FSFD and LSFD are mapped for the entire Svalbard archipelago in Figure A2. Using all 20 years of the dataset, the average number of days since the last cloud-free day is 8.3 ± 3.8 days for FSFD and 7.7 ± 4.2 days for LSFD. The difference is minimal, but the number of pixels where we cannot estimate LSFD (26.0% of all land pixels for all years) is marginally higher than for FSFD (25.3%) and concentrated primarily in the northern parts of the archipelago. Hence the overall estimate of LSFD is marginally less certain over these areas than for FSFD. However, there are both large spatial and interannual variations, with some years and regions experiencing long periods of the order 1–2 months without cloud-free observations. For the meteorological sites and available years of data we used to validate MODIS FSFD (c.f. Section 2.4), the mean number of days since the last cloud-free observation for FSFD is 4.4 days, while for estimates of LSFD, the average number of days since the preceding cloud-free observation is 2.8 days.
2.3. SIOS Database and Open Science
SIOS (Svalbard Integrated Arctic Earth Observing System) was first initiated in 2007 and has been fully operational since 2018. SIOS is a regional observing system that aims to establish a database of long-term measurements in Svalbard, bringing together both field, remote sensing and model observations to address Earth system science questions. As such, the MODIS 20-year snow cover fraction time series will also contribute to the growing volume of data being gathered by the SIOS project and has been stored in the SIOS database [40]. The dataset can be easily accessed through FTP (File Transfer Protocol) or other software frameworks such as OPeNDAP (Open-source Project for a Network Data Access Protocol) [41] that facilitates the retrieval and exchange of remotely stored, structured datasets, streaming of subregions and effective use of the data. In the newly started ESA project Cryosphere Virtual Laboratory (CVL) [42], the MODIS snow cover dataset and its relations to other climate time series will be developed as one of five use cases. The project will use Open Science standards, specifically OPeNDAP, to demonstrate that the results of this work can be reproduced and correlated with other datasets using the CVL system that operate on virtual machines. This study aims to demonstrate how the current dataset can be used with complementary satellite-derived datasets, also available through the SIOS database, to study the factors that influence the temporal characteristics of snow cover over Svalbard and the impact of snow cover on terrestrial productivity.
2.4. Meteorological Data
Meteorological data managed by the Norwegian Meteorological Institute have been made available for download via OPeNDAP; however, this is currently limited to the years from 2016 onwards. In order to cover the full time interval of MODIS data, we downloaded data from six meteorological stations in Svalbard from eklima.no, starting from the year 2000. In particular, we obtained measurements of precipitation, snow depth, mean, minimum and maximum air temperature. However, only a few of the stations had a complete time series of snow depth observations that could be utilized to validate our snow metrics.
A threshold of 2 cm was applied to snow depth measurements to determine the meteorological FSFD, and this had to be maintained for at least 5 consecutive days to qualify for the condition “snow-free”. The meteorological FSFD was then compared with MODIS FSFD by performing linear regression and deriving the correlation between the two estimates. This was done firstly to validate the satellite-derived product and secondly to obtain the general relationship between the meteorological and MODIS FSFD. Several stations had incomplete time series of FSFD either due to missing in-situ measurements or missing data in the MODIS dataset. Therefore, measurements from all sites were combined in the regression analysis. Table 1 summarizes data availability at each site and the total number of measurements used in validation of both FSFD and LSFD.
2.5. Growing Season Onset Mapped with MODIS-Normalized Difference Vegetation Index (NDVI) Data
This study used estimates of growing season onset (GSO) for 2000–2016 based on MODIS-NDVI data, which have been correlated with field phenology observations. The method for estimating GSO from MODIS data was previously developed by Karlsen et al. [25] for 2000–2013, but the dataset has since been extended for plant biomass studies [43] and for studies of the coupling between tundra productivity and sea ice distribution [44]. The NDVI dataset is based on the 8-day reflectance MODIS products MOD09Q1 and MOD09A1. A combination of three different cloud removal methods was applied to obtain a clear-sky time series of NDVI data. From this NDVI time series, GSO estimates were extracted for each year using a pixel-by-pixel threshold method. The NDVI threshold level was reached after several iterations, and the level that gave the highest correlation with general flowering of Arctic willow (Salix polaris) across several different vegetation types was used. Arctic willow is among the most common plant species on Svalbard, and the timing of flowering of Arctic willow occurs on average six days before the mean flowering date of twelve other vascular plants in Longyearbyen areas and should indicate well the general time of onset of growth [25]. This study aims to quantify the relationship between the timing of snow disappearance, as denoted by FSFD and the onset of growth. We therefore mapped the difference of the dates in order to identify spatial patterns and endeavor to establish the dependence of this length of time on the mean daily temperature using data from the three meteorological stations Hornsund, Longyearbyen and Ny-Ålesund, since temperature is an important factor for vegetation growth. In addition to mapping the spatial patterns of the difference, the relationship between timing of snow disappearance and start of the growing season was further investigated by reducing the dataset through averaging. This was done by selecting the pixels corresponding to each DOY in the range of FSFD. For each of FSFD DOY, we averaged GSO, excluding pixels where the GSO date occurred before that DOY for FSFD, since it is unlikely that growing season can begin before snow disappearance. In addition, we only accepted the average GSO date where there was a minimum of 50 pixels to average. The averaging was performed individually for each year of data in order to identify interannual variations in the relationship between timing of FSFD and GSO.
2.6. Sea Ice Concentration
Sea ice concentration maps (hereafter, SIC) in the Arctic sea are available via OPeNDAP for the period 1967–present and are produced by the Norwegian Meteorological Institute. Ice charting has been carried out manually by GIS (Geographic Information Systems) experts [45]. Currently, the data are available on a daily basis and cover a latitude range from 53.8–88.8°N and longitudes from −84.0 to 87.2°E. During the ice charting procedure, ice types are classified into different classes depending on the ice concentrations. The SIC limits and ice type definitions used in the classification can be found in Table 2 of Dahlke et al. [46]. We accessed the SIC map catalogue [47] using OPeNDAP to extract SIC maps of the sea region around Svalbard from 2000 until 2019 in order to investigate whether there are observable correlations between the timing of snow disappearance and sea ice concentration. An example of the data product extracted from the catalogue is shown in Figure 3 for 5 March 2001. We used the SIC classifications of Dahlke et al. [46] to define the color scale used in Figure 3. This subregion of data was further divided to calculate the mean daily ice concentration over four different sea areas surrounding Svalbard in order to investigate whether the region where sea ice is present influences the timing of snow disappearance and, if so, which area of sea has strongest influence. These four areas comprise the sea to the northeast, east and west of Svalbard, plus averaging over the entire sea region surrounding Svalbard. The boundaries of the areas used for averaging SIC are indicated in Figure 3. For each sea region, we smoothed each year of ice concentration measurements with a median filter of 15-day width to remove short-lived fluctuations. The smoothed time series were then temporally averaged over all years in the dataset, for each day of the year.
This study aims to determine whether ta correlation exists between SIC in different regions around Svalbard and the timing of snow disappearance, for which we use the MODIS-derived estimates of FSFD as a proxy. Furthermore, we investigated if proximity to sea ice is important for snow disappearance by averaging the FSFD estimates over four different areas of Svalbard: Nordaustlandet, in the northeastern corner of the archipelago; Edgeøya, located in the southeast of the archipelago; Nordenskiöldland, in the central part of the archipelago; and lastly, in the case of the land-averaged values of FSFD. We integrated the area under the annual ice concentration curves, starting from 1 September of the year prior to the first snow-free day estimates (SIC minimum) until 30 June of the year after. We did not integrate to dates after 30 June, since it was found that the average date of the FSFD was 29 June; thus, integrating the ice concentration to a later date will not reveal if the timing of FSFD was the consequence of the amount of sea ice at a date after snow disappearance has occurred. The integration approach provided a better measure for distinguishing between years with similar maximum ice concentrations but different rates of melting. That is to say, the approach better separated years when SIC declined rapidly after the April maximum from years when SIC remained high for a longer duration after the April maximum. The integration was carried out by first converting SIC from percentages to a fraction and applying a trapezoid approximation on the daily mean ice fraction values, averaged over the four sea regions (Northeast Svalbard, East Svalbard, West Svalbard and the entire sea region around Svalbard).
The time series of the time-integrated sea ice concentration (hereafter, TI-SIC) and time series of FSFD were both linearly detrended before performing linear regression. Detrending both time series allows us to establish whether a correlation exists between the variations in each parameter, rather than using the absolute values that may include a trend due to the effect of temperature, which likely affects both parameters. We therefore obtained a set of 16 maximum correlation coefficients and linear fits corresponding to the maximum correlation for each time series of SIC and FSFD that have been averaged over four different areas. We also noted the date defining the end of the integration interval for which the detrended TI-SIC time series was best correlated with the FSFD time series.
3. Results
In this section, we start by presenting the results of the snow cover fraction mapping, which forms the basis for estimation of the first and last snow-free days. In Section 3.2 and Section 3.3 we present results from mapping FSFD and the decadal trends in the snow cover parameters. A comparison of FSFD and LSFD estimated from in-situ snow depth measurements against the MODIS-derived estimates is shown in Section 3.4. Finally, we use the estimates of FSFD to examine firstly the relationship with onset of the growing season in Section 3.5 and thereafter the relationship between snow disappearance and sea ice concentration in Section 3.6.
3.1. Snow Cover Fraction
The total (land-averaged) SCF for Svalbard for all 20 years in the time series is shown in Figure 4. It can be seen that the variability in total SCF is greatest during the summer period from July to the end of September. The SCF converges to a minimum value of close to 20% for the majority of years in the time series, but SCF did not fall below approximately 40% during a few years (most notably 2000 and 2008) due to late season snowfall in August over the northernmost areas of Svalbard.
The average date of the minimum SCF occurs on 8 August (DOY 220), with an average snow cover fraction of 27.4%. The number of years where the SCF exceeded 50% on 8 August is illustrated in Figure 5a, while the snow cover fraction on 8 August is mapped in Figure 5b. Figure 5b therefore allows the areas that contribute most to the land-averaged minimum SCF remaining above 20% during the period studied (Figure 4) to be identified. While Figure 5b shows that there are large parts of the archipelago that are close to snow-free (<20%), there is a clear tendency towards higher minimum SCF in the northernmost areas on Spitsbergen and Nordaustlandet. These areas are fully or close to fully snow covered in August for many of the years during the study period. In particular, the years 2000 and 2008 experienced late snowfalls in July/August, which resulted in large areas that never became snow-free (SCF < 50%). The same areas retain high minimum SCF for more than 5 years of the 20-year time series. Hence, when SCF is averaged over the entire archipelago, the land-averaged minimum SCF never falls to zero due to these areas with persistent snow cover.
3.2. Patterns in First Snow-Free Day
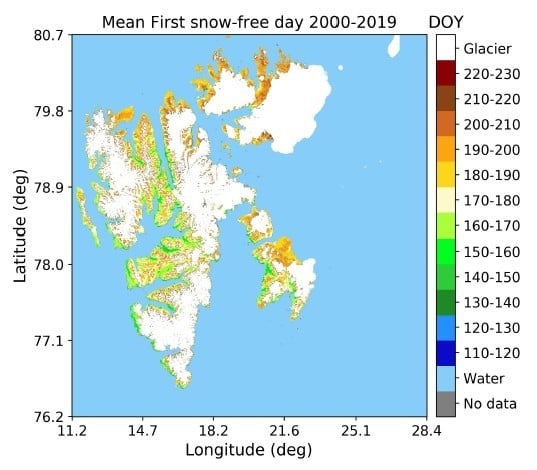
Since we wish to study the relationship between snow disappearance and timing of growing season onset, and between timing of snow disappearance and sea ice concentration, we will mainly focus on the results of the spatial patterns in FSFD in Section 3.2 and Section 3.3. The mean date of the first snow-free day, averaged over the entire period 2000–2019, is shown in Figure 6. The land-averaged date for FSFD is DOY 180 (29 June) ± 17.8 days. It can be seen from this figure that there are clear north–south variations as well as variations with elevation. In the northern- and easternmost areas of the archipelago for example, the mean date for FSFD is typically after DOY 190, or mid-July, while over Nordenskiöld Land it can be seen that the low-lying valley areas exhibit a mean FSFD of DOY 130–170, which is one to one and a half months earlier than compared with the northern parts of the archipelago. In the mountainous regions over Nordenskiöld Land, FSFD occurs as late as the lower lying areas of the northern parts of the archipelago.
Anomalies in FSFD for each year are shown in Figure 7. These have been calculated by subtracting the individual pixel values of FSFD from the 2000–2019 average FSFD. The anomalies, or differences from the 2000–2019 average have been categorized into either >1 week earlier, ±1 week change or >1 week later in order to identify years where the timing of snow disappearance occurred much earlier or much later than the 20-year average. Figure 7 shows that 2000, 2008 and 2009 stand out as years where the FSFD occurred much later than average over the whole archipelago, while in 2002 and 2013 the timing of FSFD was much earlier than the 2000–2019 average. During other years in the time series, the timing of FSFD was either later or earlier than the average for different parts of the archipelago. For example, in 2007, FSFD occurred >1 week earlier than average on Nordaustlandet in the northeast part of the archipelago, while on Edgeøya FSFD occurred >1 week later than average, even though it can be seen from Figure 6 that the mean FSFDs for these two areas are actually very similar and quite late. In 2014, the opposite situation is observed, with Nordaustlandet and western coastal parts of Spitsbergen exhibiting FSFD which was >1 week later than average, while the timing of snow disappearance on Edgeøya occurred >1 week earlier than average.
3.3. Decadal Trends in Snow Cover Characteristics
The four snow cover parameters FSFD, LSFD, LS and LW are mapped for each year in the time series. Pixel-wise linear regression was performed on the time series of each parameter in order to obtain the linear trend over the 20-year period. Pixels with more than 1 year of missing data were excluded from the fitting in order to obtain as reliable fits as possible. The results of the trend mapping are illustrated in Figure 8a–d for each of the four parameters.
Figure 8a shows that there are both north–south and east–west differences, with a shift towards earlier FSFD of >3 days decade−1 in the western and central parts of Spitsbergen and across the island of Edgeøya in the east, while in the northern parts of the archipelago, there is a trend toward delayed FSFD of >3 days decade−1. Some areas within the central parts of the archipelago exhibit smaller trends of ±3 days decade−1. The parameters have been averaged over three specific regions to quantitatively determine the regional differences in FSFD and LSFD: Nordaustlandet in the northeast of the archipelago, Edgeøya in the east and Nordenskiöld Land in the central part of Spitsbergen. We found that on Nordaustlandet there is a trend of +2.9 days decade−1 for FSFD and +2.9 days decade−1 for LSFD. In contrast, the trend in FSFD averaged over Edgeøya, in the east of the archipelago, was found to be −2.8 days decade−1 with corresponding delay in LSFD of +2.8 days decade−1. Similar but weaker trends are obtained for Nordenskiold Land, with a trend in FSFD of −1.5 days decade−1 and a trend toward later LSFD of +1.6 days decade−1. Thus, while the trend in onset of autumnal snow (Figure 8b), toward later dates is quite consistent across the archipelago, the timing of snow disappearance is becoming later in the north but earlier in the southern parts of the archipelago.
These changes in FSFD and LSFD in turn affect the length of summer and winter at different parts of Svalbard, as shown in Figure 8c,d respectively. For the entire archipelago on average, the length of summer is increasing by +4.2 days decade−1, though Figure 8c indicates that there are distinct regional variations. The greatest increases in the duration occur at the western edges of Spitsbergen, while the remainder of the archipelago exhibits an increase of up to 7 days. On Nordaustlandet the trend in length of summer is only +1.4 days decade−1, while on Edgeøya and Nordenskiöld Land the trends are somewhat stronger, with increases of +5.6 and +3.3 days decade−1, respectively. With regard to trends in winter duration, the westernmost and easternmost areas exhibit the greatest reductions, of >7 days decade−1. On Edgeøya the average trend in winter duration is −7.1 days decade−1, while the central parts of the archipelago exhibit somewhat weaker reductions of up to 7 days decade−1. On Nordenskiöld Land, for example, the reduction was on average −4 days decade−1. This contrasts with a few isolated areas in the north which exhibit an increase in the length of winter of >7 days decade−1. Averaged over Nordaustlandet, the mean trend in winter duration is a negligible +0.6 days decade−1. It should be noted, however, that a large proportion of pixels on Nordaustlandet did not possess sufficient data points in the time series for a linear fit to be made for LSFD, summer and winter duration trends, as illustrated by the grey colored pixels.
In Table 2 below, a summary of the decadal trends in each snow parameter (FSFD, LSFD, LS, LW) is provided for each of the regions Nordaustlandet, Edgeøya and Nordenskiöld Land as well as the land-averaged decadal trends.
3.4. Correlation with Meteorological Data
Figure 9 (left) shows that there was a significant and positive correlation between the meteorological estimate of FSFD and the MODIS estimate, with correlation coefficient of 0.77. The bias of −12.32 indicates that FSFD estimates obtained from the MODIS snow cover fraction product were on average 12 days later than those observed from the point snow depth measurements. Qualitatively, the dataset exhibits more spread in MODIS estimates when FSFD as observed from snow depth measurements occurs earlier than DOY 150 and better correlation between the two estimates when the snow depth estimate of FSFD occurs after DOY 150. In the case of LSFD, in the right panel of Figure 9, there is significantly greater scatter around the regression line, indicating less agreement between the two estimates and therefore weaker correlation, as noted from the correlation coefficient of 0.48. The regression line intersects with the equality line when the meteorological LSFD is around DOY 270; hence, when the meteorological LSFD occurs before DOY 270, the MODIS LSFD estimate is later, and for meteorological LSFD after DOY 270, the MODIS estimate LSFD is earlier.
3.5. Relationship between Snow Disappearance and Growing Season Onset
The mean difference, or length of time from snow disappearance to onset of growth averaged over the 17-year dataset is shown in Figure 10. The difference has been split into four categories corresponding to; <7 days, 7–14 days, 14–21 days and >21 days. In instances where the difference between GSO and first snow-free day was less than zero, i.e., growing season onset date occurred before first snow-free day, these pixels were excluded from the averaging. Figure 10 shows that the shortest differences of <7 days are concentrated on the east side of Edgeøya and on Reinsflya, which is situated at the northern end of Svalbard. These areas have cold summers with short growing seasons. On Nordenskiöld Land there is also much variation in the difference, with the central and southern parts exhibiting a mean difference of typically <7 days, mostly at higher elevations, or 7–14 days, mostly in the warm valley floors. However, in the valley floor of Adventdalen, close to Longyearbyen, the mean difference is typically in the range of 14–21 days, with some parts >21 days. Further north of Nordenskiöld Land there are not clear spatial patterns in the difference, with some coastal areas exhibiting differences of up to 14 days, while other coastal areas show differences between snow disappearance and GSO of >14 days. However, we found that for the whole of the nonglaciated parts of Svalbard, the difference between snow disappearance and the start of the growing season was on average 12.4 ± 1.7 days (minimum = 9.5 days, maximum = 17.7 days) when the entire 17-year period was considered.
Figure 11 shows the average relationship between FSFD and onset of the growing season, as obtained through the data reduction procedure described in Section 2.5. Overall there is a linear relationship between GSO date and FSFD for the majority of years, especially over the interval where FSFD occurred between DOY 160 and DOY 210. For earlier FSFD occurrence, there is a greater degree of spread in the timing of GSO, indicating that there was a larger variation in the difference for earlier snow disappearance dates, likely determined by the average air temperatures after snow disappearance. Certain years emerge with greater occurrence of early snow disappearance; for example, in 2006 there was a greater proportion of pixels where the FSFD occurred before DOY 135 compared with all other years in the dataset. However, the corresponding average GSO date remains almost unchanged at approximately DOY 165 over the interval where FSFD occurred between DOY 115–135, which is equivalent to a difference that is on average 30–50 days between FSFD and the start of the growing season. Figure 11 also shows that the date of GSO was consistently early in 2016 compared with other years. Similarly, the earliest occurrence of FSFD in 2016 was rather early compared with other years, with the exception of 2006. In contrast, the average growing season date in 2000 and 2008 occurred late relative to the timing of FSFD, and the high minimum value of FSFD for these two years indicates that snow disappearance also occurred late compared with other years in the dataset.
In general, Figure 11 shows that when snow disappearance occurred late (DOY 190, 9 July), there is a difference of 5 to 10 days until onset of the growing season, while for earlier FSFD (DOY 160, 9 June) the difference ranges from 10 to 25 days. Hence, in years with early FSFD, there is a greater difference between GSO and FSFD compared with years when FSFD occurred later.
The relationship between the difference between FSFD and GSO and mean daily temperature in this period for the sites Hornsund, Longyearbyen and Ny-Ålesund is illustrated in Figure 12. Only Longyearbyen and Ny-Ålesund had complete time series for the mean daily temperature, while for Hornsund there were some years with missing temperature data. For all three sites there were complete time series of the difference between GSO and FSFD. Figure 12 indicates that occurrences of greater (smaller) differences are due to cooler (warmer) average temperatures, indicated by the negative slope of the regression line. At Ny-Ålesund for example, where the difference between snow disappearance and GSO was generally shorter (minimum = 5.2 days, maximum = 17.5 days), the mean daily temperatures are also higher (mean = 4.4 °C, variance = 1.3 °C) than at Longyearbyen (mean = 2.3 °C, variance = 1.0 °C) where the difference between FSFD and GSO was longer (minimum = 13.7 days, maximum = 36.7 days). At Hornsund, the spread in difference is quite large (minimum = 1.5 days, maximum = 22.5 days), while the corresponding mean daily temperature during the period between snow disappearance and GSO was confined to a smaller range of about 2 °C. It should be noted though, that the mean daily temperatures being compared in Figure 12 correspond to different times of year. This is because the mean FSFD at Longyearbyen typically occurs up to a month earlier than at, for example, Ny-Ålesund (c.f. Figure 6) which explains why the data in Figure 12 shows lower average temperatures for Longyearbyen despite its more southerly location in comparison with Ny-Ålesund. Despite the data points being spread about the regression line, the correlation is quite strong and negative (r = −0.75) and significant (p < 0.05). The range and mean values of the difference and mean daily temperature for the three sites are summarized in Table 3.
3.6. Correlation with Sea Ice Concentration
Time series of the spatially and temporally averaged SIC are illustrated for each of the four sea regions (c.f. Figure 3) in Figure 13a–d together with the minimum and maximum SIC indicated by the dashed lines. For all regions, the maximum mean SIC is reached in the beginning of April and falls to a minimum in the start of September. Similarly, for all regions, the variation is smallest between lowest and highest SIC at April maximum, while there is greatest variation between the lowest and highest values of the mean SIC at the start and end of year. The mean SIC is typically highest in the sector northeast of Svalbard, ranging from a mean minimum concentration of just over 40% to a mean maximum concentration of approximately 85%. This contrasts with SIC in the sector west of Svalbard, where warm Atlantic water is driven northwards by the West Spitsbergen Current and inhibits the formation of sea ice. As a result, SIC is overall lower compared with SIC in the east of Svalbard, with much smaller range between the mean minimum and maximum SIC, ranging from 20% to 40%.
As outlined in Section 2.6, linear regression was performed on detrended time series of TI-SIC, and FSFD and correlation coefficients were obtained for each pair of TI-SIC and FSFD linear fits, using the four different sea ice regions and four land regions for which FSFD has been averaged. The set of 16 maximum correlation coefficients, together with the corresponding p-values, are summarized in Table 4.
Table 4 shows that the strength of the correlation between TI-SIC and FSFD variations varied according to both the region the sea ice that data was averaged over and the area over which the FSFD was averaged. Strongest correlations were obtained when TI-SIC variations averaged over the sea northeast of Svalbard were correlated with FSFD variations averaged over Nordaustlandet. Furthermore, this maximum correlation (r = 0.69, p = 0.002) was achieved when SIC had been integrated over the entire period investigated (1 September to 30 June). The correlation between FSFD variations over Nordaustlandet and TI-SIC variations was significant for all four sea ice regions investigated. In contrast, using the time series of FSFD variations that had been averaged over Nordenskiöldland, representing the central parts of Svalbard, resulted in the weakest correlations with SIC variations regardless of the region of sea ice investigated. For Edgeøya, in the southeast of the archipelago, we note that the correlation between FSFD and TI-SIC was weaker but was greatest when using SIC averaged over the sea region east Svalbard. It is interesting to note that the maximum correlation between FSFD variations on Edgeøya with three of the sea ice regions (northeast, east, all of Svalbard) was obtained when SIC had been integrated from 1 September to mid-October (not shown) and not over the entire period (which was the case for Nordaustlandet). Correlation coefficients obtained for the land-averaged FSFD variations were somewhat weaker compared with those obtained for FSFD variations on Nordaustlandet only but were nevertheless greater than the correlation using FSFD variations averaged only over Edgeøya and Nordenskiöld Land.
Figure 14a shows the time series of the correlation coefficients that were obtained when correlating the detrended time series of TI-SIC for the four sea regions with FSFD variations for Nordaustlandet, where the strongest correlations with TI-SIC variations were obtained. For reference, the detrended time series of TI-SIC at DOY 180 for Northeast Svalbard, which produced maximum correlation, is shown together with the detrended time series of FSFD in Figure 14b. What is common for all sea regions is that the correlation with the FSFD variations continued to increase when the integration period was extended beyond April, which coincides with the declining phase of SIC. Equivalent figures for FSFD on Edgeøya, Nordenskiöld Land and the land average are included in the Appendix A. Figure 15 shows the TIC-SIC variations for the sea region Northeast Svalbard, which resulted in the greatest correlation together with the FSFD variations averaged over Nordaustlandet. Linear fits are shown for correlations that were significant at the 95% level.
4. Discussion
This study has utilized a 20-year MODIS Terra snow cover dataset to derive the snow cover fraction for the periglacial landscape of Svalbard. The time series of snow cover fraction has been used together with an algorithm that was previously developed for Northern Scandinavia [23] to estimate both the first snow-free day (FSFD) and last snow-free day (LSFD) for the nonglaciated areas on Svalbard. The FSFD estimates have been used as an indication of timing of snow disappearance for seasonal snow cover on Svalbard, from which we have studied its link to the timing of phenological processes, namely the start of the growing season, and its relationship to variations in sea ice concentration surrounding the archipelago. This section will address the main findings of each aspect of this work and discuss how they fit in with current knowledge.
4.1. Geographic Patterns of First and Last Snow-Free Days
For Svalbard as a whole, the average date of FSFD was found to be DOY 180 or 29 June, while the average date of minimum snow cover fraction for Svalbard as a whole was 8 August, with the average snow cover fraction on this date being 27.4%. Our results indicate that while the majority of the central and southern areas of Svalbard are completely snow-free on this date, there are nevertheless areas in the northernmost part of Spitsbergen and Nordaustlandet that remain partially snow covered, with >50% snow cover fraction for many years of the 20-year dataset, explaining why the average minimum snow cover fraction for the whole of Svalbard remains above zero. However, the time series of the land-averaged FSFD did not reveal any significant trend, which is in agreement with earlier modeling studies of seasonal snow disappearance on Svalbard [17,48]. On the other hand, studies of snow disappearance date over glaciated regions of Svalbard using QuikSCAT datasets have earlier reported on a general trend toward earlier snow disappearance [21], despite their time period of study being less than half that which was studied in this work.
The spatial patterns in FSFD trends indicated that predominantly western, southern, eastern and some central parts of Spitsbergen experience a trend toward earlier FSFD, while isolated areas furthest north on Spitsbergen and Nordaustlandet exhibit a trend of later snow disappearance over the two decades studied. These regional trends are in partial agreement with the results of Rotschky et al. [21], for scatterometer detection of snow melt onset over the glaciated parts of Svalbard, and Van Pelt et al. [17], where trends in snow disappearance date were mapped for both the periglacial and glaciated landscape of Svalbard. In the modeling results of Van Pelt et al. [17] for the period 1961–2012, a trend toward earlier snow disappearance of around −1 day per decade was obtained over western and central parts of Svalbard, while a trend toward later snow disappearance of up to 4 days decade−1 was found over northern and eastern parts of Svalbard. Thus, our results differ primarily over Edgeøya, in the east of the archipelago and over southern Spitsbergen. It may be noted that the spatial patterns of FSFD trends coincide qualitatively rather well with the spatial patterns of precipitation trends from modeling rather than the trends in warming [17], which may provide some insight into the factors that have greatest influence on the trends in snow disappearance. However, on a land-averaged basis, the date of snow disappearance derived from the MODIS dataset leads the average date of snow disappearance obtained from snowpack modeling [17] by approximately 10 days. This is most likely explained by the threshold used to define snow disappearance in this study, where snow cover fraction at the individual pixel level may still be up to 50% while being defined as snow-free.
Across the majority of Svalbard, the timing of snow onset in the autumn, or LSFD, is becoming later, with the land-averaged trend being +2.5 days decade−1, which was not significant (p > 0.05). These patterns in snow onset are also consistent with the earlier snowpack modeling results, where positive trends in snow onset date (i.e., later LSFD) were present over the entire archipelago. Earlier snow disappearance and later autumn snow onset resulted in an increase in the duration of the summer season for these areas and a corresponding reduction in the duration of winter. We found that the greatest changes in the duration of summer and winter occur on Edgeøya, where the increase in duration of summer was on average 5.6 days decade−1, while winter has become shorter by on average 7.1 days decade−1. In contrast, the smallest changes in duration of summer and winter are found in the furthest north of the archipelago, where the trend in summer duration averaged over Nordaustlandet was found to be only +1.4 days decade−1, while the duration of winter changed by only +0.6 days decade−1.
From the spatial patterns of trends in precipitation and temperature over Svalbard, Van Pelt et al. [17] concluded that the later disappearance of snow in the northern regions was to a greater extent controlled by trends of increased winter snowfall rather than spring snowmelt. Increased winter precipitation over the northeastern parts of Svalbard has been projected from regional climate model simulations [49] and has previously been suggested to be a likely driver of observed ice cap growth on Austfonna, an ice cap located on Nordaustlandet [32], whereby winter snow accumulation exceeds spring snow loss due to melting. Here, the increased winter precipitation was linked to sea ice decline in the adjacent Barents Sea and resulting increased moisture transport over Nordaustlandet. A decline in autumn Arctic sea ice extent has in many studies been linked to increased snowfall in Northern Europe during late autumn/early winter, as it provides an enhanced moisture source that increases the humidity of the Arctic air mass [50,51]. Whether increased winter precipitation over the northern parts of the archipelago can explain the trend toward later FSFD has not been ascertained in this study since we have not used meteorological data from these parts of the Svalbard. However, we have explored the topic of how the timing of FSFD is related to variations in sea ice concentration, which may provide deeper insight into whether this is the mechanism behind the observed spatial variations in FSFD trends across Svalbard, and this is dealt with in Section 4.2.
4.2. Link between FSFD and Sea Ice Concentration Variability
We have found a significant positive correlation between variations in the TI-SIC and FSFD, which are strongest when considering SIC over the sea to the northeast and east of Svalbard (c.f. Figure 13) and when correlating SIC that has been integrated over the entire winter/spring. Moreover, the strongest correlation was obtained when correlating TI-SIC variations with FSFD variations over Nordaustlandet, located in the northeastern corner of the archipelago. This result would indicate that proximity to the sea ice region may be important for sea ice variations to have an influence on the timing of snow disappearance on land, possibly by influencing the local/regional temperatures, since surface air temperatures in Svalbard are known to be sensitive to sea ice edge proximity [30]. Rotschky et al. [21], in their study of snowmelt over glaciated regions of Svalbard, also discussed that melt onset and duration were sensitive to interannual variations in the sea ice edge location, though no quantitative analysis of the link between sea ice and melt onset was presented. Our results also show that the strength of the correlation between TI-SIC variations and FSFD increase when SIC is integrated to later intervals following the start of April, which is typically the timing of maximum SIC. This suggests that SIC, during its declining phase after maximum (which is controlled by the rate of melting), becomes increasingly stronger linked to the timing of snow disappearance on Svalbard. Here, years with lower-than-average SIC were increasingly distinguished from years with above average SIC as the melting period progresses toward the end of spring, when snow disappears on Svalbard.
Terrestrial productivity on Svalbard is coupled to sea ice at the subregional/local scale through cold air advection from ice-covered ocean [44], and correlation between productivity and sea ice concentration has been observed to decrease with distance from the coast [6]. Since the onset of terrestrial productivity follows the timing of snow disappearance, it could be expected that the processes responsible for sea ice–terrestrial productivity coupling may also explain the observed relationship between sea ice and timing of snow disappearance. A recent study on the link between surface temperature, atmospheric circulation (AC) types and SIC in Svalbard found strongest correlations between SIC and anticyclonic AC types originating from the north and northeast during winter [12] which are associated with lowest air temperatures regardless of season. Coupled with earlier knowledge that air temperatures are influenced by proximity to sea ice [30], we therefore suggest that sea ice presence, allowing cold air masses of northerly origin to be advected onto surrounding land, would also result in lower air temperature and thereby preserve snow cover on land for longer than average. Snow cover itself also possesses high albedo, thereby maintaining lower air temperatures in regions close to ice through feedback effects and therefore hindering ice melt. This may explain why the correlation is also strongest between TI-SIC and FSFD on Nordaustlandet, which is situated closest to the region of highest SIC in the north and northeast of Svalbard. However, while the strong correlation between surface air temperature (SAT) and SIC for air masses originating from the north and east of Svalbard has earlier been reported [12], a very recent study on trends in SAT and sea ice extent (SIE) across Svalbard for 1980–2016 reports that correlation between SAT and SIE is greater when SIE time series lag SAT by one month compared with the opposite case when time series of SAT lag SIE by one month. This led the authors to conclude that sea ice is more prone to SAT forcing rather than SIE driving variations in SAT [46]. Hence, while it appears that sea ice presence can directly affect air temperatures on adjacent land masses and therefore influence when snow melts during the same season, the relationship between sea ice and air temperature is rather complex, with feedbacks going in both directions. One additional aspect of the effect of sea ice on timing of snow disappearance that we have not addressed in this current study is whether sea ice loss in the preceding spring season may have a link to the observed timing of snow disappearance the following year. This is a topic deserving of further study, since it is well known that sea ice loss during the warm months allows larger areas of open water to absorb more solar radiation, thereby creating a heat sink that later acts as a source of upward long-wave radiation which warms the lower troposphere during the following winter [3].
Earlier studies have linked September sea ice decline to increased moisture transport due to a greater area of open water and hence increased precipitation as snow during late autumn and winter [51,52,53]. An increase in autumn/winter snowfall due to this mechanism would produce a deeper snowpack, which would possibly require a longer interval to melt and hence a later-than-average FSFD. We note from our dataset that even though the correlation between FSFD and TI-SIC variations in September was not as great as that obtained from integrating SIC over the entire winter and spring, the correlation between FSFD and TI-SIC variations in the region northeast and east of Svalbard was both positive (~0.5) and significant (p-values of ~0.02–0.04), indicating that lower-than-average SIC is correlated with earlier-than-average FSFD and not later-than-average FSFD. Furthermore, we did not find a significant declining trend in the September-averaged sea ice concentrations for any of the four regions during this period (2000–2019) studied. Even though our results seem to suggest that there is, on average, a trend toward longer winters over the northern parts of Nordaustlandet, which is also the part of the archipelago most strongly correlated with TI-SIC variations, our results do not point to increased winter precipitation resulting from declining sea ice as an important contribution, though overall increases in precipitation over this part of the archipelago may well be explained by large-scale warming trends. However, since we have not utilized gridded precipitation data, and since the trends in winter duration are not significant, these conclusions remain nevertheless rather speculative.
4.3. Timing of Snow Disappearance and Its Effect on Phenology
The timing of snow disappearance is an important factor that determines the timing of greening and vegetation growth on Svalbard. We have combined our dataset for first snow-free day with a MODIS NDVI-based dataset for growing season onset [25] in order to quantify the relationship between timing of snow disappearance and the start of the growing season. Our results indicate that the mean difference, averaged over the period 2000–2016 for the vegetated part of Svalbard, is 12.4 ± 1.7 days, but there was a lack of trend in the land-averaged difference. In Adventdalen valley, close to Longyearbyen, the difference is mostly between three and four weeks. Cooper et al. [24] studied the average time from snow disappearance to green-up and flowering of 13 vascular species in Adventdalen and found large individual differences between the species, however with averages of 3 weeks to green-up and 5 weeks to flowering. This study works on an aggregate level, with 500 m pixel resolution, but our results are still in accordance with the earlier findings [24]. Furthermore, our results show that for areas with early snow disappearance, the length of time to GSO is longer than for areas with late snow disappearance (for example, in the north of the archipelago). This relationship has also been found for the timing of flowering [26] with respect to snow disappearance in North America. In addition to mapping the difference between snow disappearance and GSO for the entire archipelago, we have examined the influence of temperature on the observed variations in the length of time between snow disappearance and GSO. The northernmost site, Ny-Ålesund, with mean daily temperature of 4.4 °C, typically exhibited the smallest range in difference, varying from 5 days to 2.5 weeks, while the length of time at Longyearbyen was of the order 2 to 5 weeks, with a mean difference of approximately 4 weeks between snow disappearance and the date of GSO and lower mean daily temperature of 2.3 °C. The higher mean temperature at the more northerly latitude of Ny-Ålesund is explained by the later timing of snow disappearance, which is typically one month later than at Longyearbyen and is therefore associated with warmer daily temperatures during the period between snow disappearance and onset of the growth season. We also found a significant negative and linear relationship (r = −0.75, p < 0.05) between the length of time between snow disappearance and GSO and the mean daily temperature during this period, indicating the dependence of the GSO on the mean air temperatures following snow disappearance.
Potential implications of the trend toward earlier snow disappearance over large parts of the archipelago may include reduced productivity, since both timing of snowmelt as well as snowpack accumulation is strongly linked to the levels of soil water storage and hence water availability during the growing season [54,55,56]. In addition, earlier snow disappearance can expose plants at a time of year when the air temperature is still low, which is known to lead to frost damage [26] and may result in slower rates of growth [29]. Moreover, a study of maximum NDVI (Normalized Difference Vegetation Index), which is an indicator of vegetation productivity, over central parts of Svalbard from 1986–2015 reported on a general greening trend which was linked to trends of increasing temperature over the study period [57]. However, it was shown that the rate of greening slowed during the second half of the study period, which has subsequently been attributed to more frequent occurrences of extreme winter warming events [58,59], but we do not rule out the possibility that the slower rates of greening since the start of the millennium may also have links to timing of spring snow disappearance, which can be affected by winter warming events through changes in the snowpack accumulation.
4.4. Comparison with Meteorological Data
One of the primary limitations of the method for estimating FSFD and LSFD implemented in this study was cloud cover presence in MODIS images, which introduced uncertainties on the order of 7 days based on the average number of days between cloud-free images for Svalbard as a whole. Using in-situ ground-based measurements of snow depth recorded at six meteorological stations, we found that there was a strong and positive correlation between the two estimates, but MODIS FSFD estimates were on average 12 days later than those obtained from snow depth measurements. A weaker but nevertheless significant positive correlation was also found for estimates of LSFD but with a bias indicating that MODIS estimates were on average 6 days earlier than those inferred from snow depth measurements. Due to the large differences in spatial area associated with the two types of estimate of FSFD and LSFD (point measurements vs. 500 m grid), it is unsurprising that there are discrepancies between the estimates. Further validation of the MODIS dataset is planned to follow this study, and we endeavor to combine multiple and complementary remote sensing snow cover datasets in order to carry out a more in-depth accuracy assessment and thereby identify potential improvements to the methodology outlined in this study.
5. Conclusions
This work has exploited a 20-year MODIS Terra dataset to derive snow cover fraction maps for the Svalbard archipelago from 2000–2019. From this product, we have estimated and mapped the first and last snow-free days as a proxy of snow disappearance and onset timing. For large parts of the archipelago, we found trends toward earlier FSFD and later LSFD, resulting in longer summer duration along with a corresponding decrease in the duration of winter. The exception to this trend was found at the northernmost end of the archipelago, where both snow disappearance and snow onset are trending toward later dates. Consequently, there were marginal increases of the order +1 day decade−1 in both the duration of summer and following winter for these areas. For the archipelago as a whole, we obtained decadal trends in FSFD and LSFD of −1.1 and +2.5 days decade−1, respectively, but in both cases the trends were not significant.
Furthermore, we have investigated the difference in date between snow disappearance and the timing of the phenological growing season. For the Svalbard archipelago as a whole, we found that the average difference between FSFD and GSO was 12.4 days; however, there were both significant regional and interannual variations. In areas with very early snow disappearance, the average time to onset of growth was much larger (>20 days) compared with areas with very late snow disappearance (<10 days). Using meteorological data recorded at Hornsund, Longyearbyen and Ny-Ålesund, we found a significant negative correlation between the length of the time to GSO and mean daily temperature recorded in the interval between snow disappearance and start of the GSO.
In the final part of this study, we conducted an analysis of the relationship between timing of snow disappearance and time-integrated sea ice concentration by correlating detrended time series of FSFD and TI-SIC for four different regions of sea ice and four land regions. A significant positive correlation between TI-SIC variations and FSFD variations was obtained when FSFD averaged over Nordaustlandet was correlated with TI-SIC variations that had been averaged over the sector to the northeast of the archipelago, indicating that proximity to sea ice allows the variations in TI-SIC to play an important role in regulating the regional climate and hence the timing of snow disappearance. Moreover, the correlation reached a maximum when SIC had been integrated over the whole period and exhibited an increasing trend during the melting phase after April. Our interpretation of these results is that the correlation becomes stronger when integrating to intervals after maximum SIC because years of lower-than-average SIC become more strongly distinguished from years of greater-than-average SIC and hence variations in the time-integrated product follow more closely the interannual variations exhibited by timing of snow disappearance. Since we have not made use of gridded temperature and precipitation data in this study, it has not been possible to establish whether there is a connection between sea ice concentration, winter precipitation and timing of spring snow disappearance; however, this will be one of the future goals of a follow-up study.
The results of this paper will be expanded upon in the ESA Cryosphere Virtual Laboratory project using Open Scientific standards, with the main objective being to compare the MODIS snow cover dataset with a wide range of openly available datasets for Svalbard. As such, we aim to improve the temporal and spatial resolution of the current snow cover fraction dataset by investigating the possibilities of data fusion, especially for the MODIS snow cover product with other higher resolution datasets.
Author Contributions
Conceptualization, E.M. and H.V.; methodology, E.M. and H.V.; software, E.M. and H.V.; validation, E.M., H.V. and S.R.K.; formal analysis, H.V.; investigation, H.V; resources, E.M.; data curation, E.M., H.V. and S.R.K.; writing—original draft preparation, H.V and E.M.; writing – review and editing, H.V.; project administration, E.M.; funding acquisition, E.M. All authors have read and agreed to the published version of the manuscript.
Funding
This work was supported by the Research Council of Norway under the project Svalbard Integrated Arctic Earth Observing System—Infrastructure development of the Norwegian node (SIOS-InfraNor Project No. 269927). This project is partly funded by the Norwegian Space Agency (NoSA). The European Space Agency has also funded parts of the work through Cryosphere Virtual Laboratory (ESRIN/Contract 40000128808/19/I-NS).
Acknowledgments
MODIS Terra snow cover data were retrieved from NSCDC NASA DAAC: National Snow and Ice Data Center; meteorological data and sea ice maps were retrieved from the Norwegian Meteorological institute.
Conflicts of Interest
The authors declare no conflict of interest.
Appendix A
Figure A1.
Average number of cloud-free days per year.

Figure A2.
Mean number of days since the last cloud-free observation for (a) FSFD and (b) LSFD.

Figure A3.
(a) Correlation between TI-SIC and FSFD variations averaged over Edgeøya, calculated for SIC integrated from 1 September of the previous year, to each consecutive day of year until 30 June the following year, for the four sea ice regions (b). Time series of FSFD variations averaged over Edgeøya together with the time series of TI-SIC variations for the sea region East Svalbard that produced maximum correlation.

Figure A4.
As for Figure A3 but for FSFD variations over Nordenskiöld Land and TI-SIC for Northeast Svalbard.
Figure A4.
As for Figure A3 but for FSFD variations over Nordenskiöld Land and TI-SIC for Northeast Svalbard.

Figure A5.
As for Figure A3 but for FSFD variations averaged over the whole of Svalbard and TI-SIC for Northeast Svalbard.
Figure A5.
As for Figure A3 but for FSFD variations averaged over the whole of Svalbard and TI-SIC for Northeast Svalbard.

References
- Chylek, P.; Folland, C.K.; Lesins, G.; Dubey, M.K.; Wang, M. Arctic air temperature change amplification and the Atlantic multidecadal oscillation. Geophys. Res. Lett. 2009, 36, L14801. [Google Scholar] [CrossRef] [Green Version]
- Serreze, M.C.; Francis, J.A. The Arctic amplification debate. Clim. Chang. 2006, 76, 241–264. [Google Scholar] [CrossRef] [Green Version]
- Dai, A.; Luo, D.; Song, M.; Liu, J. Arctic amplification is caused by sea-ice loss under increasing CO2. Nat. Commun. 2019, 10, 121. [Google Scholar] [CrossRef] [PubMed] [Green Version]
- Screen, J.A.; Simmonds, I. The central role of diminishing sea ice in recent Arctic temperature amplification. Nature 2010, 464, 1334–1337. [Google Scholar] [CrossRef] [PubMed] [Green Version]
- Serreze, M.C.; Barrett, A.P.; Stroeve, J.C.; Kindig, D.M.; Holland, M.M. The emergence of surface-based Arctic amplification. Cryosphere 2009, 3, 11–19. [Google Scholar] [CrossRef] [Green Version]
- Dutrieux, L.P.; Bartholomeus, H.; Herold, M.; Verbesselt, J. Relationships between declining summer sea ice, increasing temperatures and changing vegetation in the Siberian Arctic tundra from MODIS time series (2000–11). Environ. Res. Lett. 2012, 7, 044028. [Google Scholar] [CrossRef] [Green Version]
- Comiso, J.C.; Parkinson, C.L.; Gersten, R.; Stock, L. Accelerated decline in the Arctic sea ice cover. Geophys. Res. Lett. 2008, 35, L01703. [Google Scholar] [CrossRef] [Green Version]
- Pithan, F.; Mauritsen, T. Arctic amplification dominated by temperature feedbacks in contemporary climate models. Nat. Geosci. 2014, 7, 181–184. [Google Scholar] [CrossRef]
- Onarheim, I.H.; Smedsrud, L.H.; Ingvaldsen, R.B.; Nilsen, F. Loss of sea ice during winter north of Svalbard. Tellus A Dyn. Meteorol. Oceanogr. 2014, 66, 23933. [Google Scholar] [CrossRef] [Green Version]
- Førland, E.J.; Benestad, R.; Hanssen-Bauer, I.; Haugen, J.E.; Skaugen, T.E. Temperature and Precipitation Development at Svalbard 1900–2100. Adv. Meteorol. 2011, 2011, 14. [Google Scholar] [CrossRef]
- Bintanja, R.; van der Linden, E. The changing seasonal climate in the Arctic. Sci. Rep. 2013, 3, 1556. [Google Scholar] [CrossRef] [Green Version]
- Isaksen, K.; Nordli, Ø.; Førland, E.J.; Łupikasza, E.; Eastwood, S.; Niedźwiedź, T. Recent warming on Spitsbergen - Influence of atmospheric circulation and sea ice cover. J. Geophys. Res. Atmos. 2016, 121, 11913–11931. [Google Scholar] [CrossRef]
- Hansen, B.B.; Aanes, R.; Herfindal, I.; Kohler, J.; Sæther, B.-E. Climate, icing, and wild arctic reindeer: Past relationships and future prospects. Ecology 2011, 92, 1917–1923. [Google Scholar] [CrossRef]
- Bintanja, R.; Andry, O. Towards a rain-dominated Arctic. Nat. Clim. Chang. 2017, 7, 263–267. [Google Scholar] [CrossRef]
- Peeters, B.; Pedersen, A.O.; Loe, L.E.; Isaksen, K.; Veiberg, V.; Stien, A.; Kohler, J.; Gallet, J.-C.; Aanes, R.; Hansen, B.B. Spatiotemporal patterns of rain-on-snow and basal ice in high Arctic Svalbard: Detection of a climate-cryosphere regime shift. Environ. Res. Lett. 2019, 14, 015002. [Google Scholar] [CrossRef]
- Hansen, B.B.; Isaksen, K.; Benestad, R.E.; Kohler, J.; Åshild, Ø.P.; Loe, L.E.; Coulson, S.J.; Larsen, J.O.; Varpe, Ø. Warmer and wetter winters: Characteristics and implications of an extreme weather event in the High Arctic. Environ. Res. Lett. 2014, 9, 114021. [Google Scholar] [CrossRef]
- Van Pelt, W.J.; Kohler, J.; Liston, G.E.; Hagen, J.O.; Luks, B.; Reijmer, C.H.; Pohjola, V.A. Multidecadal climate and seasonal snow conditions in Svalbard. J. Geophys. Res. Earth Surface 2016, 121, 2100–2117. [Google Scholar] [CrossRef]
- Osuch, M.; Wawrzyniak, T. Variations and changes in snow depth at meteorological stations Barentsburg and Hornsund (Spitsbergen). Ann. Glaciol. 2017, 58, 11–20. [Google Scholar] [CrossRef] [Green Version]
- Dietz, A.; Kuenzer, C.; Gessner, U.; Dech, S. Remote sensing of snow—A review of available methods. Int. J. Remote. Sens. 2011, 33, 4094–4134. [Google Scholar] [CrossRef]
- Nagler, T.; Rott, H. Retrieval of wet snow by means of multitemporal SAR data. IEEE Trans. Geosci. Remote. Sens. 2000, 38, 754–765. [Google Scholar] [CrossRef]
- Rotschky, G.; Schuler, T.V.; Haarpaintner, J.; Kohler, J.; Isaksson, E. Spatio-temporal variability of snowmelt across Svalbard during the period 2000—08 derived from QuikSCAT/SeaWinds scatterometry. Polar Res. 2011, 30, 5963. [Google Scholar] [CrossRef]
- Sharp, M.; Wang, L. A five-year record of summer melt on Eurasian Arctic Ice Caps. J. Clim. 2009, 22, 133–145. [Google Scholar] [CrossRef]
- Malnes, E.; Karlsen, S.R.; Johansen, B.; Bjerke, J.W.; Tømmervik, H. Snow season variability in a boreal-Arctic transition area monitored by MODIS data. Environ. Res. Lett. 2016, 11, 125005. [Google Scholar] [CrossRef] [Green Version]
- Cooper, E.J.; Dullinger, S.; Semenchuk, P. Late snowmelt delays plant development and results in lower reproductive success in the High Arctic. Plant Sci. 2011, 180, 157–167. [Google Scholar] [CrossRef] [Green Version]
- Karlsen, S.R.; Elvebakk, A.; Høgda, K.A.; Grydeland, T. Spatial and Temporal Variability in the Onset of the Growing Season on Svalbard, Arctic Norway—Measured by MODIS-NDVI Satellite Data. Remote Sens. 2014, 6, 8088–8106. [Google Scholar] [CrossRef] [Green Version]
- Inouye, D.W. Effects of climate change on phenology, frost damage, and floral abundance of montane wildflowers. Ecology 2008, 89, 353–362. [Google Scholar] [CrossRef] [Green Version]
- Wipf, S.; Stoeckli, V.; Bebi, P. Winter climate change in alpine tundra: Plant responses to changes in snow depth and snowmelt timing. Clim. Chang. 2009, 94, 105–121. [Google Scholar] [CrossRef] [Green Version]
- Bjerke, J.W.; Tømmervik, H.; Zielke, M.; Jørgensen, M. Impacts of snow season on ground-ice accumulation, soil frost and primary productivity in a grassland of sub-Arctic Norway. Environ. Res. Lett. 2015, 10, 095007. [Google Scholar] [CrossRef]
- Livensperger, C.; Steltzer, H.; Darrouzet-Nardi, A.; Sullivan, P.F.; Wallenstein, M.; Weintraub, M.N. Earlier snowmelt and warming lead to earlier but not necessarily more plant growth. AoB Plants 2016, 8, plw021. [Google Scholar] [CrossRef] [Green Version]
- Benestad, R.E.; Førland, E.J.; Hanssen-Bauer, I. Empirically downscaled temperature scenarios for Svalbard. Atmos. Sci. Lett. 2002, 3, 71–93. [Google Scholar] [CrossRef]
- Zhao, M.; Ramage, J.; Semmens, K.; Obleitner, F. Recent ice cap snowmelt in Russian High Arctic and anti-correlation with late summer sea ice extent. Environ. Res. Lett. 2014, 9, 045009. [Google Scholar] [CrossRef] [Green Version]
- Bamber, J.; Krabill, W.; Raper, V.; Dowdeswell, J. Anomalous recent growth of part of a large Arctic ice cap: Austfonna, Svalbard. Geophys. Res. Lett. 2004, 31, L12402. [Google Scholar] [CrossRef] [Green Version]
- Day, J.J.; Bamber, J.L.; Valdes, P.J.; Kohler, J. The impact of a seasonally ice free Arctic Ocean on the temperature, precipitation and surface mass balance of Svalbard. Cryosphere 2012, 6, 35–50. [Google Scholar] [CrossRef] [Green Version]
- Mori, M.; Watanabe, M.; Shiogama, H.; Inoue, J.; Kimoto, M. Robust Arctic sea-ice influence on the frequent Eurasian cold winters in past decades. Nat. Geosci. 2014, 7, 869–873. [Google Scholar] [CrossRef]
- Hall, D.K.; Riggs, G.A.; Salomonson, V.V.; DiGirolamo, N.E.; Bayr, K.J. MODIS snow-cover products. Remote Sens. Environ. 2002, 83, 181–194. [Google Scholar] [CrossRef] [Green Version]
- Salomonson, V.V.; Appel, I. Estimating fractional snow cover from MODIS using the normalized difference snow index. Remote Sens. Environ. 2004, 89, 351–360. [Google Scholar] [CrossRef]
- Johansen, B.; Karlsen, S.; Tømmervik, H. Vegetation mapping of Svalbard utilising Landsat TM/ETM data. Polar Rec. 2012, 48, 47–63. [Google Scholar] [CrossRef]
- Dietz, A.J.; Wohner, C.; & Kuenzer, C. European snow cover characteristics between 2000 and 2011 derived from improved MODIS daily snow cover products. Remote Sens. 2012, 4, 2432–2454. [Google Scholar] [CrossRef] [Green Version]
- Metsämäki, S.; Mattila, O.P.; Pulliainen, J.; Niemi, K.; Luojus, K.; Böttcher, K. An optical reflectance model-based method for fractional snow cover mapping applicable to continental scale. Remote. Sens. Environ. 2012, 123, 508–521. [Google Scholar] [CrossRef]
- Svalbard Integrated Arctic Earth Observing System. Available online: https://sios-svalbard.org (accessed on 20 February 2020).
- Cornillon, P. OPeNDAP: Accessing data in a distributed, heterogeneous environment. Data Sci. J. 2003, 2, 164–174. [Google Scholar] [CrossRef] [Green Version]
- Cryosphere Virtual Lab. Available online: https://cvl.eo.esa.int (accessed on 20 February 2020).
- Karlsen, S.R.; Anderson, H.; van der Wal, R.; Hansen, B. A new NDVI measure that overcomes data sparsity in cloud-covered regions predicts annual variation in ground-based estimates of high arctic plant productivity. Environ. Res. Lett. 2018, 13, 025011. [Google Scholar] [CrossRef]
- Macias-Fauria, M.; Karlsen, S.R.; Forbes, B.C. Disentangling the coupling between sea ice and tundra productivity in Svalbard. Sci. Rep. 2017, 7, 8586. [Google Scholar] [CrossRef] [PubMed] [Green Version]
- Zakhvatkina, N.; Smirnov, V.; Bychkova, I. Satellite SAR Data-based Sea Ice Classification: An Overview. Geosciences 2019, 9, 152. [Google Scholar] [CrossRef] [Green Version]
- Dahlke, S.; Hughes, N.E.; Wagner, P.M.; Gerland, S.; Wawrzyniak, T.; Ivanov, B.; Maturilli, M. The observed recent surface air temperature development across Svalbard and concurring footprints in local sea ice cover. Int. J. Climatol. 2020, 1–20. [Google Scholar] [CrossRef]
- MET Norway Thredds Service Ice Concentration [Data set]. Available online: http://thredds.met.no/thredds/catalog/arcticdata/met.no/iceChartSat/catalog.html (accessed on 20 February 2020).
- Van Pelt, W.; Pohjola, V.; Pettersson, R.; Marchenko, S.; Kohler, J.; Luks, B.; Hagen, J.O.; Schuler, T.V.; Dunse, T.; Noel, B.; et al. A long-term dataset of climatic mass balance, snow conditions, and runoff in Svalbard (1957–2018). Cryosphere 2019, 13, 2259–2280. [Google Scholar] [CrossRef] [Green Version]
- Hanssen-Bauer, I.; Førland, E.J.; Hisdal, H.; Mayer, S.; Sandø, A.B.; Sorteberg, A. Climate in Svalbard 2100—A Knowledge Base for Climate Adaptation; NCCS Report no. 1/2019; Norwegian Meteorological Institute: Oslo, Norway, 2018. [Google Scholar]
- Liu, J.P.; Curry, J.A.; Wang, H.; Song, M.; Horton, R.M. Impact of declining Arctic sea ice on winter snowfall. Proc. Natl. Acad. Sci. USA 2012, 109, 4074–4079. [Google Scholar] [CrossRef] [PubMed] [Green Version]
- Wegmann, M.; Orsolini, Y.; Vázquez, M.; Gimeno, L.; Nieto, R.; Bulygina, O.; Jaiser, R.; Handorf, D.; Rinke, A.; Dethloff, K.; et al. Arctic moisture source for Eurasian snow cover variations in autumn. Environ. Res. Lett. 2015, 10, 054015. [Google Scholar] [CrossRef] [Green Version]
- Cohen, J.L.; Furtado, J.C.; Barlow, M.A.; Alexeev, V.A.; Cherry, J.E. Arctic warming, increasing snow cover and widespread boreal winter cooling. Environ. Res. Lett. 2012, 7, 014007. [Google Scholar] [CrossRef]
- Park, H.; Walsh, J.; Kim, Y.; Nakai, T.; Ohata, T. The role of declining Arctic sea ice in recent decreasing Arctic snow depths. Polar Sci. 2012, 7, 174–187. [Google Scholar] [CrossRef] [Green Version]
- Potopová, V.; Boroneanţ, C.; Možný, M.; Soukup, J. Driving role of snow cover on soil moisture and drought development during the growing season in the Czech Republic. Int. J. Climatol. 2016, 36, 3741–3758. [Google Scholar] [CrossRef] [Green Version]
- Parida, B.R.; Buermann, W. Increasing summer drying in North American ecosystems in response to longer nonfrozen periods. Geophys. Res. Lett. 2014, 41, 5476–5483. [Google Scholar] [CrossRef]
- Barichivich, J.; Briffa, K.R.; Myneni, R.; Van Der Schrier, G.; Dorigo, W.; Tucker, C.J.; Osborn, T.J.; Melvin, T.M. Temperature and snow-mediated moisture controls of summer photosynthetic activity in Northern terrestrial ecosystems between 1982 and 2011. Remote Sens. 2014, 6, 1390–1431. [Google Scholar] [CrossRef] [Green Version]
- Vickers, H.; Høgda, K.A.; Solbø, S.; Karlsen, S.R.; Tømmervik, H.; Aanes, R.; Hansen, B.B. Changes in greening in the high Arctic: Insights from a 30 year AVHRR max NDVI dataset for Svalbard. Environ. Res. Lett. 2016, 11, 105004. [Google Scholar] [CrossRef]
- Treharne, R.; Bjerke, J.W.; Tømmervik, H.; Stendardi, L.; Phoenix, G.K. Arctic browning: Impacts of extreme climatic events on heathland ecosystem CO2 fluxes. Glob. Chang. Biol. 2019, 25, 489–503. [Google Scholar] [CrossRef] [Green Version]
- Phoenix, G.K.; Bjerke, J.W. Arctic browning: Extreme events and trends reversing arctic greening. Glob. Chang. Biol. 2016, 22, 2960–2962. [Google Scholar] [CrossRef]
Figure 1.
Location of the Svalbard archipelago showing the six meteorological sites where snow depth measurements are made. Areas with mean July (2000–2013) Normalized Difference Vegetation Index (NDVI) above 0.1 are labeled “vegetated areas”, extracted from Karlsen et al. [25].
Figure 1.
Location of the Svalbard archipelago showing the six meteorological sites where snow depth measurements are made. Areas with mean July (2000–2013) Normalized Difference Vegetation Index (NDVI) above 0.1 are labeled “vegetated areas”, extracted from Karlsen et al. [25].

Figure 2.
Overview of the research scheme and datasets and methods used in this study. Orange components refer to datasets, blue boxes indicate derived products and green boxes are end results.
Figure 2.
Overview of the research scheme and datasets and methods used in this study. Orange components refer to datasets, blue boxes indicate derived products and green boxes are end results.

Figure 3.
Example of the sea ice concentration around Svalbard on 5 March 2001. The yellow, pink and green colored boxes indicate the subregions of data that are averaged and correlated with the snow cover fraction dataset.
Figure 3.
Example of the sea ice concentration around Svalbard on 5 March 2001. The yellow, pink and green colored boxes indicate the subregions of data that are averaged and correlated with the snow cover fraction dataset.

Figure 4.
Total snow cover fraction over Svalbard as a function of months for all 20 snow seasons.

Figure 5.
(a) Number of years when snow cover fraction (SCF) >50% on 8 August and (b) average snow cover fraction at minimum snow cover 8 August (DOY 220) for 2000–2019.
Figure 5.
(a) Number of years when snow cover fraction (SCF) >50% on 8 August and (b) average snow cover fraction at minimum snow cover 8 August (DOY 220) for 2000–2019.

Figure 6.
Mean FSFD for 2000–2019.

Figure 7.
Figure showing the anomalies in first snow-free day compared with the mean first snow-free day over the period 2000–2019.
Figure 7.
Figure showing the anomalies in first snow-free day compared with the mean first snow-free day over the period 2000–2019.

Figure 8.
Trends in (a) first snow-free day (b) last snow-free day (c) length of summer and (d) length of winter between 2000 and 2019. Trends are given in days decade−1.
Figure 8.
Trends in (a) first snow-free day (b) last snow-free day (c) length of summer and (d) length of winter between 2000 and 2019. Trends are given in days decade−1.

Figure 9.
Comparison of the first (left) and last (right) snow-free day estimates derived from snow depth measurements made at the six observational sites listed in Table 1 and those derived from the Moderate Resolution Imaging Spectroradiometer (MODIS) snow cover fraction product. Both datasets have been filtered to exclude estimates during the polar night period (DOY > 306) where MODIS data are unavailable. The black line indicates where the estimates would be equal and the linear regression result is highlighted by the solid blue line.

Figure 10.
Mean difference between growing season onset and first snow-free day, averaged over 2000–2016.
Figure 10.
Mean difference between growing season onset and first snow-free day, averaged over 2000–2016.

Figure 11.
Scatterplot showing the relationship between first snow-free day and the average growing season onset (GSO) date. The mean growing season date for all years is indicated by the dashed line and the dashed-dot line indicates where first snow-free day would be equal to growing season onset.
Figure 11.
Scatterplot showing the relationship between first snow-free day and the average growing season onset (GSO) date. The mean growing season date for all years is indicated by the dashed line and the dashed-dot line indicates where first snow-free day would be equal to growing season onset.

Figure 12.
Relationship between mean daily temperature (in the period between snow disappearance and GSO), and the length of the time between snow disappearance and GSO calculated for Hornsund, Svea, Longyearbyen and Ny-Ålesund.
Figure 12.
Relationship between mean daily temperature (in the period between snow disappearance and GSO), and the length of the time between snow disappearance and GSO calculated for Hornsund, Svea, Longyearbyen and Ny-Ålesund.

Figure 13.
Sea ice concentration per DOY averaged over 19 years for subregions of the sea area around Svalbard as shown in Figure 4: (a) sea region northeast of Svalbard; (b) sea region east of Svalbard; (c) entire sea region around Svalbard; (d) sea region west of Svalbard. Solid lines indicate the average sea ice concentration (SIC), and the minimum and maximum SIC are shown by dashed lines.

Figure 14.
(a) Correlation between TI-SIC and FSFD variations averaged over Nordaustlandet, calculated for SIC integrated from 1 September of the previous year to each consecutive day of year until 30 June of the following year, for the four sea ice regions. The maximum correlation coefficients for each sea region and the associated p-values are stated in the legend. (b) Time series of the TI-SIC variations for the sea region northeast of Svalbard that produced maximum correlation with the time series of FSFD variations over Nordaustlandet.

Figure 15.
Scatterplots showing the relationship between detrended TI-SIC and FSFD variations averaged over Nordaustlandet, using the TI-SIC time series that gave the highest correlation with the detrended FSFD time series for the four sea ice regions (a) Northeast Svalbard (b) East Svalbard (c) All Svalbard and (d) West Svalbard. Values of maximum correlation (r) and p-values are stated in the legend. The day of year associated with maximum correlation between TI-SIC and FSFD is also stated.


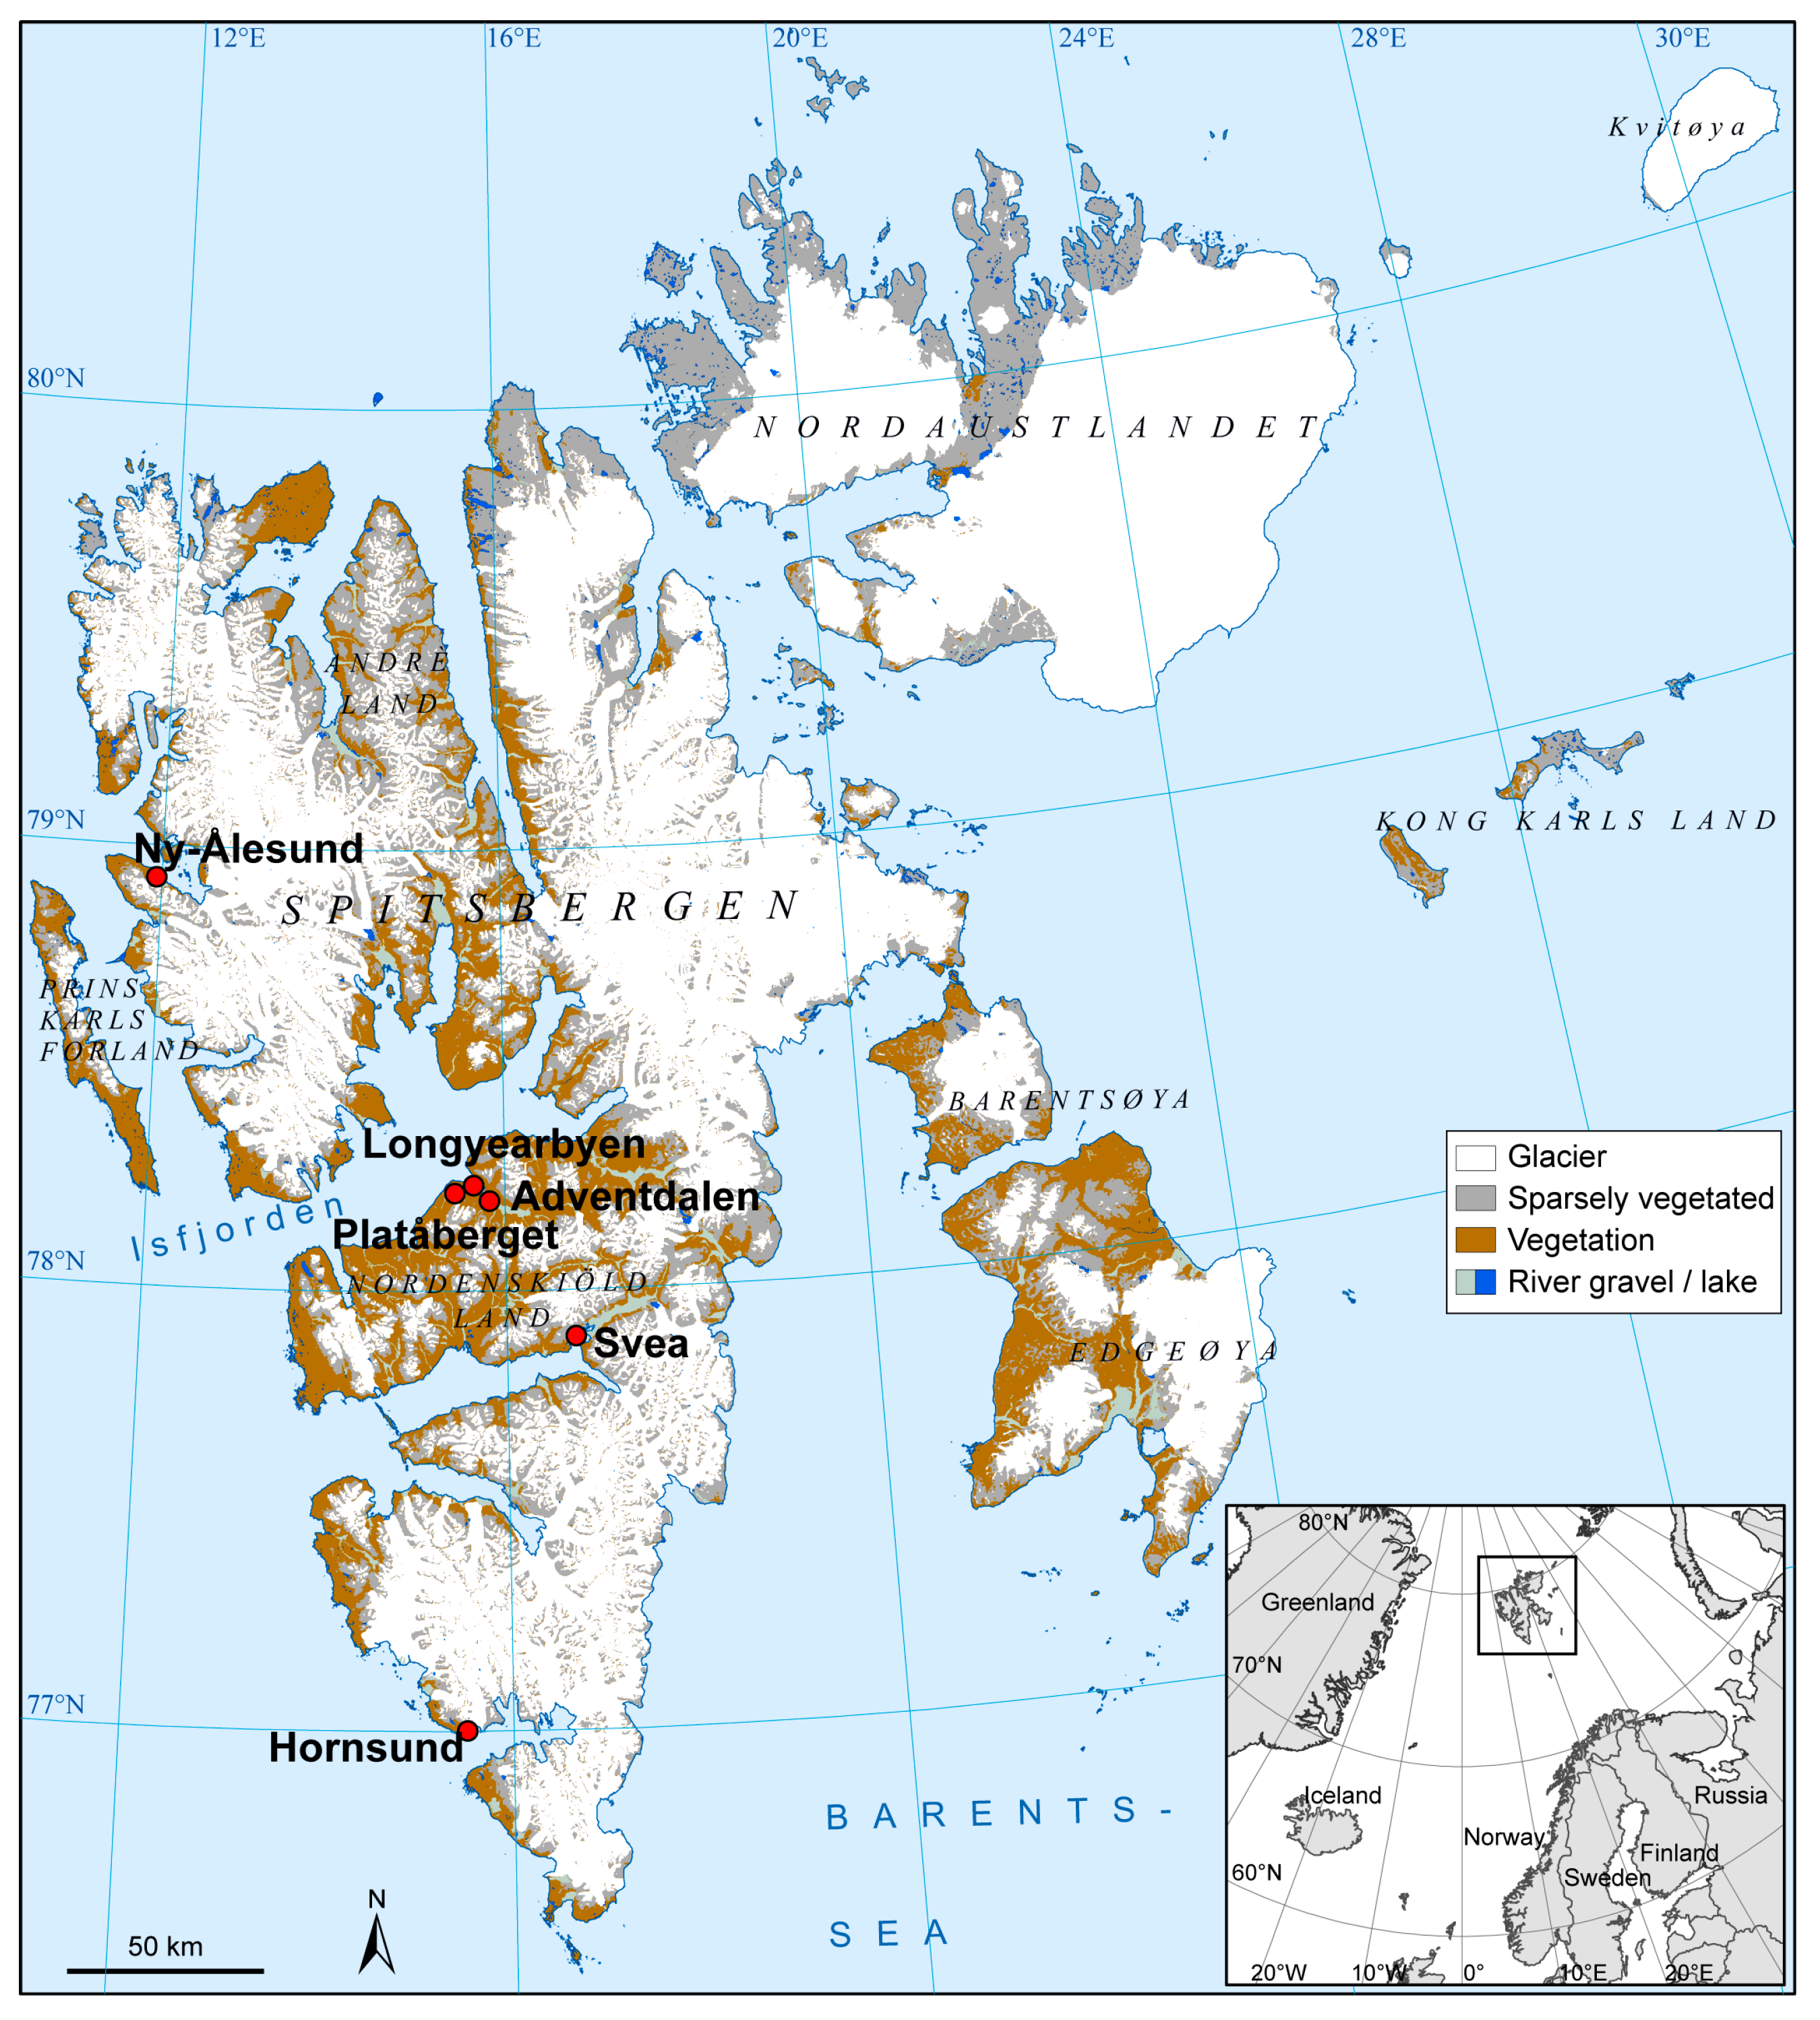
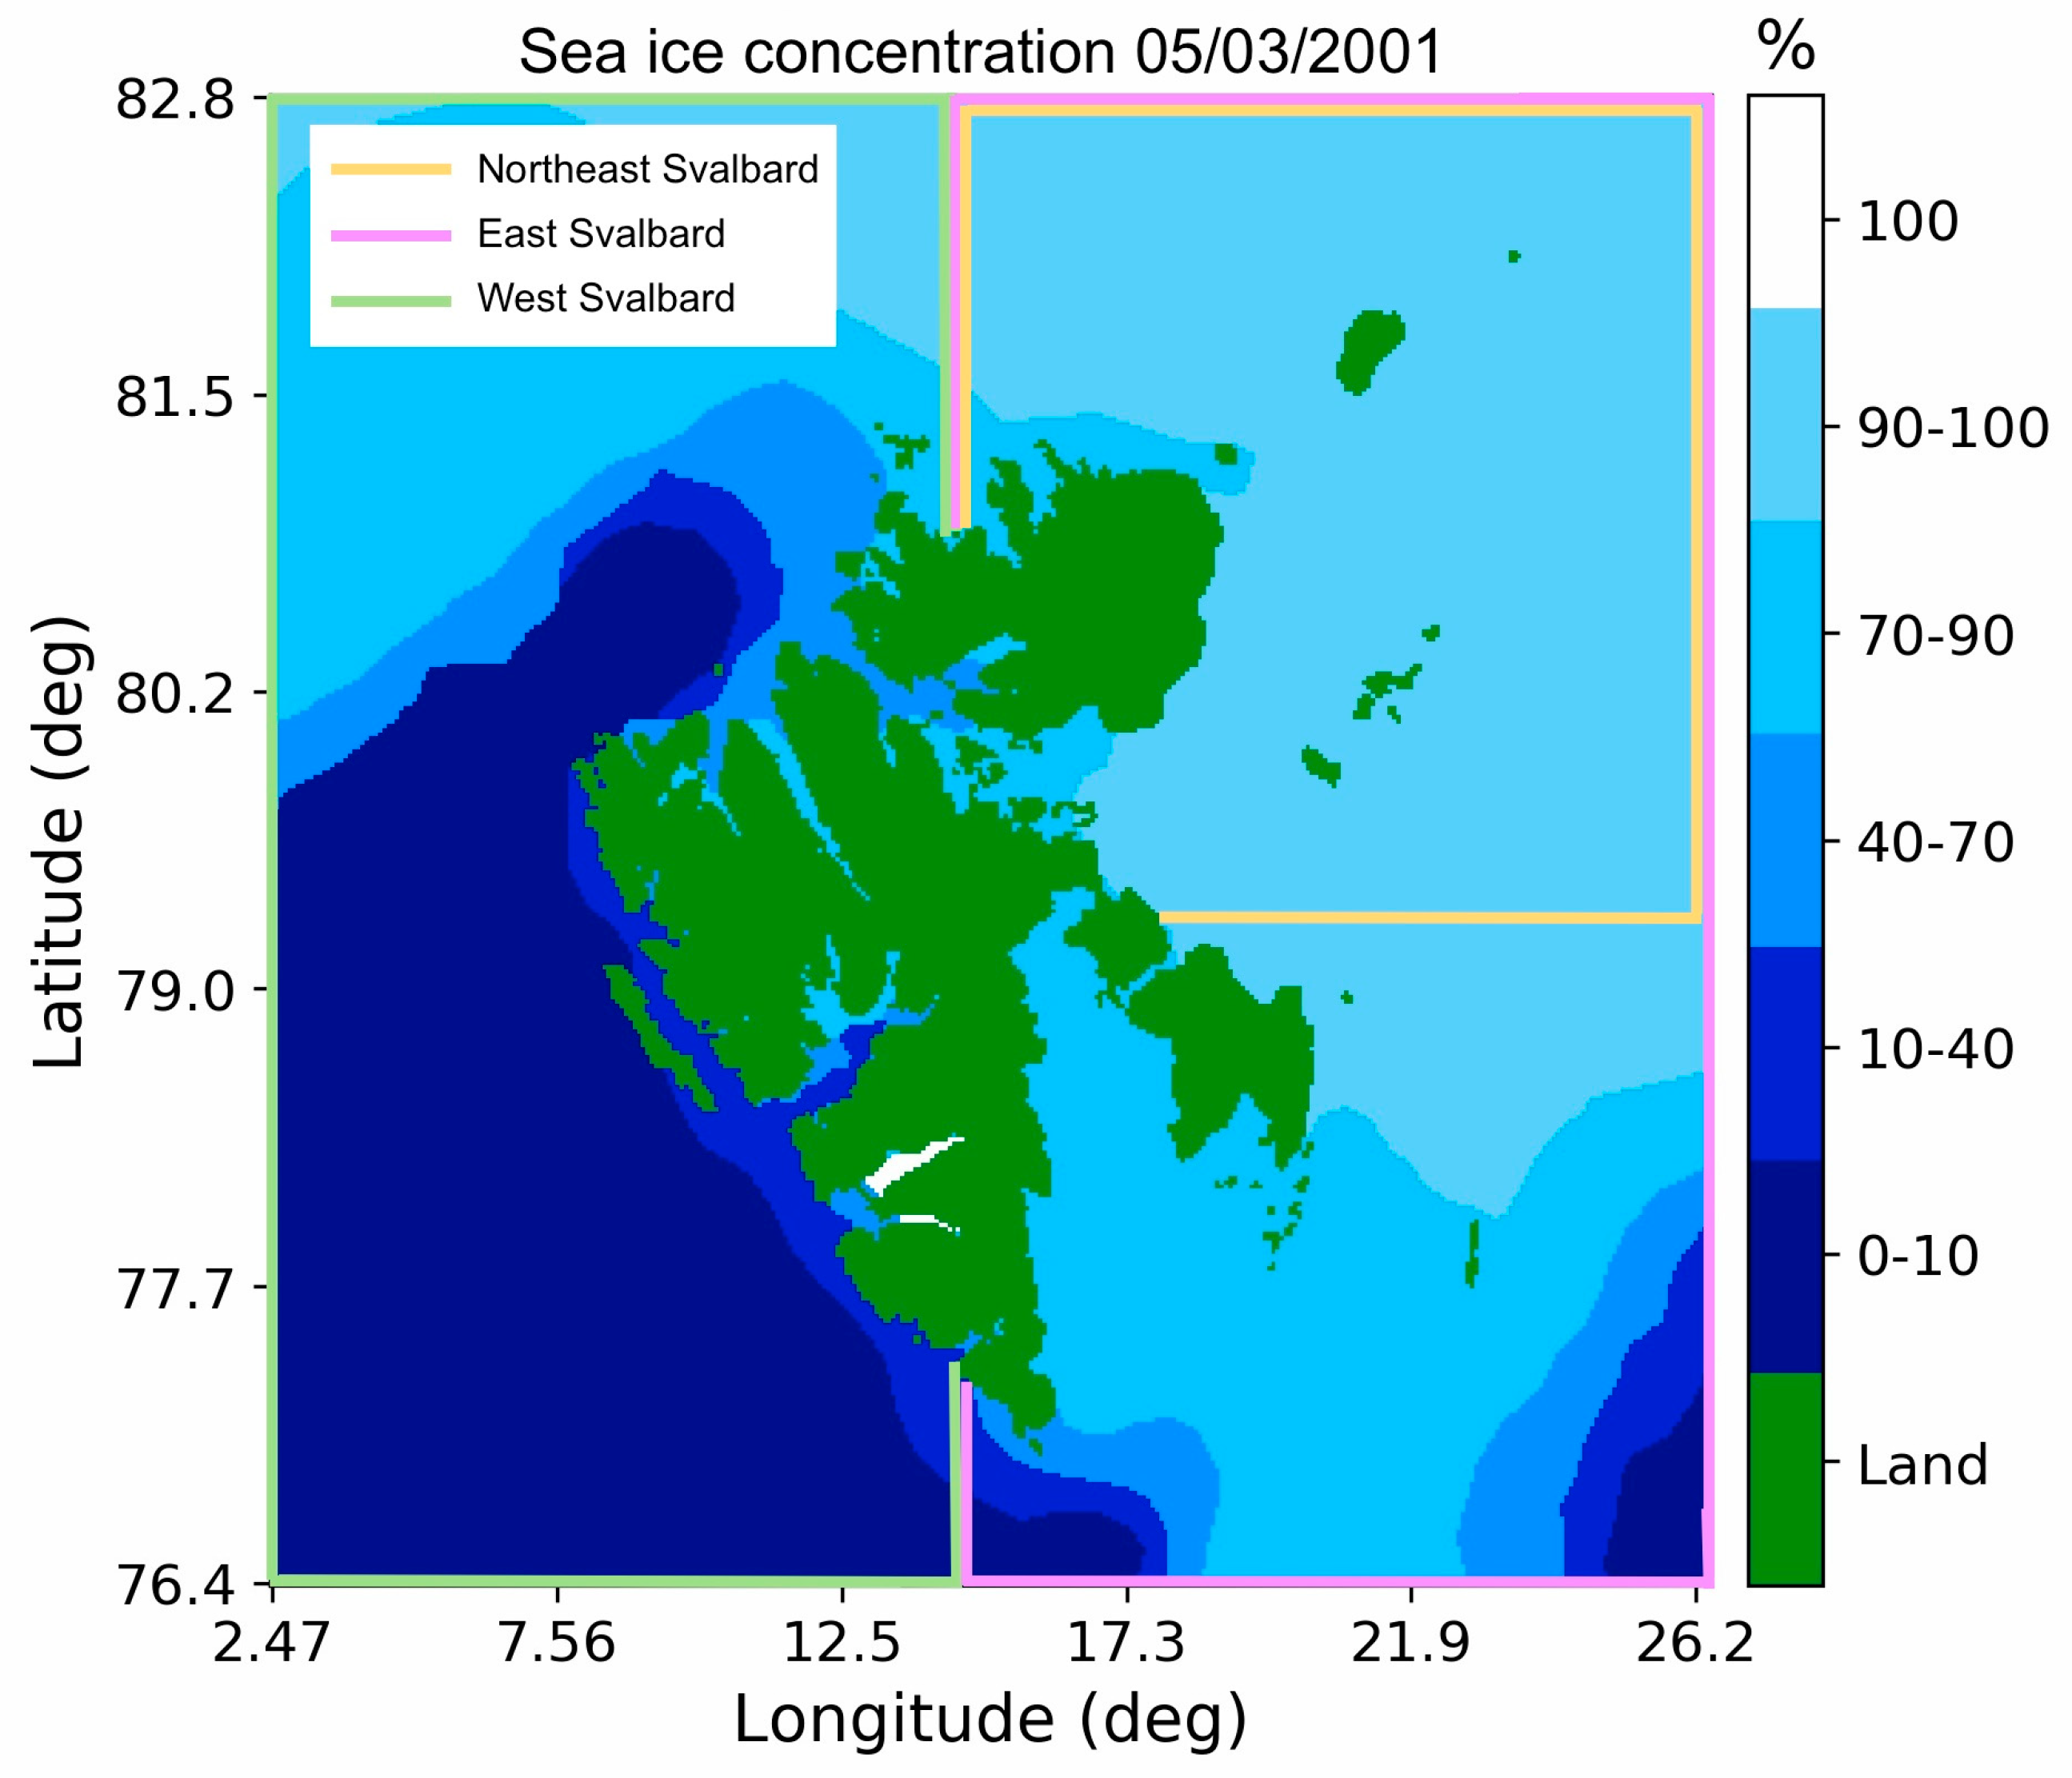
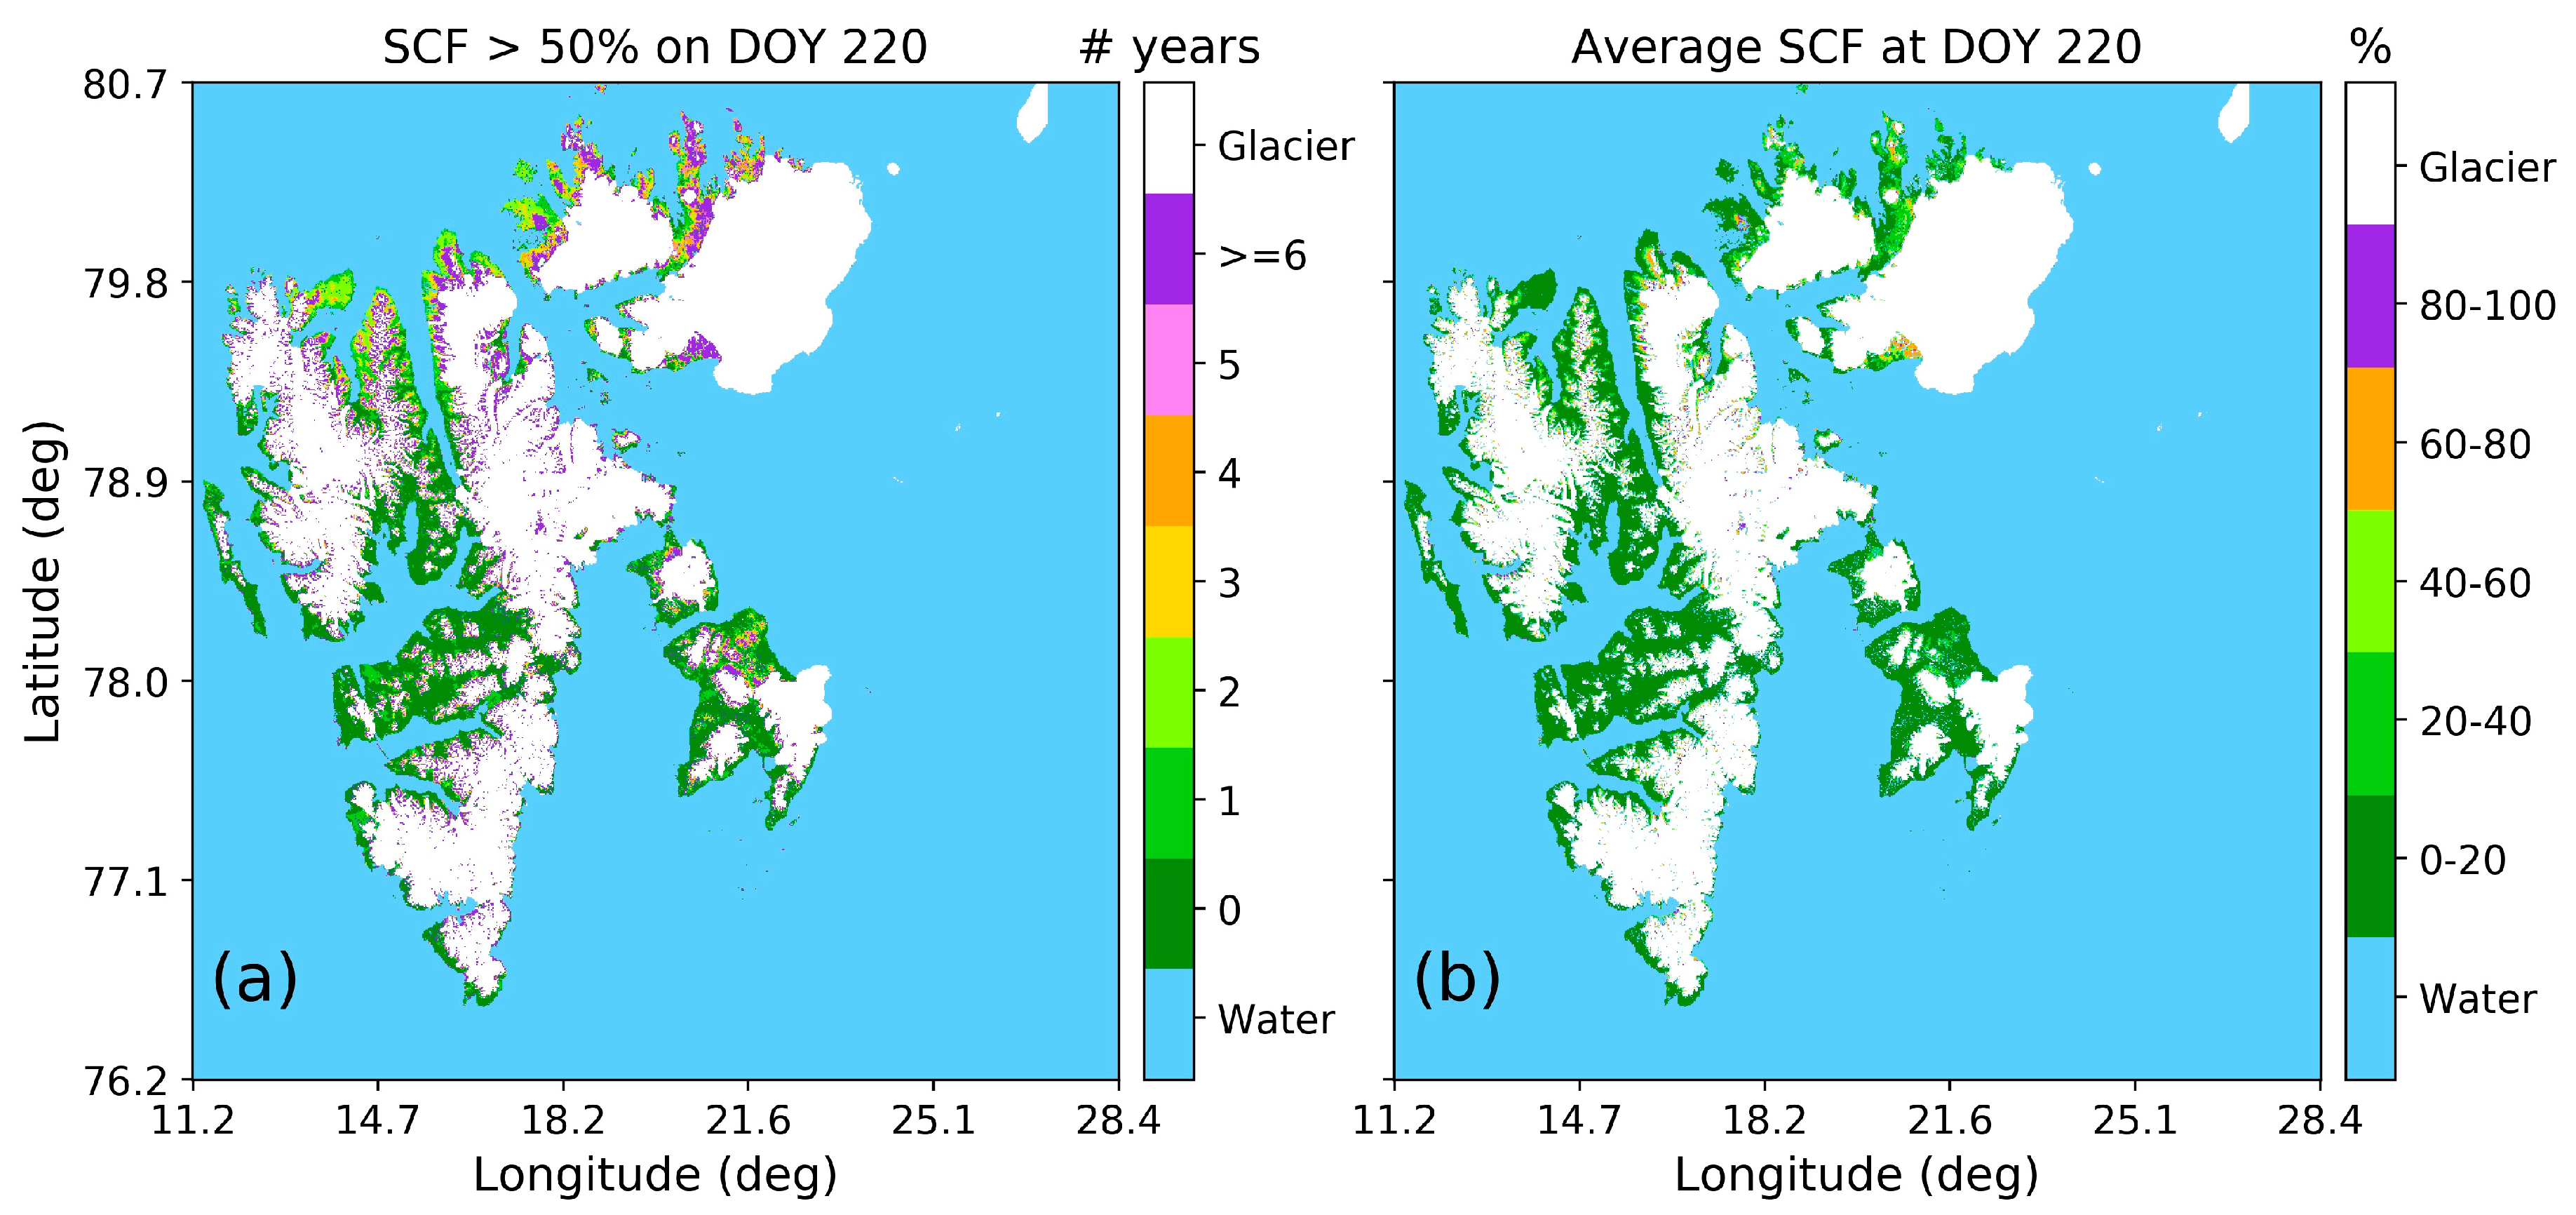
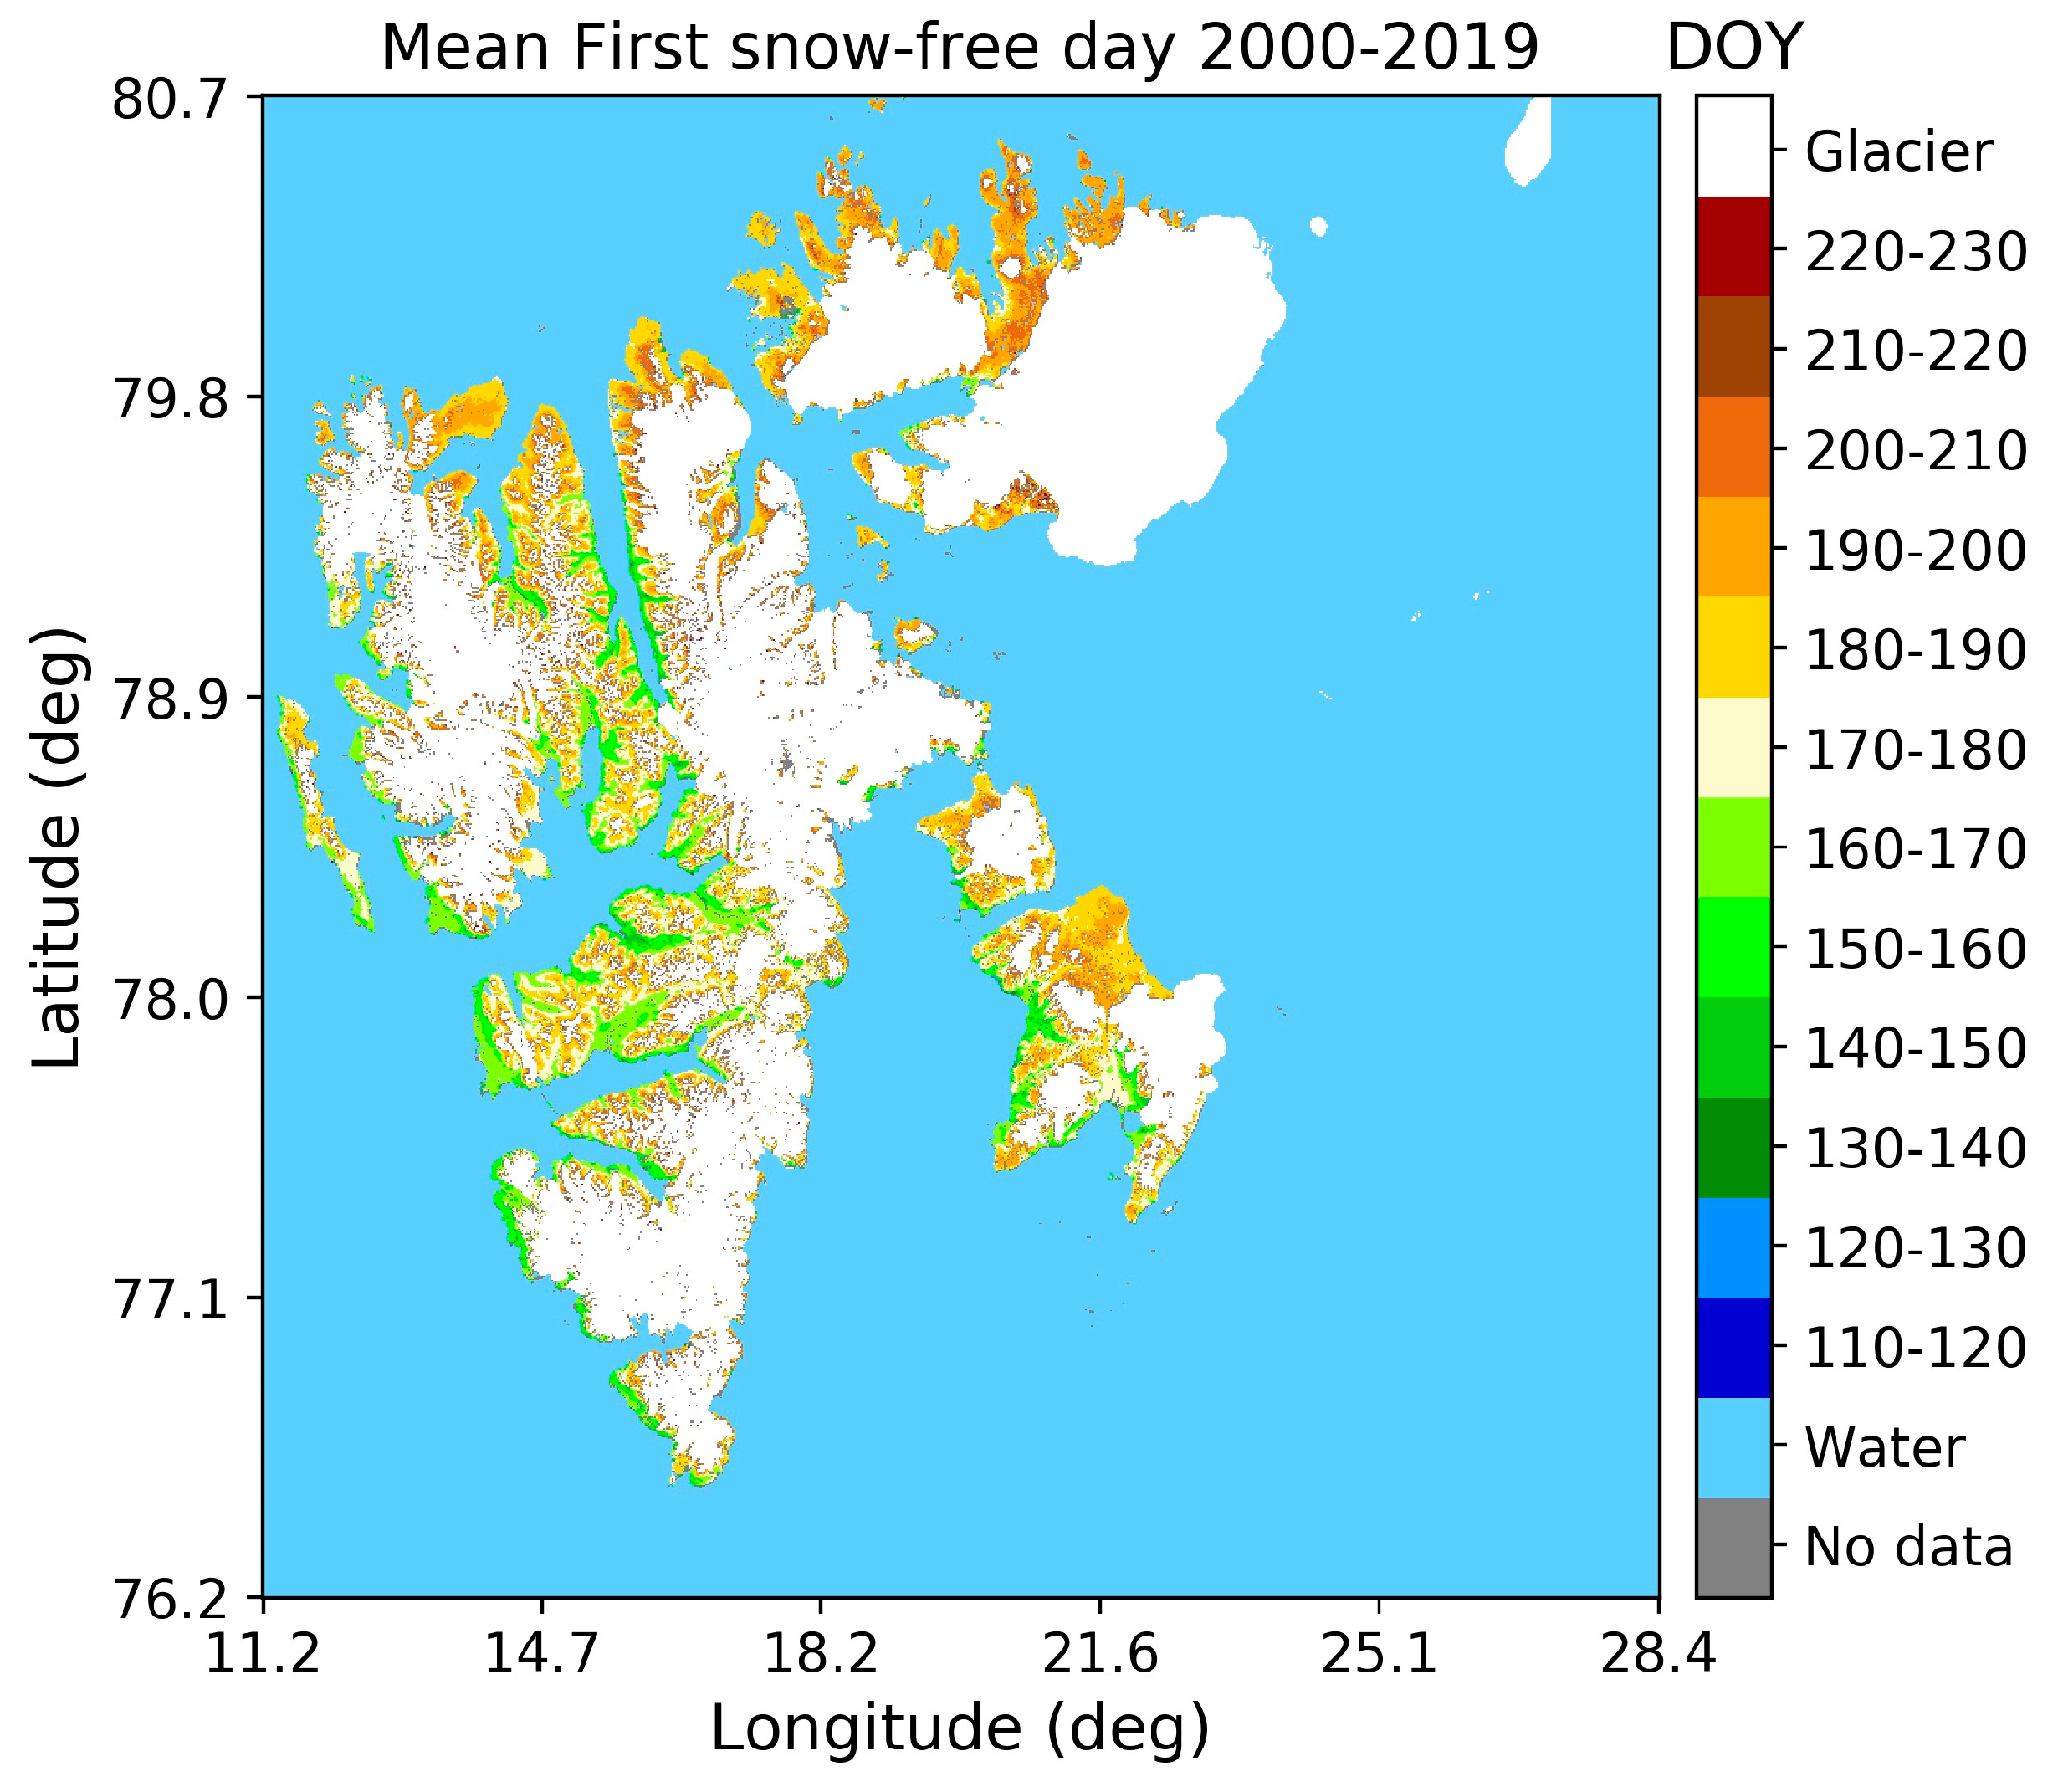
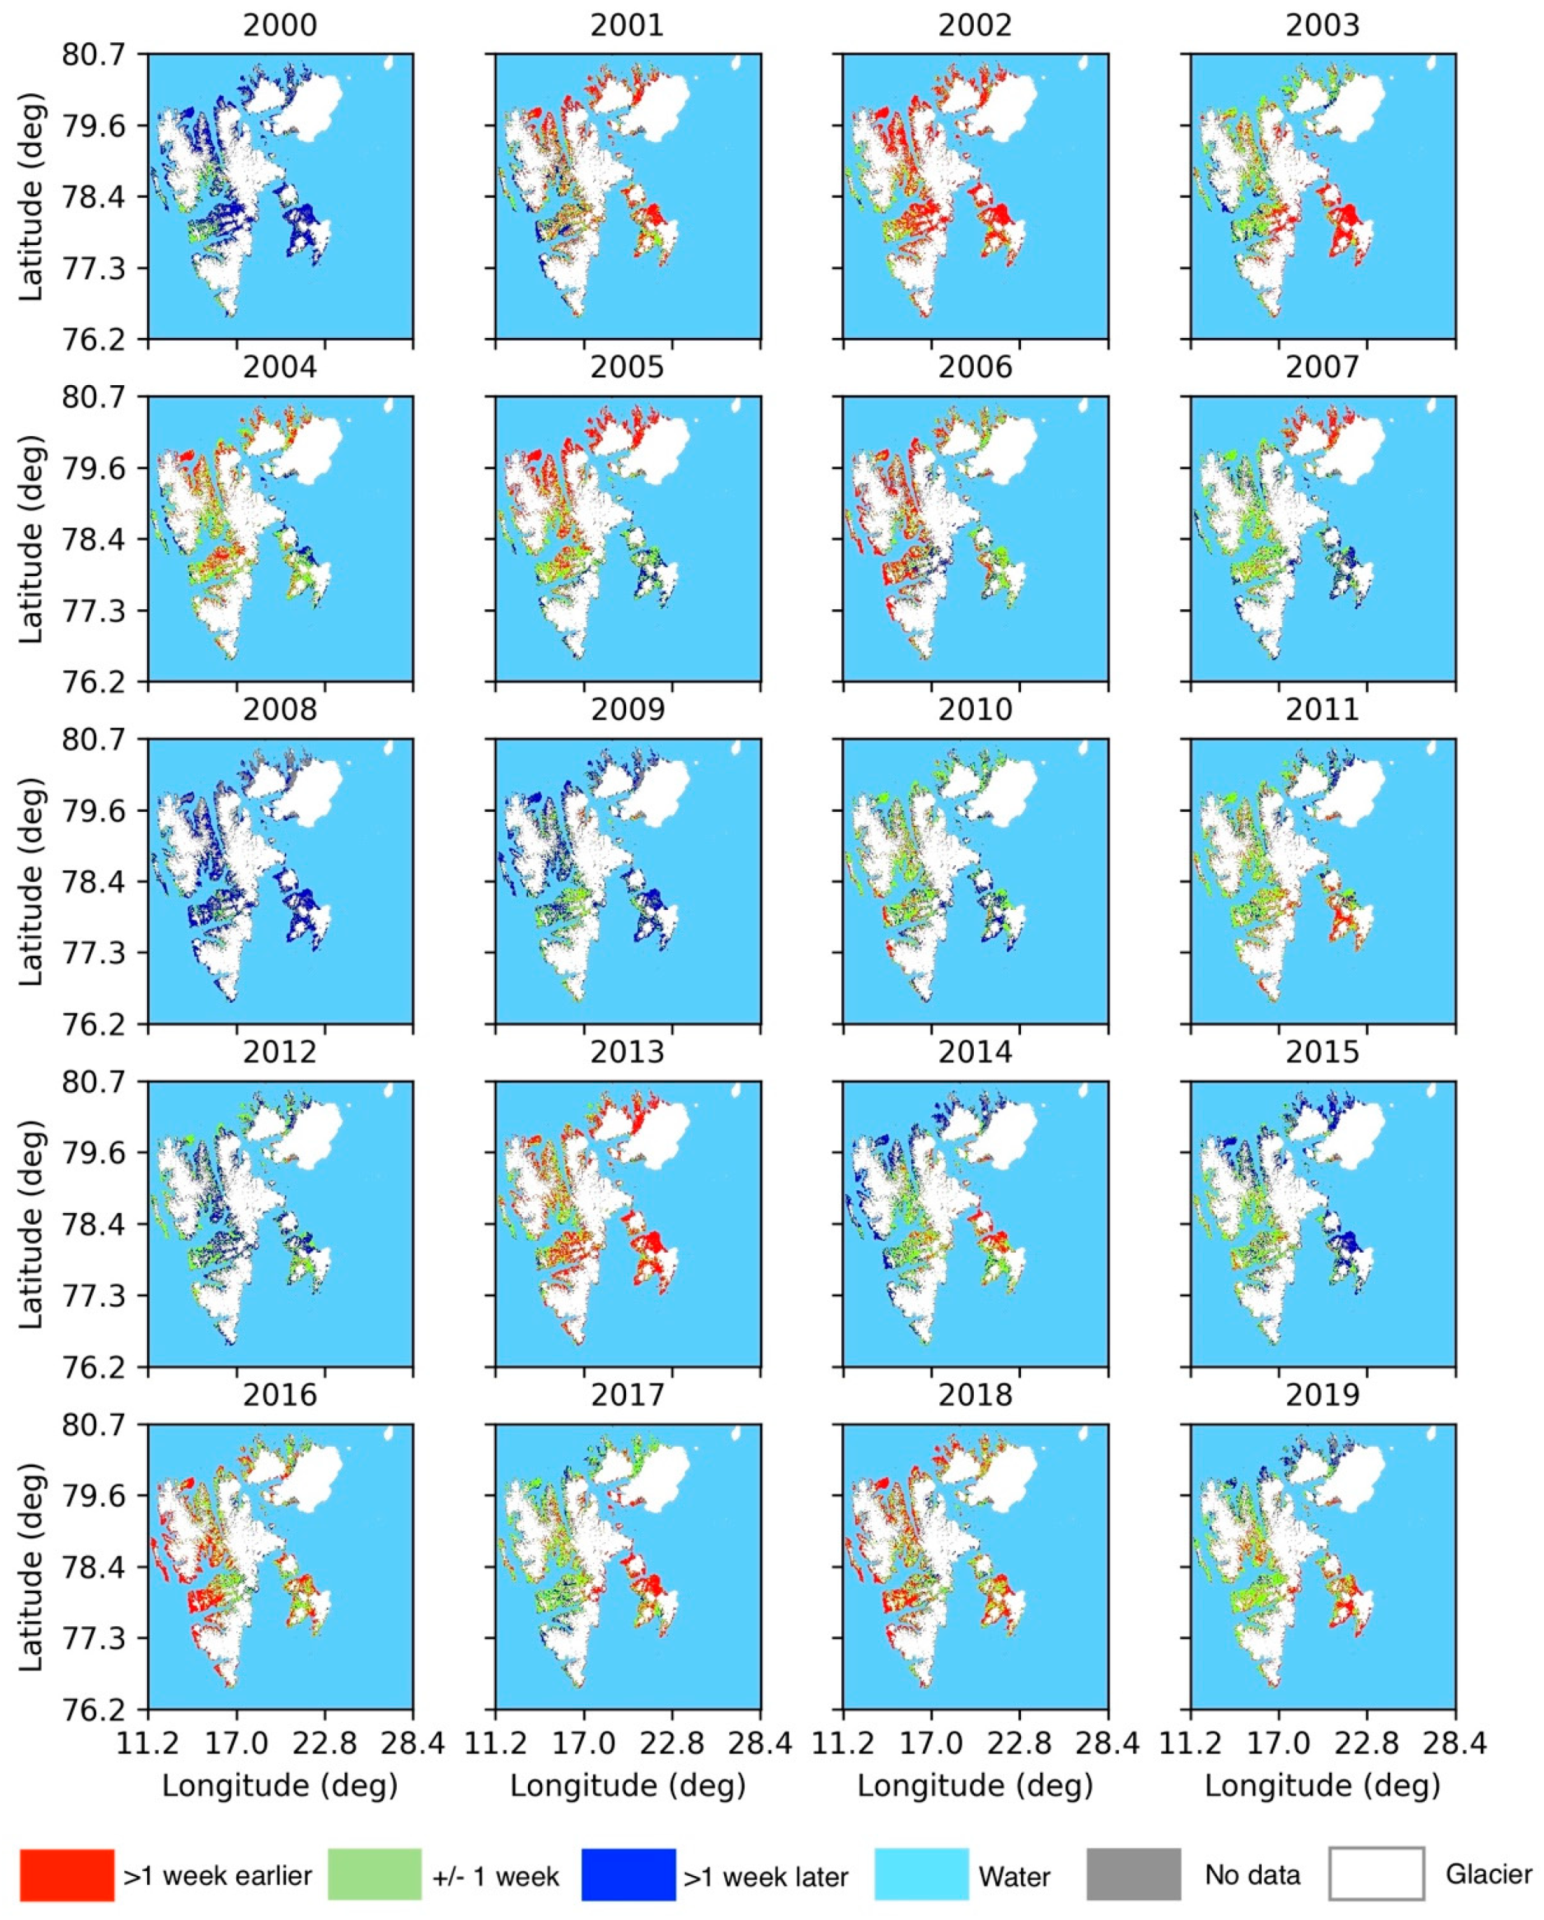
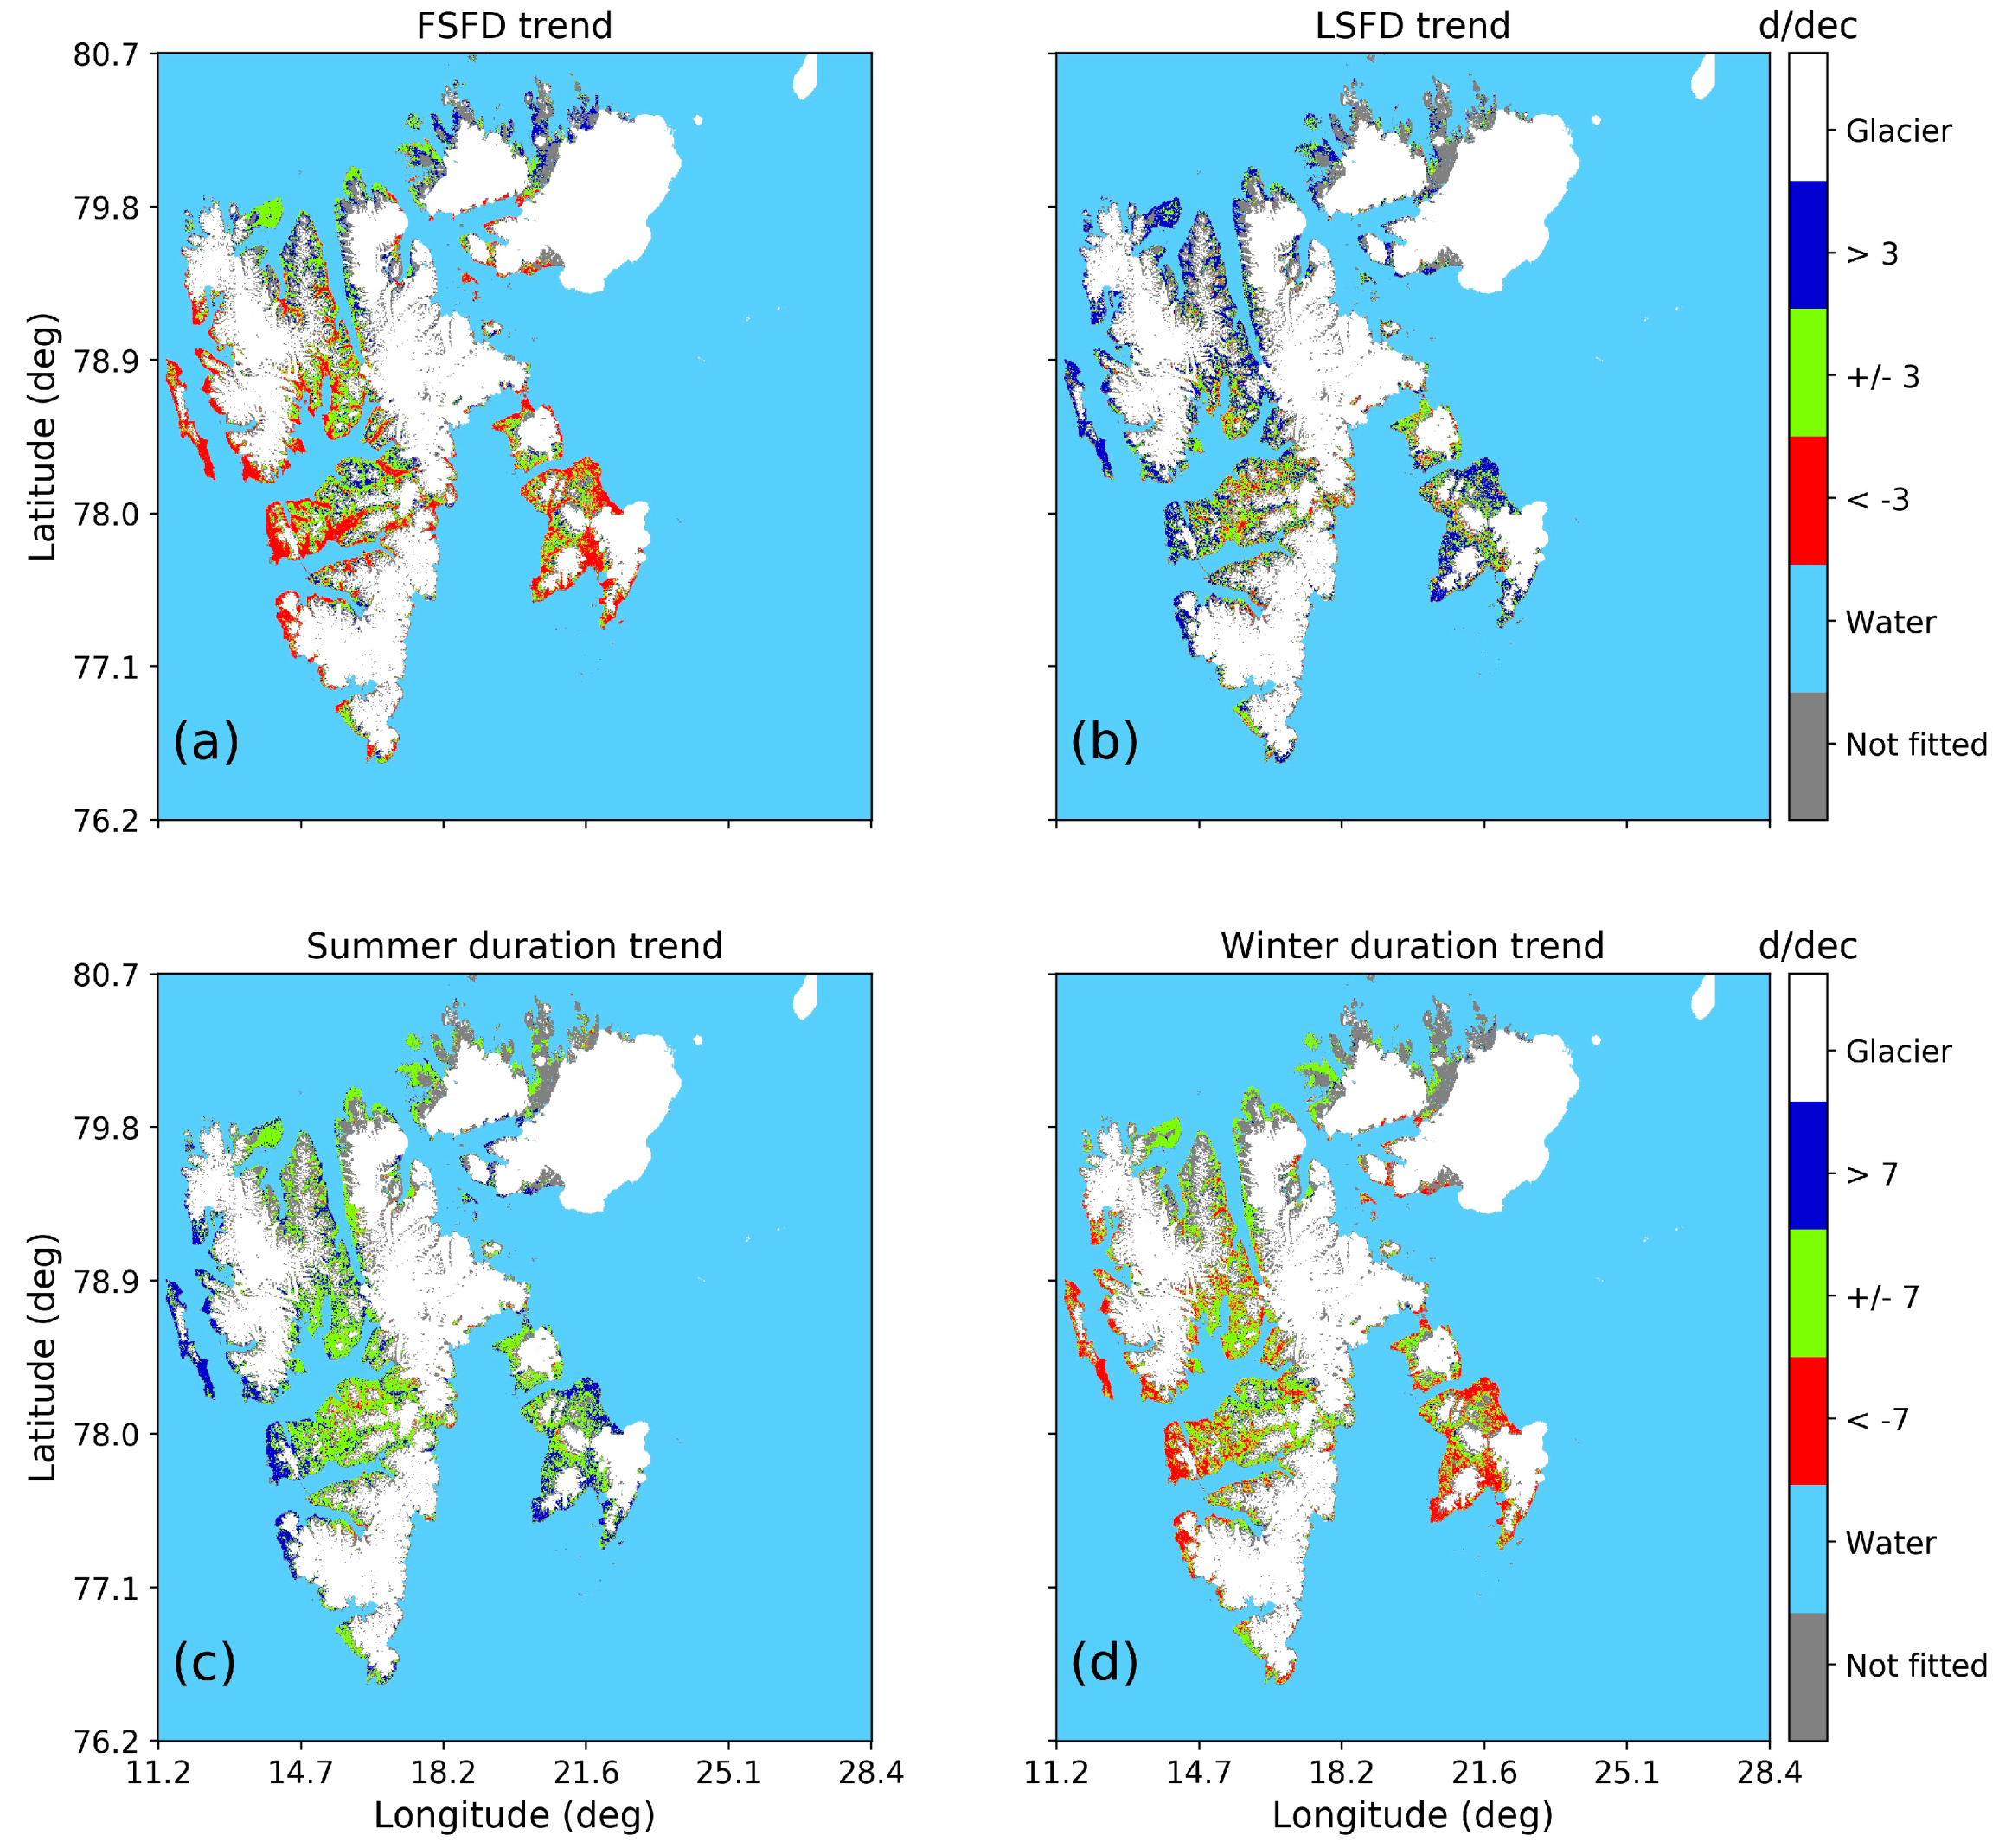
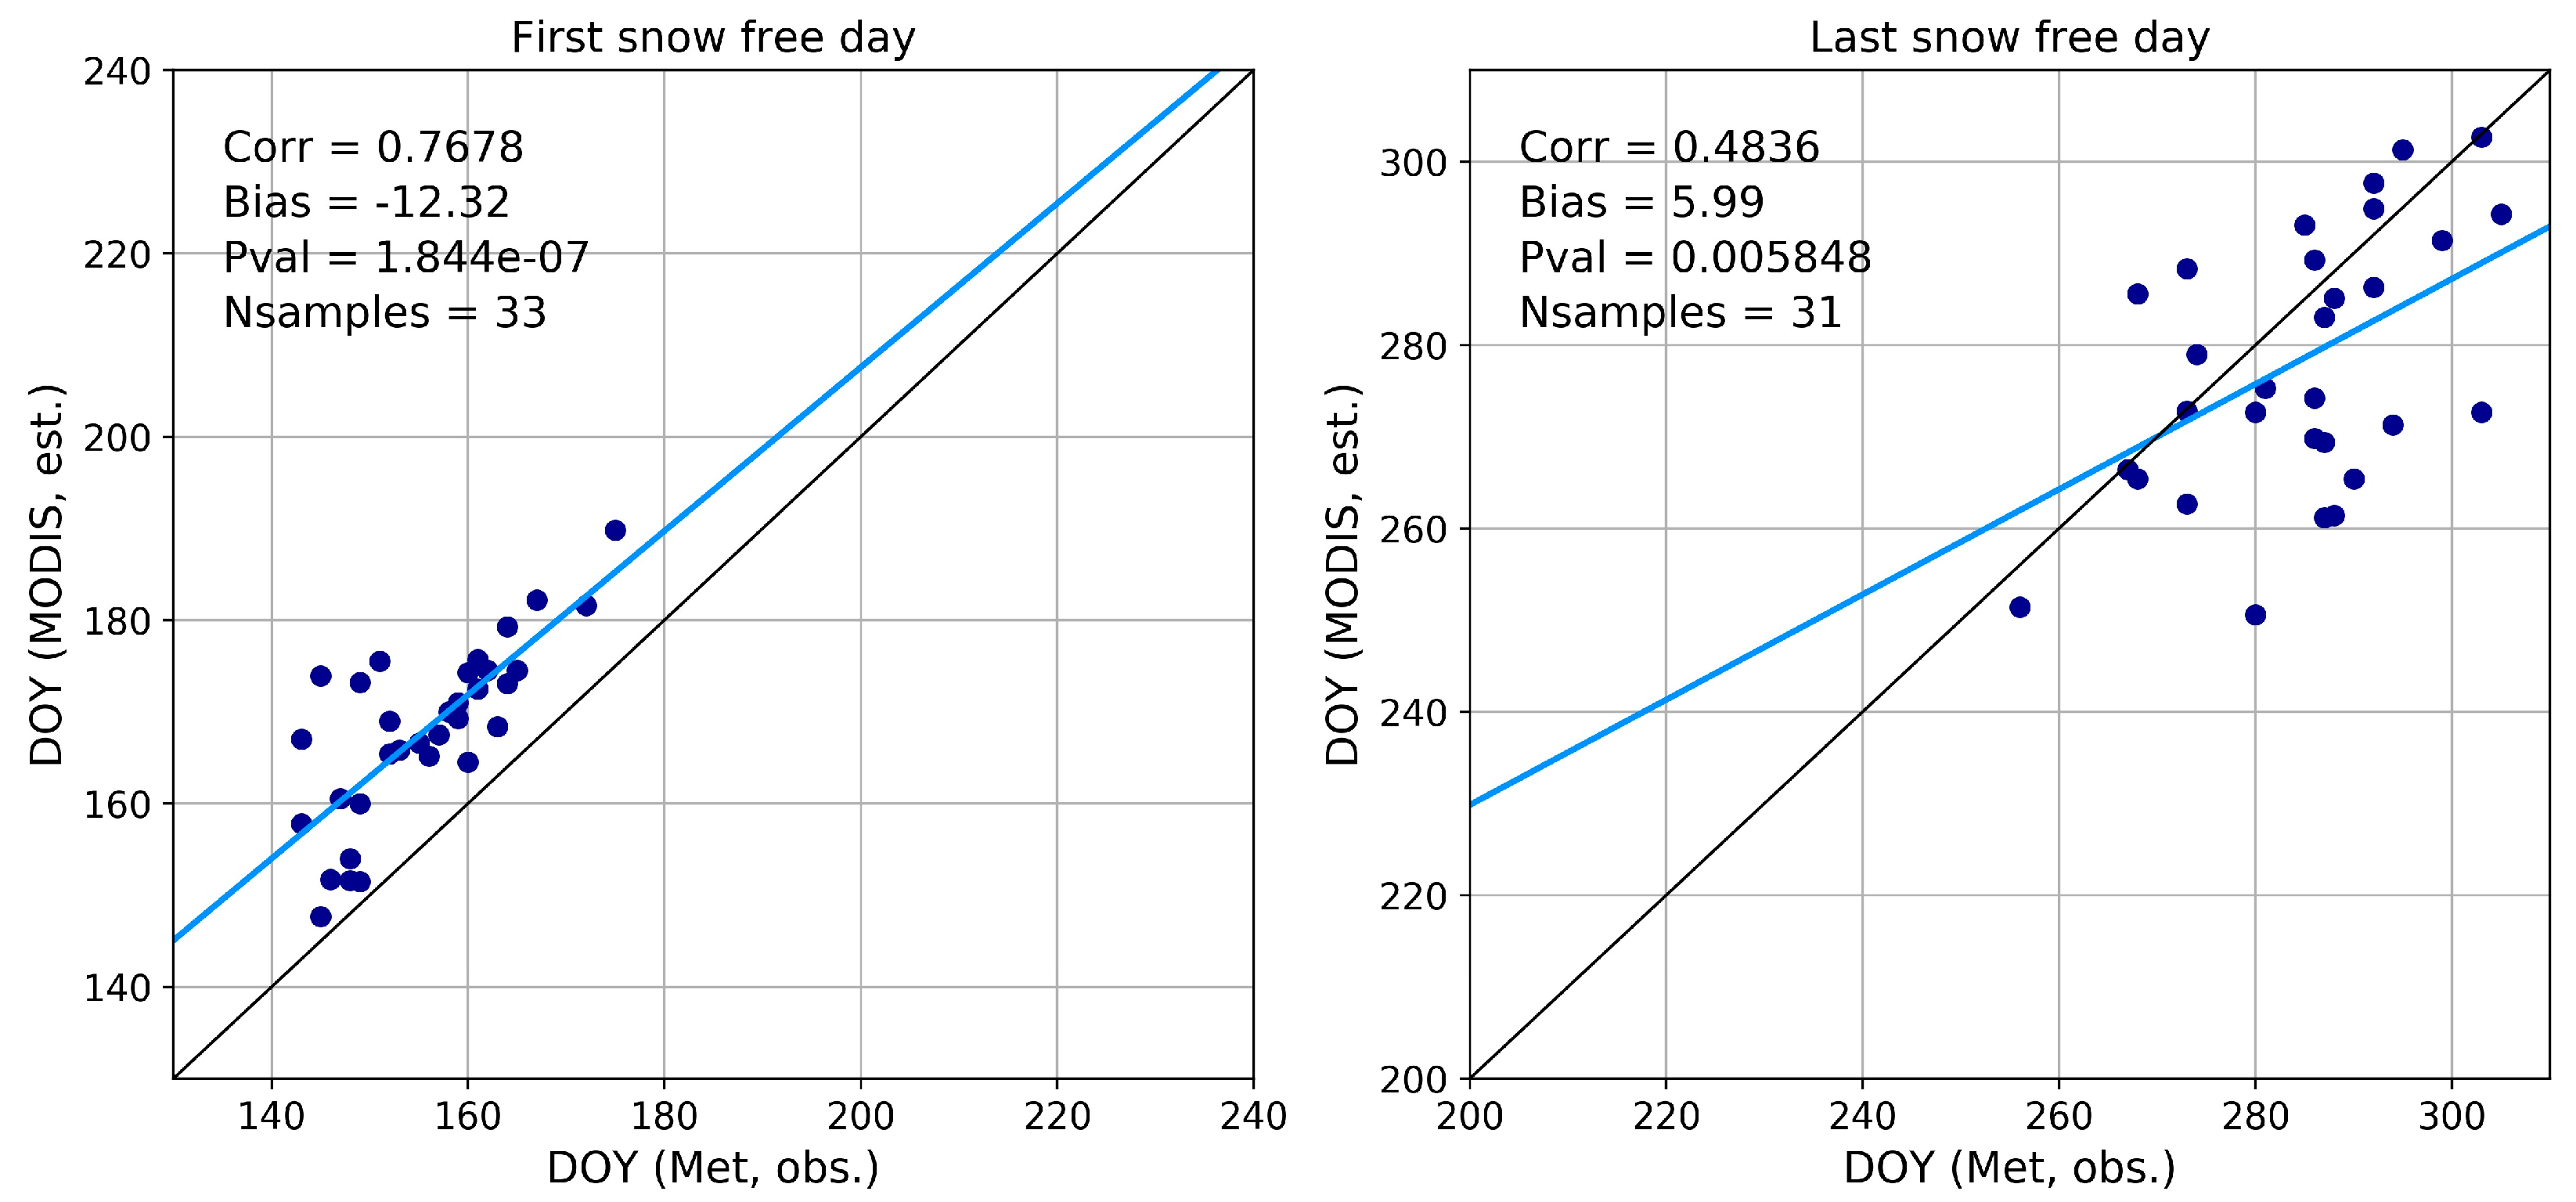
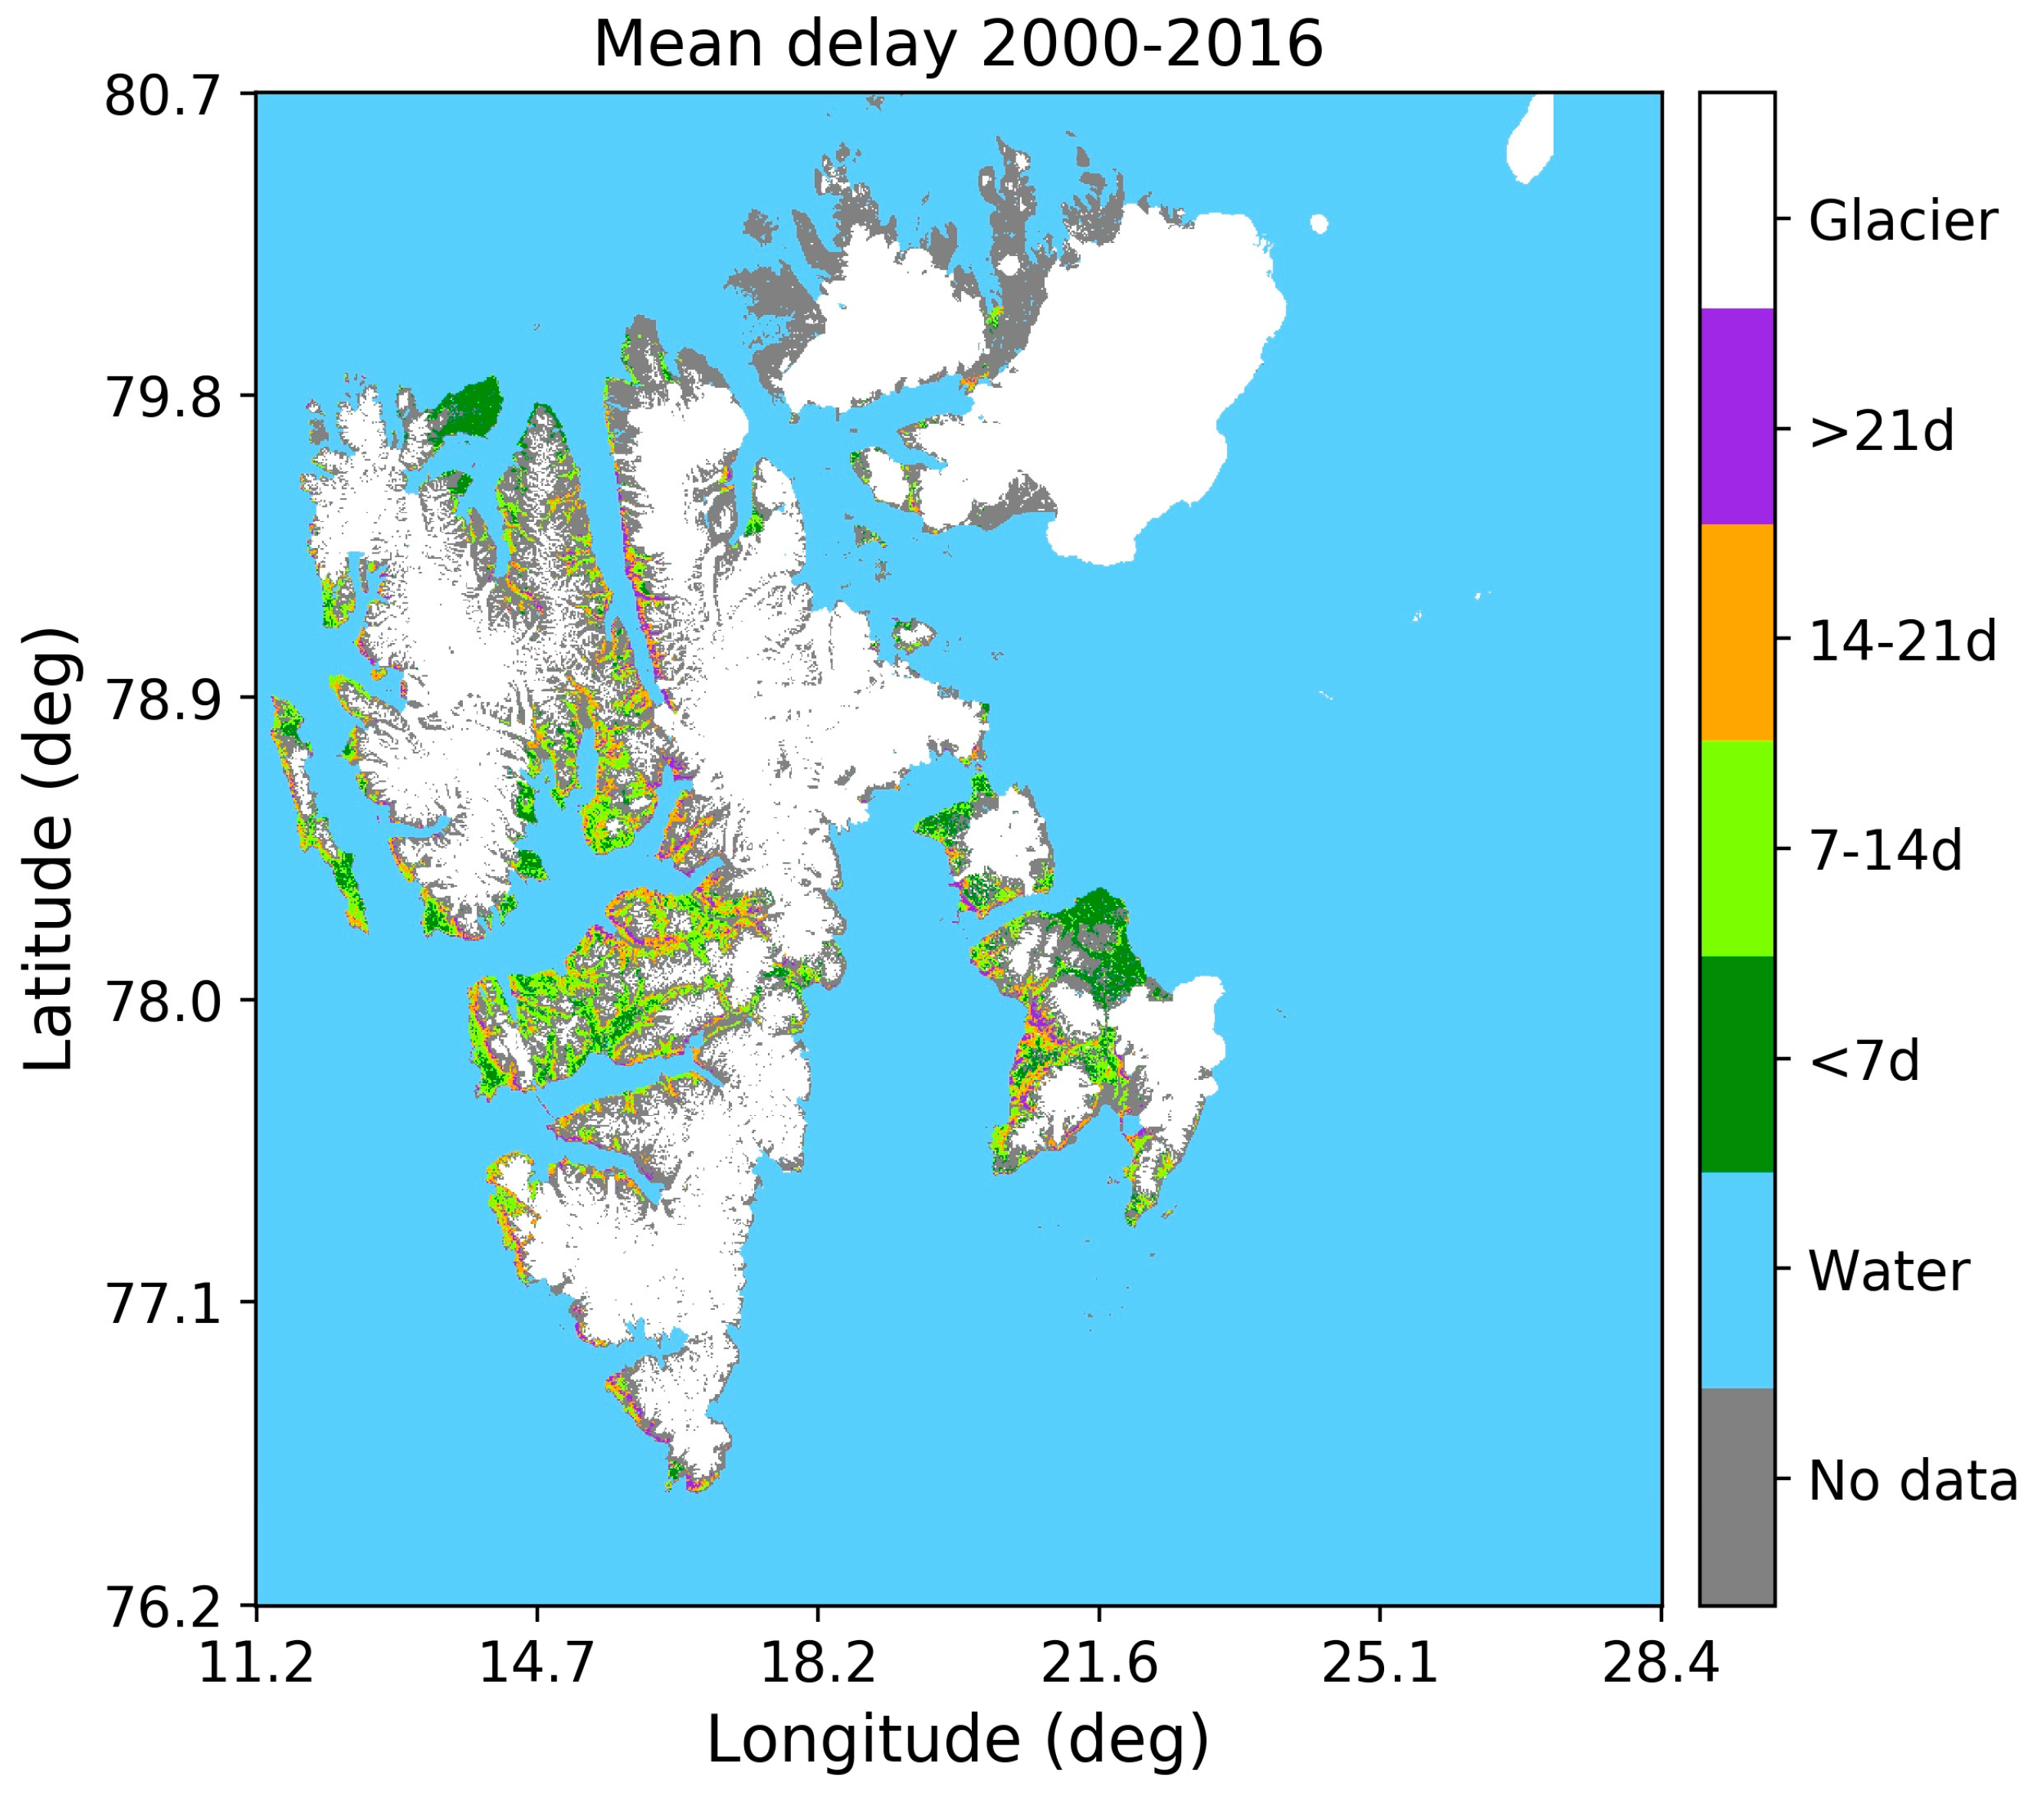
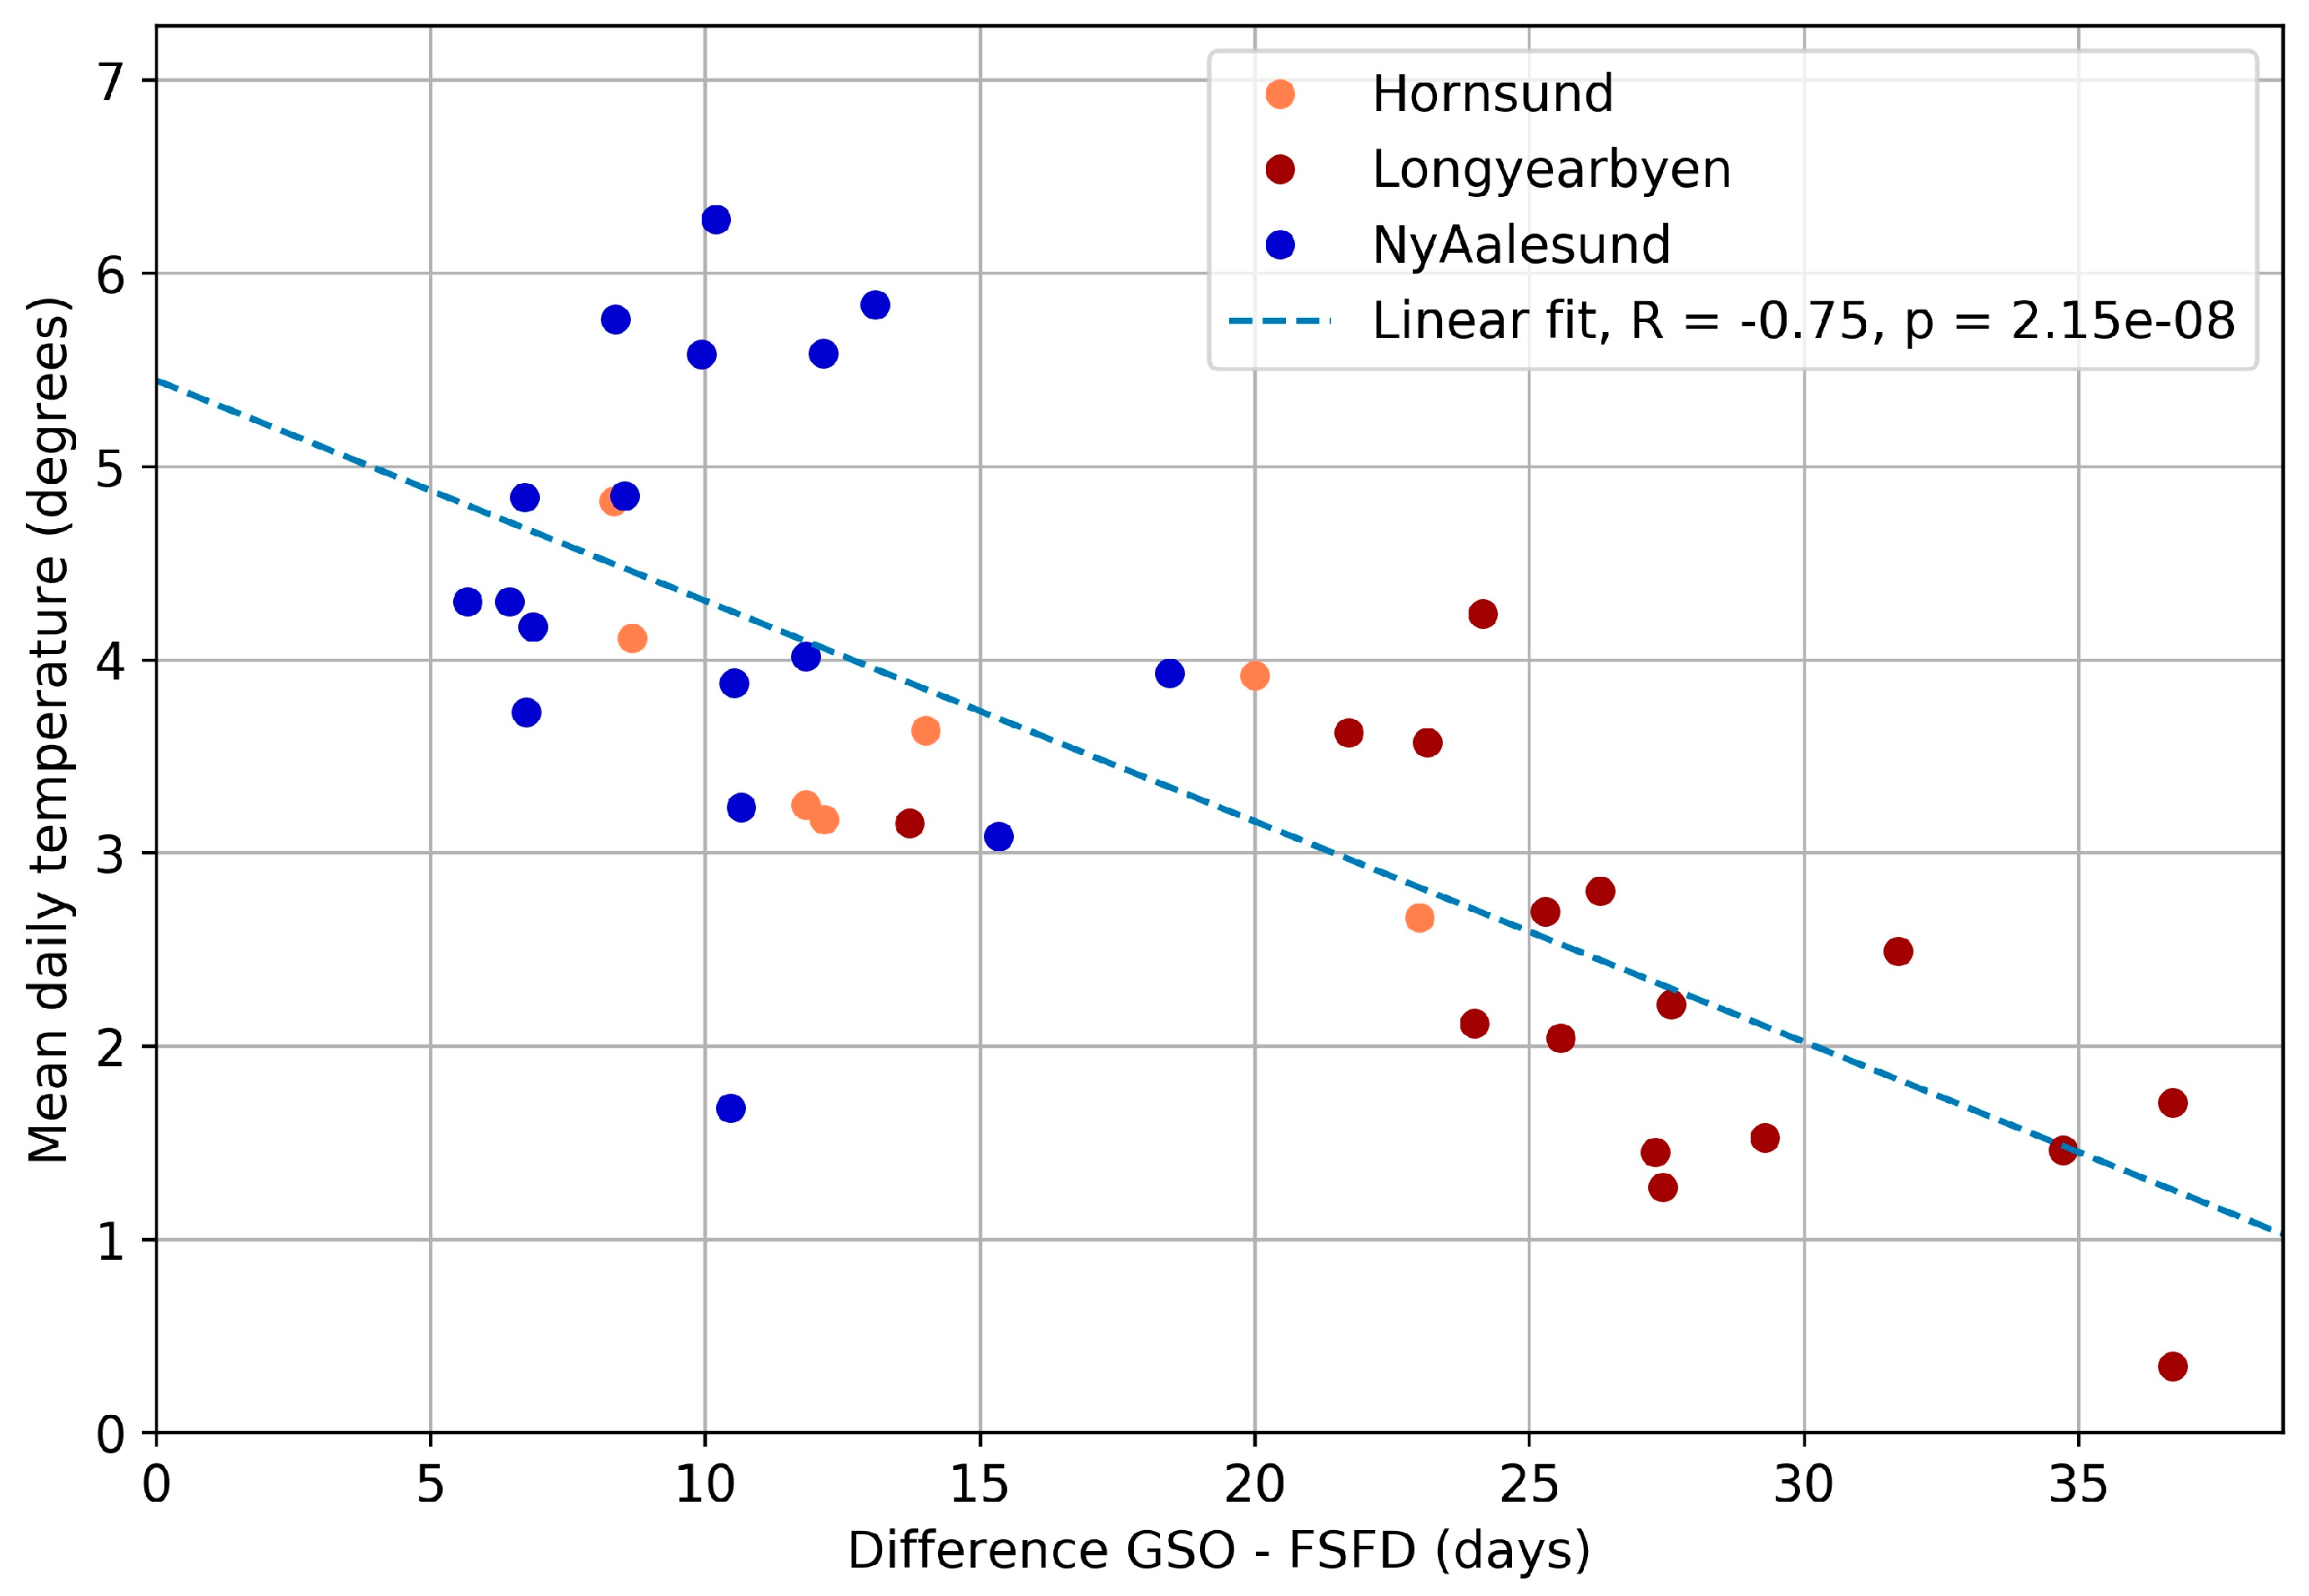
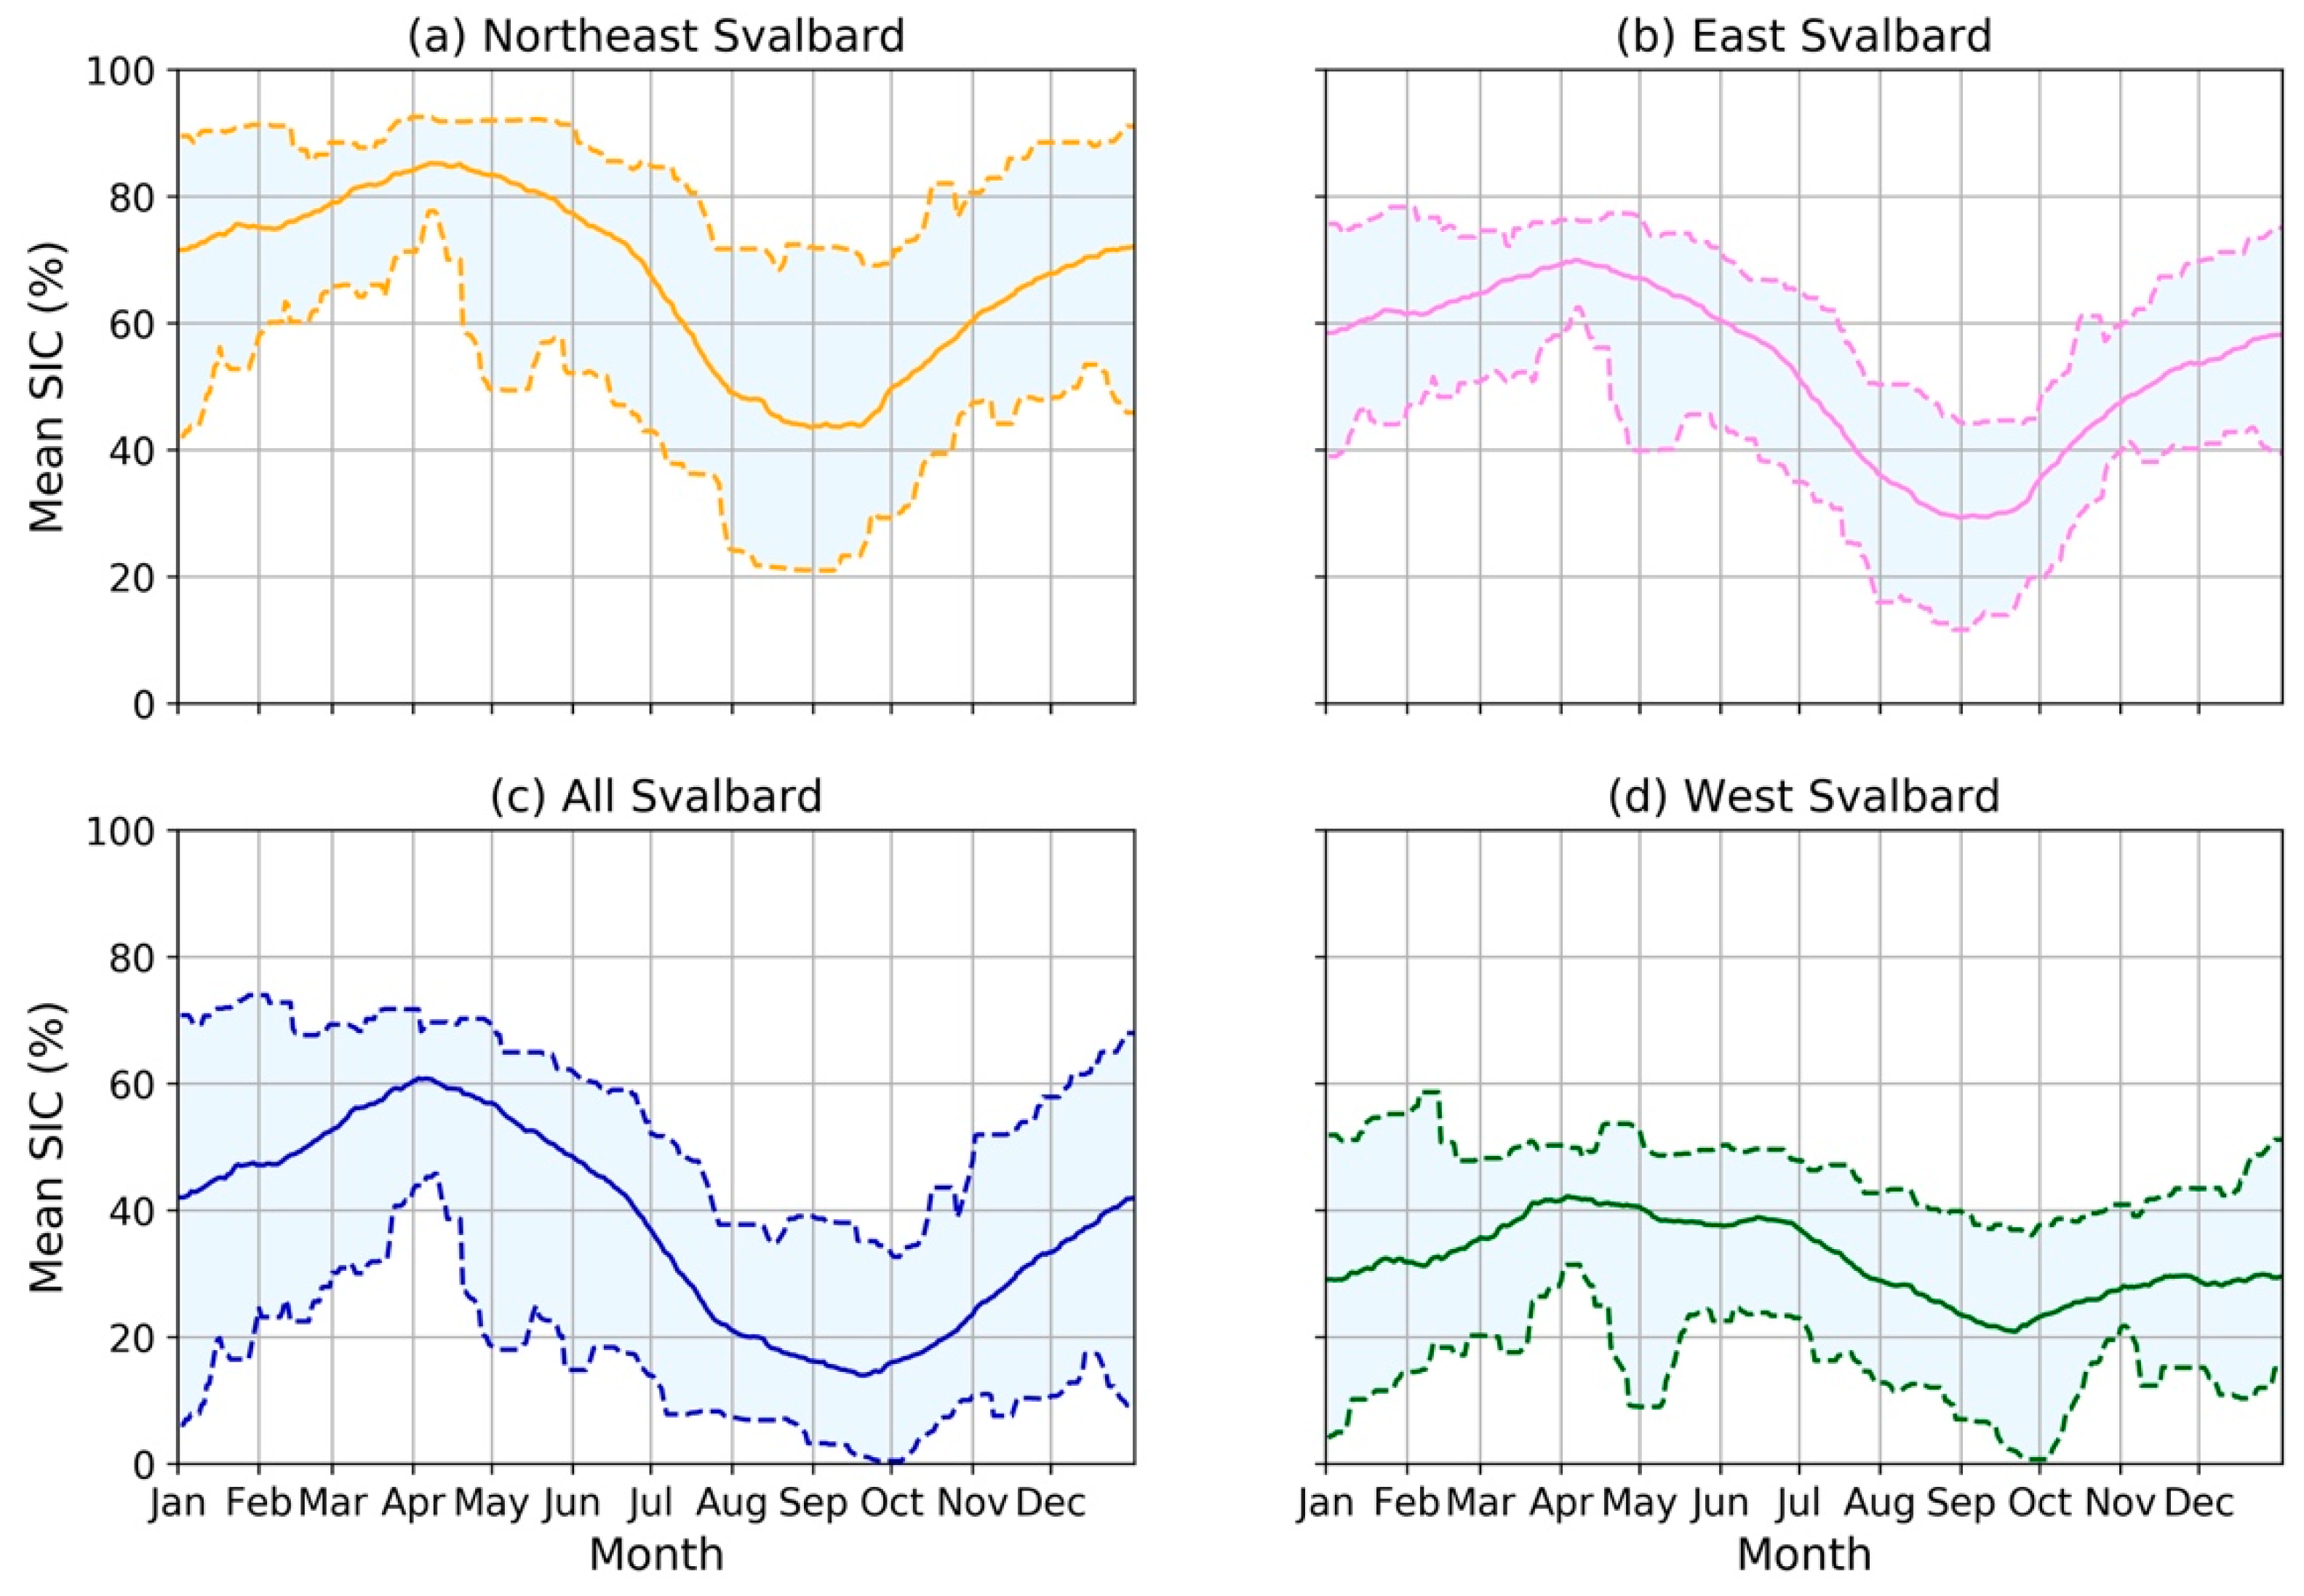
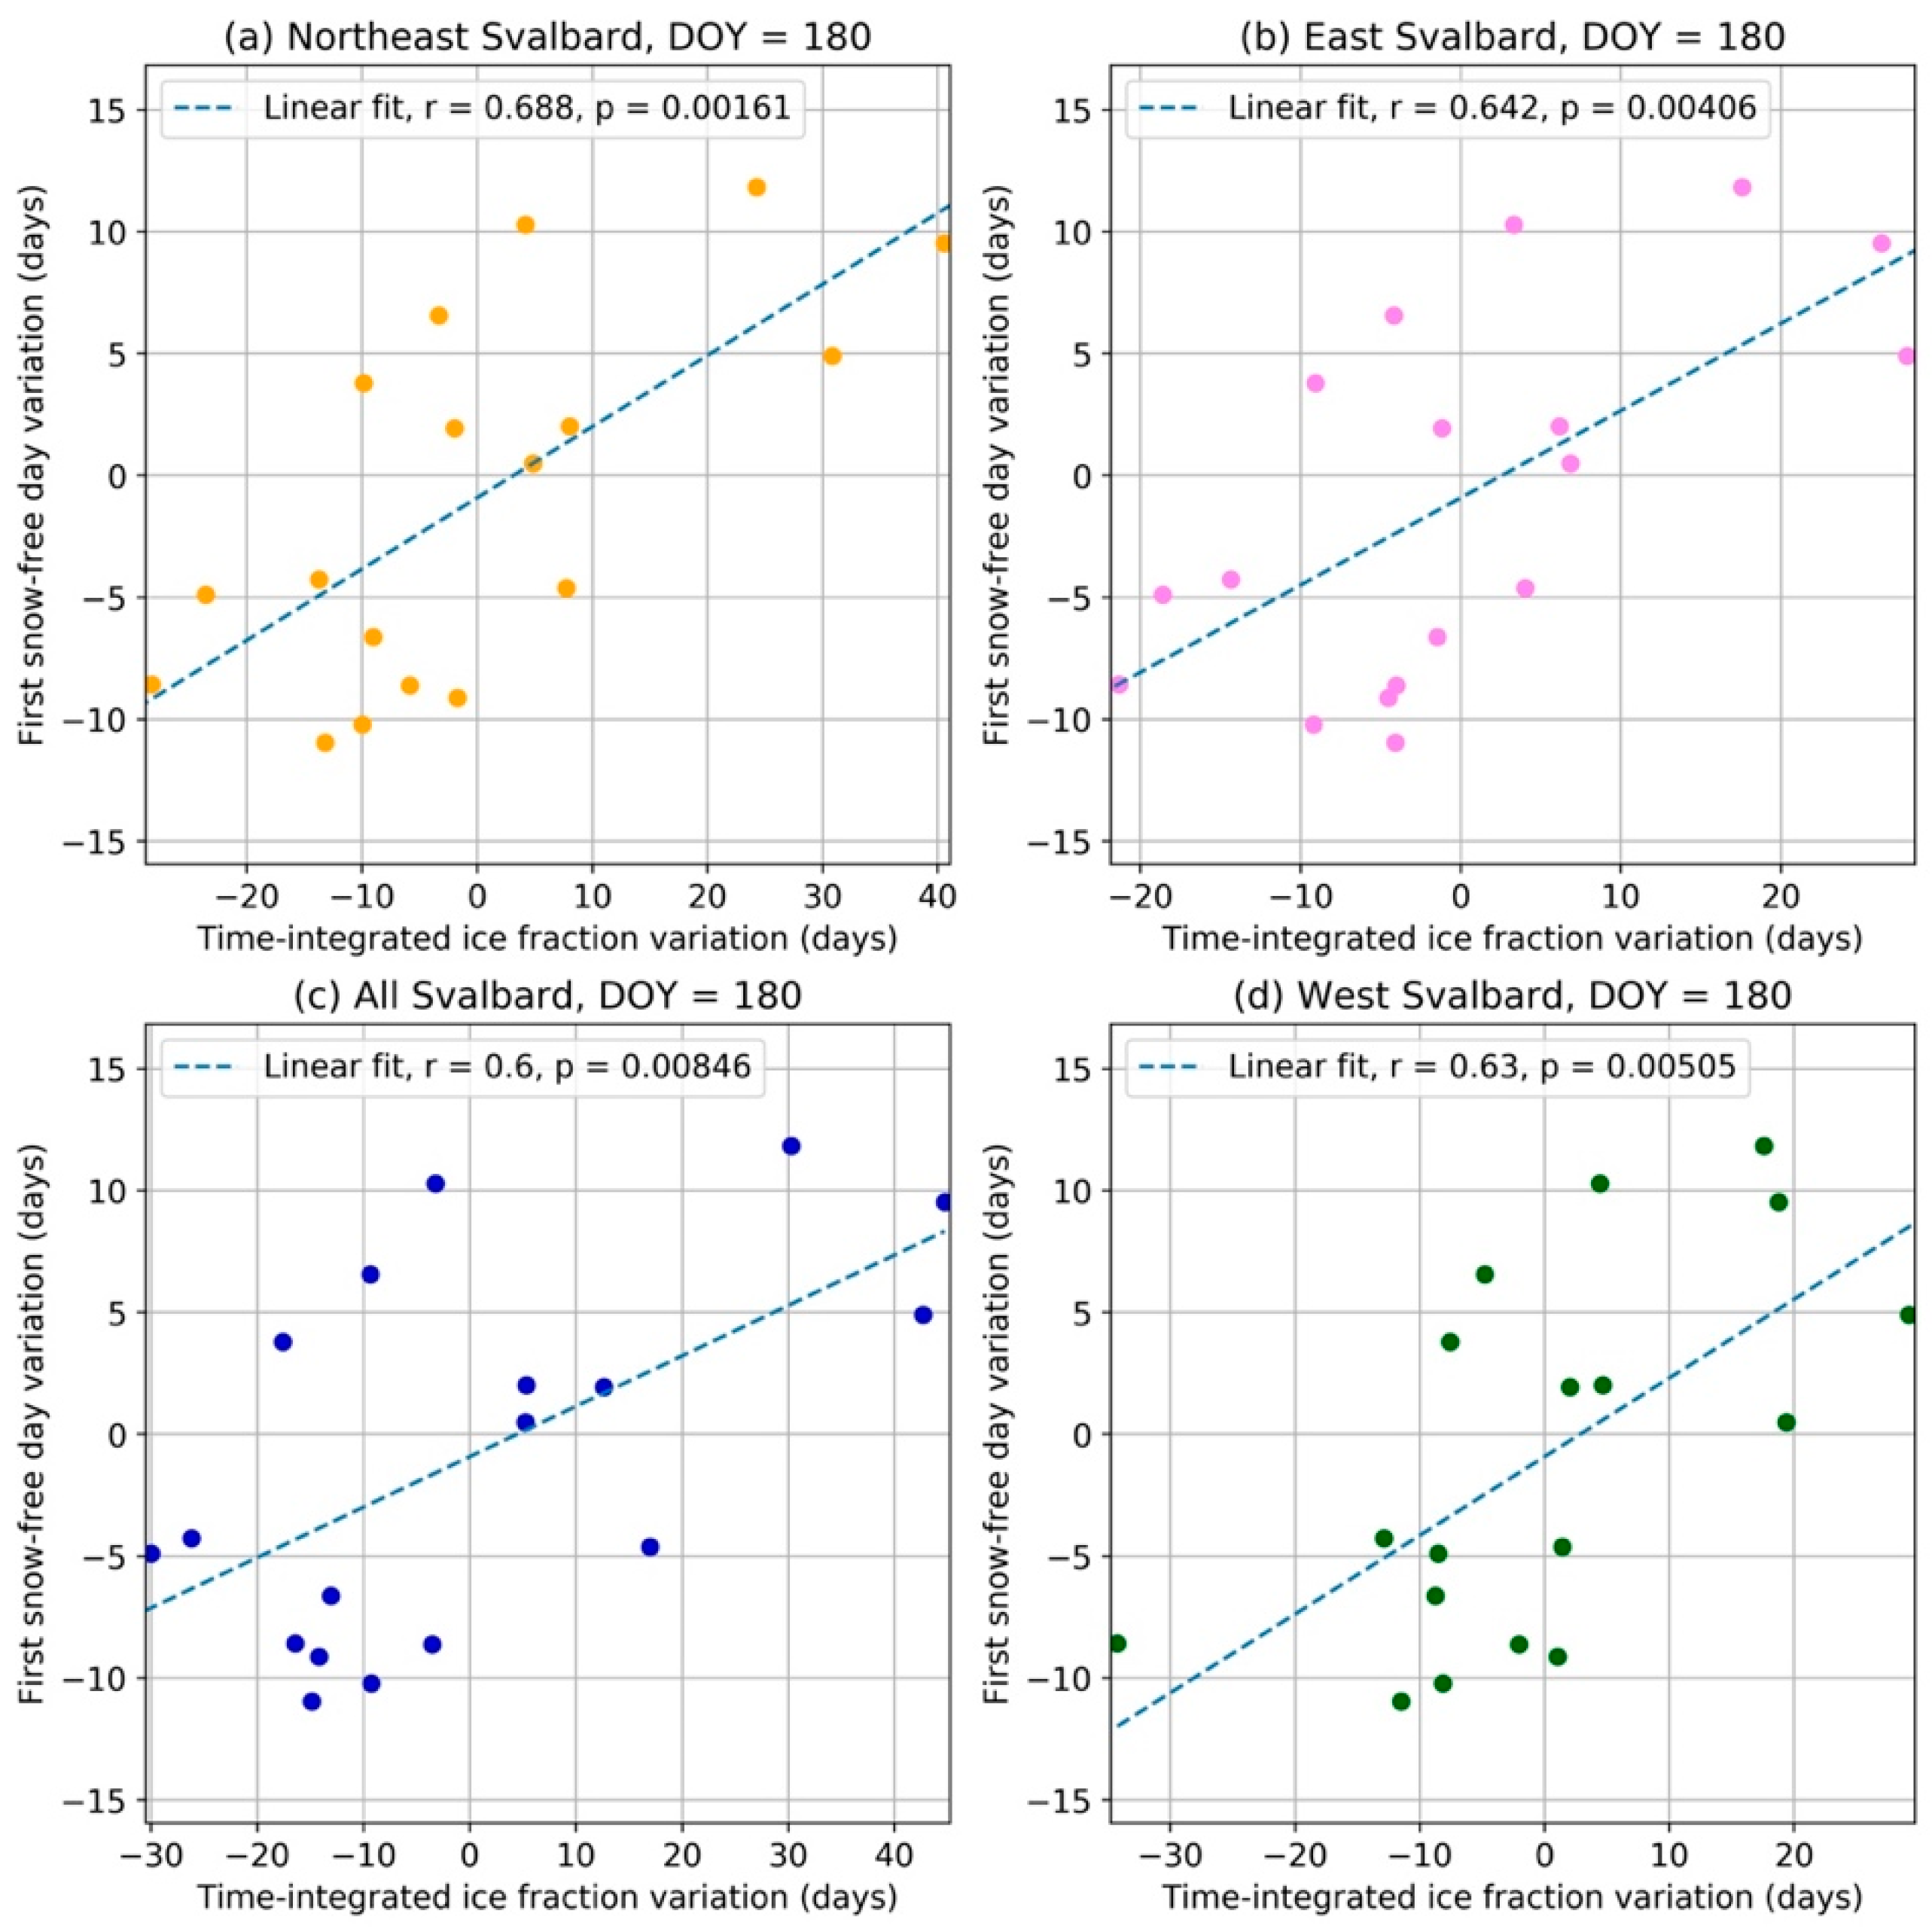
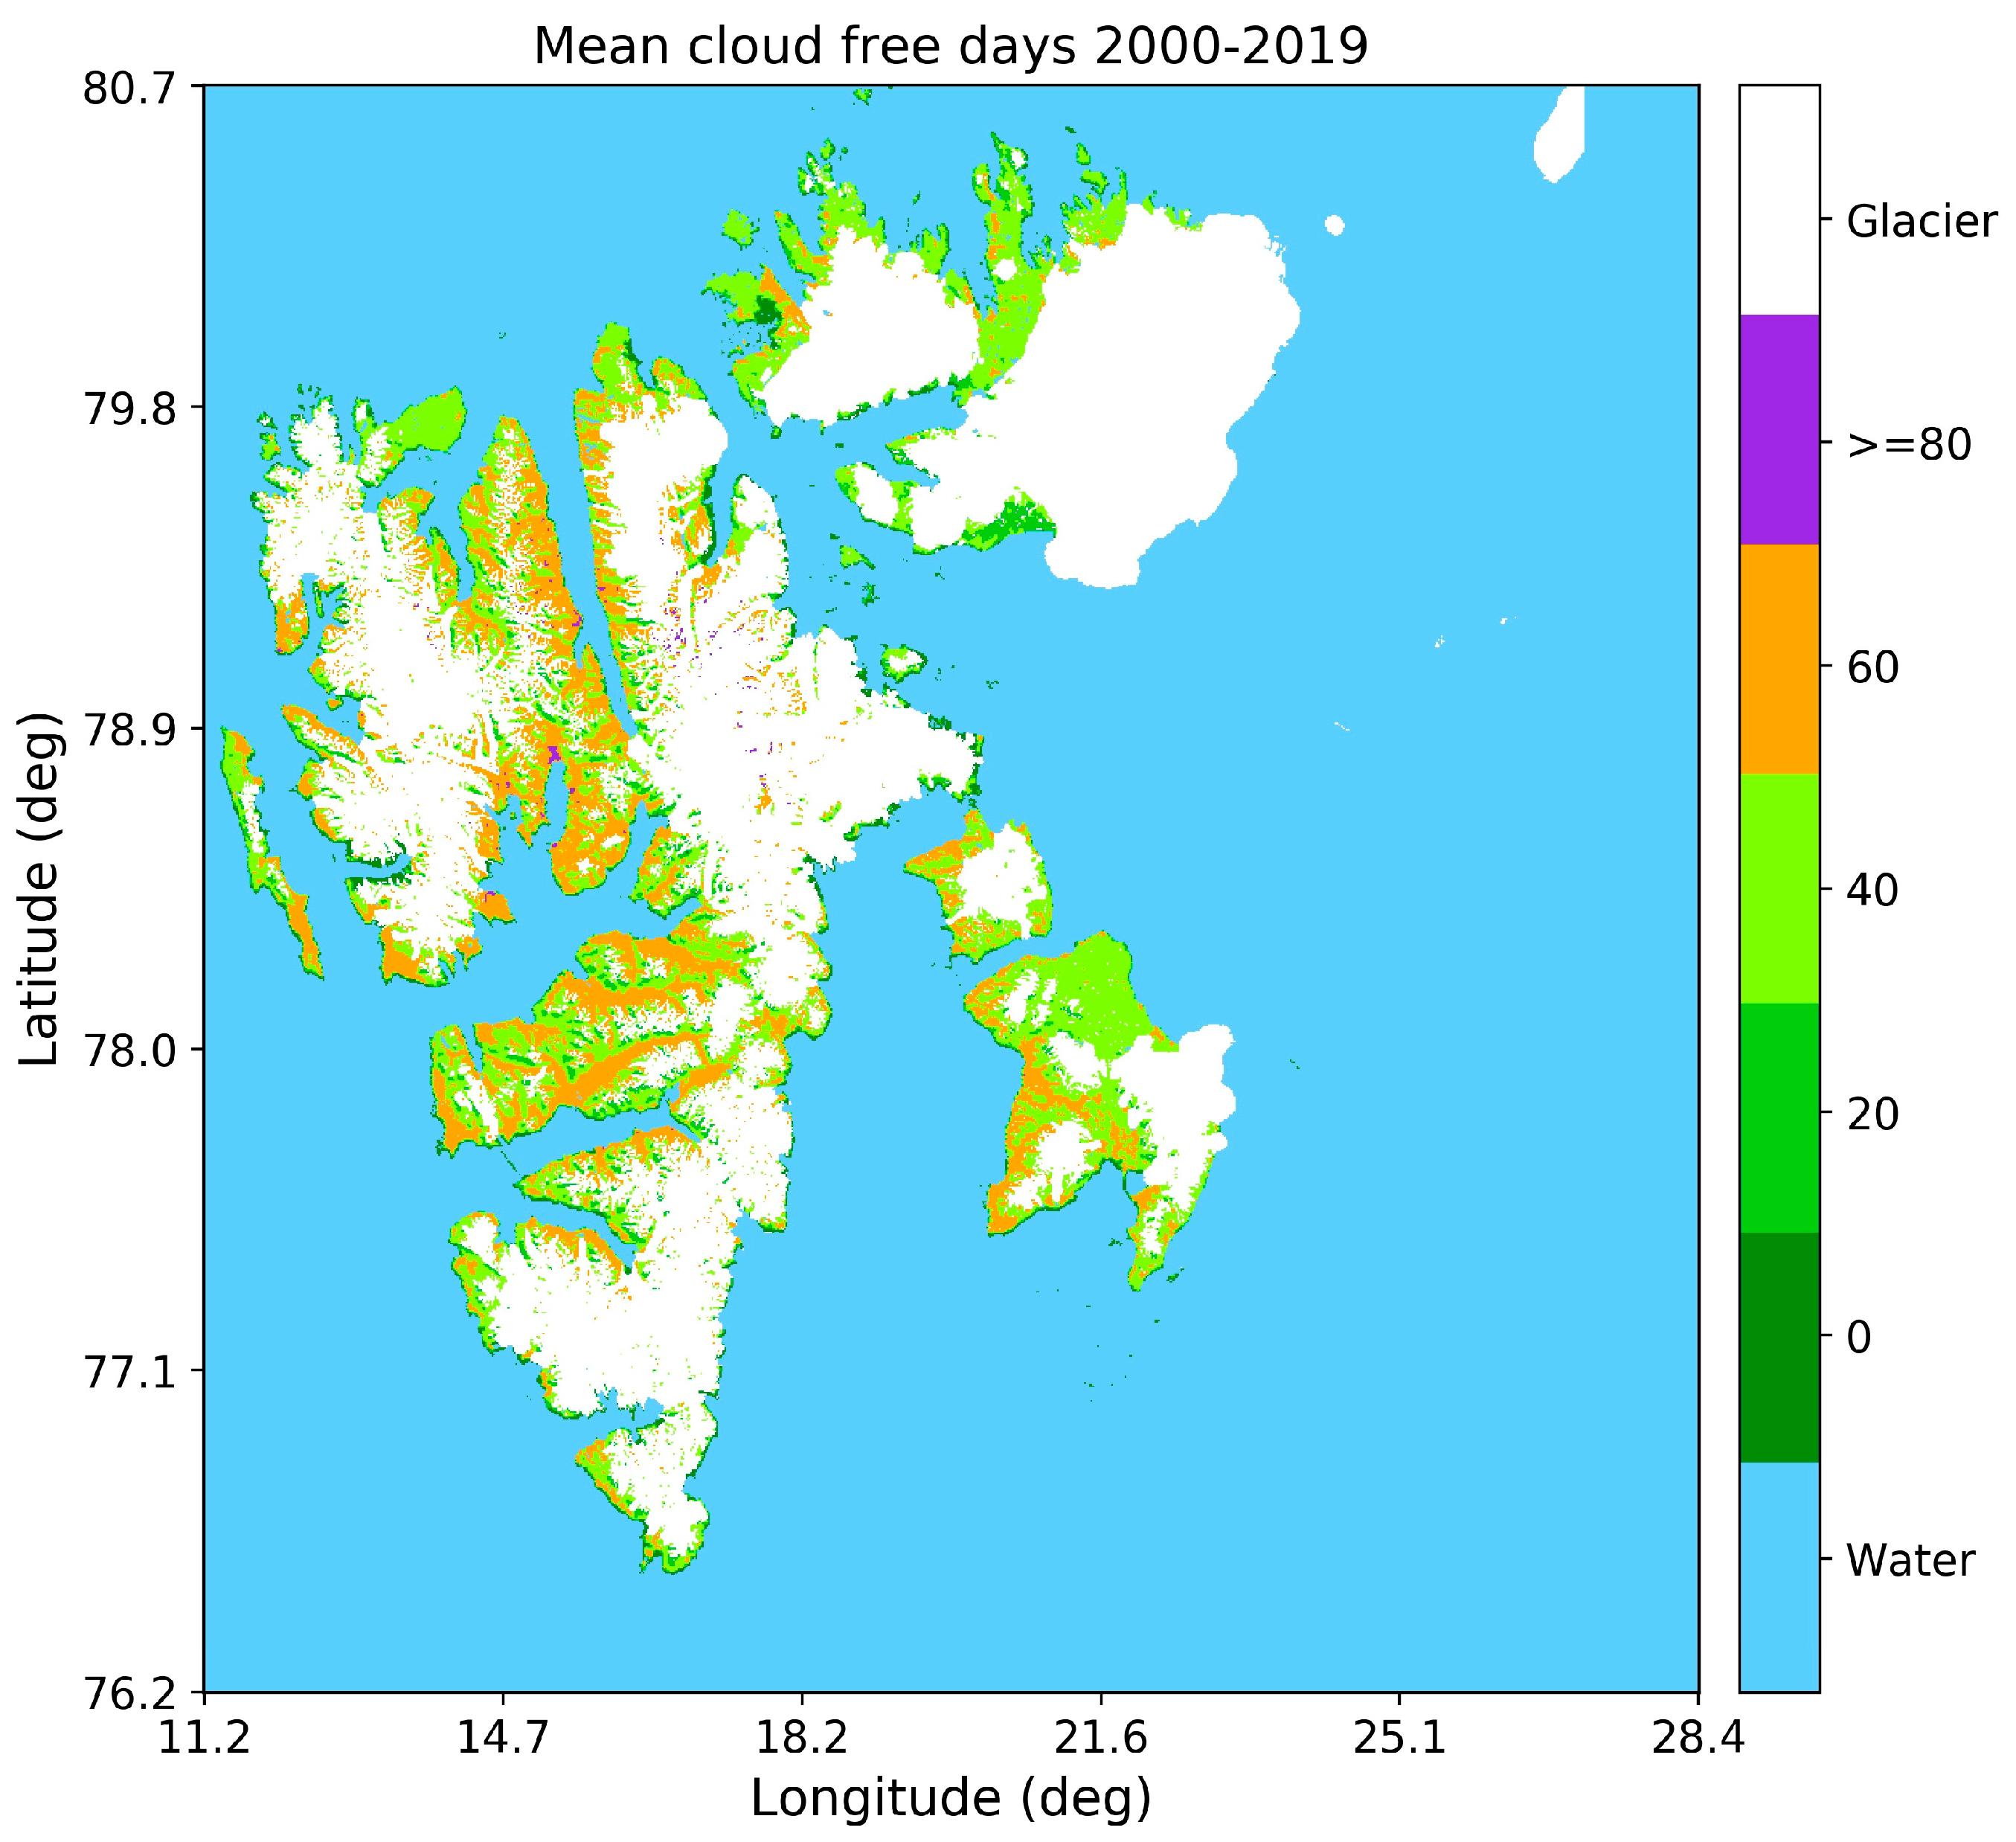
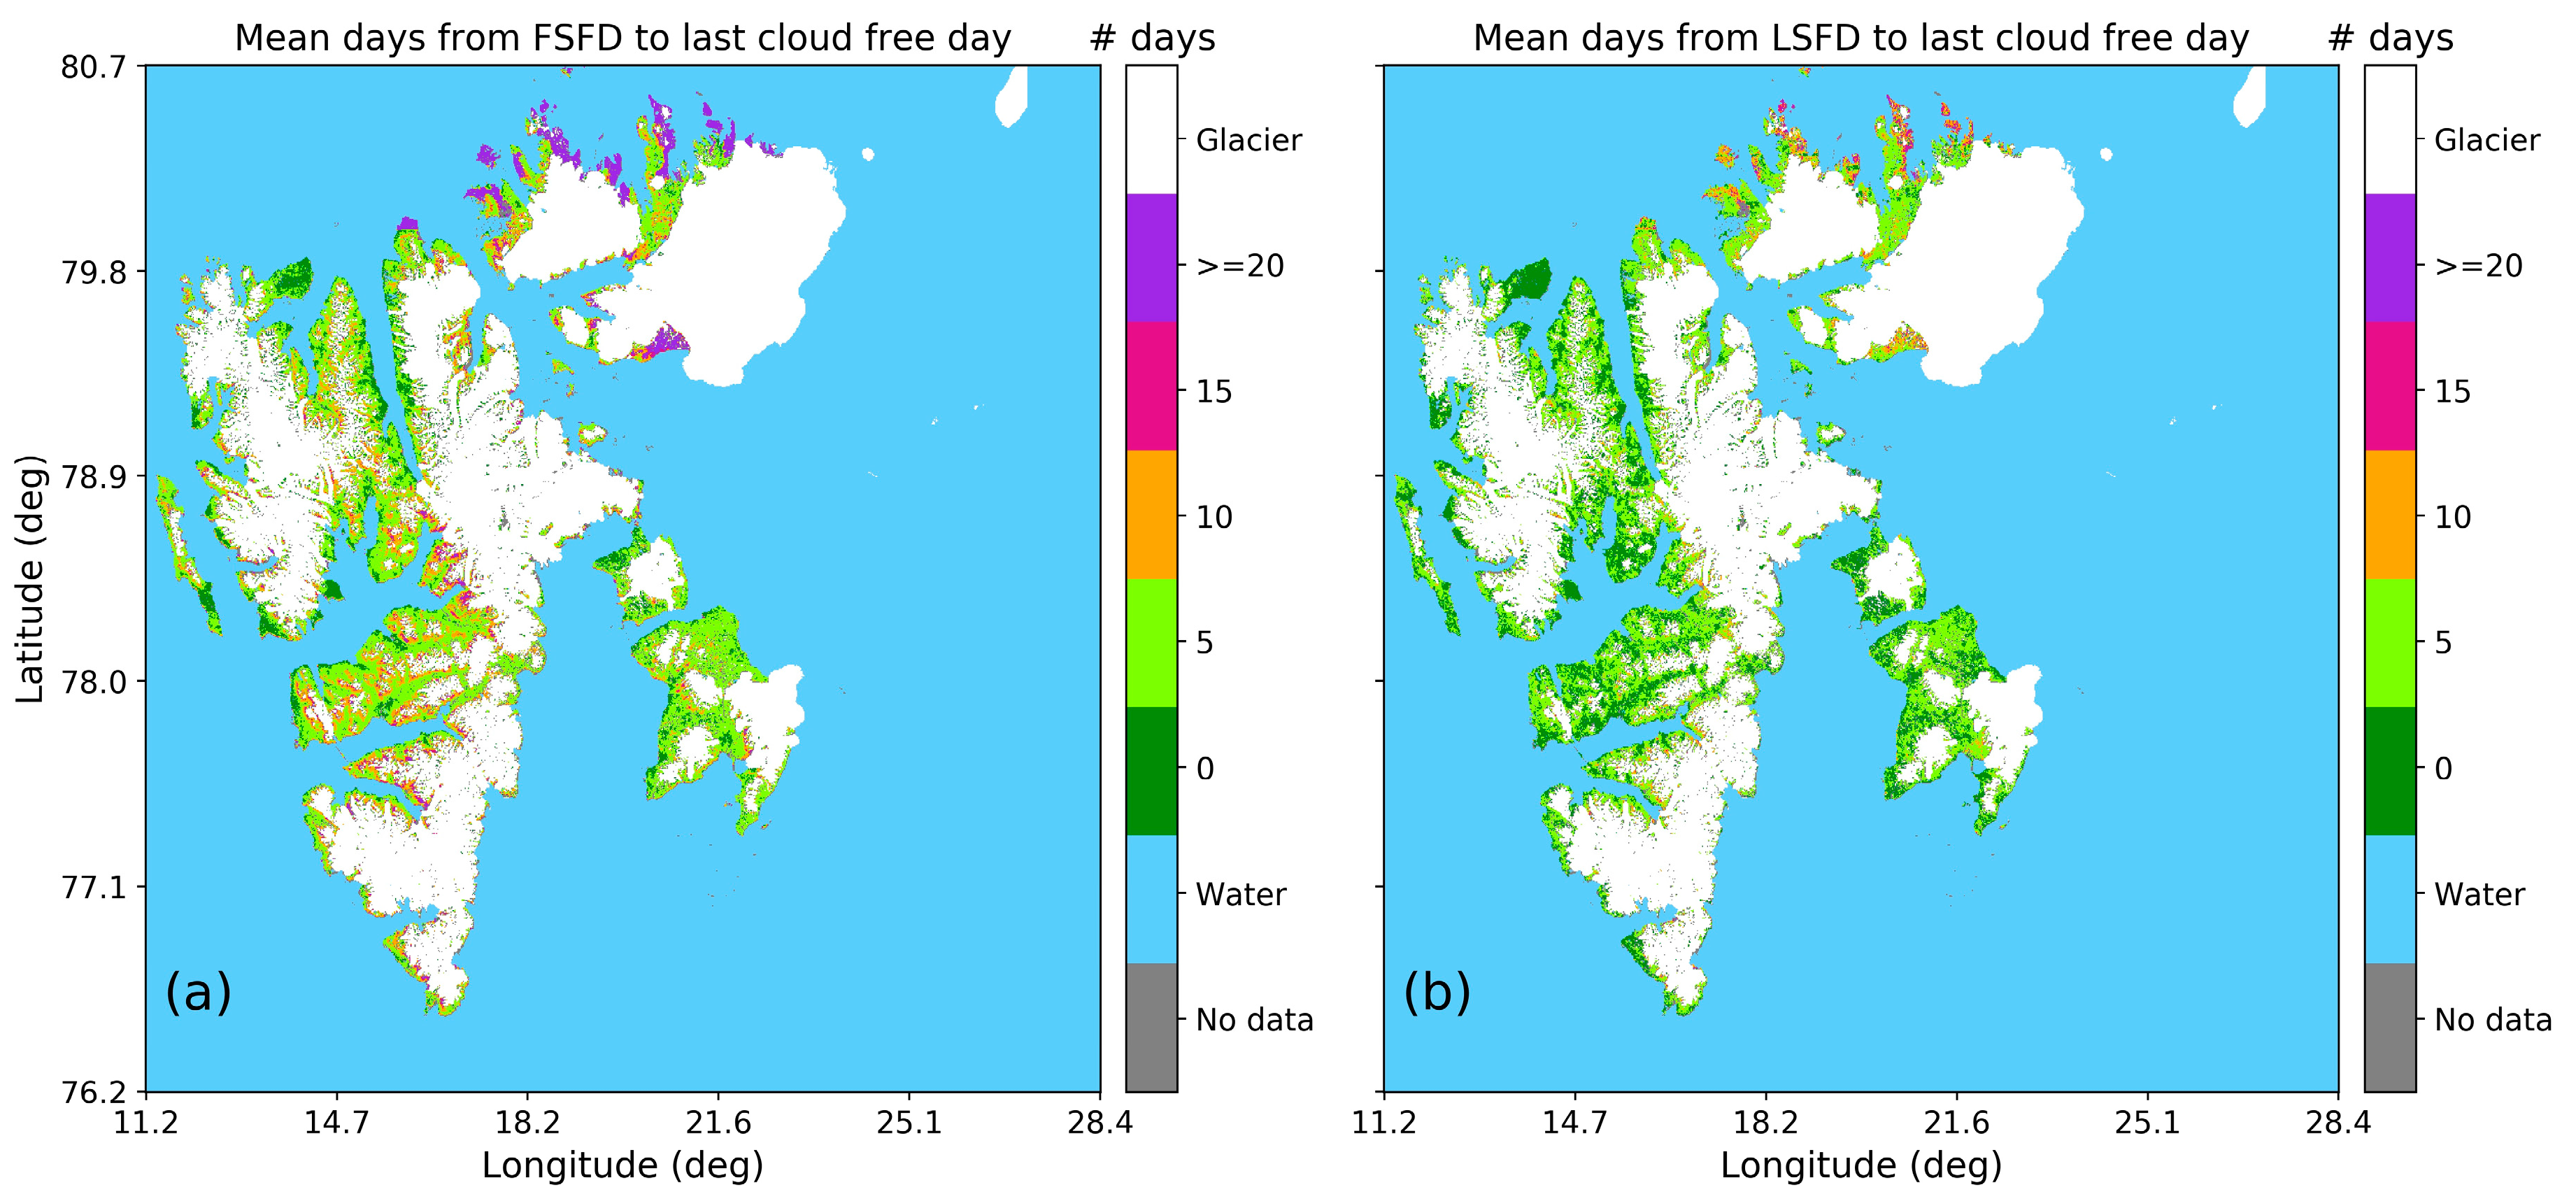
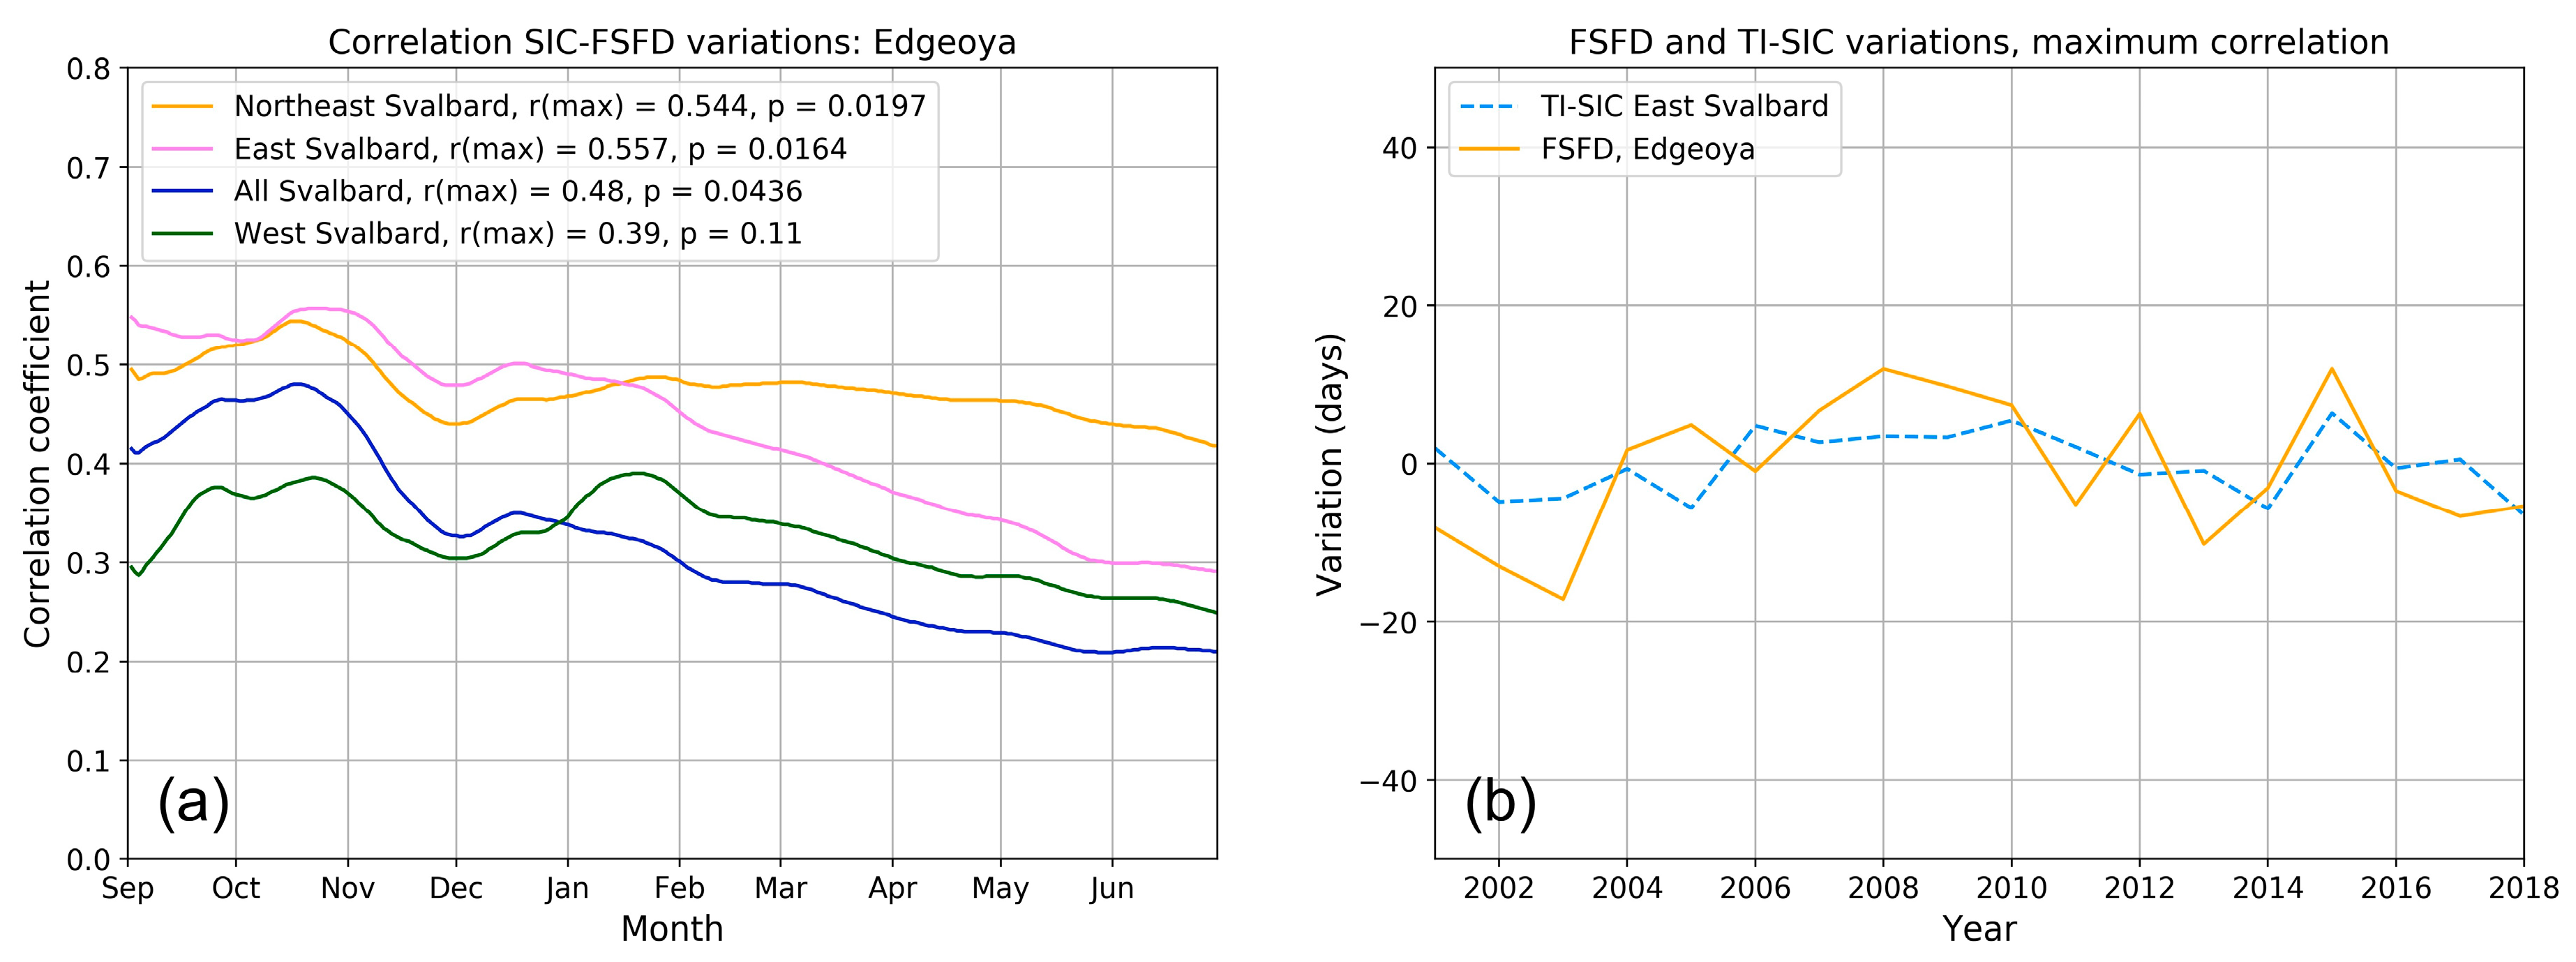
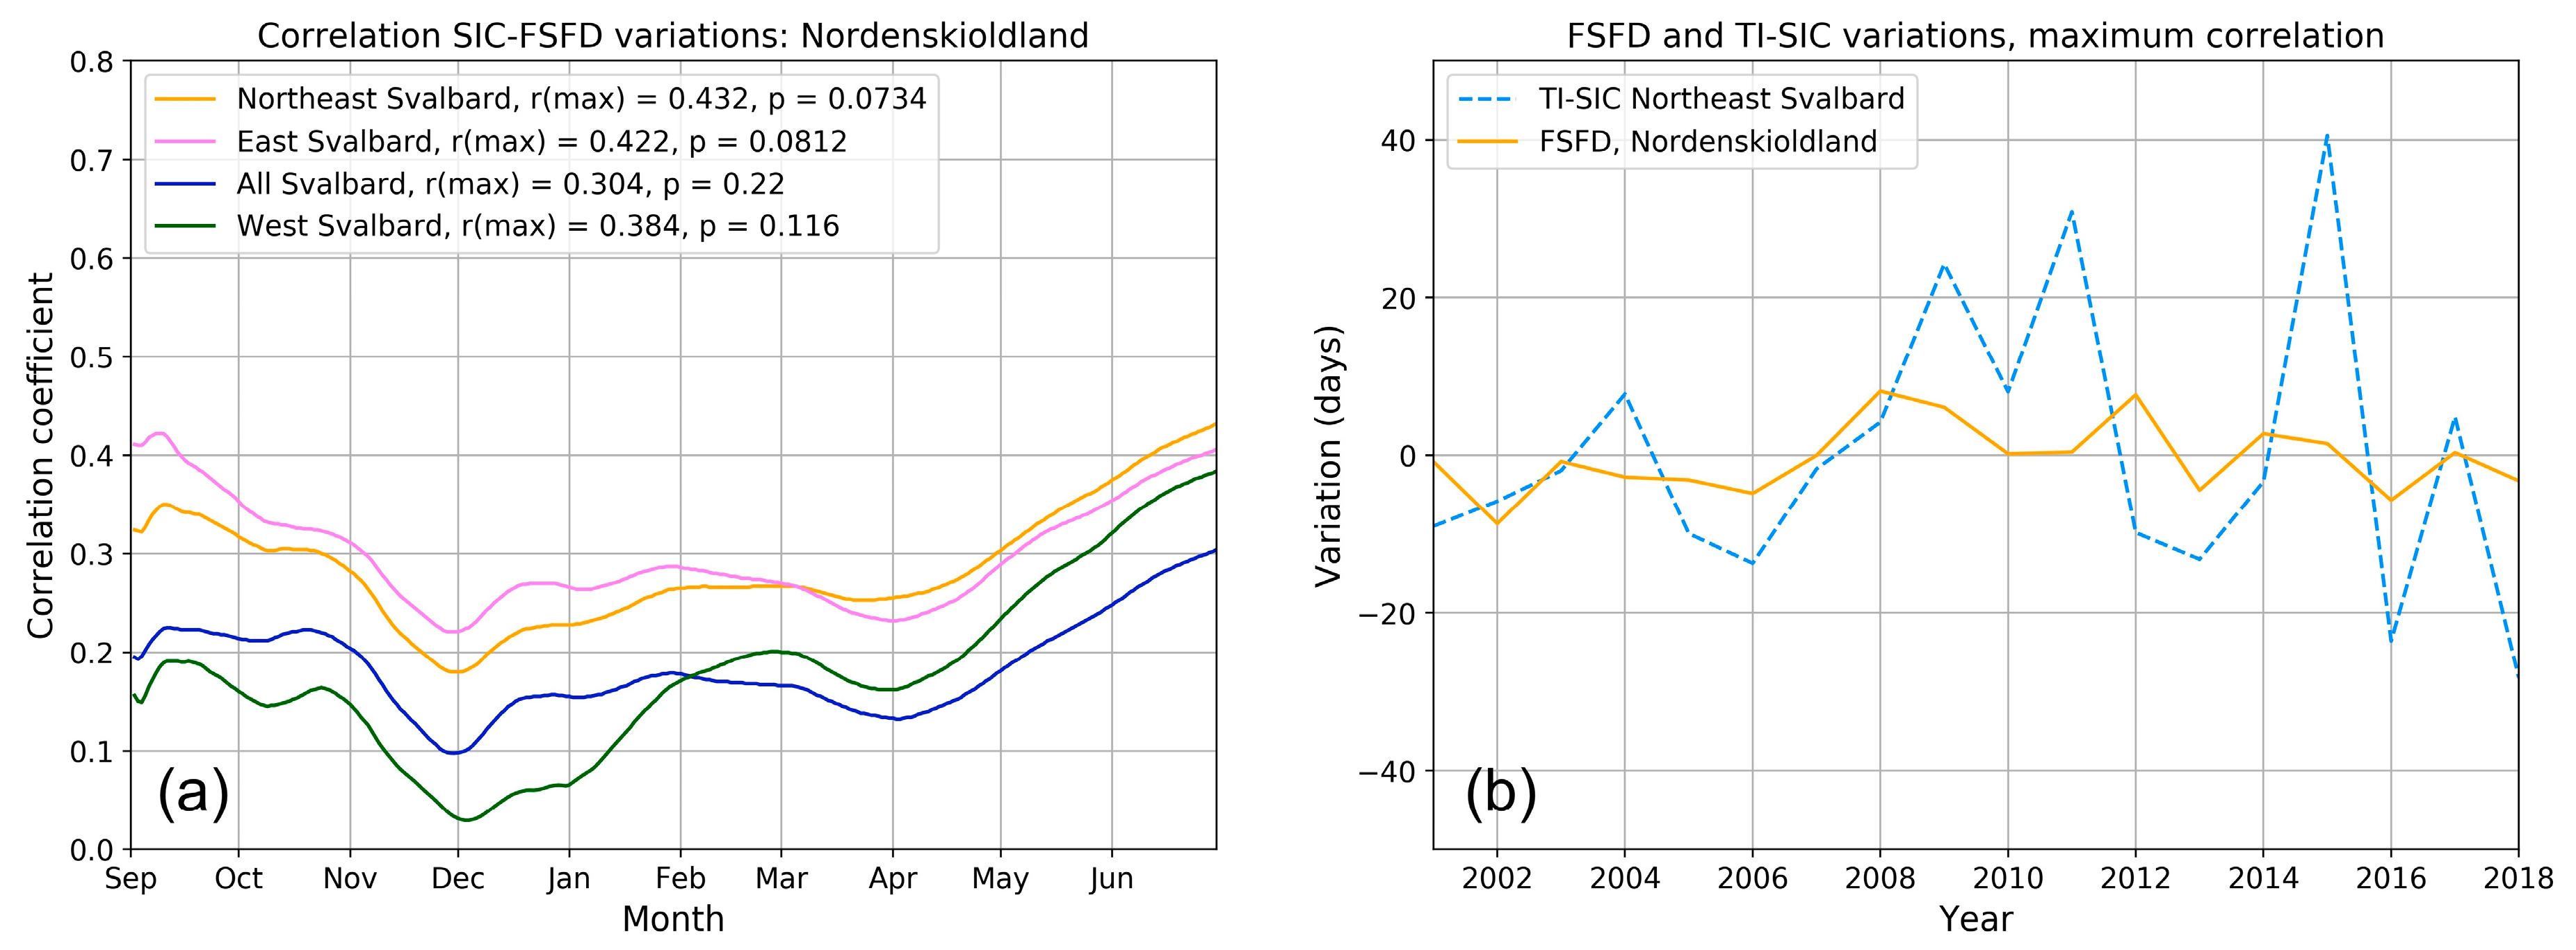
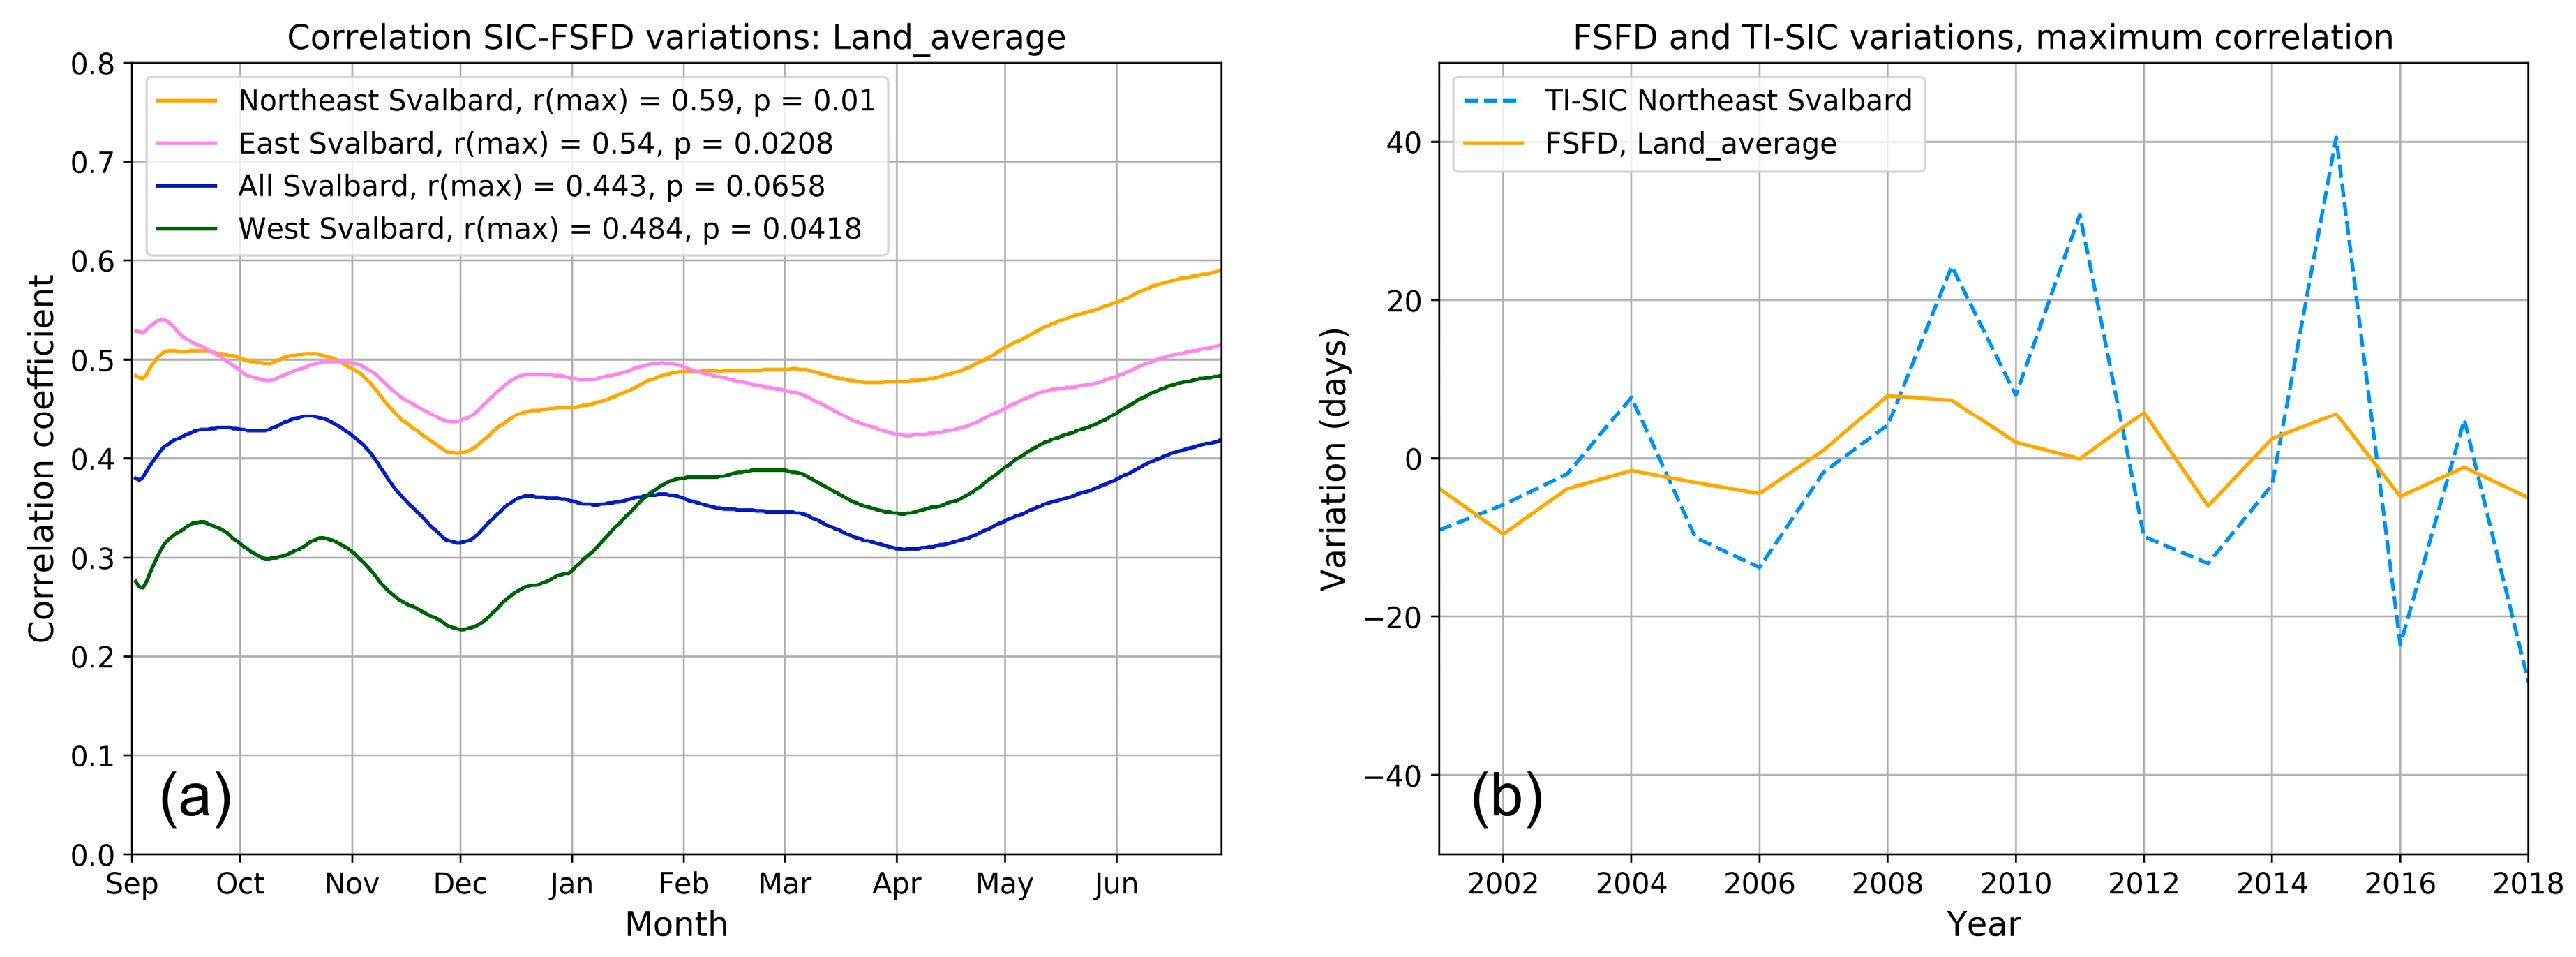
Table 1.
Meteorological stations, observation periods and years with first/last day of snow validations. The total number of validations (i.e., sum of first snow-free day (FSFD) and last snow-free day (LSFD)) is given in the third column. Note that many years were lost due to unstable snow settlement.
| Station | Years | Validations (FSFD + LSFD) |
|---|---|---|
| Longyearbyen | 2009–2019 | 24 |
| Adventdalen | 2018–2019 | 3 |
| Ny-Ålesund | 2009–2019 | 24 |
| Platåberget | 2018–2019 | 4 |
| Sveagruva | 2017–2019 | 7 |
| Hornsund | 2002–2019 | 35 |
Table 2.
Summary of the decadal trends in first snow-free day, last snow-free day, length of summer and length of winter, for the three regions Nordaustlandet, Edgeøya and Nordenskiöld Land as well as the average for the whole of Svalbard.
Table 2.
Summary of the decadal trends in first snow-free day, last snow-free day, length of summer and length of winter, for the three regions Nordaustlandet, Edgeøya and Nordenskiöld Land as well as the average for the whole of Svalbard.
| Region | FSFD | LSFD | LS | LW |
|---|---|---|---|---|
| Nordaustlandet | +2.9 | +2.9 | +1.4 | +0.6 |
| Edgeøya | −2.8 | +2.8 | +5.6 | −7.1 |
| Nordenskiöld Land | −1.5 | +1.6 | +3.3 | −4.0 |
| All Svalbard | −1.1 | +2.5 | +4.2 | −4.3 |
Table 3.
Summary of the minimum, maximum, mean and variance in the difference between first snow-free day and growing season onset, and the mean daily temperature in the period between FSFD and GSO.
Table 3.
Summary of the minimum, maximum, mean and variance in the difference between first snow-free day and growing season onset, and the mean daily temperature in the period between FSFD and GSO.
| Station | Years | Difference Range (Days) | Mean Difference (Days) | Temperature Range (°C) | Mean Temperature (°C) |
|---|---|---|---|---|---|
| Hornsund | 7 | 1.5–22.5 | 10.9 | 2.7–4.8 | 3.7 |
| Longyearbyen | 16 | 13.7–36.7 | 27.5 | 0.3–4.2 | 2.3 |
| Ny-Ålesund | 17 | 5.2–17.5 | 9.6 | 1.7–6.3 | 4.4 |
Table 4.
Summary of the maximum correlation between the detrended time series of FSFD for four averaging areas and time-integrated sea ice concentration (TI-SIC) for four subareas of the sea around Svalbard. Asterisks indicate correlations that were statistically significant at the 95% level.
Table 4.
Summary of the maximum correlation between the detrended time series of FSFD for four averaging areas and time-integrated sea ice concentration (TI-SIC) for four subareas of the sea around Svalbard. Asterisks indicate correlations that were statistically significant at the 95% level.
| Sea Ice Area | Land Average | Nordaustlandet | Edgeøya | Nordenskiöldland |
|---|---|---|---|---|
| NE Svalbard | 0.59, p = 0.010 * | 0.69, p = 0.002 * | 0.54, p = 0.020 * | 0.43, p = 0.073 |
| East Svalbard | 0.54, p = 0.021 * | 0.64, p = 0.004 * | 0.56, p = 0.016 * | 0.42, p = 0.081 |
| Entire Svalbard | 0.44, p = 0.066 | 0.60, p = 0.008 * | 0.48, p = 0.044 * | 0.30, p = 0.220 |
| West Svalbard | 0.48, p = 0.042 * | 0.63, p = 0.005 * | 0.39, p = 0.110 | 0.38, p = 0.116 |
© 2020 by the authors. Licensee MDPI, Basel, Switzerland. This article is an open access article distributed under the terms and conditions of the Creative Commons Attribution (CC BY) license (http://creativecommons.org/licenses/by/4.0/).
Share and Cite
MDPI and ACS Style
Vickers, H.; Karlsen, S.R.; Malnes, E. A 20-Year MODIS-Based Snow Cover Dataset for Svalbard and Its Link to Phenological Timing and Sea Ice Variability. Remote Sens. 2020, 12, 1123. https://doi.org/10.3390/rs12071123
AMA Style
Vickers H, Karlsen SR, Malnes E. A 20-Year MODIS-Based Snow Cover Dataset for Svalbard and Its Link to Phenological Timing and Sea Ice Variability. Remote Sensing. 2020; 12(7):1123. https://doi.org/10.3390/rs12071123
Chicago/Turabian StyleVickers, Hannah, Stein Rune Karlsen, and Eirik Malnes. 2020. "A 20-Year MODIS-Based Snow Cover Dataset for Svalbard and Its Link to Phenological Timing and Sea Ice Variability" Remote Sensing 12, no. 7: 1123. https://doi.org/10.3390/rs12071123
Note that from the first issue of 2016, this journal uses article numbers instead of page numbers. See further details here.