
Abstract
In this paper we report measurements of the absolute concentration of ground state oxygen atoms produced in a low pressure (≤100 mTorr) inductively coupled oxygen plasma. These experiments have utilised cavity ringdown spectroscopy, allowing line of sight absorption to be measured on the optically forbidden 1D ← 3P transition around 630 nm. Both the translational temperature and the absolute concentrations of the two most populated spin–orbit levels (J = 1 and 2) have been determined as a function of plasma pressure at a fixed operating power of 300 W, allowing accurate determination of dissociation fraction; in all cases, the dissociation fraction is considerable, ≥10%, maximising at 15% for 20 mTorr. Time-resolved measurements of the rate of loss of the oxygen atoms when the plasma is extinguished have allowed the probability for wall-loss in the plasma chamber, γ, to be determined; in this case, for an aluminium surface, γ is determined to be ca. a few ×10−3, with the exact value depending on pressure. In addition, the O− number density is shown to be an inverse function of pressure, showing a maximum of 1.6 × 1010 cm−3 at 10 mTorr, falling to 2 × 109 cm−3 at 100 mTorr, and characteristic of a discharge operating in the detachment regime. The measured number densities are interpreted using calculated electron energy distribution functions and yield physically reasonable values for the electron number density.
Export citation and abstract BibTeX RIS

Original content from this work may be used under the terms of the Creative Commons Attribution 4.0 licence. Any further distribution of this work must maintain attribution to the author(s) and the title of the work, journal citation and DOI.
Introduction
The accurate determination of the absolute concentration of oxygen atoms present in oxygen-containing plasmas has long been a highly valued aim in plasma research due to the fundamental and technical importance of such plasmas [1–3]. Oxygen-containing plasmas have been widely used in many fields, including plasma enhanced chemical vapour deposition (for example, of metal oxide films [4]), surface treatment/oxidation [5–7], chamber cleaning and etching of silicon dioxide layers [8], and plasma sterilisation of medical devices [9]. Accurate knowledge of the absolute density of oxygen atoms is key to testing and refining models of both the gas-phase chemistry and the gas-surface interactions occurring in these complex systems, leading to for example, improvements in the quality of films produced by atomic layer deposition plasmas.
A range of techniques have been developed to determine atomic concentrations in O2 plasmas and include optical emission [10], actinometry [11–13], and two-photon laser induced fluorescence (TALIF) [14–18]. However, none of these methods is absolute and each require meticulous calibration; for example actinometry relies upon accurate knowledge of electron impact cross-sections and the introduction of a chemical actinometer (for example argon) which can perturb the plasma, while TALIF often relies upon a comparison between two-photon excitation cross-sections for oxygen and xenon [19]. Optical absorption methods are preferable to the aforementioned 'indirect' methods, since the absolute number density is returned directly and the accuracy of the measurement depends only on the accuracy to which the transition line strength/cross-section is known. For O(3P) atoms the lowest energy spin allowed optical transitions occur in the vacuum ultraviolet (VUV) [12, 13, 20–22], at 130 nm and correspond to excitation of a 2p electron into the 3s orbital. Importantly, the large absorption cross-sections for these transitions (the Einstein A factors for the spin–orbit resolved transitions range from 0.676 to 3.41 × 10⁸ s−1 [23]), coupled with the typical atom densities occurring in many practical situations, means that such VUV absorption measurements occur under optically thick conditions. Perhaps more pertinently, quantifying absorption from a single transition requires high spectral resolution and accurate determination of the density requires knowledge of both the source and absorption line shapes. An example of the method can be found in the work of Niemi et al [24] who carried out VUV absorption measurements of atomic oxygen produced in a radio-frequency driven atmospheric pressure plasma using the broad continuum spectral output from the VUV beamline at the SOLEIL synchrotron facility coupled to a unique high resolution Fourier-transform spectrometer. The VUV is technically difficult to access with high fidelity tunable lasers while the use of broadband plasma light sources usually requires substantial effort to ensure negligible self-absorption within the source; in the latter case, we note that Yang et al [25] have recently reported on a self-absorption calibration method for a compact microwave plasma used in VUV absorption spectroscopy measurements. Here the self-absorption calibration was performed by spectral analysis of the emission line profile, taking into account the optical escape factor, such that a low-resolution monochromator could be used. These researchers demonstrated oxygen atomic density measurements in a mixed nitrogen and oxygen surface-wave plasma; the atomic oxygen density varied from ca. 1.3 × 10¹² to 4 × 1012 cm−3 as a function of N2:O2 gas mixture ratio, with a maximum at an N2:O2 ratio of 1:9.
Given the drawbacks associated with the VUV and the technical maturity of the laser and optical technology in the visible region, it is therefore unsurprising that several research groups (including the authors) have resorted to using absorption spectroscopy within optical cavities, on the forbidden 1D2 ← 3P2 transition at 630 nm, for detecting atomic oxygen. Harris and Weiner [26] demonstrated the first observation of O(3P) in absorption using the technique of intra-cavity laser absorption spectroscopy (ICLAS) on the O(1D2) ← O(3PJ) transitions at 630.030 and 636.38 nm (air wavelengths), with oxygen atoms generated in a discharge flow tube. These were followed by measurements by Teslja and Dagdigian [27] using pulsed laser cavity ringdown spectroscopy (CRDS) at 630.030 nm (air) to detect ground state oxygen atoms in a microwave discharge of either pure O2 or Ar/N2O. This set-up enabled the concentration of oxygen atoms in the 1014 cm−3 regime to be detected, and comparison with NO2 titration yielded an experimental accuracy of within 20%. Subsequently, Gupta et al [28] reported on the absolute O(3P1) concentration generated in a high finesse optical cavity by an inductively coupled discharge arrangement at 10–40 Torr total pressure of a 10% O2/He mix using the off-axis integrated cavity output spectroscopy technique, reporting a minimum detectable concentration of ∼1012 atoms cm−3. Finally, we have used cavity enhanced absorption spectroscopy (CEAS [29, 30]—measuring the integrated intensity of the cavity transmission—to determine O(3P2) concentrations in the technically relevant low pressure environment of an inductively coupled plasma (ICP) chamber with pure oxygen as a precursor gas [31]. At a pressure of 100 mTorr of precursor gas O2 and 500 W plasma power the O(3P2) concentration was determined to be (4.8 ± 0.6) × 1014 cm−3.
In this paper, we extend these previous experiments by replacing the Fabry–Perot laser source with a narrow linewidth external cavity diode laser (ECDL) system. The increased coherence length allows cavity ringdown spectroscopy within a higher finesse cavity to be used which has improved sensitivity, while the extended wavelength tuning allows the two lowest spin–orbit levels of the atomic ground state to be probed. The former improvement allows time-resolved monitoring of the oxygen atom density after the plasma is extinguished as well as new information on the density of O−, the dominant negative ion in the plasma, while the latter allows improved estimations of the degree of dissociation of parent O2 as a function of plasma operating conditions. The CRDS measurements are augmented by optical emission measurements as appropriate. The measurements are supported by modelling using calculated/literature values for electron energy distribution functions (EEDFs) and cross-sections.
Experimental details
The experimental arrangement is depicted in figure 1. The plasma chamber used in this investigation is a water cooled (source, walls and base) inductively coupled rf (13.56 MHz) cylindrical device of internal dimensions ∼21 × 35 cm (height × diameter) that operates at total pressures between 10 and 100 mTorr for gas flow rates <∼20 sccm. The plasma is weakly magnetically confined by 128 high flux magnets placed in the walls of the chamber (B is ∼500 G at the walls). Power is delivered to the chamber via an inductive electrode of stove-top configuration, physically separated from the vacuum by a dielectric barrier (quartz). This device has been described in detail previously and electrical characterisation has shown a good radial uniformity of plasma density [32]. The feedstock gas used here is pure oxygen (BOC). To undertake cavity ringdown measurements on the plasma, high reflectivity mirrors (Layertec GmbH; 99.99%) are mounted in gimbal mirror mounts contained within home-made vacuum compatible mirror boxes on baffle arms of length 15 cm, internal diameter 9 mm, either side of the chamber. One mirror is also mounted upon a piezo-electric stack within the gimbal mount and the total distance between the mirrors is 75 cm.
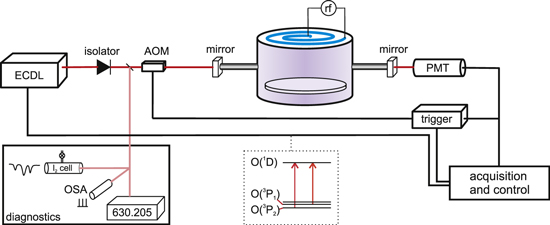
Figure 1. An experimental schematic: laser light from the ECDL passes through an optical isolator and an AOM before being coupled into the optical cavity. Cavity resonances are detected using a PMT which has a narrow pass filter (λ0 = 635 nm, Δλ = 10 nm) at its entrance. O(3P2,1) number densities are probed at wavelengths of 630.205 nm and 636.554 nm, in vacuo.
Download figure:
Standard image High-resolution imageThe CRDS arrangement follows closely that for cw-CRDS [33, 34]: light from an ECDL (Toptica Photonics AG, Germany, DL pro) is directed into the chamber via an acousto-optic modulator (AOM), and when a cavity resonance occurs and is detected by a photomultiplier tube, a trigger signal is generated that both switches off the AOM and starts the acquisition of a ringdown event. Several hundred ringdown events are captured at one discrete wavelength before the acquisition and control software moves the ECDL to a new wavelength by changing the voltage applied to the laser grating piezo; this is repeated until a reasonable wavelength scan is achieved (usually over about 8 GHz, 0.27 cm−1, or ∼0.1 Å at 630 nm). The ECDL scan and absolute wavelength is calibrated against an optical spectrum analyser (OSA: Melles Griot, nominal FSR 2 GHz) and wavemeter (Coherent). The free spectral range (FSR) of the OSA has been verified to be 1.96 ± 0.05 GHz using a molecular iodine reference cell. The ECDL can be coarse-scanned manually to access the desired wavelengths for both the O(1D2) ← O(3P2) and O(1D2) ← O(3P1) transitions (at 630.205 and 636.554 nm in vacuo, respectively). To ensure the frequent occurrence of cavity resonances, the piezo-electric transducer in one of the HR mirror mounts is modulated at ca. 10 Hz. Baseline (vacuum) ringdown times of ∼35 μs are observed for this optical cavity, corresponding to a (geometric mean) mirror reflectivity of 99.993%.
Multiple measurements were made at four different pressures (10, 20, 50 and 100 mTorr) with feedstock gas flow at a constant 10 sccm. Plasma power was set to 300 W for all measurements; reflected power was ≤5 W for all gas pressures. At 300 W the plasma is observed to operate well within the H-mode, with the E–H transition occurring at around 120–140 W at 100 mTorr (and lower at lower pressures).
Results and analysis
The O(1D2) ↔ O(3PJ) transitions in atomic oxygen are formally electric dipole (Δl = 0) and spin forbidden, but are magnetic dipole allowed with a small electric quadrupole component (∼10−3). The O(1D2) → O(3P2) and O(1D2) → O(3P1) transitions have Einstein A factors reported as 5.65 × 10⁻³ s−1 and 1.82 × 10⁻³ s−1, respectively [23]. The optical absorption cross-section, σ12, is related to the Einstein A factor, A21, by:
where gi are the degeneracies of the upper (g2 = 5) and lower (g1 = 5, 3 for J = 2, 1) electronic states, and λ is the transition wavelength. This yields integrated absorption cross-sections for the O(1D2) ← O(3P2) and O(1D2) ← O(3P1) transitions of 2.98 × 10⁻²³ cm2 cm−1 (8.93 × 10⁻¹³ cm2 GHz) and 1.63 × 10⁻²³ cm2 cm−1, (4.9 × 10⁻¹³ cm2 GHz), respectively (as expressed in convenient units).
Data from the cavity ringdown experiment are shown in figure 2 at four different pressures (figure 2(a)) and expressed as an absorption coefficient, α, which is related to the measured ringdown time τ, through:

where τ0 is the baseline cavity ringdown time, c is the speed of light, and α is the product of the number density and the absorption cross-section. Data are fitted with a Gaussian function (figure 2(b)) to reveal the line-of-sight average number density [nav] (comparing the area of the spectral line shape with the integrated cross-section) and temperature (from the full-width half-maximum of the Gaussian function) of an O(3PJ) quantum state. Number densities are then adjusted to compensate for the total ∼40 cm dead space within the baffle arms by multiplying [nav] by the ratio (L/l) = 75/(35 + 2h), where l and L are the actual absorption length (the length over which the absorber exists) and the physical length of the cavity, respectively, and h is a (relatively small) pressure dependent 1/e scale length that represents the penetration of O(3P) into the baffle arms. The rationale behind this straightforward length adjustment lies in the predominant loss mechanism for atomic oxygen, which is wall loss (recombination)—vide infra. The baffle arms have a narrow channel, 9 mm diameter, and are made of stainless steel, for which the surface loss probability is substantially larger than for the aluminium chamber surfaces [35, 36]. The lifetime of atomic oxygen that enters a baffle arm is significantly shorter than in the plasma bulk and therefore the atomic oxygen concentration in the baffle arms contributes little to the measurement. We estimate (considering equation (4), below) that for reasonable wall recombination coefficients of >10−3, the lifetime for O(3P) in the baffle arms can be as much as two orders of magnitude shorter than in the main plasma chamber. Furthermore, there is no production mechanism for O(3P) in the baffle arms. More comprehensively, using Fick's law of diffusion and pressure dependent wall recombination coefficients for stainless steel [37] yields scale lengths h between 1.4 cm (10 mTorr) and 0.5 cm (100 mTorr) and corresponding absorption length adjustments of (75/37.8) and (75/36). Results of measurements of O(3P2) and O(3P1) are presented in figure 3, and number densities range from low 1013 cm−3 to 5 × 1014 cm−3 over the pressure range studied; at 10 mTorr pressure the number density of O(3P1) was too small to obtain reliable data. The translational temperature was found to be in the range 310–350 K. The ratio of populations of O(3P1) to O(3P2) was found to be in keeping with that expected from thermodynamic equilibrium given the measured translational temperatures (figure 3, middle pane). The total atomic concentrations, O(3PT), were calculated from the O(3P2) number densities as these are the most significant data, from:

where gJ are the degeneracies of the spin–orbit states (for J = 2, 1, 0, gJ = 5, 3, 1), T is the temperature and k is Boltzmann's constant (square brackets denote number density). The dissociation fraction, δ, is calculated from δ = [O(3PT)]/2[O2], where [O2] is the oxygen concentration that would exist at the given plasma gas temperature if the degree of dissociation were zero, and takes values of ∼0.1–0.16, showing evidence of an increase towards lower pressures (figure 3, lower pane).

Figure 2. Results of cavity ringdown measurements of atomic oxygen (O(3P2)) at 630.205 nm (in vacuo) (a) showing the variation in absorption as a function of pressure and (b) data at 100 mTorr pressure with Gaussian fit (solid line). The linewidth is 1.6 GHz (FWHM) and integrated absorption 2 × 10⁻⁷ cm−1 GHz. Each data point consists of an average of ∼100 analysed ringdown measurements.
Download figure:
Standard image High-resolution image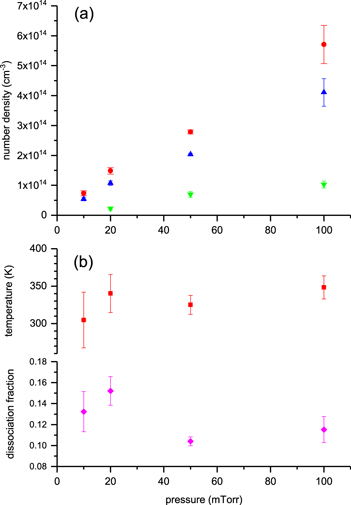
Figure 3. (a) The extracted line-of-sight average O(3P2) (upright triangles, blue), O(3P1) (upside-down triangles, green) and total O(3P) number densities (circles, red) deduced as a function of pressure; (b) the corresponding atomic temperatures (squares, red) determined from Gaussian fits to the data (e.g. figure 2(b)) and resulting dissociation fractions (diamonds, pink). The similar deviations in the dissociation fraction and temperature (and the size of the error bars—the uncertainty in the temperature contributes significantly to the total error) reflect the temperature dependence in the ideal gas law given that δ ∝ 1/[O2] ∝ T/p.
Download figure:
Standard image High-resolution imageUnder the operating conditions investigated in this work, loss of O(3P) is dominated by diffusion to, and reaction at, the walls of the plasma chamber [38, 39]. In order to characterise this process the plasma was modulated at 1 Hz with a symmetric square wave (on: 300 W and off: 0 W). The modulation rate was chosen to allow sufficient time for the plasma to equilibrate after being turned on and this was verified by measurement of the optical emission from the plasma by use of a photodiode. Ringdown events were then recorded in a series of 10 ms windows, at variable times after the plasma was extinguished. By recording ringdown events both on and off the O(1D2) ← O(3P2) resonance in each 10 ms window it was possible to quantify the time dependence of the O(3P) density using equation (2), and therefore the loss rate of this species. The results from this experiment are shown in figure 4 for plasma pressures of 50 and 100 mTorr; fitting a single exponential function to the data yields decay times of 70 ± 12 ms and 110 ± 17 ms, respectively. (After plasma extinction, optical emission from atomic oxygen was shown to reduce to zero within ∼50 μs, probably limited by electronic response of the power delivery system—see figure 4, inset.)
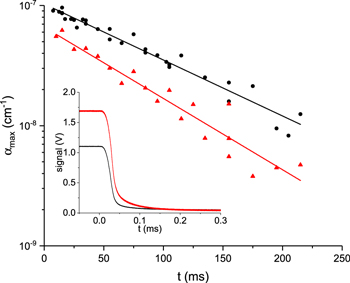
Figure 4. The decay of atomic oxygen measured after the plasma is extinguished at 50 (red triangles) and 100 mTorr (black circles). Each data point was calculated using the average of 20 on and off resonance ringdown events. At the lower pressures investigated in this work (10 and 20 mTorr) the smaller O(3P) concentrations precluded the accurate measurement of τ values beyond t = 30 ms. The inset shows the decay of the optical emission recorded through a narrow band-pass 777 nm filter (Andover Corp.); typically decay times are <50 μs.
Download figure:
Standard image High-resolution imageChantry [40] showed that, under conditions where O(3P) loss is dominated by diffusion to the walls followed by wall reaction/recombination, the fundamental diffusion mode loss of O(3P) is well represented by a lifetime, τD, such that:

where D is the diffusion coefficient for the diffusing species, l0 is the chamber's volume to surface area ratio, v is the mean velocity of oxygen atoms and Λ0 is the geometric diffusion length, which for a chamber of cylindrical symmetry (height L, radius R) is given by

The first term in equation (4) is an effective time to diffuse to the chamber walls whilst the second term corresponds to the time taken to react at the wall.
Using the Chantry formalism allows calculation of the surface loss probability, γ, for the two pressures investigated. For this plasma chamber [31], Λ0 = 4.9 cm and l0 = 4.8 cm, and the mean speed of oxygen atoms can be calculated from kinetic theory using

where M is the mass of atomic oxygen and T is the translational temperature as determined from the Doppler widths of the absorption profiles (figure 2). The diffusion coefficient, D, for atomic oxygen diffusing through an environment of O2 has been both measured experimentally [41, 42] and calculated from theory [43, 44]. Theoretical calculations and values derived from beam scattering experiments are limited to the high temperature regime (T > 1000 K). Of the low temperature measurements, those reported by Morgan and Schiff are considered to be most reliable [45] and are widely used [46–48]. For this reason, we take the diffusion coefficient, D, to be 4.2 × 104 cm2 Pa s−1 at 340 K. Using these values, together with equation (4) yields surface loss probabilities, γ, of (4.3 ± 0.8) × 10−3 and (2.8 ± 0.5) × 10−3 at pressures of 50 mTorr and 100 mTorr, respectively, noting that the contribution to τD is dominated by the second term in equation (4), and that contributions from higher order diffusion modes are negligible for the chamber geometry and conditions encountered here [40].
Conveniently, the O− ion has an absorption (photodetachment) continuum at wavelengths shorter than 830 nm and at 630 nm the photodetachment cross-section is ∼7 × 10⁻¹⁸ cm2 [49]. Therefore, we expect the presence of O− to cause a measurable change in baseline cavity ringdown time when the plasma chamber is operating. Indeed, it is expected that the dominant negative ion under the plasma conditions investigated in this work is O− [2], essentially because the stabilisation of O2− requires a third body, whereas O− is generated by dissociative electron attachment (DEA) for electron—O2 collision energies >∼3.7 eV. Additionally, the photodetachment cross-section of O2− is small [50] (∼1.2 × 10⁻¹⁸ cm2 at 630 nm) and so its effect on the ringdown baseline is negligible compared to O−. Other gas phase species with potential to cause a plasma dependent baseline effect are of no consequence; e.g. ozone is thought to exist only in very small quantities at operating pressures of 10–100 mTorr [51], and the ozone absorption cross-section around 630 nm is small [52] (∼4 × 10⁻²¹ cm2). Accordingly, the number density of oxygen anions, O−, was determined in a similar modulated plasma arrangement as described for the O(3P) lifetime measurements, but with the laser tuned off resonance (and although total pressures are too low to detect O2 on the b1Σg+ ← X3Σg− (2,0) band in this spectral region, we are also careful not to be coincident with these transitions).
We find that there is a difference in the baseline cavity ringdown time (i.e. off-resonance) between on- and off- plasma states, which can be as large as a few μs (in a 35 μs ringdown cavity); furthermore, these changes in baseline have both a fast and slow component and both result in an increase in ringdown time on plasma extinction. The latter takes place on a timescale of a few seconds (low pressure ∼10 mTorr) to several tens of seconds (high pressure ∼100 mTorr) while the fast change occurs on a timescale of <1 ms. We attribute these baseline shifts to two main factors: a temporary alteration (decrease) of mirror reflectivity either as a result of subtle temperature changes or by the plasma itself (some long lived plasma borne species, e.g. O2(a1Δg), persist long enough to travel along the chamber baffle arms and interact with the mirrors) accounting for the slow change; and the absorption continuum associated with the photodetachment of an electron from O−, accounting for a fast change.
To ascertain the O− concentration, the ringdown time was measured during 5 ms windows immediately before and 500 μs after the plasma is turned off, when the effects of slowly changing mirror reflectivity can be neglected. O− lifetimes are of the order of μs [51] and so a delay of 500 μs is sufficient to ensure that all O− is lost. It can also be assumed that O− is restricted to the bulk of the discharge by the combined effects of the positive plasma potential [53] and the relatively fast wall loss rate within the narrow baffle arms. Thus the number density of O− (nO−) can be found using the following adaptation to equation (2)

where τon and τoff are the ringdown times with the plasma on and off, respectively, σ is the photodetachment cross-section, and l and L are the plasma length (35 cm) and cavity length (75 cm), respectively. Note that there is no arm penetration correction (h) for O− here, as negative ions should be confined to the plasma to a large degree. The measured O− number density in the discharge as a function of total plasma pressure is shown in figure 5. The O− number density is a monotonically decreasing function of total pressure showing a maximum of 1.6 × 1010 cm−3 at 10 mTorr before falling eightfold to 2 × 109 cm−3 at 100 mTorr.

Figure 5. The variation of O− number density as a function of total pressure as measured by photodetachment at a wavelength of 630 nm. Error bars reflect the reproducibility in the measurement over several datasets.
Download figure:
Standard image High-resolution image
Discussion
The studies presented above have been conducted over a technologically important pressure range (10–100 mTorr) and at all pressures the equilibrium concentration of ground state atomic oxygen found in this plasma device is considerable; under certain conditions contributing up to ∼30% ± 2% of the total number density within the plasma. This conclusion is consistent with our previous measurement, made under limited conditions in the same plasma chamber, recorded using CEAS [31]. Such are the high concentrations of atomic oxygen in this plasma system, that conspicuous changes in pressure are observed when the plasma is ignited (usually controlled by the plasma chamber automatic pressure regulation feedback system). With the chamber completely sealed and containing 60 mTorr of pure O2, ignition of the plasma causes the measured pressure to increase to 75 mTorr. Taking into account the increase in gas temperature, as measured to be ∼340 ± 10 K from the O(3P) CRDS measurements, this leads to an estimate for the atomic oxygen concentration corresponding to a dissociation fraction of 11% ± 4%, in keeping with spectroscopic measurements. High equilibrium levels of a plasma borne product species must have significant ramifications on the electrical characteristics of the plasma (i.e. electron number densities and energies) and in this case are intrinsically related to the nature and material of the plasma vessel. The measured lifetime of atomic oxygen firmly supports the perception (as expected) that the loss process for this species is dominated by wall loss. The wall recombination probability inferred from these data is small, but not unrealistic for aluminium (by far the largest constituent of the plasma chamber) [54]. The trend for γ to decrease with increasing pressure has been observed before and has been rationalised by invoking both Eley–Rideal and Langmuir–Hinshelwood wall recombination mechanisms [55]. Our observations are also congruent with the hypothesis that at lower pressures, incident ions with higher energies can act upon the surface to provide more adsorption sites [47, 56, 57], an effect that is further enhanced in the work reported here, by the increase in ion density at lower pressures.
As a consequence of well-defined and dominant first order production and loss processes, and almost exceptionally for a plasma borne species, the number density of O(3PJ) can be scrutinised relatively easily for self-consistency in relation to the electron number density and energy distribution. Accordingly, EEDFs were generated using the BOLSIG + (version 12-2017) [58] Boltzmann equation solver using datasets for electron-neutral collisions for O2 [59] and O(3P) [60] in a gas mixture of 4:1 O2:O. For thoroughness, electron impact cross-sections from Laher and Gilmore [60] were also substituted and augmented by more recent cross-sections from Barklem [61] and this was found to make little difference to EEDFs. From a survey of the literature [3, 53, 62], electron temperatures, Te, of 2.5, 2.7 and 3 eV were selected as reasonable values for total gas pressures of 100, 50 and 20 mTorr, respectively. The EEDFs were then used in the balanced kinetic equation kp[O2][e−] = kL[O(3P)], to infer an electron number density. In the previous equation square brackets denote number density and kp and kL are the production and loss rate coefficients for atomic oxygen; kL (= 1/τD) = 9.1 s−1 at 100 mTorr, 14.3 s−1 at 50 mTorr (both measured) and 22 s−1 at 20 mTorr (estimated as a reasonable extrapolation from our data at 100 and 50 mTorr)), and kp is calculated from the sum over production mechanisms i:

where E is the collision energy, m is the electron mass, ϕi is the quantum yield for production of O(3P), Wi is a weighting factor for the relative abundance of a particular state of O2 (e.g. in this case O2(X v = 0, 1) and O2(a) have been considered), f(E) is the EEDF, and σi (E) the mechanism specific cross-section.
Adopting a reasonable relative abundance for O2(a1Δg) of 0.05 (e.g [63]) yields kp = 3.6 × 10⁻⁹ cm3 s−1, 2.5 × 10⁻⁹ cm3 s−1 and 1.5 × 10⁻⁹ cm3 s−1, and [e−] = 2.2 × 109 cm−3, 1.45 × 109 cm−3 and 1.6 × 109 cm−3, for total pressures of 20, 50 and 100 mTorr, respectively. Including O2(X, v = 1) calculated for a nominal vibrational temperature of ∼1500 K only enhances kp by about 1%–2%. Overall, the major contributor to kp is electron impact dissociation (EID) from O2(X 3Σg−) (93% (20 mTorr)—89% (100 mTorr)), with minor contributions from EID of the a1Δg state (6%–8%) and DEA to O2(X3Σg−) (1%–2%). Mechanism specific cross-section data were taken from [64] for EID and [65] for DEA. Thus we find electron number densities entirely consistent with previous measurements in this chamber, albeit with different gases (of the order of 109 cm−3 for N2 and 1011 cm−3 for argon [32, 66], using expected EEDFs and the measured O(3P) concentrations. We note however that there is clearly a play-off in this simple model between electron temperature and number density, i.e. a lower electron temperature will result in the prediction of a higher electron number density.
It is of interest to note that other authors have made measurements of, or inferred electron densities, in similar plasma systems. Of particular consideration is the recent work of Meischner et al [67] and Wegner et al [68] who use multiple probes to elucidate oxygen plasmas in a GEC-type chamber. They study the relationship between gas temperature and electron number density and in keeping with this work report gas temperatures of ∼350 K for electron number densities of ∼5 × 109 cm−3. However, for 300 W power input into their device, measured electron number densities (by microwave interferometry) are an order of magnitude higher than here. One possible explanation for this difference (perhaps the simplest) is that the relative discharge volume in our chamber is about ten times larger, but we cannot rule out that there is a change in the wall recombination coefficient that depends upon the interaction of plasma with the surface which could shift the above kinetic scheme towards higher electron number densities.
It has been previously reported in work on both capacitively and inductively coupled plasma that the number density of O− increases with increasing pressure at low pressures (below ca. 20 mTorr) before decreasing as the pressure increases further [69, 70]. This has been widely justified by considering the relative importance of O− loss processes under different pressure regimes. At low pressure O− loss is thought to be dominated by ion-ion recombination and by electron detachment: referred to as a recombination-dominated plasma. At high pressures the losses are dominated instead by associative detachment with O and reactions with other neutral species (O2 X, a and b states have all been reported to be important): referred to as a detachment-dominated plasma [2, 51, 53, 69, 70]. It has been noted by Lieberman and Lichtenberg [71] that the maximum in O− number density corresponds to the recombination–detachment transition for a given plasma power, and this has been previously found from experimental data to occur at around 20 mTorr [69, 70]. It is evident from our data that the transition pressure for our system is significantly lower. This can be attributed to the aluminium chamber employed in this work as opposed to the stainless steel chambers used in most experimental and modelling work. As we have reported, the surface recombination probability of oxygen atoms, γ, for our system is significantly smaller than those reported for stainless steel [72]. The critical pressure at which the recombination–detachment transition occurs was found by Gudmundsson [53] to decrease with decreasing γ. This is because decreasing γ increases the equilibrium atomic oxygen number density and hence associative detachment with O continues to be a dominant O− loss process down to lower pressures than for the situation with higher recombination probability γ. For a power of 300 W and a recombination probability of 0.5, Gudmundsson [53] predicted that the critical transition pressure was in the range 4–7 mTorr; from this it would be expected that our chamber (with small γ) would undergo the recombination–detachment transition below 4 mTorr, and so it is not observed. We can verify this prediction by considering the same processes as Toneli et al [51] in order to gauge the relative strengths of the processes involved in the recombination and detachment regimes, but using the measured/inferred values of species found in this work (and two reasonable assumptions that [O2(a)] = 5% of the total number density, and [O2+] = ([O−] + [e−])). We find that detachment processes show a maximum in their rate at around 20 mTorr (associative detachment dominates; in good agreement with Toneli et al), and while the rate of recombination processes all increase as pressure is lowered, even at 10 mTorr where recombination is fastest for the conditions probed here, the most important recombination processes (ion recombination involving O2+) are still at least an order of magnitude slower than those for detachment (we calculate that in our device at 300 W and 10 mTorr, the rates for detachment (O− + O(3P)) and recombination (O− + O2+) are 2.7 × 1014 cm−3 s−1 and 6.7 × 1012 cm−3 s−1, respectively).
As discussed above, the number density of atomic oxygen that we measure is consistent with model EEDFs and the material properties of our chamber, and facilitate reasonable estimation of the electron number densities, [e−]. Combining these calculations with measurement of the O− density allows us to estimate how the ratio [O−]/[e−] varies with pressure: this ratio changes from 5 to 1.3 as the pressure increases from 20 to 100 mTorr. Reported predictions of the [O−]/[e−] ratio vary in the literature. For example, Gudmundsson [53] predicts changes between 0.5 and 1 from 10 to 100 mTorr at 300 W, and Kiehlbauch and Graves [3] similar values; while for the typical electron densities inferred from this work, Corr et al [70] suggest [O−]/[e−] = ∼3 and Katsch et al [73] find [O−]/[e−] >10, but where atomic oxygen densities are lower than those reported here. Indeed, while we are confident that the photodetachment measurement of O− is robust it seems difficult to reconcile the large O− concentration, particularly at lower pressures, with the absolute O(3P) measurements and the reasonable electron number densities inferred from the O(3P) measurements in corroboration with the EEDF predictions. The inconsistency principally lies in balancing the production rate for O− with the loss mechanism for O− through associative detachment with O(3P). For example, combining the predicted EEDF, [e−] and the cross-sections for DEA reported by Laporta et al [65], and augmenting them to account for an estimated 15% of the molecular population being partitioned as electronic excitation, O2(a1Δg + b1Σg+), yields a DEA rate coefficient of ∼6.3 × 10⁻¹¹ cm3 s−1 at 20 mTorr (we note that the DEA from O2(a1Δg) is ∼4.7 times larger than for O2(X) [74], and as seems usual in these cases O2(b) is treated the same, but with a lower threshold). An associative detachment rate coefficient of ∼2 × 10⁻¹⁰ cm3 s−1 [75] therefore requires [O−] < 1.9 × 109 cm−3, while we measure 1.2 × 1010 cm−3; adding other O− removal mechanisms only adds to this discrepancy. However, the equivalent limit at 100 mTorr is [O−] < 2 × 109 cm−3, which is much more in line with our [O−] measurement for this pressure. One possible resolution is to invoke some augmentation of the DEA production rate, and we note that others have done this in order to explain large O− concentrations in discharge systems. In particular, Ding et al [76] required DEA to high lying Rydberg states of O2 in order to explain the observed enhancement of negative ions in an oxygen discharge afterglow, a prerequisite being large DEA cross-sections available to low energy electrons in the afterglow. Similarly, Wagner and Katsch [77] infer the presence of either Rydberg or metastable O2 in their pulsed rf discharge. An alternative in our plasma could be DEA of O2 (b1Σg+) which should proceed efficiently via the O2− (2Σu+) state, although this requires electrons of relatively high energy (∼> 11 eV) and so we estimate that the DEA cross-sections would have to be ∼50 times larger than for DEA through the (usual) O2− (2Πu) configuration in order to provide the necessary enhancement to the DEA rate coefficient.
Conclusions
Diode laser based cavity ringdown spectroscopy on the 1D ← 3P transition has been used to probe the two most populated spin–orbit levels (J = 2, 1) of atomic oxygen produced in a low pressure ICP of molecular oxygen. The relative populations of the spin–orbit levels are consistent with the electronic temperature of the spin–orbit manifold being the same as the translational temperature, the latter determined from the Doppler width of each spectroscopic transition. The determination of an electronic temperature then allows the total concentration of atomic oxygen in its electronic ground state to be calculated; over the pressure range 10–100 mTorr the total atomic density is at least 20% of the total gas number density and reaches a maximum of 30.4% at 20 mTorr. The prevalence of these high concentrations is a consequence of the material properties of the (mostly) aluminium plasma chamber; time-resolved CRDS measurements corroborate that wall loss is the dominant loss mechanism for oxygen atoms with surface loss probabilities, γ < 5 × 10⁻³ over the pressure range 50–100 mTorr. Using the measured atomic concentrations in combination with literature/calculated electronic energy distribution functions, we infer physically reasonable electron densities of ∼2 × 109 cm−3.
In addition, by making CRDS measurements off-resonance we are able to probe the photodetachment of O− and thereby quantify the O− number density; assuming no other contributions to the non-resonant absorption we infer that the maximum O− number density is 1.6 × 1010 cm−3 at 10 mTorr and decreases to 2 × 109 cm−3 at 100 mTorr. The inverse pressure dependence of the O− number density is characteristic of a discharge which is operating above the recombination–detachment transition. We also conclude that O− is the dominant negative charge carrier in the plasma: [O−]/[e−] changes from 5 to 1.3 as the pressure increases from 20 to 100 mTorr. We note, however, that it is difficult to get quantitative agreement between experiment and theory when considering [O−] at low pressures and highlight the necessity of increasing the rate of production via DEA to both ground and electronically excited states of O2. Finally, it is hoped that these quantitative measurements on important atomic and ionic species will allow kinetic models of these technologically important plasmas to be refined. Although fragmentary measurements have been reported in the past, a comprehensive set of measurements on all the important species is overdue. Combined with reliable electron density measurements through techniques such as microwave interferometry that are robust in the presence of negative ions, the absolute, sensitive and calibration free nature of CRDS will lead to a more precise understanding of these low pressure plasma regimes and competing processes such as recombination and detachment.
Acknowledgments
The authors would like to acknowledge the UK Engineering and Physical Sciences Research Council (EPSRC) for support provided within the standard research scheme (grant number EP/P026621/1) and Lam Research Corporation (US) for a gift award. SDAR would like to thank the Clarendon fund for the award of a graduate scholarship. Finally we would like to acknowledge Professor Gus Hancock for his critical reading of this manuscript.