


1 Introduction
Ontology alignment plays a vital role in the interconnection of different ontologies representing the same concepts. Due to its diverse applicability, ontology alignment has been greatly considered in many research; thus, plenty of alignment systems are available in the literature.
Ontology alignment is the process of matching the concepts of one ontology to those of the other one, which is usually reliant on several similarity metrics (Shvaiko & Euzenat, Reference Shvaiko and Euzenat2005). The metrics are usually categorized into three classes: string, linguistic, and structural. The string-based metrics gauge the sameness of the label of two concepts, while the linguistic similarity metrics measure the similarity of labels using an external dictionary (or background knowledge), such as WordNet (Miller, Reference Miller1995). The structural similarity is also computed based on the positions of two concepts in their ontologies. Since these metrics calibrate the similarity from various angles, the existence of conflicts and disagreement among them are inevitable. Thus, there is an essence of having a matching strategy to reach a compromise/consensus among various similarity metrics (Otero-Cerdeira et al., Reference Otero-Cerdeira, Rodríguez-Martínez and Gómez-Rodríguez2015).
One of the salient strategies for aligning ontolgoies is the evolutionary algorithms (EAs). There have been a plethora of systems using EA-related techniques (Wang et al., Reference Wang, Ding and Jiang2006; Martinez-Gil et al., Reference Martinez-Gil, Alba and Aldana-Montes2008; Bock & Hettenhausen, Reference Bock and Hettenhausen2012; Marjit & Mandal, Reference Marjit and Mandal2012; Martínez-Romero et al., Reference Martínez-Romero, Vázquez-Naya, Nóvoa, Vázquez and Pereira2013; Acampora et al., Reference Acampora, Ishibuchi and Vitiello2014; Semenova & Kureychik, Reference Semenova and Kureychik2016). However, most of them are not applicable to the real-world situation, since they require the reference alignment, or a part of it, to develop their systems (Martinez-Gil et al., Reference Martinez-Gil, Alba and Aldana-Montes2008; Martínez-Romero et al., Reference Martínez-Romero, Vázquez-Naya, Nóvoa, Vázquez and Pereira2013; Acampora et al., Reference Acampora, Ishibuchi and Vitiello2014; Xue et al., Reference Xue, Liu, Tsai, Zhan and Ren2015).
There are also other EA-based alignment systems which do not require the reference alignment. These systems are typically based on the population-based EAs, mostly genetic algorithm (Wang et al., Reference Wang, Ding and Jiang2006; Martinez-Gil et al., Reference Martinez-Gil, Alba and Aldana-Montes2008; Xue et al., Reference Xue, Liu, Tsai, Zhan and Ren2015), and particle swarm optimization (Bock & Hettenhausen, Reference Bock and Hettenhausen2012; Marjit & Mandal, Reference Marjit and Mandal2012; Semenova & Kureychik, Reference Semenova and Kureychik2016), which are implemented in a way that they are of high time and memory complexity. This is due to the fact that population-based EAs need to generate a large population in order to converge to the optimal solution. On top of that, the employed techniques suffer from multiple drawbacks such as the premature convergence.
Aside from those pitfalls, the existing EA-based alignment systems use simple string similarity metric with no preprocessing. However, the importance of preprocessing has been highlighted in recent research (Cheatham & Hitzler, Reference Cheatham and Hitzler2013). Even for some of these systems, the structural similarity has been completely ignored (see Wang et al., Reference Wang, Ding and Jiang2006 for instance), which makes them applicable to the situation where only lexical heterogeneity is present.
The proposed system, simulated annealing-based ontology matching (SANOM)Footnote 1, uses the simulated annealing (SA) (Metropolis et al., Reference Metropolis, Rosenbluth, Rosenbluth, Teller and Teller1953) as the principal technique to discover the alignment of two given ontologies. SA has several inherent properties; it is time- and memory-efficient since it only operates on one single state (and does not need a population), and it escapes the local optima and converges to the global optimal solution. Aside from that, the system has a complete preprocessing, a new string similarity metric, and a complete adaptation of the SA for the ontology alignment. Also, the SA is expedited using a warm initialization based on a greedy algorithm. SA network aligner (SANA) is a method for network alignment, which is a similar problem to ontology matching. However, SANOM is different from that in network alignment in many aspects. First and foremost, the fitness function of SANOM is thoroughly different from that of SANA. SANOM computes concept name similarity by extending Soft term frequency–inverse document frequency (TF-IDF) with two base similarity metric, one for measuring the string similarity and the other for computing the linguistic relatedness. Another crucial difference is in computing structural similarity, where SANA treats all entities, such as classes, data, and object properties, in a similar way, while SANOM defines different structural similarity for different types of entities. In addition, a greedy algorithm is particularly designed for initialization to accelerate the convergence of SANOM, while SANA starts with a random solution.
To the best of our knowledge, MapPSO (Bock & Hettenhausen, Reference Bock and Hettenhausen2012) has been the only EA-based alignment system which participated in the ontology alignment evaluation initiative (OAEI) (Bock et al., Reference Bock, Liu and Hettenhausen2009, Reference Bock, Dänschel and Stumpp2011). Thus, SANOM is the second EA-based system participated in the OAEI (Mohammadi et al., Reference Mohammadi, Atashin, Hofman and Tan2017). SANOM has been further transitioned to the HOBBIT evaluation platform and has participated in the OAEI 2018. In comparison to the OAEI 2017 results, SANOM has been significantly improved and is the top-performing system, along with AggreementMakerLight (AML), in the conference track. The experimental results of SANOM on the HOBBIT platform are reported in this article, and it is compared with other participating alignment systems in the OAEI 2018.
The remainder of this article is structured as follows. Section 2 is dedicated to the preprocessing steps implemented in SANOM along with the similarity metrics used for alignment. It is then followed by the adaption of the SA to solve the ontology matching problem. Section 3 reviews the properties of the HOBBIT evaluation platform, and Section 4 contains the results of SANOM on the anatomy, conference, and disease and phenotype tracks on the HOBBIT platform, and the results are statistically compared with the competing systems. Finally, the paper is concluded in Section 5.
2 Matching ontologies using SA
SANOM comprises several modules to find the alignment of given ontologies. First, the ontologies are parsed using OWL API (Horridge & Bechhofer, Reference Horridge and Bechhofer2011), and then the concepts undergo a complete preprocessing stage. After the preprocessing, a greedy algorithm is applied to find a reliable solution for SANOM to start with. Next, the initial solution along with the concepts of ontologies is given to the SA to find the alignment. SA requires a fitness function, for which SANOM uses several similarity metrics. In the following, the components of SANOM are explained in more detail.
2.1 Similarity metrics and preprocessing strategies
SANOM takes advantages of the well-known SA to discover the shared concepts between two ontologies in question (Mohammadi et al., to appear). A potential alignment is modeled as a state in the SA whose evolution would result in a more reliable matching between ontologies. The evolution requires a fitness function in order to gauge the goodness of the intermediate solutions to the ontology matching problem. We first define the fitness of an alignment.
Definition 1 (Fitness). The fitness of an alignment A, shown as F(A), between ontologies O and Oʹ is the aggregate fitness of its correspondences and is defined as
 \begin{align*}F(A) = \sum_{c \in A}\, f(c),\end{align*}
where  $f: A \rightarrow R$
is the fitness of correspondence
$f: A \rightarrow R$
is the fitness of correspondence  $c\in A$
.
$c\in A$
.
To compute the fitness of an alignment, we need to compute the fitness of its correspondences. There are two ways of computing such fitness. The first approach is to consider the names (e.g., URI, label, comments) of the entities in question and calculate a similarity measure. SANOM distinguishes the similarity between classes and properties and consequently uses different methods.
Another class of similarity computation is structural, where the positions of entities in their ontologies are used for similarity computation. Overall, the fitness of a correspondence is computed as the sum of sting and structural similarity metrics, that is,  $f(c) = f_{\rm lexical}(c) + f_{\rm strucutural}(c)$
, where
$f(c) = f_{\rm lexical}(c) + f_{\rm strucutural}(c)$
, where  $f_{\rm lexical}(c)$
and
$f_{\rm lexical}(c)$
and  $f_{\rm strucutural}(c)$
are the string and structural metrics, respectively.
$f_{\rm strucutural}(c)$
are the string and structural metrics, respectively.
Prior to introducting the similarity metrics, a preprocessing step is employed that has been shown to improve the quality of alignment (Cheatham & Hitzler, Reference Cheatham and Hitzler2013).
2.1.1 Preprocessing procedure
The cleaning of strings before the similarity computation is essential to increase the chance of mapping entities. SANOM uses the following preprocessing techniques to this end:
Tokenization. It is quite common that the terminology of concepts is constructed from a bag of words (BoW). The words are often concatenated by white space, the camel case of first letters, and several punctuation such as ‘
 $-$
’ or ‘
$\_$
’. Therefore, they need to be broken into individual words and then the similarity is computed by comparing the BoW together.
$-$
’ or ‘
$\_$
’. Therefore, they need to be broken into individual words and then the similarity is computed by comparing the BoW together.Stop word removal. Stop words are typical words with no particular meaning. The stop words should be detected by searching the tokens (identified after tokenization) in a table containing all possible stop words. The Glasgow stop word list is utilized in the current implementationFootnote 2.
Stemming. Two entities from the given ontologies might refer to a similar concept, but they are named differently due to various verb tense, plural/singular, and so forth. Therefore, one needs to recover the normal words so that the similar concepts will have higher similarity. The Porter stemming method is used for this matter (Porter, Reference Porter1980).


2.1.2 Lexical similarity metric
After the preprocessing step, the strings of two concepts can be given to a similarity metric in order to calibrate their degree of similarity. The base similarity metric computes the sameness of tokens obtained from each entity. The current version of SANOM takes advantage of Soft TF-IDF (Cohen et al., Reference Cohen, Ravikumar and Fienberg2003) with two base similarity measure. The similarity of two given tokens is then computed as the maximum similarity of two base metrics. One of this similarity metric is for sole comparison of labels and the other one is to calculate the linguistic relation of the given names. These similarity metrics are as follows:
Jaro–Winkler metric. The combination of TF-IDF and Jaro–Winkler is popular (Cohen et al., Reference Cohen, Ravikumar and Fienberg2003) and has shown promising performance in ontology alignment as well (Cheatham & Hitzler, Reference Cheatham and Hitzler2013). Similarly, SANOM uses Jaro–Winkler with the threshold
$0.9$
as one of the base similarity metrics.WordNet-based metric. The linguistic difference between concepts is also prevalent in may circumstances. Hence, the existence of a measure to compute the linguistic similarity of two entities is of the essence. In the current version of SANOM, the linguistic relatedness of tokens is obtained by the Wu and Palmer measure (Wu & Palmer, Reference Wu and Palmer1994) and is used as a base similarity metric for the Soft TF-IDF with the threshold 0.95.

2.1.3 Structural similarity metric
The foregoing similarity metrics yields high score to the concepts with a high lexical likeness. Another similarity of two concepts can be obtained based on their positions in the given ontologies.
We consider two structural similarity metrics for the current version of SANOM:
The first metric is obtained by the subsumption relation of classes. Let
$O_1$
and
$O_2$
are two ontologies, and
$c_1 \in O1$
and
$c_2 \in O2$
are two classes whose superclasses are
$s_1 \in O1$
and
$s_2 \in O2$
, then the aligning of classes
$s_1$
and
$s_2$
would increase the chance of matching
$c_1$
and
$c_2$
. If s is a correspondence mapping
$s_1$
to
$s_2$
, then the increased similarity of
$c_1$
and
$c_2$
is gauged by


 \begin{align}f_{\rm structural}(c_1,c_2) = f(s).\end{align}
Another structural similarity is calculated from the object and data properties. The alignment of two properties would indicate the fact that their corresponding domain and/or ranges are also identical. By the same token, if two properties have the similar domain and/or range, then the chance that they match as well increases.
A recent study (Cheatham & Hitzler, Reference Cheatham and Hitzler2014) has investigated that the mapping of properties based solely on their names would lead to both high false-positive and false-negative rates. Following the recommendation of Cheatham and Hitzler (Reference Cheatham and Hitzler2014), we further use the core concept of the properties as one of their names.
The current version of SANOM treats the object and data properties differently. For the object properties  $op_1$
and
$op_1$
and  $op_2$
, their related domains and ranges are obtained as the appending their set of ranges and domains, respectively. Then, Soft TF-IDF computes the similarity of their names, domains, and ranges. The final similarity of two properties is then taken as the average of top two fitness scores obtained by Soft TF-IDF. The fitness of data properties is also calculated as the similarity average of names and their corresponding domains.
$op_2$
, their related domains and ranges are obtained as the appending their set of ranges and domains, respectively. Then, Soft TF-IDF computes the similarity of their names, domains, and ranges. The final similarity of two properties is then taken as the average of top two fitness scores obtained by Soft TF-IDF. The fitness of data properties is also calculated as the similarity average of names and their corresponding domains.
On the other hand, mapping properties would increase the chance of mapping their related classes. Let  $e_1$
and
$e_1$
and  $e_2$
be classes,
$e_2$
be classes,  $op_1$
and
$op_1$
and  $op_2$
be the object properties, and
$op_2$
be the object properties, and  $R_1$
and
$R_1$
and  $R_2$
be the ranges, then the fitness of the correspondence
$R_2$
be the ranges, then the fitness of the correspondence  $c = (e_1,e_2)$
is obtained as
$c = (e_1,e_2)$
is obtained as
 \begin{align}f_{\rm structural}(c) = \frac{f_{\rm string}(R_1,R_2) + f_{\rm string}(op_1,op_2)}{2}.\end{align}
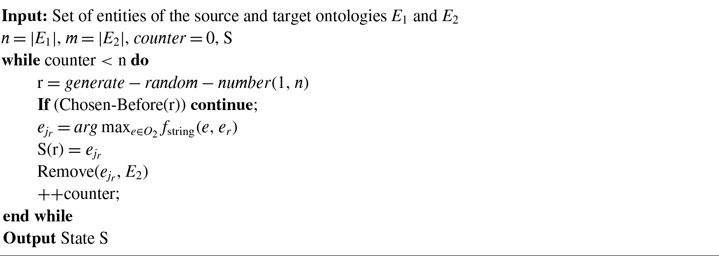
2.2 Warm initialization
Since the SA operates on one single state only, the speed of its convergence could be quite low. A good initial state would pave the way of fast convergence. To this end, a randomized greedy algorithm is used to find a near-optimal solution as the initial state. A random number r in the interval [1, n] is selected, and the corresponding element in that position is chosen. Afterward, the entity  $e_r$
is matched with the entity
$e_r$
is matched with the entity  $e_{j_r}$
, where
$e_{j_r}$
, where  $e_{j_r}$
is the most similar entity to
$e_{j_r}$
is the most similar entity to  $e_r$
. The procedure is iterated until the last concept of the first ontology finds a corresponding mapping in the second. This method is evidently greedy and not optimal, but it can provide a good starting point for the SA.
$e_r$
. The procedure is iterated until the last concept of the first ontology finds a corresponding mapping in the second. This method is evidently greedy and not optimal, but it can provide a good starting point for the SA.
Algorithm 1 is the complete procedure of this greedy technique, which also takes into account the one-to-one mapping constraints.
Algorithm 1 Randomized greedy technique for initialization (Mohammadi et al., to appear)
2.3 SA adaptation
To find the optimal solution, the SA needs to move to a new state with higher fitness values. One needs to first devise a methodology to create a new state, called successor, and then transition to it based on the underlying idea of the SA.
In the following, the successor creation and transition to a new state are discussed.
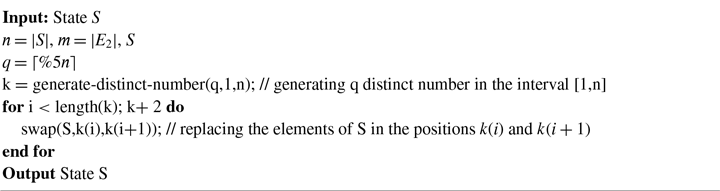
2.3.1 Successor generation
A successor is created by swapping the elements of the current state. In the current version of SANOM, we swap q elements of the current state, where  $q = \lceil \%5 * |S|\rceil$
and
$q = \lceil \%5 * |S|\rceil$
and  $|S|$
is the length of the current state. The alteration of elements is done by first finding q distinct number between 1 and n, called k, and then exchanging the elements s(k(i)) and
$|S|$
is the length of the current state. The alteration of elements is done by first finding q distinct number between 1 and n, called k, and then exchanging the elements s(k(i)) and  $s(k(i+1))$
where i is an index. Algorithm 2 summarizes the procedure of creating a successor based on the current one.
$s(k(i+1))$
where i is an index. Algorithm 2 summarizes the procedure of creating a successor based on the current one.
Algorithm 2 Generating successors of the current state (Mohammadi et al., to appear)
2.3.2 Transition
The transition to a new state is probabilistic in the SA. If the fitness value of the successor is bigger than that of the current state, then the move to the successor certainly happens. Otherwise, the move is reliant on the fitness value difference between two states and the temperature. Let S and Sʹ be the current state and successor while the temperature is T, and f(S) and f(Sʹ) be their corresponding fitness value. Thus, the probability to transition to Sʹ is
 \begin{align}P_{\rm move} = \rm min\left(e^{\frac{\Delta E}{T}},1\right),\end{align}
where 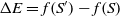 $\Delta E = f(S') - f(S)$
. If
$\Delta E = f(S') - f(S)$
. If  $\Delta E > 0$
, then the move to the next state certainly happens since
$\Delta E > 0$
, then the move to the next state certainly happens since  $P_{\rm move} = 1$
. If
$P_{\rm move} = 1$
. If  $\Delta E < 0$
, then the transition happens with the probability
$\Delta E < 0$
, then the transition happens with the probability  $P_{\rm move} < 1$
, where
$P_{\rm move} < 1$
, where  $P_{\rm move}$
is proportionate to
$P_{\rm move}$
is proportionate to  $\Delta E$
and
$\Delta E$
and  $\frac{1}{T}$
.
$\frac{1}{T}$
.
2.4 SANOM
SANOM starts with calculating the similarity of each concept of the first ontology to those in the second. Then, an initial alignment is obtained by the greedy technique in Algorithm 1. The initial alignment is then enhanced by the SA by generating a new state, computing its fitness, and then moving to it. Such an enhancement is repeated for some number of iterations.
The number of iterations is a parameter determined by the user. The temperature used in each iteration of SANOM can be computed merely based on the number of iterations. Given the number of iterations  $k_{\rm max}$
and the initial temperature t (by default
$k_{\rm max}$
and the initial temperature t (by default  $t=1$
), the temperature at the iteration k is obtained as
$t=1$
), the temperature at the iteration k is obtained as
 \begin{align*}t_k = \left(1 - \frac{k}{k_{\rm max}}\right)t.\end{align*}
The overall ontology matching algorithm is summarized in Algorithm 3.
Algorithm 3 SANOM (Mohammadi et al., to appear)

3 HOBBIT platform
As of 2018, the major tracks of the OAEI have been immigrated to the HOBBIT platform, which is generic, modular, and distributed platform for Big Linked Data systems (Jimenez-Ruiz et al., Reference Jimenez-Ruiz2018). It was originally developed to facilitate practitioners and users of Link Data to benchmark their datasets and systems at scale.
The platform supports (Jimenez-Ruiz et al., Reference Jimenez-Ruiz2018):
Registering a new system: user can add a new system to the platform by creating a docker image of the corresponding alignment system and using a system adapter which could be viewed as a proxy between the system and the benchmark to operate on.
Adding a new benchmark: it is also possible to add a benchmark to the platform so that the systems can solve the related benchmark.
Benchmarking a system: after registering systems and benchmarks, one can simply select a benchmark and then apply a registered system to solve it. It is also possible to compare various systems on a benchmark with the defined performance metrics.
The OAEI tracks are already added as benchmarks to the HOBBIT platform by the organizers. Thus, We only needed to add SANOM to this platform by creating a docker image and a system adapter. Then, the evaluation and comparison could simply be made through the platform.
4 Experimental results
This section contains the results obtained by SANOM in the OAEI 2018 on the anatomy, conference, and disease and phenotype tracks. We first report precision, recall, and F-measure of various participating systems in the OAEI, and results are then compared based on the statistical methods (Mohammadi et al., Reference Mohammadi, Atashin, Hofman and Tan2018a, Reference Mohammadi, Hofman and Tan2018b).
4.1 Anatomy track
The anatomy track is one of the earliest benchmarks in the OAEI. The task involves aligning the Adult Mouse anatomy and a part of National Cancer Institute thesaurus containing the anatomy of humans. Each of the ontologies has approximately 3000 classes that are designed carefully and are annotated in technical terms.
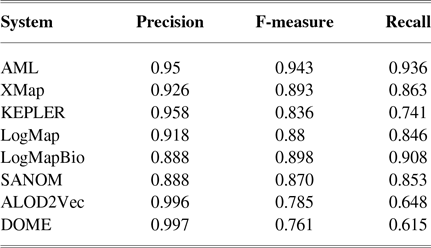
MapPSO was applied to the anatomy track, but its generated alignment had precision and recall of less than 0.05. Thus, we do not compare SANOM with MapPSO in this track. The best-performing systems in this track use biomedical background knowledge, where the top system is AML (Faria et al., Reference Faria, Balasubramani, Shivaprabhu, Mott, Pesquita, Couto and Cruz2017). Among other systems, LogMap (Jiménez-Ruiz & Grau, Reference Jiménez-Ruiz and Grau2011) is the best one with no use of background knowledge.
Table 1 tabulates precision, recall, and F-measure of the participating systems in the anatomy track. Since LogMap does not use any biomedical background knowledge, the performance of SANOM could be impartially compared with it. According to this table, the recall of SANOM is slightly higher than LogMap which means that it could identify more correspondences than that of LogMap. However, precision of LogMap is better than that of SANOM with the margin of 3%. The overall performance of SANOM is quite close to LogMap since their F-measure has only 1% difference.
Table 1 The precision, recall, and F-measure of the participating systems in the OAEI anatomy track
In addition, the systems are compared based on McNemar’s test, and the outcome of the test is visualized using a directed graph (Mohammadi et al., Reference Mohammadi, Atashin, Hofman and Tan2018a). In this regard, every two systems could be paired, and the McNemar’s test can be applied to verify if two systems are significantly different. There are two ways of using McNemar’s test for comparison. The first approach is to ignore the false positives generated by each of the methods. Figure 1 displays the directed graph from comparing the participating systems with ignoring false positives. The nodes in this graph are the participating systems, and each edge  $A\rightarrow B$
indicates that the system in origin is significantly better than that at the other end. Based on this graph, AML is the best-performing system and is followed by LogMapBio and XMap. SANOM has also outperformed LogMap in this case, which could also be justified based on recall of the two systems.
$A\rightarrow B$
indicates that the system in origin is significantly better than that at the other end. Based on this graph, AML is the best-performing system and is followed by LogMapBio and XMap. SANOM has also outperformed LogMap in this case, which could also be justified based on recall of the two systems.
The second way of using the McNeamr’s test is to consider the false positives as well. Figure 2 displays the resulting directed graph from the comparison of each two systems with considering false positive. In this case, AML has the best performance again, but XMap outperforms LogMapBio in contrast to the case that false positives are ignored. LogMap is also better than SANOM in this respect.
Figure 3 plots the fitness function value, precision, and recall curve for different iterations of SANOM for the anatomy track. According this figure, the fitness value is in aggregate increasing, although there are some drops as well that get back to the nature of SA in moving to states with lower fitness values. Precision is higher at the beginning and it decreases during the SANOM iterations. This is because the initial alignment is conservative and precision is high as expected, as well as the fact that EAs evolve randomly that potentially increase the false positives. In terms of recall, in contrast, the quality of alignment has been significantly improved. This corroborates the effectiveness of SA.

Figure 1 The comparison of participating systems in the OAEI 2018 anatomy track based on the McNemar’s test with considering false positives. The nodes in the graph are the participating systems, and each directed edge  $A \rightarrow B$
means that A is superior to B
$A \rightarrow B$
means that A is superior to B
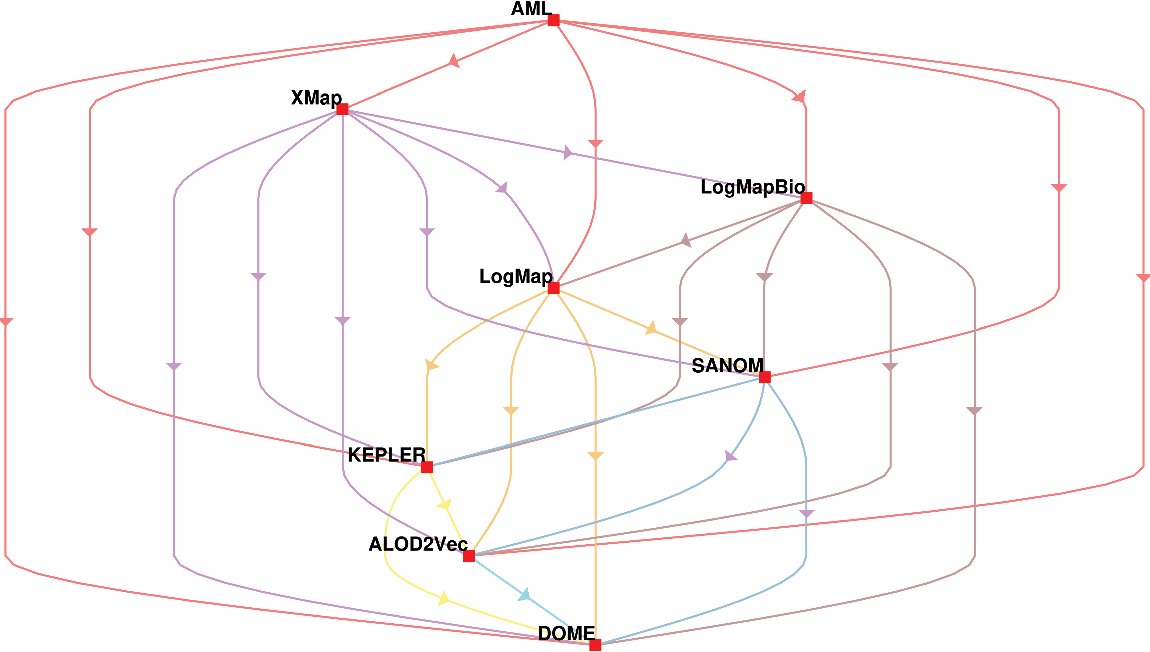
Figure 2 The comparison of participating systems in the OAEI 2018 anatomy track based on the McNemar’s test while the false positives are ignored. The nodes in the graph are the participating systems, and each directed edge  $A \rightarrow B$
means that A is superior to B
$A \rightarrow B$
means that A is superior to B

Figure 3 Precision, recall, and fitness function value computed by generated alignments in different iterations for the anatomy track. In order to be able to display with the fitness function, precision and recall are multiplied by 10
4.2 Conference track
The conference track involves the pairwise alignment of seven ontologies. Table 2 shows precision, recall, and F-measure of SANOM, LogMap, and AML (Faria et al., Reference Faria, Balasubramani, Shivaprabhu, Mott, Pesquita, Couto and Cruz2017), and MapPSO (Bock & Hettenhausen, Reference Bock and Hettenhausen2012) on the conference track. AML and LogMap have been the top two systems in terms of precision and recall for several years.
According to Table 2, recall of SANOM is superior to both LogMap and AML. SANOM’s average recall is 7% and 14% more than those of AML and LogMap, respectively, but its precision is 10% less than both of the systems. In addition, SANOM significantly outperforms MapPSO in terms of precision, recall, and F-measure. To show that SANOM is much faster than MapPSO, we compare these system based on execution time on the conference track. Table 3 displays the execution time of SANOM and MapPSO for 21 tasks in the conference track. In sum, MapPSO completed all 21 tasks in 747 seconds, while SANOM completed them in 58 seconds. Thus, SANOM is not only superior to MapPSO in terms of precision, recall, and F-measure, but it also identifies the alignment much faster compared to MapPSO.
We also conducted the Wilcoxon signed-rank test recommended in Mohammadi et al., (Reference Mohammadi, Hofman and Tan2018b) to verify if the difference between systems is significant. Based on this analysis, SANOM is significantly different from AML and LogMap in terms of recall and is statistically better than LogMap regarding F-measure. The F-measure of SANOM is not statistically different form AML. In addition, SANOM is significantly superior to MapPSO with respect to precision, recall, and F-measure. Overall, the performance of SANOM is quite competitive with the top-performing systems in the conference track.
4.3 The disease and phenotype track
We also applied SANOM to the OAEI disease and phenotype track (Harrow et al., Reference Harrow, Jiménez-Ruiz, Splendiani, Romacker, Woollard, Markel, Alam-Faruque, Koch, Malone and Waaler2017) that consists of matching various disease and phenotype ontologies. For this experiment, we consider the alignment of the human phenotype (HP) to the mammalian phenotype (MP), and the human disease ontology (DOID) and the orphanet and rare diseases ontology (ORDO). Since these ontologies have approximately 15 000 entities, the alignment is challenging. MapPSO could not find the alignment of ontologies in this track within more than 24 hours. Thus, we omit it for comparison in this experiment. For the reference alignment, we use a voted alignment that was created based on the outputs of the alignment systems in last few years.
Fewer systems could generated an alignment in this track. The participating systems in this track use biomedical background knowledge: LogMap uses normalizations and spelling variants the SPECIALIST Lexicon, XMAP uses a dictionary of synonyms extracted from the Unified Medical Language System Metathesaurus (Bodenreider, Reference Bodenreider2004), and AML has three background resources, one of which is selected automatically (Faria et al., Reference Faria, Pesquita, Santos, Cruz and Couto2014). However, SANOM does not use any background knowledge specifically for biomedical ontologies.
Table 2 The precision, recall, and F-measure of SANOM, AML, and LogMap on various datasets on the conference track. The highest score of each performance metric for each task is in boldface
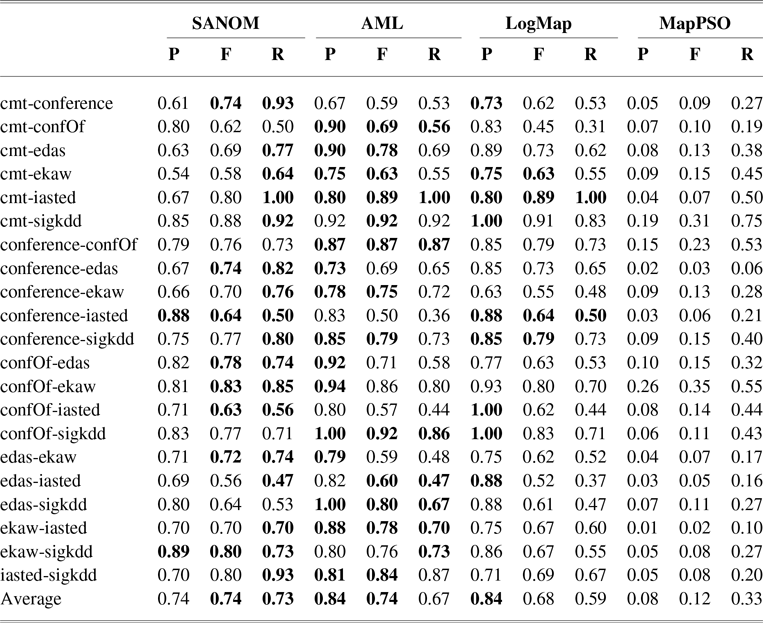
Table 3 Execution time of SANOM and MapPSO on 21 tasks in the conference track
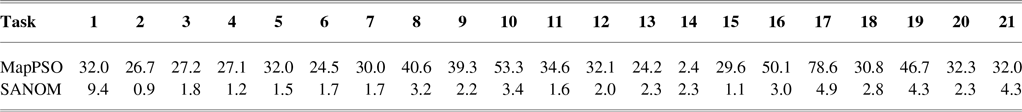
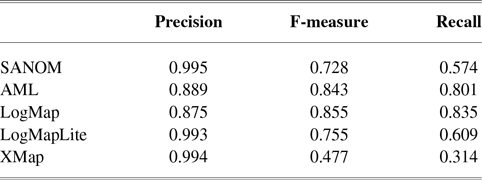
Table 4 shows the result of alignment systems for matching DOID to ORDO. Based on this table, SANOM outperforms AML, LogMap, and XMap in terms of precision and is competitive with LogMapLite. Concerning recall, in contrast, AML and LogMap have better alignments, and SANOM outperforms XMap and is comparable to LogMapLite. In terms of F-measure, LogMap is superior in this track, followed by LogMapLite and SANOM. Overall, SANOM outperforms XMap and AML, even though it does not use any biomedical background knowledge.
Table 5 tabulates the performance of systems for HP and MP matching. With regard to precision, SANOM outperforms all systems in this task. LogMap and AML are the top two systems in terms of recall, and SANOM outperforms XMap and is comparable to LogMapLite in this regard. In terms of F-measure, LogMap and AML are the best systems, followed by LogMapLite and SANOM.
5 Conclusion
SANOM has participated in three OAEI competitions. The current version of SANOM has been significantly improved, and its result on anatomy, conference, and disease and phenotype tracks are quite competitive with the top systems. However, SANOM is not ready yet to be applied to large-scale ontolgoies, for which there are several tracks at the OAEI. Thus, the next step for the evolution of SANOM is to prepare it for the large-scale ontologies. Further, it can be equipped with background knowledge in order for SANOM to have better results on the OAEI biomedical-related tracks.
Table 4 Performance of systems for matching DOID and ORDO ontologies
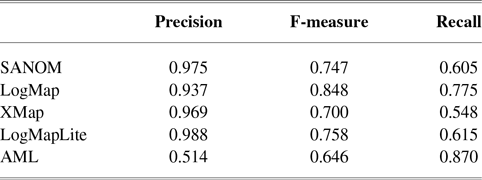
Table 5 Performance of participating systems for matching HP and MP


 Open access