


1 Introduction
The impact of liquid drops on solid surfaces is a common phenomenon in nature, and its physical understanding is fundamental for a wide variety of technical applications. Some of these cases extend from public health, climate and criminology to engineering problems, including ink-jet printing, aircraft icing, turbine performance, vehicle soiling, and coating. Comprehensive reviews of the drop impact dynamics and advances in its modelling can be found in Yarin (Reference Yarin2006), Marengo et al. (Reference Marengo, Antonini, Roisman and Tropea2011), Josserand & Thoroddsen (Reference Josserand and Thoroddsen2016), Liang & Mudawar (Reference Liang and Mudawar2016) and Yarin, Roisman & Tropea (Reference Yarin, Roisman and Tropea2017). From the plethora of events observed during the drop impact on a dry surface, the impact at high velocity remains one of the most common, fascinating and relevant events. This violent impact breaks the drop apart, ejecting many small droplets in a process called splashing. Identifying the conditions at which this phenomenon occurs and quantifying its outcome remains crucial to understand, manipulate and model many of the related technical applications. An example of this is found in the modelling of aircraft icing, where a detailed description of splashing, including the characterisation of the smallest droplets and the total ejected volume, must be taken into account to provide accurate results (Honsek, Habashi & Aubé Reference Honsek, Habashi and Aubé2008).
One of the first studies on splashing on dry surfaces was presented by Stow & Stainer (Reference Stow and Stainer1977). They demonstrated that kinetic energy, surface tension, and surface properties affect the size and number of ejected droplets. Decades later, Mundo, Sommerfeld & Tropea (Reference Mundo, Sommerfeld and Tropea1995) provided more detailed measurements on the size and velocity of these secondary droplets and proposed a composited parameter to distinguish between deposition and splashing, which depends only on the Reynolds  $Re=\unicode[STIX]{x1D70C}UD/\unicode[STIX]{x1D707}$ and Weber
  $We=\unicode[STIX]{x1D70C}U^{2}D/\unicode[STIX]{x1D70E}$ numbers. This composited parameter can be written as
  $K=Oh\,Re^{5/4}$, where
  $Oh=\unicode[STIX]{x1D707}/\sqrt{\unicode[STIX]{x1D70C}D\unicode[STIX]{x1D70E}}=\sqrt{We}/Re$ is the Ohnesorge number. This
  $K$-Parameter has been adapted over the years to provide a splashing threshold depending on different impact conditions (Moreira, Moita & Panao Reference Moreira, Moita and Panao2010). Nevertheless, the splashing of drops is a complex phenomenon that also depends on the surface properties, for example, roughness (Roisman, Lembach & Tropea Reference Roisman, Lembach and Tropea2015), porosity (Sahu et al. Reference Sahu, Sinha-Ray, Yarin and Pourdeyhimi2012), wettability (Quetzeri-Santiago et al. Reference Quetzeri-Santiago, Yokoi, Castrejón-Pita and Castrejón-Pita2019), temperature (Liang & Mudawar Reference Liang and Mudawar2017) and stiffness (Howland et al. Reference Howland, Antkowiak, Castrejón-Pita, Howison, Oliver, Style and Castrejón-Pita2016). Hence, a general prediction of splashing using the
  $K$-Parameter does not seems possible. The experiments of Xu, Zhang & Nagel (Reference Xu, Zhang and Nagel2005) demonstrated that splashing is additionally influenced by ambient gas properties and can even be suppressed by reducing air pressure. The emergence of a corona during splashing is explained by a weak shock in the air caused by the acceleration of the spreading liquid. Alternatively, a more physical explanation has been proposed by Riboux & Gordillo (Reference Riboux and Gordillo2014), who attributed splashing to the aerodynamic lift force
  $F_{L}$ on the spreading lamella. The splashing criterion within this theory is defined as
  $\unicode[STIX]{x1D6FD}=\sqrt{F_{L}/(2\unicode[STIX]{x1D70E})}$. The agreement of this latter theory with multiple experiments has influenced recent modifications that consider the drop impact on heated (Staat et al. Reference Staat, Tran, Geerdink, Riboux, Sun, Gordillo and Lohse2015), moving (Hao & Green Reference Hao and Green2017), inclined (Gordillo & Riboux Reference Gordillo and Riboux2019) or hydrophobic (Quintero, Riboux & Gordillo Reference Quintero, Riboux and Gordillo2019) surfaces.
Splashing on dry surfaces can be subdivided into three distinct regimes: corona splash, prompt splash, and receding breakup (Rioboo, Tropea & Marengo Reference Rioboo, Tropea and Marengo2001). Figure 1 demonstrates the two splashing regimes that result from impacting different liquids on the same surface. In the corona splash regime, the spreading liquid separates from the surface, forming a crown-like lamella that subsequently breaks up into secondary droplets. A number of studies focus on clarifying the mechanisms leading to the loss of stability of a rim formed at the edge of an uprising corona (Taylor Reference Taylor1959). These attempts include linear long-wave analysis of transverse rim stability (Roisman, Horvat & Tropea Reference Roisman, Horvat and Tropea2006; Krechetnikov & Homsy Reference Krechetnikov and Homsy2009; Krechetnikov Reference Krechetnikov2010; Roisman Reference Roisman2010) and numerical studies of this phenomenon (Agbaglah, Josserand & Zaleski Reference Agbaglah, Josserand and Zaleski2013; Liu & Bothe Reference Liu and Bothe2016). At later stages of the impact, the rim-bending disturbances become nonlinear and consequently form several cusps (Yarin & Weiss Reference Yarin and Weiss1995), which then become the sources of multiple finger-like jets ejected from the rim. Since the splash in this regime is governed by rim instability, the diameters of the secondary droplets correlate very well with the rim diameter (Roisman et al. Reference Roisman, Gambaryan-Roisman, Kyriopoulos, Stephan and Tropea2007). Moreover, many experiments with spray impact demonstrate that the size of the secondary droplets at high Reynolds numbers can be scaled by the thickness of the viscous boundary layer. Thus, the ratio of the diameters of the secondary to the primary drops is proportional to  $Re^{-1/2}$ (Roisman et al. Reference Roisman, Horvat and Tropea2006; Yarin et al. Reference Yarin, Roisman and Tropea2017).

Figure 1. Drop splashing at high speed on smooth dry surfaces. Panel (a) shows the impact of a water drop at  $We\approx 5000$, which leads to a prompt splash. Panel (b) shows the impact of an ethanol drop at the same Weber number inducing a corona splash. Scale bar
  $500~\unicode[STIX]{x03BC}\text{m}$.
In the prompt splash regime, the droplets are ejected from small finger-like jets directly at the surface. These jets are formed from azimuthal undulations in the free surface cusp at the early stage of impact (Thoroddsen, Takehara & Etoh Reference Thoroddsen, Takehara and Etoh2012). These undulations remain approximately constant during spreading, but they can merge or split (Thoroddsen & Sakakibara Reference Thoroddsen and Sakakibara1998). In a recent study, Li et al. (Reference Li, Thoraval, Marston and Thoroddsen2018) pointed out that this early-stage instability may be promoted by Rayleigh–Taylor instability. Rioboo et al. (Reference Rioboo, Tropea and Marengo2001) demonstrated that prompt splash can be observed on highly rough surfaces, thus indicating the major role played by the surface morphology. This latter phenomenon was studied by Tsai et al. (Reference Tsai, van der Veen, van de Raa and Lohse2010), who highlighted the effect of surface micropatterns on splashing. In particular, they demonstrated that the arrangement of the pillars affects the generation of secondary droplets. Latka et al. (Reference Latka, Strandburg-Peshkin, Driscoll, Stevens and Nagel2012) investigated the splashing on surfaces with random roughness and discovered intermediate roughness, where splashing is promoted for low viscosity liquids and inhibited for high viscosity liquids. Xu, Barcos & Nagel (Reference Xu, Barcos and Nagel2007) and Latka et al. (Reference Latka, Strandburg-Peshkin, Driscoll, Stevens and Nagel2012) attributed the differences between prompt and corona splash to high surface roughness; however, figure 1 clearly shows that both splashing regimes can occur on the same smooth surface. Palacios et al. (Reference Palacios, Hernández, Gómez, Zanzi and López2013) conducted experiments with varying liquid physical properties and identified a threshold that is based on a constant Ohnesorge number and separates prompt from corona splash at low-speed impact. They found that viscosity promotes splashing and corona formation, suggesting that the splashing regime type should depend primarily on the liquid viscosity. Several further analytical, experimental and numerical studies have been conducted to find out the mechanism that causes the production of small droplets after the drop impact (Howison et al. Reference Howison, Ockendon, Oliver, Purvis and Smith2005; Rein & Delplanque Reference Rein and Delplanque2008; Duchemin & Josserand Reference Duchemin and Josserand2011; Mandre & Brenner Reference Mandre and Brenner2012; Boelens & de Pablo Reference Boelens and de Pablo2018; Jian et al. Reference Jian, Josserand, Popinet, Ray and Zaleski2018; Moore, Whiteley & Oliver Reference Moore, Whiteley and Oliver2018). However, the conditions that separate the corona from prompt splash dynamics have not been determined yet.
The splashing on a wetted surface generates also a corona similar to that observed on dry surfaces, but this splashing is caused by the interaction of the inner spreading lamella with the unperturbed outer film and not by the aerodynamic lift force (Guo, Lian & Sussman Reference Guo, Lian and Sussman2016). Yarin & Weiss (Reference Yarin and Weiss1995) have modelled this splashing phenomenon on wetted surfaces as a propagation of a kinematic discontinuity in a liquid film. This discontinuity leads to the ejection of an uprising, expanding a rim-bound corona. Various examples of these outcomes are shown in figure 2. In the case of spray impact, the single drops interact with a non-uniform and fluctuating film at the surface (Sivakumar & Tropea Reference Sivakumar and Tropea2002). Consequently, the corona observed during spray impact is not symmetrical. The generation of secondary droplets in sprays is caused mainly by the instability of the spreading rim, as shown in figure 3. The remarkable difference in the generation of secondary droplets between the impact on dry or wetted surfaces shows that models for splashing on wetted surfaces are not applicable to the case of a dry surface.

Figure 2. Typical outcomes and splash regimes for drop impact on a liquid film: (a) deposition, (b) corona formation without splash, (c) corona splash, (d) corona splash after detachment and (e) breakup of a central jet formed after collapse of a crater. Images from Kittel, Roisman & Tropea (Reference Kittel, Roisman and Tropea2018) with permission from the American Physical Society.

Figure 3. Images of an inclined spray impacting a surface. Formation, development and collapse of a large corona. Images courtesy of Feras Batarseh, TU Darmstadt.
Characterisation of secondary droplets from sheet fragmentation after the drop impact on dry surfaces has been investigated in a wide range of experiments (Villermaux Reference Villermaux2007). Much of this effort has been made to quantify the position, size and velocity of these smallest droplets after the impact close to the edges or on small targets (Villermaux & Bossa Reference Villermaux and Bossa2011; Wang & Bourouiba Reference Wang and Bourouiba2018; Lejeune & Gilet Reference Lejeune and Gilet2019). In those cases, the secondary droplets are generated from a free expanding sheet, which emerges in the later stages of splashing beyond the surface border. Since there is no surface, almost the entire free lamella atomises, generating a larger number of droplets (Chen, Marengo & Amirfazli Reference Chen, Marengo and Amirfazli2019). Therefore, the impact close to the edges or on small targets differs from the impact on a larger target (Rozhkov, Prunet-Foch & Vignes-Adler Reference Rozhkov, Prunet-Foch and Vignes-Adler2002). In this latter case, the characterisation of splashing is a challenging problem due to the small size of the droplets, which can be of the order of a few micrometres. Xu et al. (Reference Xu, Barcos and Nagel2007) measured droplets larger than  $d>100~\unicode[STIX]{x03BC}\text{m}$ after they impacted a surrounding paper sheet and showed that air pressure in combination with surface roughness can alter the outcome of splashing. The experiments of Thoroddsen et al. (Reference Thoroddsen, Takehara and Etoh2012) revealed a size range from
  $d\sim 5$ to
  ${\sim}60~\unicode[STIX]{x03BC}\text{m}$ for prompt splash on smooth surfaces. These small droplets have probably gone unnoticed by previous authors with insufficient spatial resolution, and deposition may have been claimed erroneously. Faßmann et al. (Reference Faßmann, Bansmer, Möller, Radespiel and Hartmann2013) made use of shadowgraph techniques and captured droplets larger than
  $30~\unicode[STIX]{x03BC}\text{m}$, providing more accurate size and velocity distributions than previously available. They demonstrated than the arithmetic mean diameter decreases with increasing impact velocity, while the droplet velocities also increase. Using a similar set-up with even higher spatial resolution, Burzynski & Bansmer (Reference Burzynski and Bansmer2019) demonstrated the role of the surrounding gas on the ejection of secondary droplets in the prompt splash regime, which indicates that the size distribution of the ejected droplets is independent of the gas. They also estimated the total ejected volume and demonstrated that splashing is influenced primarily by the density, followed by viscosity, and lastly by the mean free path of the gas. Despite those efforts, a full characterisation of the secondary droplets ejected in both splashing regimes, with the inclusion of the total ejected volume, is still lacking.
Most of the current scales or models describing the various phenomena associated with drop impact have been developed on the basis of laboratory experiments at low or moderate Weber and Reynolds numbers, commonly up to 3000 and 30 000, respectively. However, in technical applications such as vehicle soiling or aircraft icing, large drops impact surfaces at much higher velocities, leading to impacts at  $We>5000$ and
  $Re>50\,000$. Despite its importance, only a few studies conducted with such high impact velocities have been published and not all of them covered the splashing phenomenon (Mehdizadeh, Chandra & Mostaghimi Reference Mehdizadeh, Chandra and Mostaghimi2004; Visser et al. Reference Visser, Tagawa, Sun and Lohse2012; Faßmann et al. Reference Faßmann, Bansmer, Möller, Radespiel and Hartmann2013; Aboud & Kietzig Reference Aboud and Kietzig2015; Cimpeanu & Papageorgiou Reference Cimpeanu and Papageorgiou2018). Garcia-Magariño, Sor & Velazquez (Reference Garcia-Magariño, Sor and Velazquez2018) investigated another phenomenon that may occur at such high impact velocity beside the splashing of drops; their study showed that large drops could deform or even break up before contact with the surface. This primarily happens with large bluff bodies or very thick aerodynamic profiles, where a large high-pressure zone is built in front of the body, causing a strong acceleration of the drops. For commonly used aerodynamic profiles in aviation with a characteristic small high-pressure zone near to the leading edge, the entire drop breakup prior impact has not been observed (Tan et al. Reference Tan, Papadakis, Miller, Bencic, Tate and Laun2007; Zhang & Liu Reference Zhang and Liu2016).
In this study, multiple high-resolution cameras are used to show and quantify the outcome of liquid drops impacting dry rigid surfaces at high Weber and Reynolds numbers. One of our objectives is to demonstrate that corona and prompt splash on smooth surfaces generate completely different secondary droplets. We provide evidence of the significant role of viscosity setting in the splashing regimes, which lets us conclude that the Reynolds number affects the splashing to a greater extent than the Weber number. Moreover, we show that the mechanism of prompt splash is well explained by the Rayleigh–Taylor instability of the accelerated lamella. This theory allows prediction of the threshold conditions for the boundary parameters of the corona and prompt splash and helps to estimate the typical time of the breakup. Finally, we make use of the theory proposed by Riboux & Gordillo (Reference Riboux and Gordillo2015) to estimate the entire outcome of the splashing and describe the size, velocity, angle and total ejected volume of the secondary droplets.
2 Experimental methods
2.1 Flywheel experiment
The experimental set-up is designed to study the impact of a single liquid drop on a solid dry surface at relatively high velocity. This velocity is achieved by high-speed motion of an impacting surface mounted on a rotating flywheel. The set-up, shown in figure 4, consists of a drop generator with a liquid supply system, an impact surface on the flywheel, and a system for observation, control and acquisition. This set-up is installed in a ventilated safety chamber.

Figure 4. Experimental method. Panel (a) shows a picture of the flywheel experiment indicating its principal components. Panels (b,c) illustrate the shadowgraph set-up used to capture the droplets before and during impact. The images show an example of the same ethanol drop  $D=2.4~\text{mm}$ impacting the surface at
  $U=6.3~\text{m}~\text{s}^{-1}$ (
 $We=3300$,
  $Re=9500$).
The drops are generated and released on demand by the droplet generator, which is similar to the system presented by Faßmann et al. (Reference Faßmann, Bansmer, Möller, Radespiel and Hartmann2013). This consists of a cage with a solenoid and a needle where the drops are formed. The difference between the system developed by Faßmann et al. (Reference Faßmann, Bansmer, Möller, Radespiel and Hartmann2013) and the one presented here lays mainly in the transportation and control of the liquid flow. While they used a syringe pump to generate the drops, we pumped the liquid to the needle from a pressurised liquid reservoir and controlled the volumetric flux using a Coriolis flow controller. This system allows the generation of drops from  $D\approx 2$ to 4 mm in diameter with a maximal standard deviation of 0.24 mm regardless of the liquid used. The drop size is controlled by the needle diameter and the amount of liquid pumped between each drop generation cycle. Our experiment has been carefully designed to use different liquids such as distilled water, ethanol and acetone. This flexibility allows us to investigate the effects of liquid viscosity, density and surface tension on the splashing outcome. Basically, we used three different drop sizes for each liquid. The largest drops were generated using water, which due to the large surface tension allowed us to generate sizes of
  $3.0\pm 0.21$,
  $3.5\pm 0.23$ and
  $4.0\pm 0.24~\text{mm}$. When using acetone and ethanol, both with lower surface tension, we generated drop sizes of
  $2.0\pm 0.17$,
  $2.5\pm 0.24$ and
  $3.0\pm 0.22~\text{mm}$. After the liquid drops are released from the needle, they fall freely due to gravity for around 80 cm while the flywheel, on which the impact surface is mounted, rotates at a constant angular velocity
  $\unicode[STIX]{x1D719}$. Previous studies on this on-demand drop generator show that the drop shape after the pinch-off oscillates for until approximately 40 cm; after that, the drops become spherical (Faßmann et al. Reference Faßmann, Bansmer, Möller, Radespiel and Hartmann2013). Using a shielding tube with a closing plate at its ends, we protected the drops during the free fall, thus avoiding additional perturbations and changes in the trajectory due to the surrounding gas flow generated by the flywheel. The closing plate is comparable to a door, which opens before the drop passes by. Despite those efforts to retain the drop sphericity, some droplets slightly deformed prior to the contact with the surface, especially the ethanol and acetone drops due to the low surface tension. Nevertheless, as all the drops just before impact are measured, we analysed only the droplets with a deviation between the diameters in the major and minor axes lower than 5 %.
A high impact velocity is achieved using the high-speed motion of the rotating flywheel, which can move the impact surface at velocities of around  $100~\text{m}~\text{s}^{-1}$. Since the larger drops deform prior to impact at such high velocities, the flywheel is limited to a maximum surface velocity of
  $U_{S}=28~\text{m}~\text{s}^{-1}$. When using this flywheel set-up, the impact velocity
  $U$ is determined by the relative velocity between the impact surface
  $U_{S}$ and the falling drop
  $U_{D}$. In the present study,
  $U$ is varied depending on the configuration set from 6 to
  $26~\text{m}~\text{s}^{-1}$. The velocity of the drops for all used liquids is
  $U_{D}=3.3\pm 0.4~\text{m}~\text{s}^{-1}$ before their impact with the surface.
A synchronous motor is used to drive the flywheel and impact surface with precision, allowing only small variations in the surface velocity  $U_{S}$ (around 3 % of the set velocity) for the lowest rotation speeds. This deviation decreases down to
  ${<}1\,\%$ for velocities higher than
  $5~\text{m}~\text{s}^{-1}$. However, the uncertainties in the impact velocity mainly depend on the drop deceleration caused by the surrounding gas during the drop free fall. This effect has been minimised by using the mentioned shielding system and quantified by measuring each drop some milliseconds before the impact, as explained in § 2.2. The water drops are less sensitive to the perturbations caused by the fast-moving flywheel than the other liquids due to larger size and higher surface tension. In the case of
  $U<10~\text{m}~\text{s}^{-1}$, the standard deviation is smaller than
  $0.27~\text{m}~\text{s}^{-1}$; for higher impact velocities, it increases slightly to
  $0.49~\text{m}~\text{s}^{-1}$. When using acetone or ethanol and in the case of
  $U<8~\text{m}~\text{s}^{-1}$, the standard deviation is
  $0.30~\text{m}~\text{s}^{-1}$; for higher impact velocities, the standard deviation is
  $0.54~\text{m}~\text{s}^{-1}$.
The uncertainties of the flywheel result in a maximal variation of the surface position of  $\pm 1~\text{mm}$ for the low impact velocities. The variation of the surface position leads to a small variation of the impact angle of
  $90\pm 0.25^{\circ }$; subsequently, the horizontal velocity during the impact is lower than 0.4 % of impact velocity
  $U$, making its influence on splashing negligible. Another factor that can be analysed during the splashing is the effect of the centrifugal force
  ${\sim}R_{F}\unicode[STIX]{x1D719}^{2}$ caused by the rotation of the fast-moving flywheel. With a radius of
  $R_{F}=0.45~\text{m}$, the centrifugal force is very small if compared to the dynamic force of the impact
  ${\sim}U^{2}$. This ratio is less than 1 % due to the high impact velocity, which also allows us to neglect the influence of the centrifugal force during the analysis of the splashing process.
Table 1. Fluid properties and range of impact conditions used during the experiments.

To guarantee that each impact is on a dry and clean surface, the drops are generated at 5 s intervals. During this time, two hoses connected on the sides of the rotating flywheel blow air at a pressure of 5 bar directly at the moving surface, removing the remaining liquid from it without stopping the experiment. The centrifugal force, the evaporation of the liquid, and the fast-moving gas flow at the surface help to remove the remaining liquid between impacts. Therefore, the higher the impact velocity, the faster the cleaning process. All the experiments are conducted with a glass surface of roughness  $R_{a}=22\pm 5~\text{nm}$ as the impact surface and under normal absolute pressure
  $p_{atm}=1050\pm 100~\text{hPa}$ and temperature
  $T=20\pm 3\,^{\circ }\text{C}$. The material properties of the fluids used are summarised together with the range of impact conditions in table 1. For the liquids and drop sizes studied here, the maximal velocities represent the limits of the experimental set-up without a notable increment of the standard deviations.
2.2 Observation and evaluation methods for the characterisation of the outcome
The observation of splashing is made using the shadowgraph technique, as illustrated in figure 4(b,c). Our observation system consists of three high-resolution double-frame cameras PCO.4000 ( $4008\times 2672~\text{pixel}$) and two pulsed Nd:YAG lasers with diffuser optics serving as light sources. Camera 1 is used for the characterisation of the primary drops before they impact the surface providing the initial impact conditions. Camera 2 allows us to observe the atomisation process and the corona structure from inside, and to control whether the surface is dry or not. Camera 3 is used for the observation of the kinematics of the corona development and the characterisation of the secondary droplets.
The synchronisation of the cameras with the drop-release point and flywheel is made using a delay generator, which receives the triggering signal from a light barrier mounted on the flywheel. Afterwards, it sends two signals with different delays: the first one causes the solenoid to release the pendant droplet and the closing plate to be open some instant later whilst the second signal triggers the cameras a few milliseconds after the drop is released to record the splashing. During the entire splashing process, the displacement of the surface in the vertical direction is smaller than 2 mm. The cameras are synchronised with the flywheel, i.e., impact surface; therefore, the camera captures the impact with the surface always in the same position.
Secondary droplets produced by the relatively high impact velocity of the low viscosity liquids are rather small. To capture these tiny droplets with reasonable accuracy using shadowgraph techniques, it is necessary to detect a sharp shape of the droplets with multiple pixels. The use of the high-resolution double-frame cameras with conventional 180 mm lenses and teleconverters allows a spatial and temporal resolution of  $5~\unicode[STIX]{x03BC}\text{m}~\text{pixel}^{-1}$ and
  $10~\unicode[STIX]{x03BC}~\text{s}^{-1}$ between the two frames, respectively. We evaluated only droplets with a minimum area of
  $3\times 3~\text{pixels}$ in the camera, avoiding a false positive detection due to pixel noise. This constraint permits reliable characterisation of droplets larger than
  $15~\unicode[STIX]{x03BC}\text{m}$. The gain in spatial resolution within this double-frame system results in a low temporal resolution, allowing us to take only two images per impact. To compensate for this loss, we captured more than 1000 drop impacts for each condition at different elapsed times, thus creating a solid statistical database. Another important characteristic of the observations system is the limiting depth of field (DOF) caused by the use of conventional lenses. A limited DOF means that the droplets closest to the focal plane are likely to be detected, while the droplets further away are blurry or not detected at all. The quantity and size of detected droplets are proportional to the DOF because larger droplets are recognised even if they are out of the focal plane (Kim & Kim Reference Kim and Kim1994). This limitation leads to a bias in the evaluation of the size distribution, which must be corrected. Therefore, we calibrated the control volume in the direction of depth by traversing a target plate, as demonstrated in Berg et al. (Reference Berg, Deppe, Michaelis, Voges and Wissel2006). The calibration provides the correlation between the depth of field
  $\unicode[STIX]{x1D713}$ and droplet size
  $d$, which is then used to correct the statistical results and extrapolate the counted droplets.

Figure 5. Post-processing of the high-resolution images. Panel (a) shows a raw image with the secondary droplets ejected from a detached corona and panel (b) the droplet data calculated using the DaVis-ParticleMaster software. The main steps to estimate the total ejected volume using the extrapolation method are illustrated in panels (c–f).
The droplets captured with the cameras are processed using the commercial software DaVis-ParticleMaster (Berg et al. Reference Berg, Deppe, Michaelis, Voges and Wissel2006). The operations provided by this software to detect and calculate the position, size and velocity of the droplets can be found in Kapulla et al. (Reference Kapulla, Tuchtenhagen, Müller, Dullenkopf and Bauer2008). We avoid the recognition of multiple droplets as one larger droplet by setting a small depth of field and analysing only the droplets with a deviation between the diameters in the major and minor axes lower than 20 %, as shown in figure 5(a,b). Additionally, we calculate the total ejected volume by extrapolating the detected secondary droplets in the focal plane around the impact centre. The basic algorithm of this method was presented by Burzynski & Bansmer (Reference Burzynski and Bansmer2019) and it is illustrated in figure 5(c–f). This extrapolation method consists of the following five steps to estimate the ejected volume flux.
(i) First, the volume of each detected droplet
 $V_{i}$ is determined using the measured diameter $d_{i}$ and assuming sphericity of 1. This is particularly true some instants after the droplets are ejected from the spreading lamella. The volume then reads $V_{i}=\unicode[STIX]{x03C0}/6d_{i}^{3}$.
(ii) Second, the position of the droplets
$x_{i}$ over time is estimated using its measured velocity $u_{i}$ for the entire splashing process. This position allows us to estimate the distance from the droplets centroid to the impact centre $x_{imp}$.(iii) Third, the droplets that pass through a fixed control surface at 1.1 times the maximal spreading diameter are counted. This approach provides the volume flux of the ejected droplets at a specific time and therefore avoids a single droplet being counted multiple times during the splashing.
(iv) Fourth, a radial extrapolation of the counted droplets is performed around the impact centre
$x_{imp}$. One simple possible approach to perform this extrapolation is to multiply the volume of the counted droplets by the factor $2\unicode[STIX]{x03C0}$ for each time interval of $\unicode[STIX]{x0394}t$. However, this would lead to an overestimation of the secondary volume since the number and size of the secondary droplets depends on the depth of field, which in such approach is not taken into account. To correct that, we considered the calculated DOF values of each droplet $\unicode[STIX]{x1D713}_{i}$, which are obtained during the calibration process, as mentioned above. The extrapolated volume flux for a time interval $\unicode[STIX]{x1D6F7}_{s}$ is then calculated as (2.1)where$$\begin{eqnarray}\unicode[STIX]{x1D6F7}_{s}=2\unicode[STIX]{x03C0}\mathop{\sum }_{i=1}^{N}\frac{(x_{i}-x_{imp})}{\unicode[STIX]{x1D713}_{i}}V_{i},\end{eqnarray}$$$x_{i}$ is the droplet position before crossing the control surface, as illustrated in figure 5(f).(v) Fifth, the total ejected volume during the splashing process is obtained after integrating the extrapolated mean volumetric flux
$\unicode[STIX]{x1D6F7}_{s}$ over time. This method is valid for impact normal to surfaces, where all secondary droplets spread almost equally in the azimuthal direction.


Using this approach to calculate the total ejected volume, a small volume is omitted since only droplets larger than  $15~\unicode[STIX]{x03BC}\text{m}$ are evaluated. However, the volume contribution of very small droplets
  $V_{d=3\,\unicode[STIX]{x03BC}\text{m}}=1.41\times 10^{-17}~\text{m}^{3}$ is insignificant in comparison with the volume of larger droplets
  $V_{50\,\unicode[STIX]{x03BC}\text{m}}=6.54\times 10^{-14}~\text{m}^{3}$. According to the analysis of Faßmann et al. (Reference Faßmann, Bansmer, Möller, Radespiel and Hartmann2013), this occurs because the volume is proportional to
  $d^{3}$; consequently, the smallest droplets are less dominant in the total volume distribution. Thus, it is not expected that the total extrapolated volume would be greatly affected when capturing all droplets smaller than
  $15~\unicode[STIX]{x03BC}\text{m}$.
3 Mechanisms of drop splash on a smooth dry surface
Many studies have proposed different splashing parameters to establish the conditions at which a drop would splash on dry surfaces. The existing experimental data shows that splashing on dry smooth surfaces can be well described by the  $\unicode[STIX]{x1D6FD}$ parameter developed by Riboux & Gordillo (Reference Riboux and Gordillo2014). In the theory they have proposed, splashing is attributed to the aerodynamic lift force acting on the spreading lamella, and it occurs when the lift force is larger than the capillary retraction force, i.e.,
  $\unicode[STIX]{x1D6FD}=\sqrt{F_{L}/(2\unicode[STIX]{x1D70E})}$ is larger than 0.14. The splashing threshold of 0.14 results from analysing multiple experiments with a wide range of viscosities, surface tensions, and surface wettabilities (Riboux & Gordillo Reference Riboux and Gordillo2014, Reference Riboux and Gordillo2017). However, recent experiments indicate that this value may be smaller when impacting blood drops (De Goede et al. Reference De Goede, Laan, De Bruin and Bonn2017) or Newtonian liquids on surfaces with large advancing contact angle (Quetzeri-Santiago et al. Reference Quetzeri-Santiago, Yokoi, Castrejón-Pita and Castrejón-Pita2019). A variation of this splashing threshold due to surrounding gas effects was also highlighted in Burzynski & Bansmer (Reference Burzynski and Bansmer2019), where the splashing threshold
  $\unicode[STIX]{x1D6FD}$ for high-speed impacts fluctuates between 0.16 and 0.19 depending on the properties of the gas. Additionally, the data used by Riboux & Gordillo (Reference Riboux and Gordillo2014) provides hints that this splashing threshold slightly increases with the impact velocity (see figure 7b in their supplemental material). The measurements presented in this study confirm this variation of the splashing threshold and show that for high-speed impacts, splashing occurs when
  $\unicode[STIX]{x1D6FD}>0.19$. A detailed analysis of the total ejected volume supporting this conclusion is presented later in § 4.3.

Figure 6. Reconstruction of the evolution of splashing. The images demonstrate the differences between the corona and prompt splash on a dry smooth surface at different impact times. Scale bar 1 mm at the focal plane.
3.1 Typical outcomes of high-speed drop impact
The possible outcomes of high-speed drop impact on a dry solid surface are corona and prompt splash. A corona is formed from the liquid of the primary drop if the aerodynamic lift force is high enough to levitate the outer part of the spreading lamella. Prompt splash is characterised by the emergence of multiple jets without corona formation and has been typically attributed to drop impact on rough or structured surfaces (Marengo et al. Reference Marengo, Antonini, Roisman and Tropea2011; Aboud & Kietzig Reference Aboud and Kietzig2015; Roisman et al. Reference Roisman, Lembach and Tropea2015). In those cases, the surface morphology affects the flow of the spreading lamella, contributing to the ejection of jets (Yarin et al. Reference Yarin, Roisman and Tropea2017). However, the attribution of prompt splash exclusively to the surface morphology seems to be incomplete because this splashing regime can be observed on smooth surfaces at higher Reynolds numbers. The sequence of images from figure 6 elucidate the major differences between the corona and prompt splash regimes over time. While the levitated lamella remains visible in the corona splash regime almost during the entire splashing time  $\unicode[STIX]{x1D70F}=tU/D$, a free liquid sheet in azimuthal direction is not formed or visible in the prompt splash regime.
The corona splash formed on dry surfaces differs significantly from the corona observed after drop impact on a liquid film. These differences can be clearly seen by comparing the images of corona splash for a single drop impact on a wetted surface (figure 2c), for spray impingement (figure 3) and for a single drop impact on a smooth dry surface (figures 7a and 7b). The key difference is the composition of the corona: for spray impact or single droplet impact on a wetted surface, the corona is formed by the liquid from the surface film and the drop, while the single droplet impact on a dry surface only contains liquid from the drop. The splash of drops on wetted surfaces is the result of rim instability leading to cusp formation and fingering (Yarin et al. Reference Yarin, Roisman and Tropea2017). When a drop impacts a smooth dry surface at high velocity, the complex free liquid film becomes unstable. This corona instability creates a wavy structure, which leads to the emergence of the jets at the corona rim. The corona subsequently breaks up at some height above the surface. As the snapshots in figure 8(c,f,i) demonstrate, the height of the corona decreases with increasing Reynolds number. This effect can be observed not only during a specific elapsed time but also during the entire time evolution of the corona.
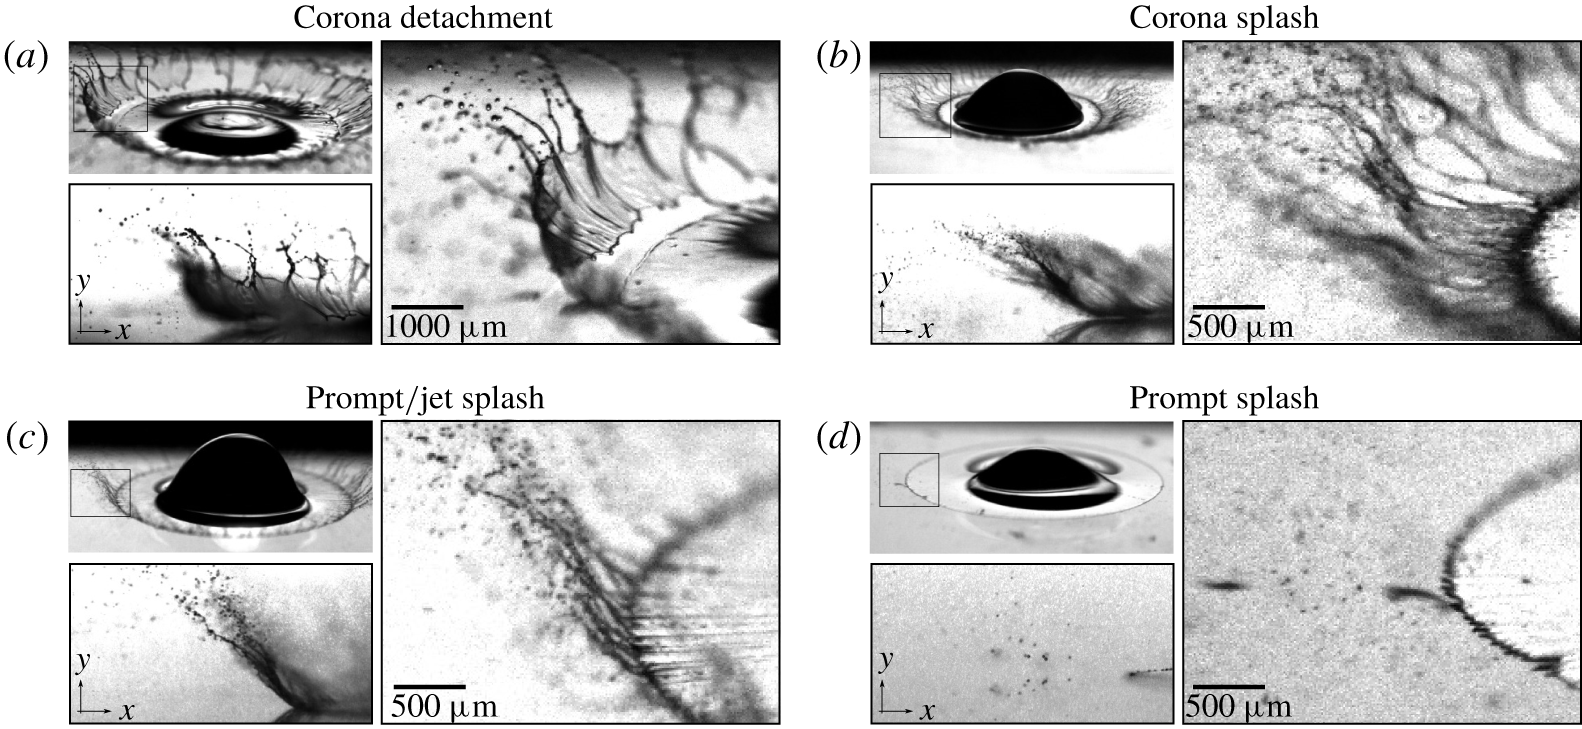
Figure 7. Typical breakup regimes at relatively high impact velocities: (a) corona detachment with consequent disintegration of an ethanol drop,  $We=3300$,
  $Re=9500$; (b) corona splash of an ethanol drop,
  $We=6500$,
  $Re=14\,000$; (c) limiting case of prompt splash with relatively short corona and long jets observed with water drop,
  $We=10\,700$,
  $Re=54\,400$; (d) prompt splash of an acetone drop,
  $We=7000$,
  $Re=62\,000$.

Figure 8. Effect of the Weber and Reynolds numbers on splashing. The relatively small influence of  $We$ is shown when comparing the results using water and acetone, where
  $We$ varies but
  $Re$ remains almost constant. The more dominant role of
  $Re$ is revealed by comparing the ethanol and acetone impacts, where
  $Re$ is increased but
  $We$ is constant. The impact time is
  $\unicode[STIX]{x1D70F}\approx 0.5$, the diameters are shown in mm, and velocities in
  $\text{m}~\text{s}^{-1}$. Scale bars 1 mm.
In the prompt splash regime, the corona does not appear, and the splash occurs as the result of the breakup of single jets emerging from the surface-bound lamella, as shown in figures 6 and 7. By increasing the impact velocity, the flow of the spreading lamella becomes unstable, and instead of droplet formation directly at the rim, large jets are formed with a thin liquid sheet connecting them occasionally in some azimuthal locations. Note that in figures 7(c) and 8(h) the side view would suggest a corona splash; however, this is not the case as the tilted view shows. The analysis of multiple images from that perspective shows that those jets can be formed in some cases from a very small and irregular detached lamella, which is ejected at the beginning of splashing. Hence, the distinction between the corona and prompt splash only from a side view perspective is not reliable. To correctly distinguish between the splashing regimes in our experiments, the outcome of the splashing is observed using the tilted high-resolution camera.
Examples of the effects of the liquid properties and impact velocity on the splashing are shown in figure 8. A strong influence of liquid viscosity on splashing can be clearly identified from these images by comparing the impact of ethanol drops with that of acetone drops. Here, the density and surface tension of both liquids are nearly identical, but the viscosity of ethanol is more than four times higher than that of acetone. This leads to a change in the Reynolds number of the same magnitude, while the Weber number remains constant; as a result, the increase in viscosity switches the regime from prompt to corona splash. One difference between these liquids is that acetone evaporates much faster, which leads to a reduction of the drop diameter over time. By measuring all the drops prior to impact, we guarantee that the drops of both liquids analysed here possess the same the diameter; therefore, we expect that the fast evaporation of acetone does not remarkably affect the splashing outcome as the change in viscosity does. Such drastic changes in the splashing regime due to liquid viscosity have been also reported previously by Palacios et al. (Reference Palacios, Hernández, Gómez, Zanzi and López2013) and Stevens, Latka & Nagel (Reference Stevens, Latka and Nagel2014) but for low-speed impacts and even more viscous drops. The changes in splashing regime can be also observed at the highest impact velocities from figure 8; here, the splashing outcome seems to be identical from a side view. However, the detailed tilted view demonstrates that the prompt/jets splashing regimes dominate the impact of water drops, while a clear corona is formed in the case of ethanol drops. This underlines our conclusions that the splashing outcome strongly depends on the physical properties of the liquids used and not on the kinematic impact conditions, such as diameter and velocity.
To analyse the effect of the Weber number on splashing, we performed experiments with acetone and water drops. The use of these liquids lets us double the Weber number and keep the Reynolds number almost constant  $\unicode[STIX]{x0394}Re\approx 10\,\%$. As can be observed from figure 8, the splashing from both liquids results in prompt splash. Pasandideh-Fard et al. (Reference Pasandideh-Fard, Bhola, Chandra and Mostaghimi1998) and Rioboo, Marengo & Tropea (Reference Rioboo, Marengo and Tropea2002) investigated the surface tension effect on the drop impact on smooth surfaces and demonstrated that surface tension has almost no influence at the early stage of impact, where the secondary droplets are generated. In the detailed work of Palacios et al. (Reference Palacios, Hernández, Gómez, Zanzi and López2013), it is argued that the surface tension stabilises the spreading lamella at large
  $Re$, while the viscosity only affects its thickness; therefore, the larger the viscosity, the thicker the spreading lamella. This increase in the lamella thickness leads to a drastic change from prompt to corona splash regime. The wide range of Weber and Reynolds numbers studied here, which varied from 2000 to 30 000 and from 8000 to 100 000, respectively, and the observations made by previous authors provide evidence that the Reynolds number plays a more important role than the Weber number in the splashing process of high-speed impacts.
3.2 Threshold conditions for the prompt splash
One of the possible mechanisms leading to prompt splash, which is characterised by the ejection of multiple jets from the lamella, is the Rayleigh–Taylor instability of the spreading liquid (Chandrasekhar Reference Chandrasekhar2013). This instability has been speculatively assumed by Li et al. (Reference Li, Thoraval, Marston and Thoroddsen2018) after examining the structure and wavelengths of the unsteady azimuthal undulations present in the spreading lamella at the early stage of impact. Xu et al. (Reference Xu, Zhang and Nagel2005) have shown that aerodynamic effects determine the splashing threshold; however, the properties of the surrounding gas do not affect the type of splash, corona, or prompt (Stevens et al. Reference Stevens, Latka and Nagel2014; Roisman et al. Reference Roisman, Lembach and Tropea2015; Burzynski & Bansmer Reference Burzynski and Bansmer2019). This is emphasised by analysing the gas Weber number of the lamella  $We_{l}=\unicode[STIX]{x1D70C}U_{l}^{2}h_{\unicode[STIX]{x1D707}}/\unicode[STIX]{x1D70E}$, which for the small thickness and low gas density results in a very small number. The perturbations of the gas velocity field do not influence the instability of the spreading lamella. Thus, the threshold conditions which separate the corona and prompt splash are determined exclusively by the liquid properties.
To estimate the threshold conditions, we calculated the perturbation growth  $\unicode[STIX]{x1D714}$ of the small antisymmetric disturbances of a thin accelerating liquid film from the inviscid solution (Entov, Sultanov & Yarin Reference Entov, Sultanov and Yarin1985, Reference Entov, Sultanov and Yarin1986; Yarin Reference Yarin1993)
 $$\begin{eqnarray}\unicode[STIX]{x1D714}=\frac{a^{1/2}\unicode[STIX]{x1D701}^{1/2}}{2h_{\unicode[STIX]{x1D707}}^{1/2}\tilde{W}e^{1/2}}\left[\sqrt{16\tilde{W}e^{2}+\unicode[STIX]{x1D701}^{2}(\unicode[STIX]{x1D701}^{2}-4)^{2}}-\unicode[STIX]{x1D701}^{3}-4\unicode[STIX]{x1D701}\right]^{1/2},\end{eqnarray}$$
 where  $a$ is the film acceleration in the direction normal to its median surface,
  $h_{\unicode[STIX]{x1D707}}$ is the film thickness,
  $\tilde{W}e$ is the film Weber number, and
  $\unicode[STIX]{x1D701}$ is the dimensionless wavenumber. The film Weber number is defined as
  $\tilde{W}e=\unicode[STIX]{x1D70C}h_{\unicode[STIX]{x1D707}}^{2}a/\unicode[STIX]{x1D70E}$, where
  $h_{\unicode[STIX]{x1D707}}\sim DRe^{-1/2}$ is the scale for the lamella thickness (Roisman et al. Reference Roisman, Horvat and Tropea2006; Lagubeau et al. Reference Lagubeau, Fontelos, Josserand, Maurel, Pagneux and Petitjeans2012) and
  $a\sim U^{2}/D$ is the scale for the film acceleration (de Ruiter, Pepper & Stone Reference de Ruiter, Pepper and Stone2010). The film Reynolds number is analogously defined as
  $\tilde{R}e=\unicode[STIX]{x1D70C}h_{\unicode[STIX]{x1D707}}^{3/2}a^{1/2}/\unicode[STIX]{x1D707}$. We show by estimating the values of these dimensionless parameters for all our experiments that the value of the film Reynolds numbers
  $\tilde{R}e$ is
  $O(10^{1})$, while the value of the film Weber numbers
  $\tilde{W}e$ is
  $O(10^{-2})$. These estimations suggest that the influence of surface tension in the film is indeed much more significant than the influence of viscosity. Figure 9 illustrates the main variables used in this study to describe the mechanism of drop splashing and the ejection of secondary droplets.

Figure 9. Sketch of an impacting drop and its lamella. It illustrates the splashing mechanism and the most relevant quantities used in the theoretical analysis, such as the lift force acting on the lamella  $F_{L}$, the breakup length of the corona
  $U_{\unicode[STIX]{x1D707}}/\unicode[STIX]{x1D714}$, and its corresponding wavelength
  $\ell$.
The linear relation of the film thickness and the scale  $h_{\unicode[STIX]{x1D707}}$ was first assumed by Yarin & Weiss (Reference Yarin and Weiss1995) and then experimentally confirmed by de Ruiter et al. (Reference de Ruiter, Pepper and Stone2010). Roisman et al. (Reference Roisman, Horvat and Tropea2006) roughly estimated the thickness of the lamella at the dimensionless time
  $\unicode[STIX]{x1D70F}=1$ from the mass balance using experimental data for the spreading diameter (Fukai et al. Reference Fukai, Shiiba, Yamamoto, Miyatake, Poulikakos, Megaridis and Zhao1995; Roisman et al. Reference Roisman, Prunet-Foch, Tropea and Vignes-Adler2002a; Roisman, Rioboo & Tropea Reference Roisman, Rioboo and Tropea2002b). As a result, they have shown that the thickness of the lamella scales well as
  $h_{\unicode[STIX]{x1D707}}\sim DRe^{-1/2}$ in the range
  $500<Re<5000$. Bird, Tsai & Stone (Reference Bird, Tsai and Stone2009) studied the drop impact on moving surfaces and successfully used the scale
  $h_{\unicode[STIX]{x1D707}}\sim DRe^{-2/5}$ for modelling the splashing threshold. The same scale for the residual film thickness has been analytically obtained by Roisman (Reference Roisman2009) from the exact solution for the flow in the lamella. The numerical and experimental study of Visser et al. (Reference Visser, Tagawa, Sun and Lohse2012) on the dynamics of high-speed microdrop impact corroborates that the thickness of the spreading lamella for the normal impact of drops on dry surfaces can be scaled as
  $h_{\unicode[STIX]{x1D707}}=DRe^{-1/2}$.
The estimation of the rate of growth of the fastest unstable mode in the spreading film is made from (3.1) for very small values of the film Weber number. Using this equation and the related most unstable dimensionless wavenumber  $\unicode[STIX]{x1D701}\approx \tilde{W}e^{2/3}/\sqrt{2}$, we obtain a simplification, which reads
  $\unicode[STIX]{x1D714}\approx (a\tilde{We}/2h_{\unicode[STIX]{x1D707}})^{1/2}$. It should be noted that the film Weber number associated with the prompt splash for all our experiments and all the experiments found in the literature are
  $\tilde{W}e<0.1$. Furthermore, we estimated the corresponding wavelength of the most unstable mode, which is expressed as
  $\ell \approx 2\sqrt{2}\unicode[STIX]{x03C0}h_{\unicode[STIX]{x1D707}}\tilde{W}e^{-2/3}$. These expressions can be rewritten using the terms based on the drop impact parameters as
 $$\begin{eqnarray}\unicode[STIX]{x1D714}\approx \frac{UWe^{1/2}}{\sqrt{2}DRe^{1/4}},\quad \ell \approx 2\sqrt{2}\unicode[STIX]{x03C0}D\frac{Re^{1/6}}{We^{2/3}}.\end{eqnarray}$$
 The breakup length of the corona due to the Rayleigh–Taylor instability can be estimated as  $U_{\unicode[STIX]{x1D707}}/\unicode[STIX]{x1D714}$ (Huang Reference Huang1970), where
  $U_{\unicode[STIX]{x1D707}}$ is the typical velocity of the liquid in the lamella. This estimation for the breakup length results from the analysis of the linear wave motion of a thin liquid sheet neglecting the internal flow motion. The velocity of the lamella is influenced by its thickness, which can be roughly estimated from the mass balance equation, leading to
  $U_{\unicode[STIX]{x1D707}}^{2}\sim DU^{2}/h_{\unicode[STIX]{x1D707}}$. The breakup length determines two important parameters: the height at which the corona starts to disintegrate and the number of uprising jets. We define the prompt splash as a situation where the breakup length is comparable to the thickness of the lamella and multiple jets are formed in the azimuthal direction. The first necessary condition for prompt splash is therefore
  $U_{\unicode[STIX]{x1D707}}/\unicode[STIX]{x1D714}<h_{\unicode[STIX]{x1D707}}$, which can be rewritten with the help of (3.2) in the form
 $$\begin{eqnarray}We^{1/2}\leqslant Oh^{\star }Re,\end{eqnarray}$$
 where  $Oh^{\star }$ is the threshold Ohnesorge number. The second necessary condition for prompt splash is the development of multiple jets close to each other in the azimuthal direction. This implies that the wavelength of the most unstable mode must be at least much smaller than the drop diameter; otherwise, this length
  $\ell$, as illustrated in figure 9, would only lead to a very small or non-existent number of jets at the early stage of impact. Thus, the second condition for prompt splash can be defined with the help of the expression for wavelength
  $\ell$ from (3.2) yielding
 $$\begin{eqnarray}We\geqslant Z^{\star }Re^{1/4},\end{eqnarray}$$
 where  $Z^{\star }$ is a dimensionless empirical constant. These two equations represent the boundaries where prompt splash for high-speed impacts is expected. Outside these thresholds, another regime such as corona splash, deposition, or receding breakup can result from the impact on a dry smooth solid surface.
The validation of our analysis is made considering our results and the existing experimental data available for drops impacting a dry smooth surface at relative high impact velocities. The different outcomes from those experiments are shown in figure 10 as a function of the Weber and Reynolds numbers. The threshold  $Oh^{\star }$ in the form obtained in (3.3) successfully predicts the boundary between the prompt and corona splash; this prediction is validated using the available experimental data for low-speed impacts and our data at much higher values of the Weber and Reynolds numbers. Palacios et al. (Reference Palacios, Hernández, Gómez, Zanzi and López2013) empirically obtained this threshold for the prompt splash at
  $Oh^{\star }=0.0044$, which has then been confirmed by additional experiments in Roisman et al. (Reference Roisman, Lembach and Tropea2015) and in this study. The threshold
  $Z^{\star }$ as predicted in (3.4) subsequently sets the boundary between the prompt splash and deposition or receding breakup. The definition of a value for this threshold is challenging because, as we argued before, the prompt splash generates very small droplets, which can be hardly recognised by set-ups with insufficient spatial resolution; therefore, the authors of the publications cited here may have erroneously claimed deposition or receding breakup, when actually prompt splash occurs. Figure 8(a) illustrates this challenging detection, even with a spatial resolution of
  $5~\unicode[STIX]{x03BC}\text{m}~\text{pixel}^{-1}$. Nevertheless, all the observed cases of prompt splash belong to the range of parameters satisfying the condition (3.4) with
  $Z^{\star }=34$. This threshold value is obtained analysing the experiment results published with relatively low spatial resolution, therefore more detailed experiments are needed for low-speed impacts to confirm it. However, the presented threshold conditions determine rather well the boundaries defining the region of the prompt splash on a smooth dry surface, as demonstrated in figure 10. This result indicates that the Rayleigh–Taylor instability could indeed be the main mechanism leading to prompt splash.

4 Characterisation of the outcome of splashing
4.1 Size distribution of the secondary droplets
The high-speed impact of drops on a dry smooth surface generates a spray of secondary droplets upon the surface. The ejection of these small secondary droplets is a continuous process, starting shortly after the liquid lamella is detached from the surface at the early stage of impact. Because the origin of the secondary droplets is the spreading lamella, it is reasonable to expect that the diameter of the droplets correlates with the lamella thickness. This thickness changes over time (de Ruiter et al. Reference de Ruiter, Pepper and Stone2010), suggesting that droplets of different sizes should be generated during splashing. This is demonstrated in figure 11(a,b), where the size distributions are plotted for the prompt and the corona splash. In both cases, the obtained probabilities are well described using a log-normal distribution underlying the stochastically independent process during the generation of droplets. This type of distribution has been used previously to characterise the ejected droplets in experiments (Mundo et al. Reference Mundo, Sommerfeld and Tropea1995; Yarin & Weiss Reference Yarin and Weiss1995; Faßmann et al. Reference Faßmann, Bansmer, Möller, Radespiel and Hartmann2013; Wang & Bourouiba Reference Wang and Bourouiba2018) and numerical simulations (Cimpeanu & Papageorgiou Reference Cimpeanu and Papageorgiou2018). Our measurements indicate that the normalised size distributions for high-speed drop impacts are in a specific splashing regime almost independent of the impact conditions; however, there is a notable difference between the prompt and the corona splash regime. This difference is attributed to the larger size of ejected droplets due to the breakup of the levitated lamella, which never develops in the prompt splash.
The detailed work of Wang & Bourouiba (Reference Wang and Bourouiba2018) demonstrates that the drop ejection from an expanding sheet takes place in form of end-pinching, ligament-merging, and satellite droplets. These three modes are then responsible for the generation of droplets of different sizes, also when 90 % of these droplets have been identified only as a result of end-pinching and ligament-merging. Although we expect these three modes to be present in the prompt and the corona splash regime, there are notable differences between those experiments on small surfaces, where the free liquid sheet expands and atomises without a solid surface beneath it, and experiments on a larger surface, where the gas cushioning affects the expanding lamella (Moore et al. Reference Moore, Whiteley and Oliver2018). The fragmentation of a free sheet commonly results in drop sizes in a range between 10 % and 30 % of the initial droplet diameter  $D$ (Roisman et al. Reference Roisman, Horvat and Tropea2006; Villermaux & Bossa Reference Villermaux and Bossa2011; Wang & Bourouiba Reference Wang and Bourouiba2018; Lejeune & Gilet Reference Lejeune and Gilet2019). In our experiments related to corona splash, however, the impact generates smaller droplets ranging between 0.6 % and 3 % of
  $D$, thus indicating that only a portion of the liquid is bent into the corona, while the rest expands on the surface. The droplets expelled in the prompt splash regime are much smaller and rarely larger than 2 % of the primary drop diameter due to the absence of a large corona. These results also differ from the spray ejected when a train of drops impacts on a solid surface where larger drop sizes can be ejected (Mundo et al. Reference Mundo, Sommerfeld and Tropea1995; Yarin & Weiss Reference Yarin and Weiss1995; Yarin et al. Reference Yarin, Roisman and Tropea2017). However, the log-normal size distribution can be observed in almost all experimental studies related to the splashing of drops. A study with impact conditions similar to our experiment is presented by Thoroddsen et al. (Reference Thoroddsen, Takehara and Etoh2012), where the authors observed instabilities in the cusp and related them to the prompt splash. They show that the smallest droplets in the range between 0.1 % and 1 % of
  $D$ are ejected at the early stage of impact. Our measurements show good agreement with those ranges; however, we have not observed droplets smaller than
  ${\sim}0.5\,\%$ of
  $D$ due to the limited spatial resolution of our cameras. Additionally, the smallest droplets measured here are also in excellent agreement with the results of the numerical simulations performed by Cimpeanu & Papageorgiou (Reference Cimpeanu and Papageorgiou2018), where they calculated for a
  $We\approx 20\,000$ that the smallest droplets ejected are around 0.2 % of
  $D$.
$D$.

Figure 11. The size of the secondary droplets and its evolution over time. Panel (a) shows the size distribution for several experiments in the prompt splash regime with the data from Burzynski & Bansmer (Reference Burzynski and Bansmer2019) represented in filled circles with grey tones. Panel (b) demonstrates the major differences between the splashing regimes; prompt splash with filled and corona splash with empty markers. Panel (c) shows the evolution of the arithmetic mean diameter for both splashing regimes over time.
To elucidate the transient splashing phenomena, we plotted the time evolution of the dimensionless arithmetic mean diameter  $d_{10}/D$ in figure 11(c). The arithmetic mean diameter of the droplets is defined as
  $d_{10}=(1/N)\unicode[STIX]{x1D6F4}_{i=1}^{i=N}d(i)$, where
  $N$ is the total number of droplets detected. The moment at which the droplet contacts the surface is indicated by
  $\unicode[STIX]{x1D70F}=0$. Our measurements demonstrate that
  $d_{10}$ increases with
  $\unicode[STIX]{x1D70F}$ at the early stage of impact for the corona and prompt splash regime, which leads to a wide range of sizes of the ejected droplets. This is caused primarily by viscous effects on the spreading lamella, which lead to its deceleration and subsequently to an increase in the rim thickness (de Ruiter et al. Reference de Ruiter, Pepper and Stone2010; Thoroddsen et al. Reference Thoroddsen, Takehara and Etoh2012; Riboux & Gordillo Reference Riboux and Gordillo2017). After this initial phase and between the times
  $1<\unicode[STIX]{x1D70F}<3$,
  $d_{10}$ stabilises into a relatively constant value. Later on, the arithmetic mean diameter decreases in the case of prompt splash for the lowest impact velocities; this is because the smallest and slowest satellite droplets are then detected by our recording system. Note that the satellite droplets are the smallest droplets produced during the pinch-off process between the secondary droplets and their corresponding ligament (Wang & Bourouiba Reference Wang and Bourouiba2018). On the contrary,
  $d_{10}$ increases for the higher impact velocities due to the breakup of the larger jets, which generate much larger droplets. The arithmetic mean diameter of the secondary droplets for the corona splash is always larger than the prompt splash due to the formation and breakup of the corona. The corona breakup occurs in the later stages of impact, as can be seen in figure 11(c). It confirms the hypothesis proposed by Palacios et al. (Reference Palacios, Hernández, Gómez, Zanzi and López2013), suggesting that lamella thickness is proportional to the liquid viscosity. Nevertheless, the arithmetic mean diameter over the entire duration of splashing can be approximated to a relatively constant value, similarly to the results obtained by Roisman et al. (Reference Roisman, Horvat and Tropea2006) for spray impacts. They measured the size of the secondary droplets using the phase Doppler instrument very close to the surface and showed that the diameter of the secondary drops scales according to the thickness
  $h_{\unicode[STIX]{x1D707}}$ of the viscous boundary layer. In their experiments, the secondary droplets were generated due to the breakup of the rim bounding the corona, and the average diameter of the droplets for the entire splashing process was
  $d_{10}\approx 11DRe^{-1/2}$ for
  $250<Re<700$. Our measurements indicate that this length scale
  $h_{\unicode[STIX]{x1D707}}$ is also appropriate to scale the diameter of the secondary droplets produced by the high-speed impact on smooth dry surfaces.
The mean secondary droplet diameter scaled by  $h_{\unicode[STIX]{x1D707}}$ is plotted in figure 12 as a function of the Reynolds number. The diagram shows that the scaled droplet diameter stays relatively constant
  $d_{10}\approx 1.5DRe^{-1/2}$ for a wide range of Reynolds numbers. Although the scaling is similar to the spray impact
  ${\sim}Re^{-1/2}$, the pre-factors are separated by one order of magnitude. This is because the ejected secondary droplets for spray impact on wetted surfaces are formed from the fully developed but unstable rim, which consists of drop and film liquid. On the other hand, the droplets generated during prompt splash on dry surfaces are formed directly from the unstable lamella of thickness
  $h_{\unicode[STIX]{x1D707}}$, which consists of only drop liquid. It should be noted that the ratio measured between both pre-factors is approximately 10; interestingly, the same ratio is estimated between the rim diameter and the film thickness in the experiments of Roisman et al. (Reference Roisman, Horvat and Tropea2006) for spray impact.

Figure 12. The arithmetic mean diameter of the ejected droplets scaled by  $h_{\unicode[STIX]{x1D707}}=DRe^{-1/2}$. The existing experimental data for the corona and prompt splash is plotted together with the prediction made using the extended RG theory (Riboux & Gordillo (Reference Riboux and Gordillo2014) complemented by Rayleigh–Taylor instability based arguments) and previous experiments conducted using water drops.
The size and velocity of the secondary droplets can be estimated using the theory of Riboux & Gordillo (Reference Riboux and Gordillo2014), which hereafter is called RG Theory. The key idea to provide these quantities is based on the fact that the droplets are expelled directly from the spreading lamella; therefore, the size and velocity of the droplets correspond to the thickness and velocity of the lamella tip. The droplets are ejected if the lamella de-wets the surface and its tip moves faster than the wetted region. To estimate the ejection time of the lamella  $\unicode[STIX]{x1D70F}_{e}$, its thickness
  $h_{l}$, and velocity
  $u_{l}$, Riboux & Gordillo (Reference Riboux and Gordillo2014) considered the liquid flow as both inviscid and incompressible, allowing the use of potential and Wagner’s theory (Wagner Reference Wagner1932). It is important to mention that several other studies have been carried out using adaptations of Wagner’s theory to analyse multiple scenarios, such as the drop–liquid interaction (Howison et al. Reference Howison, Ockendon, Oliver, Purvis and Smith2005; Cimpeanu & Moore Reference Cimpeanu and Moore2018) and the drop impact on solid (Philippi, Lagrée & Antkowiak Reference Philippi, Lagrée and Antkowiak2016), elastic (Pegg, Purvis & Korobkin Reference Pegg, Purvis and Korobkin2018) and inclined surfaces (Moore et al. Reference Moore, Howison, Ockendon and Oliver2012). In this regard, the relevant dimensionless quantities
  $\unicode[STIX]{x1D70F}_{e}$,
  $h_{l}$ and
  $u_{l}$ are calculated using the RG theory as
 $$\begin{eqnarray}\hspace{-8.0pt}\frac{\sqrt{3}}{2}Re_{R}^{-1}\unicode[STIX]{x1D70F}_{e}^{-1/2}+Re_{R}^{-2}Oh_{R}^{-2}=1.21\unicode[STIX]{x1D70F}_{e}^{3/2},\quad h_{l}=\frac{\sqrt{12}\unicode[STIX]{x1D70F}_{e}^{3/2}}{\unicode[STIX]{x03C0}}\quad \text{and}\quad u_{l}=\frac{1}{2}\sqrt{\frac{3}{\unicode[STIX]{x1D70F}_{e}}},\end{eqnarray}$$
 where the Reynolds and Ohnesorge numbers are defined as  $Re_{R}=\unicode[STIX]{x1D70C}UD/(2\unicode[STIX]{x1D707})$ and
  $Oh_{R}=\unicode[STIX]{x1D707}/\sqrt{\unicode[STIX]{x1D70C}D/(2\unicode[STIX]{x1D70E})}$, respectively. The dimensional quantities of the ejection time, thickness and velocity correspond to
  $T_{e}=\unicode[STIX]{x1D70F}_{e}D/(2U)$,
  $H_{l}=h_{l}D/2$ and
  $U_{l}=u_{l}U$. It should be noted that the dimensionless parameters in the RG Theory are defined using the drop radius
  $D/2$ instead of diameter, as commonly used in the literature and this manuscript.
In the case of prompt splash or corona splash with short corona, the droplets are ejected near to the surface; therefore, the effects of viscous shear force at the spreading rim must be taken into consideration (Riboux & Gordillo Reference Riboux and Gordillo2015). This shear force affects the velocity and the rim thickness simultaneously over time. It increases the rim thickness at the radius  $a$ of the wetted region from
  $h_{a}$ to
  $h_{a}^{+}$ and decreases its horizontal velocity from
  $u_{a,x}$ to
  $u_{a,x}^{+}$. The adapted lamella conditions are expressed as
 $$\begin{eqnarray}h_{a}^{+}=\frac{h_{a}}{(1-\sqrt{2}/\sqrt{Re_{R}v_{a}h_{a}})},\quad u_{a,x}^{+}=u_{a}(1-\sqrt{2}/\sqrt{Re_{R}u_{a}h_{a}}),\end{eqnarray}$$
 where  $h_{a}=h_{l}/3$ and
  $u_{a}=2u_{l}$. The droplet size and horizontal velocity can be determined as
  $d_{model}\sim Rh_{a}^{+}$ and
  $u_{x,model}\sim Uu_{a,x}^{+}$, respectively. The coordinates and parameters used in this theory are illustrated in figure 9.
The RG theory reveals that the first secondary droplets for a water drop impact at  $We\approx 5000$ and
  $Re\approx 35\,500$ are ejected at
  $T_{e}\simeq 1.7~\unicode[STIX]{x03BC}\text{s}$ with a diameter of
  $d_{model}\sim 3~\unicode[STIX]{x03BC}\text{m}$ and a velocity of
  $u_{x,model}\sim 80~\text{m}~\text{s}^{-1}$. Such impact conditions correspond to figure 1(a). These estimated values agree well with the measurements of Thoroddsen et al. (Reference Thoroddsen, Takehara and Etoh2012), who conducted experiments under almost identical conditions. However, the RG theory does not provide any information about the elapsed time for the generation of secondary droplets. This elapsed time must be known; otherwise, the model estimates a continuous increase in the droplet size over time, as can be noted from (4.1), (4.2), where
  $d_{model}=Rh_{a}^{+}\sim \unicode[STIX]{x1D70F}^{3/2}$. To extend the RG theory in this matter, we calculated the splashing duration making use of the Rayleigh–Taylor instability analysis from the previous section. Here, we demonstrate that the ejection time is determined by the process of multiple jet formation at the edge of the expanding lamella; therefore, the duration of splashing
  $\unicode[STIX]{x1D70F}_{d}$ can be calculated using the growth rate of the fastest unstable mode in the spreading film obtained from (3.2) as
 $$\begin{eqnarray}\unicode[STIX]{x1D70F}_{d}\sim U/D\unicode[STIX]{x1D714}\approx Re^{1/4}We^{-1/2}.\end{eqnarray}$$
 The estimations using this equation agree with the ultra-high-speed images from the experiment of Thoroddsen et al. (Reference Thoroddsen, Takehara and Etoh2012), where they observed that most of the secondary droplets in the prompt splash regime were generated in the first  $100~\unicode[STIX]{x03BC}\text{s}$ after the impact, i.e.,
  $\unicode[STIX]{x1D70F}_{d}=0.2$. Using (4.3), the duration of splashing in that specific case is predicted as
  $\unicode[STIX]{x1D70F}_{d}\approx 0.18$.
The extension of the RG theory using the expression for the characteristic time of the corona instability allows us to calculate the arithmetic mean diameter of the secondary droplets for the prompt splash with high accuracy. This is done using the RG theory to estimate the lamella thickness from its ejection time  $T_{e}$ up to the approximation obtained using (4.3) and then calculating the arithmetic mean of all the predicted lamella thicknesses. The measurement results and the estimations using this approach are shown in figure 12 for a wide number of impact conditions. It should be noted that (4.3) is valid only for the prompt splash or corona splash with a short corona, where the Rayleigh–Taylor instability is the main mechanism causing the splashing. For the corona splash, the generation of secondary droplets takes more time and different instabilities may play an important role. This explains why our model underestimates the secondary drop diameters for small Reynolds numbers, corresponding to the fully developed corona splash. Nevertheless, the drop diameters in this regime rather accurately follow the previously determined semi-empirical model
  $d_{10}\approx 1.5DRe^{-1/2}$.
4.2 Velocity and ejection angle of secondary droplets
The velocities of the secondary droplets resulting from the prompt and corona splash are shown in figure 13, where each point on the graph corresponds to a single detected droplet. The data represent the correlations between the velocity magnitude and size, the velocity components, and the ejection angle and size of the secondary droplets. These diagrams demonstrate the difference between the corona and prompt splash, which are manifested not only in the droplet sizes but also in their velocities. For better visualisation purposes, the colour scale in figure 13 is set up to  $\unicode[STIX]{x1D70F}=6$, although the splashing phenomena were captured for both regimes until
  $\unicode[STIX]{x1D70F}\approx 10$. Our measurements indicate that a certain velocity does not necessarily correlate to a specific droplet diameter; thus, a direct relationship such as
  $u\sim \sqrt{\unicode[STIX]{x1D708}DU}/d$ (Thoroddsen et al. Reference Thoroddsen, Takehara and Etoh2012) is not appropriate to describe the plethora of velocities observed. However, a clear temporal trend can be identified in all diagrams of figure 13, showing that the velocity magnitude significantly exceeds the impact velocity
  ${\sim}6U$ but then decreases with time. Thoroddsen et al. (Reference Thoroddsen, Takehara and Etoh2012) demonstrated that the droplets decelerate by 30 % just
  $40~\unicode[STIX]{x03BC}\text{s}$ after the pinch-off due to the aerodynamic forces acting on the droplets. Since our experimental set-up does not allow us to capture the ejection velocity precisely at the beginning of splashing, the velocities measured in this study are lower than those calculated by the inviscid theories (Roisman Reference Roisman2009; Riboux & Gordillo Reference Riboux and Gordillo2015; Cimpeanu & Moore Reference Cimpeanu and Moore2018) at the pinch-off moment (Thoroddsen et al. Reference Thoroddsen, Takehara and Etoh2012). The ejection angle of the droplets is small at the beginning of splashing but later on increases drastically depending on the splashing regime. The differences in the ejection angles for each splashing regime become clearer after calculating the average over time. The results indicate that the ejection angle for the corona splash
  $\unicode[STIX]{x1D6FC}\sim 47^{\circ }$ is always larger than for the prompt splash
  $\unicode[STIX]{x1D6FC}\sim 28^{\circ }$. This is caused by the aerodynamic forces acting on the lamella, which deflect the thin sheet during its formation (Moore et al. Reference Moore, Whiteley and Oliver2018).

Figure 13. The velocity of the ejected droplets. The data show the velocity magnitude of the droplets over their diameter, the velocity components, and the ejection angle as an example of the prompt splash (a–c) and corona splash (d–f) regime. The colours indicate the dimensionless time  $\unicode[STIX]{x1D70F}$ and the arrows highlight the tendency. The grey area represents our resolution limits.
The evolution of the mean velocities and secondary droplet angles for various impact conditions are shown in figure 14. The mean magnitude of the velocity decreases with time for all impact parameters. Our measurements indicate that at the initial stage of drop impact and spreading this velocity is not influenced by surface tension or viscosity. This is because the lamella spreading velocity is much higher than the relative Taylor velocity (Taylor Reference Taylor1959), and the lamella is thicker than the viscous boundary layer, as accurately described by the inviscid solutions (Roisman Reference Roisman2009; Riboux & Gordillo Reference Riboux and Gordillo2014, Reference Riboux and Gordillo2017). More recently, Cimpeanu & Moore (Reference Cimpeanu and Moore2018) showed that the root thickness and velocity of the ejected lamella can be well predicted within their proposed approximation using a variation of Wagner’s theory, which neglects the surface tension and viscosity. This shows that the velocity of the jet at the initial stage of drop impact is, in fact, weakly dependent on the physical properties of the liquid. At a later stage of impact, when the boundary layer reaches the free surface  $\unicode[STIX]{x1D70F}_{BL}\approx 0.6Re^{1/5}$, the entire flow in the lamella is influenced significantly by the liquid viscosity since it is thinner than the predicted viscous boundary layer (Roisman Reference Roisman2009). For the cases shown in figure 14(a), the estimated values of
  $\unicode[STIX]{x1D70F}_{BL}$ are between 5 and 6. Some scatter in the data at times
  $\unicode[STIX]{x1D70F}>2$ can be explained by the fact that the viscosity effects at the thinner periphery of the spreading lamella become significant at earlier times. Nevertheless, the effect of the liquid properties on the magnitude of the velocity is rather small. Our measurements demonstrate that the evolution of the average velocity follows the dependence
  $\overline{u}\sim 1/\sqrt{\unicode[STIX]{x1D70F}}$ predicted by the RG theory within (4.2) and measured in Thoroddsen et al. (Reference Thoroddsen, Takehara and Etoh2012) and Burzynski & Bansmer (Reference Burzynski and Bansmer2018). This theoretical approach together with the experiments presented here indicate that the mean velocity of secondary droplets appears to be close to universal for high-speed impacts, as shown in figure 14(a). This behaviour appears to be weakly dependent on different liquids, drop sizes and impact velocities analysed in this work. Further detailed experiments and numerical simulations are needed to corroborate if the velocity of the spreading lamella is universal for high-speed impacts.

Figure 14. The evolution of secondary droplet velocities and angles over time. Panel (a) shows the evolution of the measured mean droplet velocity and its agreement with the theoretical prediction ( $\overline{u}\sim \unicode[STIX]{x1D70F}^{-1/2}$) within the RG theory. Panel (b) shows the evolution of the ejection angle over time and its theoretical estimation.
The mean ejection angle of the secondary droplets monotonically increases over time, as shown in figure 14(b). Its evolution is slightly affected by the liquid properties, i.e., the splashing regime. As a result, higher ejection angles are detected in the cases corresponding to lower values of the Reynolds number. To estimate this ejection angle using the RG theory, it is necessary to determine the vertical velocity  $u_{y}$ of the secondary droplets. This velocity is produced by the aerodynamic lift force applied to the advancing front of the lamella. The lift force
  $F_{L}$ is defined as the sum of the viscous force induced by the surrounding gas beneath the lamella and the suction force at the top of it:
 $$\begin{eqnarray}F_{L}=K_{lub}\unicode[STIX]{x1D707}_{g}U_{l}+K_{u}\unicode[STIX]{x1D70C}_{g}U_{l}^{2}H_{l},\end{eqnarray}$$
 where  $K_{lub}\simeq -2(\ln (19.2\unicode[STIX]{x1D706}_{g}/H_{l})-\ln (1+19.2\unicode[STIX]{x1D706}_{g}/H_{l}))$ is a variable obtained from the lubrication theory,
  $K_{u}=0.3$ is a drag coefficient obtained from numerical simulations and
  $\unicode[STIX]{x1D706}_{g}$ is the mean free path of the gas molecules. Note that the RG model also accounts for the effective slip, which is relevant to describe the thin layers of the rarefied gases (Gordillo & Riboux Reference Gordillo and Riboux2019). The vertical velocity of the lamella
  $U_{l,y}$ can be estimated from the force balance in vertical direction
  $\unicode[STIX]{x1D70C}H_{l}^{2}U_{y,l}\propto F_{L}$ (Riboux & Gordillo Reference Riboux and Gordillo2017), which leads to an approximated dimensional vertical velocity of
  $u_{y,model}\sim 10U\sqrt{F_{L}/(\unicode[STIX]{x1D70C}H_{l}U_{l}^{2})}$.
Figure 14(b) shows that this theory accurately predicts the tendency of the ejection angle for moderate impact velocities over time. The RG model predicts a decrease of this angle by increasing the impact velocity; however, our measurement results clearly demonstrate an increase in the ejection angle. An example of this behaviour can be observed from the images in figure 8(b,e,h). One possible reason for this discrepancy may be the influence of the aerodynamic forces acting on the droplets once they detach from the rim, such as drag or lift; additionally, the dynamics of the jets appearing during prompt splash are not considered in the RG theory. Therefore, the model is not applicable to accurately predict the ejection angle of secondary droplets. We conclude that these dynamics play an important role in high-speed droplet impacts and should be considered in further analysis. For this reason, we provide a detailed supplementary dataset available at https://doi.org/10.1017/jfm.2020.168 with the measurement results presented in this study and a selection of high-resolution images for different cases.
4.3 Total volume ejected during splashing
The total ejected volume during splashing  $V_{tot}$ is calculated using the extrapolation method, as shown in § 2.2, and it depends notably on the splashing regime. Figure 15(a) quantifies these large differences in the generation of secondary droplets between the corona and prompt splash over time. The results demonstrate that in the prompt splash regime the droplets are generated over a short time period, while in the corona splash regime the droplets are expelled for longer due to corona formation and the subsequent breakup. Two peaks can be observed in the ejected volume for the corona splash regime over time, suggesting two main instabilities in the spreading lamella. The first instability is captured at the very beginning of splashing when the ejected lamella moves very fast. The atomisation process is started in this case by the rim instability and generates a notable quantity of droplets. Then the viscous forces decelerate the lamella strongly, and the corona can be fully formed above the surface. During this process, fewer droplets are expelled from the rim. The second and major peak in figure 15(a) results afterwards when the unstable film breaks up, atomising the entire corona rapidly. The numerical simulations performed by Cimpeanu & Papageorgiou (Reference Cimpeanu and Papageorgiou2018) on the splashing of small drops at high velocity demonstrate a very similar behaviour of the ejected volume measured here. It has to be kept in mind that
  $\unicode[STIX]{x1D70F}$ in figure 15(a) represents the time at which the droplet passes through our control surface and not the time at which the droplets break up from the rim of the expanding lamella, as explained in § 2.2 and shown in figure 5.

Figure 15. Total volume ejected during splashing. Panel (a) illustrates the volume flux ejected over time for the prompt and corona splash regimes. Panel (b) shows the ratio between the total secondary volume ejected and the initial drop volume as a function of the splashing parameter  $\unicode[STIX]{x1D6FD}$ for all the experimental data available.
In our previous work (Burzynski & Bansmer Reference Burzynski and Bansmer2019), we presented a formulation for the total ejected volume, which depends on the splashing parameter  $\unicode[STIX]{x1D6FD}=\sqrt{F_{L}/(2\unicode[STIX]{x1D70E})}$ obtained from the RG theory. This splashing parameter determines that if the lift force
  $F_{L}$ acting on the lamella is greater than the retraction force due to capillarity, i.e.,
  $\unicode[STIX]{x1D6FD}>0.14$, the lamella starts to detach from the surface and then atomise into secondary droplets. As a result,
  $\unicode[STIX]{x1D6FD}$ is directly proportional to the number of ejected droplets and the total ejected volume. However, we demonstrated by measuring this ejected volume that the splashing threshold for high-speed impacts differs for the threshold of 0.14 found in Riboux & Gordillo (Reference Riboux and Gordillo2014). The splashing for high-speed impact occurs when
  $\unicode[STIX]{x1D6FD}>0.19$, as shown in figure 15(b). The large number of experiments conducted in this study for different liquids, droplet sizes and impact velocities allows us to generalise the semi-empirical model developed in Burzynski & Bansmer (Reference Burzynski and Bansmer2019) in the form
 $$\begin{eqnarray}\frac{V_{tot}}{V_{D}}=3.5\unicode[STIX]{x1D6FD}^{2}-0.7\unicode[STIX]{x1D6FD}+0.02,\end{eqnarray}$$
 which is applicable to a wide range of Weber and Reynolds numbers. This expression accurately predicts the total ejected volume regardless of the splashing regime, kinematic conditions and the surrounding gas, as demonstrated in figure 15(b). Equation (4.5) allows us to explore the conditions at which a drop would entirely atomise into secondary droplets  $V_{tot}=V_{D}$. This hypothetical case leads to
  $\unicode[STIX]{x1D6FD}=0.64$, and in order to reach such value, an undisturbed water droplet of
  $D=1~\text{mm}$ would have to impact the surface at
  $75~\text{m}~\text{s}^{-1}$ under normal ambient pressure. These conditions lead to a limiting Weber number of
  $We\approx 77\,000$. However, it is quite unlikely that such a large drop would not deform itself due to the large lubrication pressure having been exceeded. This deformation would drastically change the impact conditions, and in the extreme case it would break up before it contacts the surface, as shown by the experiments of Garcia-Magariño et al. (Reference Garcia-Magariño, Sor and Velazquez2018). Nevertheless, all the available experimental data together with this extension of the RG theory let us conclude that
  $\unicode[STIX]{x1D6FD}$ is not only useful in determining whether splashing occurs or not, but also in predicting with high accuracy the total ejected volume for high-speed droplet impacts. The detailed model proposed here to describe the outcome of drop splashing on dry, smooth surfaces can be indeed used to understand, characterise and predict more accurately the underlying physics in several applications such as aircraft icing, combustion, cooling, electronic systems, ink-jet printing, turbine performance, vehicle soiling, etc.
5 Concluding remarks
Our theoretical and experimental study reveals that a high-speed drop impact on dry surfaces is a complex three-dimensional phenomenon, where the geometry of the spreading liquid is always axisymmetric. However, the periodic disturbances on the thin lamella lead to the jet formation and subsequent breakup at different azimuthal directions, even when the impact conditions are identical. These unsteady azimuthal instabilities develop initially at the early stage of splashing during impacts on dry and wetted surfaces (Thoroddsen et al. Reference Thoroddsen, Takehara and Etoh2012; Li et al. Reference Li, Thoraval, Marston and Thoroddsen2018). To investigate the complex splashing mechanisms experimentally, we made use of multiple high-resolution cameras and analysed the outcome from thousands of impacts. We concluded that the typical outcomes of splashing from the drop impact at high Weber and Reynolds numbers are the corona and prompt splash. Each of these regimes leads to a completely different generation of secondary droplets, indicating that the regimes must be handled separately.
We demonstrated that the mechanism of splashing for high-speed droplet impact is described by the Rayleigh–Taylor instability of the accelerating liquid film. This theory also allows us to determine the boundaries defining the prompt splash regime. The first condition is derived from the rate of growth of the fastest unstable mode in the film and indicates that prompt splash is expected when  $Oh<0.0044$. The second condition is obtained from the corresponding wavelength of the most unstable mode, which predicts prompt splash when
  $We\geqslant 34Re^{1/4}$ is satisfied. The existing experimental data shows excellent agreement with both conditions at low and high impact velocity. In accordance with this theory, we additionally propose an expression for the characteristic time of the corona instability, which allows us to estimate the elapsed time for the generation of secondary droplets.
Although the high-speed drop impact is a very complex physical phenomenon, some quantities of the ejected droplets are independent of or less affected by the impact conditions. It has been demonstrated that the droplet size distribution in a splashing regime is independent of the impact conditions in the investigated parameter range. However, the droplet size distributions for corona and prompt splash differ drastically from each other. The velocity magnitude of the ejected droplets is weakly dependent on the splash regime or kinematic impact conditions and over time behaves like  $\overline{u}\sim 1/\sqrt{\unicode[STIX]{x1D70F}}$ The ejection angle of the droplets increases with time and is affected by the impact conditions. On average, the droplets for prompt splash are ejected at
  $\unicode[STIX]{x1D6FC}\sim 28^{\circ }$ and for corona splash at
  $\unicode[STIX]{x1D6FC}\sim 47^{\circ }$. Additionally, we have demonstrated that the most affected quantity is the total ejected volume, which increases with the impact velocity and liquid viscosity. The results provided by several authors and our experiments let us conclude that the Weber number weakly affects the splashing outcome of high-speed impacts, while the Reynolds number plays a more important role.
The experimental data presented here in combination with the theoretical description of the splashing allows us to extend the theory of Riboux & Gordillo (Reference Riboux and Gordillo2014). The proposed approach in this study can distinguish between the corona and prompt splash, predict whether splashing occurs or not, and estimate the entire outcome of splashing by means of size, velocity and volume ejected when a drop impacts a smooth dry surface at high velocity. Our measurements have shown that splashing of high-speed drops occurs when the splashing parameter is  $\unicode[STIX]{x1D6FD}>0.19$. Moreover, we have provided evidence that the size and velocity of the droplets can indeed be estimated by the thickness and velocity of the ejected lamella.
Acknowledgements
D.A.B. would like to thank R. P. Fegan for conducting part of the experiments. This research was supported by the German Research Foundation (Deutsche Forschungsgemeinschaft, DFG) through financing of the project number BA 4953/3 (D.A.B. and S.E.B.) and in the framework of the SFB-TRR 150 Collaborative Research Centre, subproject A02 (I.V.R.).
Declaration of interests
The authors report no conflict of interest.
Supplementary material
Supplementary material is available at https://doi.org/10.1017/jfm.2020.168.


 Open access