The Impact of Heavy Vehicle Traffic Trends on the Overdesign of Flexible Asphalt Pavements

Department of Civil, Environmental, Land, Building Engineering and Chemistry, Polytechnic University of Bari, 70126 Bari, Italy
*
Author to whom correspondence should be addressed.
Sustainability 2020, 12(7), 2688; https://doi.org/10.3390/su12072688
Submission received: 30 January 2020
/
Revised: 13 March 2020
/
Accepted: 26 March 2020
/
Published: 30 March 2020
(This article belongs to the Special Issue Sustainable Pavement Materials, Design and Construction)
Abstract
:Given their environmental impact, the careful design of asphalt pavements is crucial. Previous research has highlighted the influence of several parameters on the outputs of different pavement design methods. In this study, the focus is on heavy vehicle trends, considering both the percentage of heavy vehicles in the average traffic flow and its evolution over time, which is usually included as a growth factor in the design inputs. Since these factors are very often assumed to be based on old estimates, the first aim of this study was to update them by exploring a recent series of continuous data collected on the Italian motorway network and showing how to infer estimates from historical traffic data. Subsequently, the variability of these input factors is introduced in standard pavement design methods to assess their influence on the design process and to quantify the risk of overdesign. While the analysis of historical heavy vehicle traffic data may reveal an overall zero-growth traffic tendency, different scenarios should be considered and assessed in cost-benefit analyses given the not negligible influence of growth factors on pavement thicknesses. This influence is shown here in different simulated design conditions, with different initial traffic volumes, share of heavy vehicles, and resilient moduli.
1. Introduction
The construction of asphalt pavement systems has a strong impact on the environment. Different approaches to improve the sustainability of road pavement systems have been proposed based on modified asphalts, recycling, life-cycle assessments, and optimized maintenance plans [1,2,3,4,5]. However, independently of the type of pavement system, there are several uncertainties in the design process which may result in inappropriately determining the thickness of pavement layers. Whilst considering traditional asphalt pavement systems, a possible disproportionate thickness resulting from overdesign is a potential source of environmental damage.
Hence, careful design of road pavement systems may prevent squandering of resources. Different methods can be used for designing road pavement systems. Among them, semi-empirical or mechanistic empirical methods such as those based on the AASHTO guides [6,7], also based on multilayer elastic system analysis (see [8]), are used in practice. Several studies have been conducted with the aim of assessing the influence of the different inputs on the outcomes of such methods [9,10,11]. As a result of the sensitivity analyses, the important role of some factors was highlighted (for example, the determination of the subgrade resilient modulus, see [10]).
Apart from construction materials properties, traffic-related factors were also investigated. For example, the variability of the spectrum of heavy vehicles which will travel on the road to be built was assessed [12]. In fact, pavements are normally designed and analyzed as based on the amount of heavy vehicles on the road, assuming that the influence of light vehicles is negligible. Depending on the importance of the facility and the desired serviceability, forecasts of heavy vehicle traffic growth are made for different time ranges. Hence, the analysis of the evolution of trucking is crucial for the pavement design [13]. However, less attention was paid to this specific issue in previous research that investigated the influence of input factors on pavement design.
Estimating the heavy vehicle growth tendency is especially important in the long term. The growth factors which are used in practice usually refer to studies developed decades ago. However, it should be considered that both short-term and long-term macro-economic tendencies may influence traffic volume growth or decrease. Related to this, among the other factors generating uncertainty, the impact of traffic growth variability on pavement design is often neglected. Nevertheless, the use of high growth factors, where not strictly needed, may lead to unnecessary layer thicknesses (overdesign).
In this study, the impact of heavy vehicle traffic trends on the design of flexible asphalt pavements is investigated, starting from the analysis of real traffic data. Hence, this study aims to answer the following research questions:
- How is it possible to infer heavy vehicle traffic growth factors from continuous traffic data?
- How important is the influence of heavy vehicle traffic trends on pavement design?
- Does the overdesign tendency depend on the specific pavement design method adopted?
Historical motorway traffic data have been explored to achieve these objectives. Such data are useful to assess how to infer traffic growth factors from continuous data. Those factors are then used to simulate the pavement design process, considering other influential variables. Two pavement design methods are considered, the semi-empirical and mechanistic empirical, to reveal different possible overdesign patterns.
The remainder of the paper is structured as follows: the methods used in this study are described in the “Methods” section. Furthermore, the results obtained are presented and discussed in the following “Results” and “Discussion” sections, respectively. Finally, some conclusions from the study are drawn.
2. Methods
Firstly, the dataset on which the traffic analysis is based is described together with the elaborations conducted to infer the parameters needed. Secondly, the two pavement design methods are briefly introduced. The use of these methods in the context of the present research is explained as well as the considered assumptions.
2.1. Traffic Data Analysis
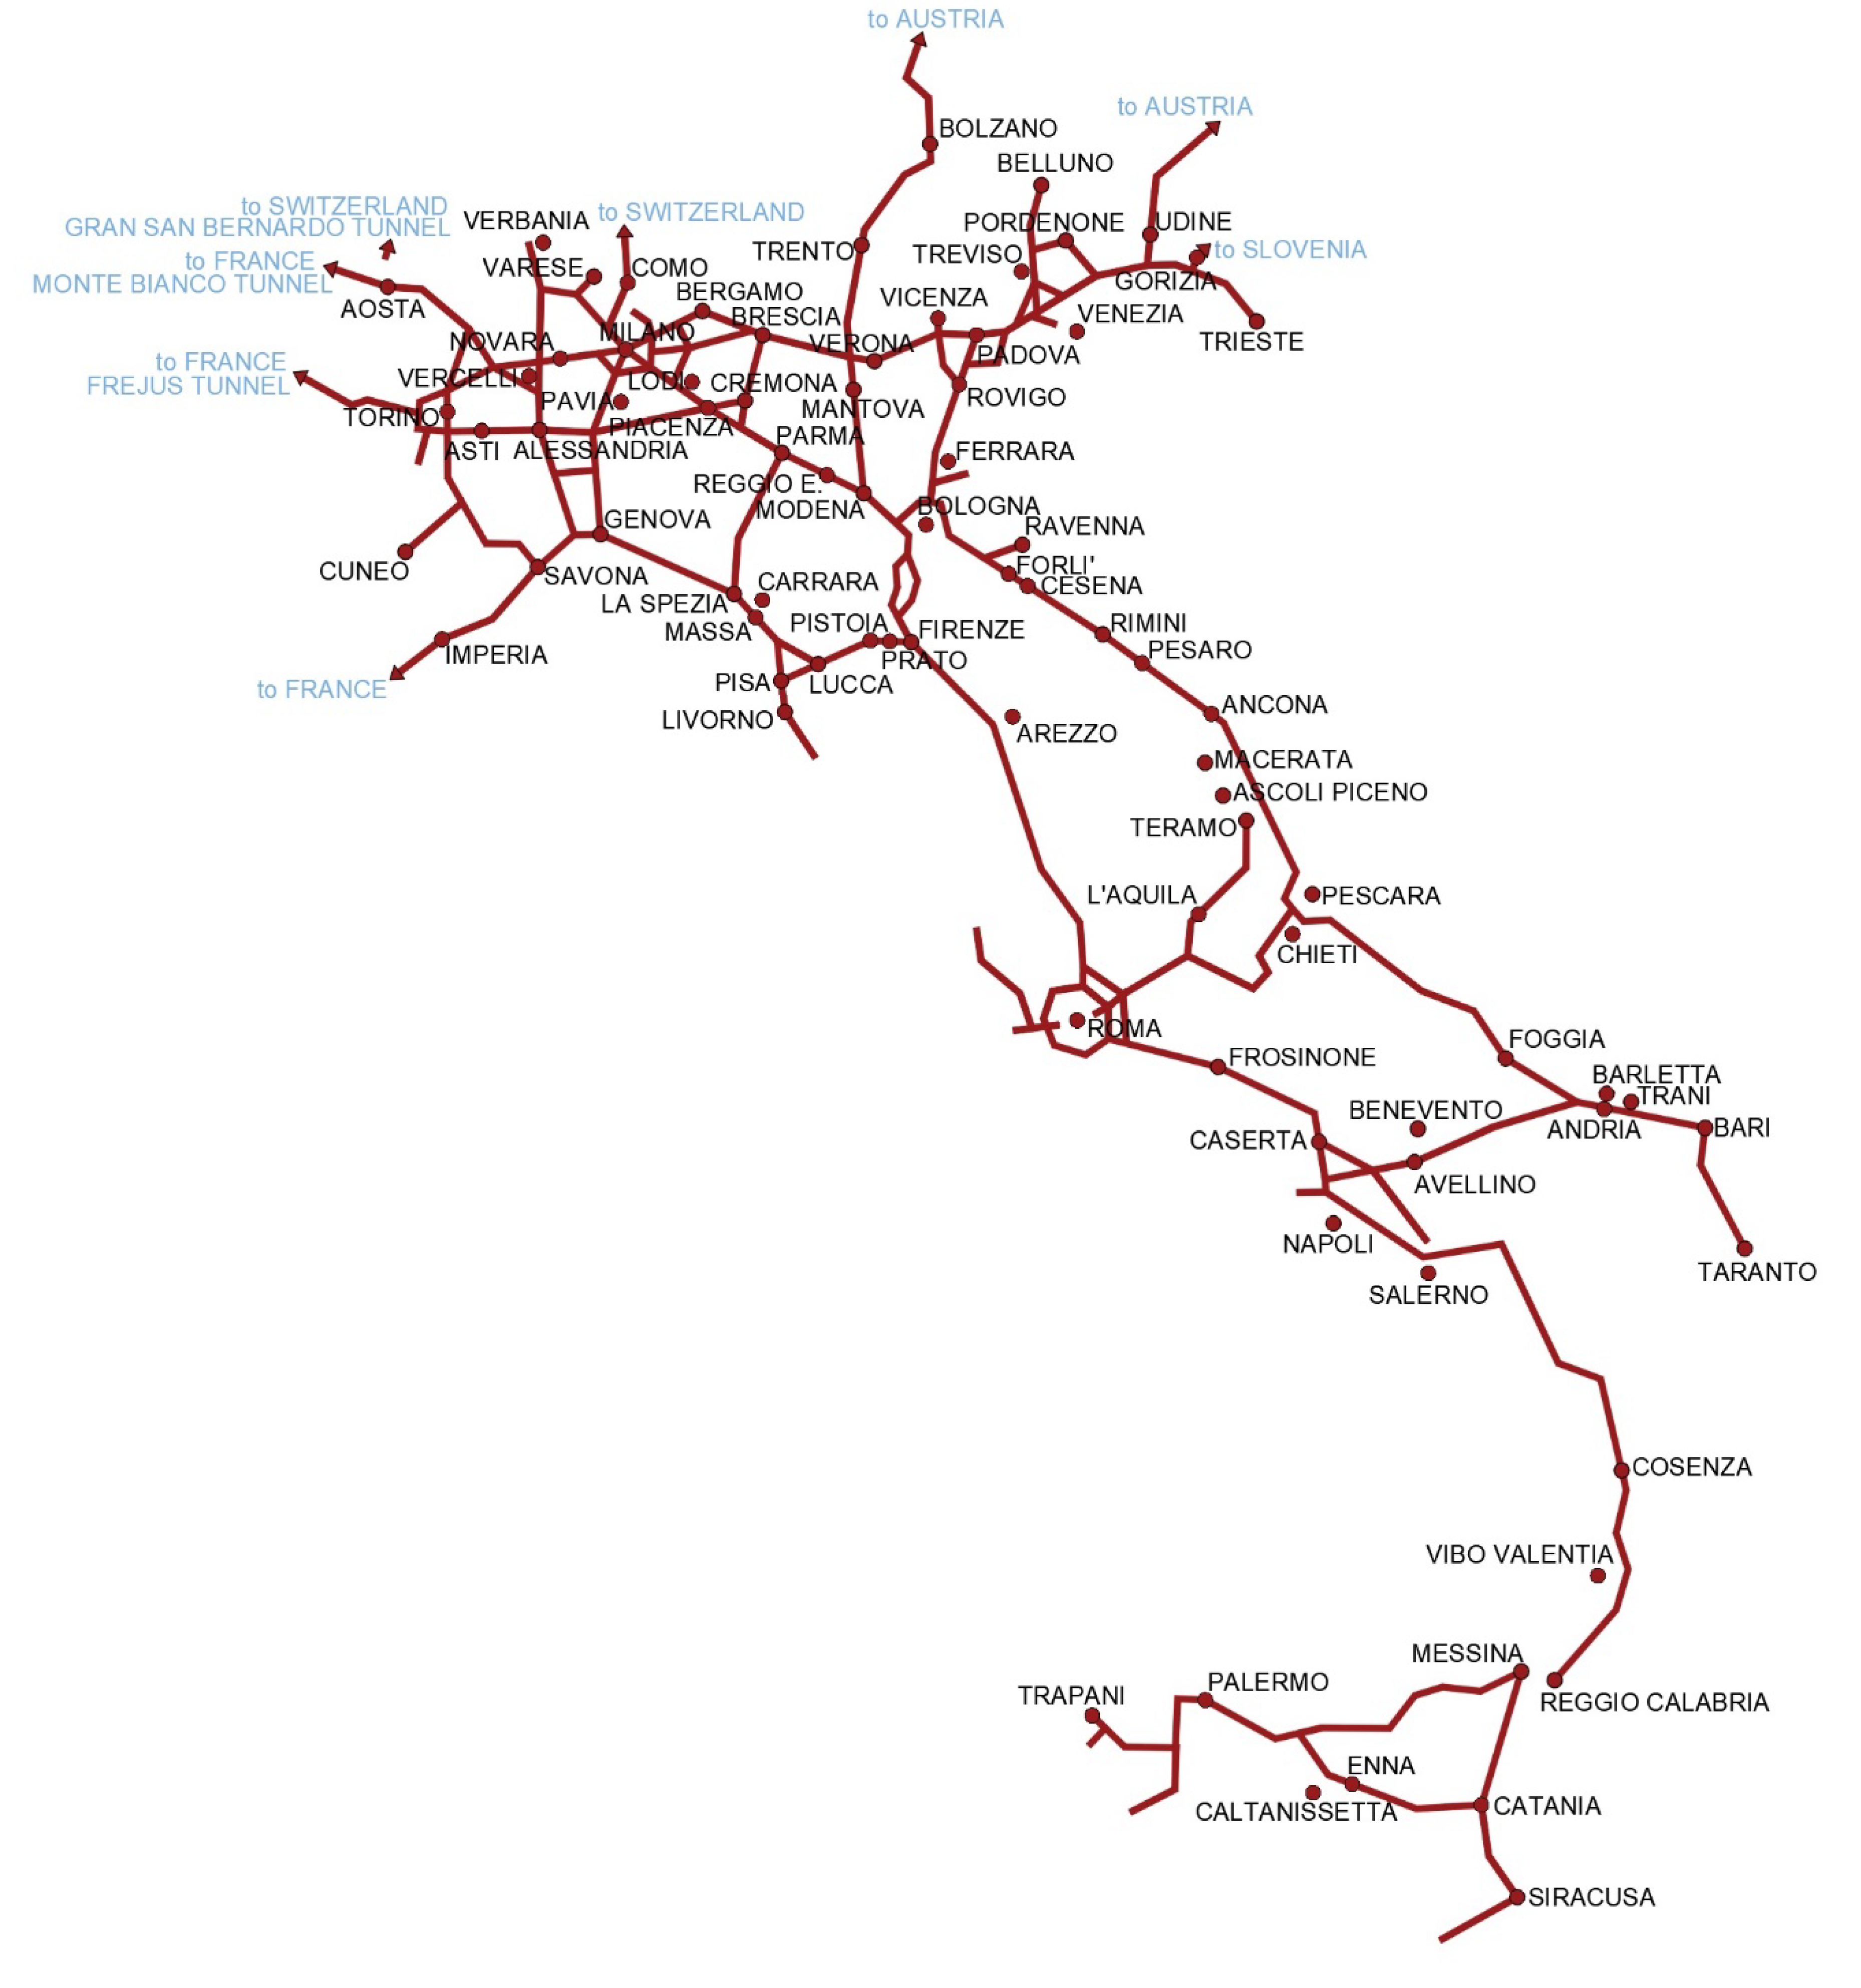
Motorway traffic data were examined with the purpose of identifying heavy vehicle traffic trends. In particular, the information retrieved in [14] was used. The average vehicular traffic volume on motorways belonging to the Italian motorway networks (see Figure 1) have been considered for a total length of 4846 kilometers of roads (belonging to 46 motorway sections with an average length of 105.3 km), with continuously recorded traffic data in the period of 2001–2018. Some motorway sections were excluded because they were built or modified during the studied time period.
The information reported in [14] includes traffic volumes divided into light vehicles and heavy vehicles for each motorway section and each year.
Hence, for each year, it was possible to compute the following values:
These values were then averaged over all the motorway sections in order to obtain a single value of both %HV and HV per km for each year. Once the average yearly estimates of the heavy vehicle traffic volume per kilometer of the motorway network (HVperkm) and the relative percentage of heavy vehicles over the whole traffic volume (%HV) have been obtained, their annual variation is examined. This information is useful for making assessments about their influence on pavement design, which is one of the research questions of this study, as further shown in the Results section.
2.2. Methods for Pavement Design Simulations
Two methods were used for simulating the pavement design process, while considering the influence of the heavy vehicle traffic variability. Both the semi-empirical AASHTO procedure [6] and the KENLAYER software (see [8]), which can iteratively solve the elastic multi-layer system problem, were used. Note that the theoretical comparability between the two methods is outside the scopes of this study. However, the two methods were considered for the simulations in order to assess whether the influence of the heavy vehicle traffic growth, which translates into an increase in the design traffic, may significantly vary by considering different methods. The two methods are briefly introduced as follows.
2.2.1. Semi-Empirical AASHTO Method for Pavement Design
The semi-empirical AASHTO method for pavement design is based on the following experimentally driven equation:
where:
- ESAL = Number of equivalent single axle loads (18 kips ≈ 80 KN axles);= Coefficients depending on the accepted reliability level and the overall design uncertainty;= Structural Number, computed as a function of the layer thicknesses and materials used;= Accepted serviceability loss at the end of the pavement design life;= Resilient modulus of the subgrade.
The number of ESALs travelling on the road pavement in the design life is computed as follows:
where:
- = measures previously defined;AADT = Annual average daily traffic in the first year of the design life;= Factor considering the division of traffic into directions and lanes;= Overall conversion factor of the total passages of different heavy vehicle axles into ESALs;gr = heavy vehicle annual growth rate;= Design life in years.
The Italian motorway network is considered in this study as a data source for heavy vehicle traffic volumes. Hence, the parameters in equations (3) and (4) are set according to the importance of the road (reliability level: 90%, = 0.425, at the beginning of the design life = 4.2, at the end of the design life = 2.5, = 1.7, L = 30 years). The typical heavy vehicle spectrum for Italian motorways [15] was used to compute the factor. The simulations were conducted by taking into account the variability of the following parameters:
- ;
- ;
- ;
- .
Traffic volumes were varied up to 90,000 vehicles/day. The latter traffic volume is assumed to be related to eight lanes motorways (four in each direction), which results in modifying the F factor in Equation (4) (for motorways with more than four total lanes). The variability of the %HV and gr factors is assumed to be based on the results from the traffic data analysis described in the previous step. Two values are assumed for the resilient modulus of the subgrade: 90 and 120 MPa. In the case of such values, a four-layer asphalt pavement is recommended for motorways, as based on Italian guidelines for selecting layer thicknesses [15]. For higher resilient moduli, three-layers of hot-mix asphalt may suffice, while very low moduli are deemed not to be compatible with the importance of the road.
In the presence of such values of the resilient modulus of the subgrade, the following layer thicknesses are recommended for motorway pavements based on the Italian guidelines [15]: surface course 6 cm, binder course 7 cm, a variable base course between 14 and 32 cm depending on the heavy vehicle traffic volume, and a subbase course of 15 cm. Hence, in the simulations, Equation (3) is iteratively solved in different scenarios (considering the variability of the different factors) by varying the base course thickness (and in the case of very high heavy vehicle traffic volumes, the subbase course).
2.2.2. Method Based on an Elastic Multi-Layer System
The other method used for simulating the pavement design process is that based on the solution of an elastic multi-layer system. In this study, the KENLAYER application for flexible pavements included in the KENPAVE software is used (see [8]). It computes stresses and strains in the multi-layer pavement system (see Figure 2) by conducting a damage analysis and estimating the life of a pavement system. The following main inputs are needed:
- The analysis of the heavy vehicle traffic volume by differentiating the heavy vehicle spectrum into passages of different axle loads (of different weights, configurations, and numbers of tires);
- The thickness of each layer of the pavement system;
- The elastic parameters of each layer of the pavement system.
The traffic inputs introduced in the KENLAYER software are selected in order to be coherent with those considered in the semi-empirical AASHTO method (in terms of heavy vehicle spectra for motorways, and the different traffic volumes and growth rates considered). The thickness of each layer of the pavement system is iteratively attempted with the same criteria defined in the previous sub-chapter (variability of the base and subbase course, considering the same design life of 30 years). The elastic moduli of the pavement layers were obtained by converting the minimum features required in [15] (Marshall stability of the surface course: 1100 kg, of the binder course: 1000 kg, of the base course: 800 kg, hypothesizing high heavy vehicle volume, CBR value for the subbase course: 30%) through the conversion tables reported in [8]. The modulus of the subgrade is assumed in coherence with assumptions made in the previous sub-section (90 and 120 MPa).
Considering homogeneous periods, the equation which is used for estimating the design life L is reported as follows [8]:
where:
- ni = predicted load repetitions for each i-th load;Ni = allowed load repetitions for each i-th load, considering both the fatigue cracking and the permanent deformation criteria (defined below [16]);DR = Damage Ratio.
- = tensile strain at the bottom of the asphalt layer;E = asphalt layer modulus;= compressive strain at the top of the subgrade;a,b,c,d,f = constants.
Moreover, in the KENLAYER application, it is possible to introduce different material properties for different periods of the year, thus considering the influence of climate and temperature. This aspect is not considered in this study (as in the AASHTO method) since it is outside the scope of the research questions posed.
3. Results
The results obtained in this study are presented in this section and divided according to the stages considered in the methods section.
3.1. Trends from the Traffic Data Analysis
The motorway traffic data analysis has revealed the heavy vehicle trends reported in the following figures. Means, standard deviations, and yearly variations are presented in Table 1.
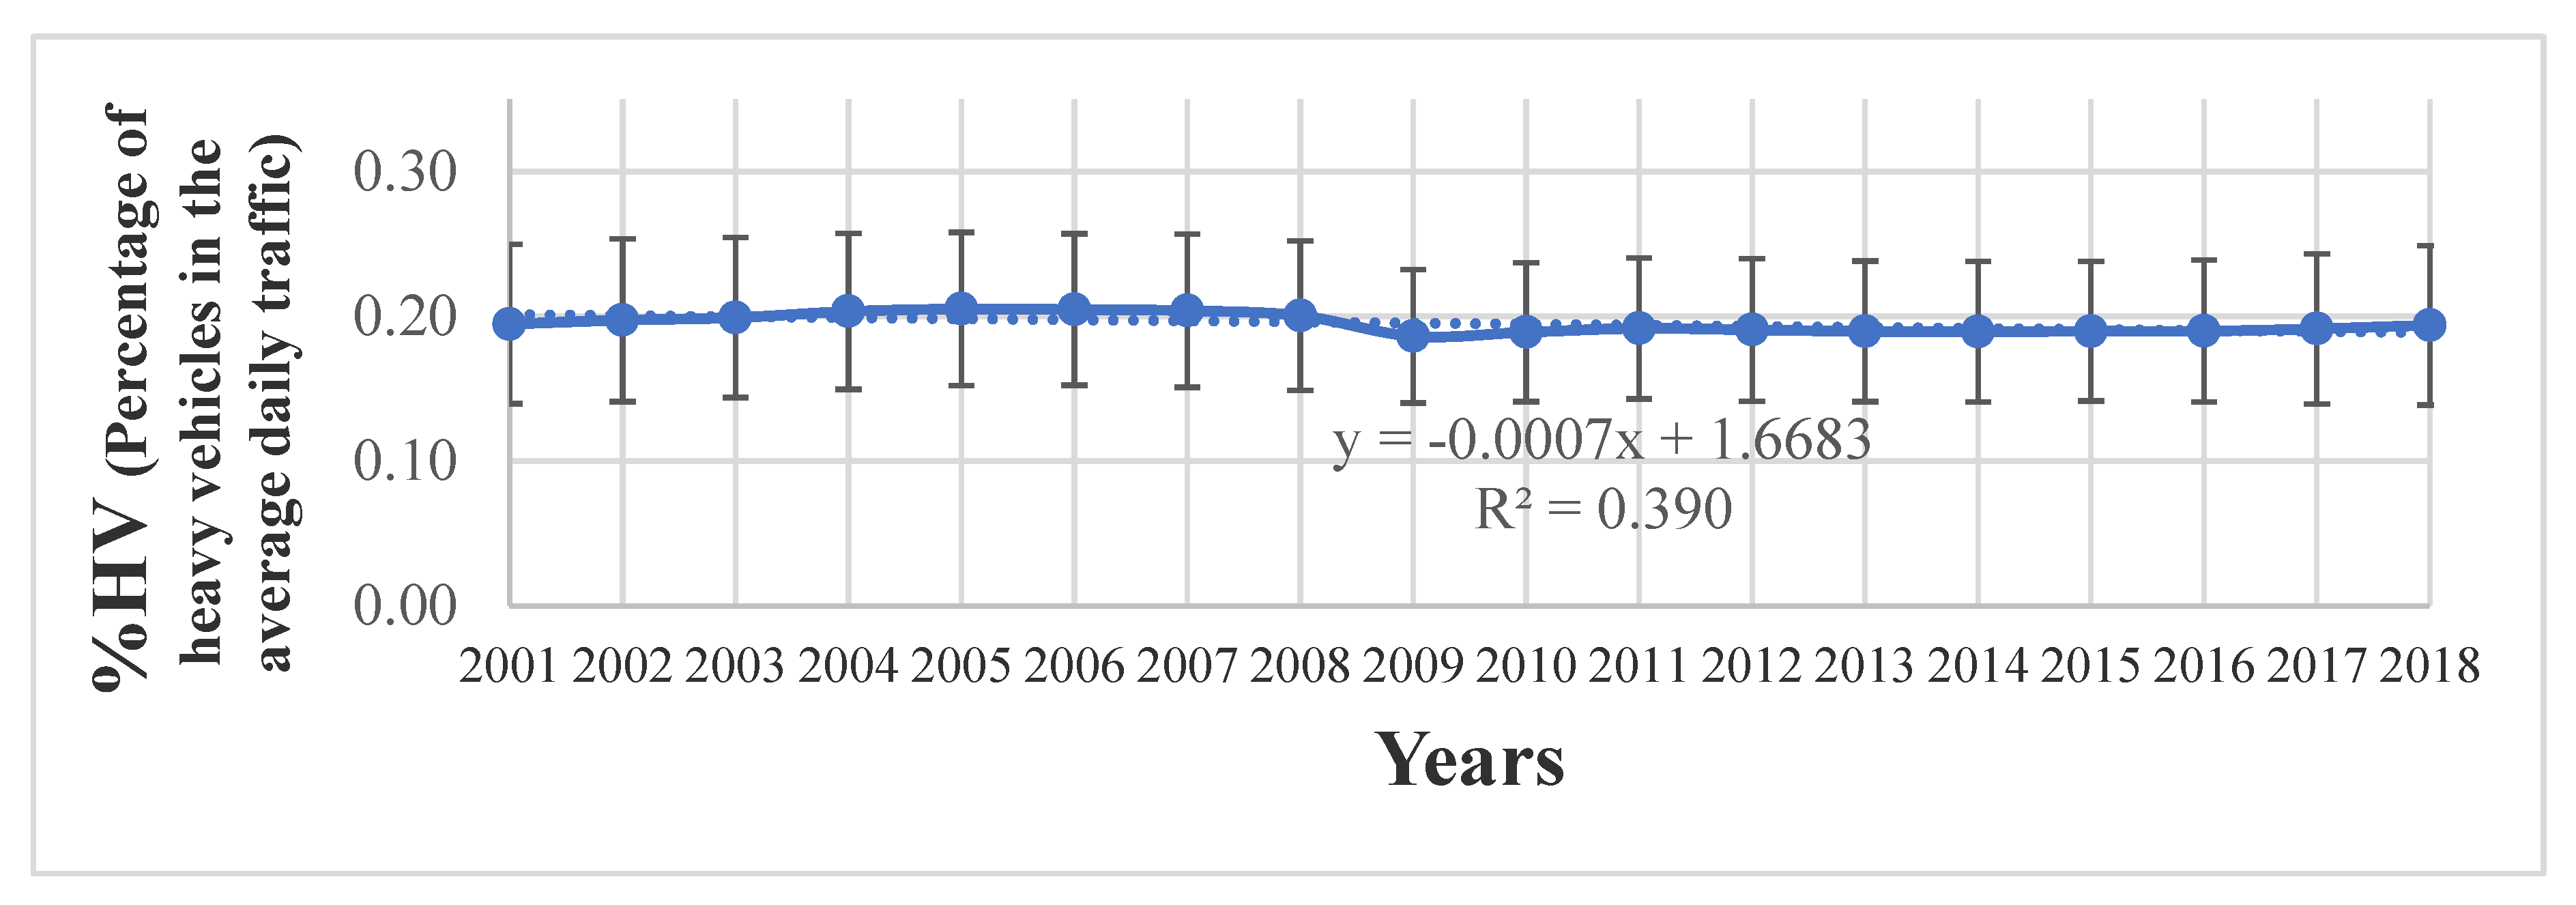
Based on the figures reported above, it is possible to note that the percentage of heavy vehicles in the average daily traffic (%HV) was fairly stable over the years from 2001 to 2018. The average %HV was close to 20%. Considering the standard errors reported in Figure 3 for each year, it can be stated that in almost 70% of motorways sections, %HV varies between approximately 15% and 25%.
The average number of heavy vehicles per km of motorway trunk (HVperkm) is fairly stable over the observation period. It fluctuates between around 215 and 255 HVperkm over the years. In this case, considering the standard errors reported in Figure 4 for each year, in most motorways, HVperkm varies between approximately 50 and 400. The overall average trend even decreased over the years, while the computed annual growth rate averaged over the years is equal to 0.58%, which practically means there was almost zero growth over the observation period. The growth rate is estimated based on the evolution of the value of HVperkm over time, since in this way, the rate is computed over a real amount of heavy vehicles (rather than a percentage) considering the actual average distribution of the vehicles per km of the whole motorway section. Moreover, as can be noticed from the estimates shown in Table 1, this strategy leads to conservative estimates of growth rates with respect to those estimated based on percentages (since the yearly variations based on HV% are very small, given the very low increase in percentages, if any). The influence of setting the growth rate is one of the research questions of this study. Hence, in addition to average tendencies which lead to almost zero growth, it is worth breaking down the analysis period into smaller periods to reveal some local tendencies. In fact, while in recent decades almost zero growth was noted, in relation to the different effects of a financial crisis [17], it is quite unusual and risky to consider zero traffic growth for a future time span equal to the design life of the road (in this case, 30 years). Local growth tendencies are shown in the next figure.
Based on Figure 5, some local growth tendencies can be found in three different periods, which cover more than half of the observation period. The average computed yearly growth tendencies are: 2.8% in the first period (Figure 5a), 0.9% in the second period (Figure 5b), and 2.0% in the third period (Figure 5c). This means that even considering local tendencies, the yearly HV growth rate does not exceed 3%.
These estimates are based on country-wide averages. However, the motorway network covers the whole country and Italy is made up of different areas with specific socio-economic features [17]. Moreover, as is evident from the standard deviation values, the heavy vehicle traffic volume is highly variable across the motorway network. Hence, the above reported growth rates were computed again by differentiating the whole sample of motorways into groups based on macro-regions (using the NUTS-1 classification [18]) and traffic volume ranges. Traffic volume ranges were defined by dividing motorways into homogeneously numerous clusters. The following classes were thus considered: low volume (motorway sections with average daily volume <50,000 vehicles/day), medium volume (50,000–100,000 vehicles/day), high volume (100,000–150,000 vehicles/day), and very high volume (>150,000 vehicles/day).
As it can be noted from Table 2, the previously reported average estimates do not notably vary when different regions and traffic clusters are considered. In particular, the average growth rates are always between 0% and 1% (except for low-volume motorways, where it is 1.3%). Most maximum growth rates are always between 2% and 3%. However, there is one noticeable value belonging to low-volume motorways (4.6%).
The variability of the heavy vehicle traffic trends is considered in the pavement design simulations performed. According to the results presented in this sub-section, the following values are assumed for the previously defined variables:
- ―10%, 20%, 30%;
- gr―0.00, 0.01, 0.02, 0.03.
Note that gr = 0.03 is considered only for some traffic volumes, because in other cases it may result in the long term in volumes incompatible with the road depending on the initial volume. Note that only in the case of low-volume motorways, a higher growth rate could have been considered (up to 4.6%). However, given the scarcity of these cases, and the average growth rates always variable between 0% and 1%. The maximum growth rate was set to 3% in accordance with average country-wide values.
3.2. Results from the Pavement Design Simulations
The results obtained from the pavement design simulations using both the AASHTO method and the KENLAYER software are shown in the next figures. In these figures, the minimum thickness of the base course is shown for different combinations of the resilient modulus (MR), the share of heavy vehicles (%HV), the heavy vehicle growth rate (gr), and the initial annual average daily traffic (AADT). The results for low-traffic motorways (with AADT < 50,000 vehicles/day, likely four-lanes motorways) are shown in Figure 6. The results for other motorways (with AADT ≥ 50,000 vehicles/day, likely to be six or eight-lanes motorways) are shown in Figure 7.
Apart from trivial remarks on the variability of the layer thickness with the initial traffic volume, the share of heavy vehicles (resulting in thickness increasing) and the resilient modulus of the subgrade (resulting in thickness decreasing), there is an evident influence of the heavy vehicle growth rate. In fact, depending on the considered combination of variables, it may result in a thickness variation of 1 to 4 cm between zero growth rate and the maximum considered rate (3%). This is less evident when considering results from the KENLAYER simulations, but minimum required thicknesses are smaller in that case and so their variability is smaller as well. The significant influence of the traffic growth rate can be noted for different resilient moduli, different traffic volumes, and percentages of heavy vehicles. In several cases, even a 1% gr increase is related to thickness increasing, resulting in a significant overall increase in the total heavy vehicle passages. In some limited cases, once the maximum thickness of the base course is reached (32 cm, according to [15]), the subgrade course thickness is also increased under the different growth rates with respect to the standard constant thickness of 15 cm [15], such as in the case of: MR = 90 MPa, %HV = 20–30% (Figure 7a).
The KENLAYER software relies on the application of a mechanistic model. Through additional simulations performed, it was verified that results from the KENLAYER software are comparable with those obtained from the AASHTO method, assuming a reliability percentage of 50% ( = 0 in Equation (3)), far lower than that assumed in the simulations (results plotted in Figure 6a and Figure 7a). Hence, the variability of the heavy vehicle traffic growth on the outputs from the considered design methods could be possibly interpreted as an effect of a different assumed design reliability. In other words, a significant effect of the heavy vehicle growth factor can be noted independently of the assumed reliability level. Clearly, the possible overdesign effect is more evident for high-volume motorways and for lower values of the resilient moduli. For example, in several cases of low-volume motorways (MR = 120 MPa, %HV = 10–20%), a minimum pavement thickness (with a base course of 14 cm) seems adequate, independently of the growth factor. However, a thickness varying (from 1 cm to 3 cm) with the growth factor increasing (from 0% to 3%) can always be seen for high-volume motorways, in the case of MR = 90 MPa.
4. Discussion
The traffic data analysis has revealed recent trends for heavy vehicle traffic volumes. In particular, it highlighted that, from 2001 to 2018, the share of heavy vehicles in the traffic volume on motorways in Italy did not increase, and nor did the average number of heavy vehicles per kilometer of motorway section (significantly). Increasing tendencies in local traffic growth were limited for some years to about 3% at most, except for some limited sub-categories of lower volume motorways.
This result from a recent continuous set of traffic data suggests the importance of considering recent trends for estimating the traffic growth factors, which may be much more limited than values considered in some less recent sources (see [8]). The same advantage is valid for the estimates of the percentage of heavy vehicles in the traffic flow. Clearly, for both estimates, local factors related to infrastructure development, socio-economic factors, transport policies, and changes in the market [13] of specific countries may be even more determinant than the availability of recent data. For example, we have shown how the growth factor may vary between regions and traffic ranges even within the sample of Italian motorways.
The first research question concerned the possibility of estimating long-term trends useful for pavement design from historical continuous traffic data. We have shown that estimates based on recent data may even suggest a zero-growth traffic trend (such as in this case), or in any case fluctuating over the years. Hence, it may be arduous to infer a single estimate from historic traffic trends, especially in the presence of fluctuating economic conditions, which may influence traffic volumes. In this study, different scenarios were hypothesized to account for this issue, including the “best-case” scenario of zero-growth traffic and the “worst-case” scenario based on the highest country-wide yearly growth rate found in the observation period for at least two years in a row.
The other research questions concerned the influence of the heavy vehicle variability on pavement design, considering different possible methods. The possible overdesign effect due to high hypothesized traffic growth rates was verified by means of two commonly used pavement design methods (the AASHTO semi-empirical [6] and mechanistic model, through the KENLAYER software [8]). A significant influence of the heavy vehicle variability was highlighted for both the considered methods. Concerning the study aims, it is possible to note that the variability of the pavement thickness due to the growth rate is more evident in the results obtained from the AASHTO method. However, this may be intrinsically related to the chosen design reliability level, and thus, the greater thicknesses obtained. It is evident that other factors may have a greater impact on thickness, such as the resilient modulus of the subgrade [10] which is clear from simulation results. Even the growth rate factor, which is one of the most uncertain parameters to be estimated, has a significant influence on the pavement layer thicknesses because it obviously relates to an increase in the total heavy vehicle traffic. In some cases, variations in the gr rate from 0% to 3 % resulted in an increased thickness of up to 3–4 cm, for a design life of 30 years. To provide some reference numbers, a base course thickness increase of 4 cm on a 10 km long eight-lane motorway section may result in an order of magnitude of €2 million cost increase and an additional 1.5 million cubic meters of asphalt mixture. These values clearly indicate a possible economic and environmental issue. Higher traffic growth rates, which may be used in common practice, may then result in even greater variations.
The proposed strategy for estimating increasing trends is to consider different scenarios based on recent estimates. Considering this approach in accordance with the results from simulations, some remarks are evident, which may be useful in practice. In fact, different traffic growth scenarios should be included among the important factors to be implemented in detailed life-cycle assessments, or at least in the general framework of a cost-benefit analysis related to pavement management systems [19]. Otherwise, from a practical perspective, in some cases designers may still rely uniquely on old estimates, which may not be appropriate in the particular local context and which may result in the overdesign of pavement layer thicknesses.
5. Conclusions
This study was conceived in order to answer some research questions which may be of interest for both practitioners and for the further development of research. It was aimed at assessing the relationships between heavy vehicle historical continuous traffic volumes and the related estimates useful for pavement design. Moreover, it was aimed at assessing the influence of these estimates on pavement design by means of different methods.
The difficult connections between historical heavy vehicle traffic data and parameter estimates to be used for future periods have been highlighted. In particular, an almost zero-growth tendency was found in the recent period of almost 20 years, as based on data related to the Italian motorway network. This was confirmed by disaggregating the sample of motorways into sub-groups according to different regions and traffic ranges. Hence, with the aim of considering non null growth factors, other local values were estimated based on consecutive years during which an increasing traffic tendency was noted, leading to a maximum country-wide estimated growth factor of 3% (which may have local variations).
Pavement design is consistently influenced by the growth factor on the considered road type due to the high traffic volumes reached in the overall design life. This effect can be noted from both the methods used for simulations (which were found to be comparable in given conditions), particularly for the semi-empirical method. An increase in the base course thickness up to 4 cm was noted for traffic growth factors increasing from 0% to 3%, and in limited cases, in the subbase course thickness as well, indicating a possible overdesign effect. Hence, the results from this study encourage consideration of different possible scenarios for the traffic growth factor by including them in the cost-benefit analysis and/or life-cycle assessment.
These remarks are based on traditional asphalt pavements as an example, but they could also be applicable for pavements made with different materials. Moreover, further research may apply the same procedure with comparison within countries for different road types or within a larger procedure of cost-benefit analysis with specific focus on heavy vehicle traffic trends. Further sensitivity analysis considering several influential variables may also provide new insights into possible overdesign effects specifically due to given pavement design methods.
Author Contributions
Conceptualization, P.I., N.B., P.C. and V.R.; methodology, P.I., N.B. and V.R.; software, P.I.; investigation, P.I.; data curation, P.I.; writing—original draft preparation, P.I.; writing—review and editing, P.I., N.B., P.C. and V.R.; supervision, P.C. and V.R. All authors have read and agreed to the published version of the manuscript.
Funding
This research received no external funding.
Acknowledgments
Cristian Lazzari is acknowledged for the preparatory analysis performed by using two pavement design methods during his master’s thesis.
Conflicts of Interest
The authors declare no conflict of interest.
References
- Tutu, K.A.; Tuffour, Y.A. Warm-mix asphalt and pavement sustainability: A review. Open J. Civ. Eng. 2016, 6, 84. [Google Scholar] [CrossRef] [Green Version]
- Giustozzi, F.; Crispino, M.; Flintsch, G. Multi-attribute life cycle assessment of preventive maintenance treatments on road pavements for achieving environmental sustainability. Int. J. Life Cycle Assess. 2012, 17, 409–419. [Google Scholar] [CrossRef]
- Praticò, F.G.; Giunta, M.; Mistretta, M.; Gulotta, T.M. Energy and Environmental Life Cycle Assessment of Sustainable Pavement Materials and Technologies for Urban Roads. Sustainability 2020, 12, 704. [Google Scholar] [CrossRef] [Green Version]
- Santero, N.J.; Masanet, E.; Horvath, A. Life-cycle assessment of pavements. Part I: Critical review. Resour. Conserv. Recycl. 2011, 55, 801–809. [Google Scholar] [CrossRef]
- Bressi, S.; Santos, J.; Giunta, M.; Pistonesi, L.; Lo Presti, D. A comparative life-cycle assessment of asphalt mixtures for railway sub-ballast containing alternative materials. Resour. Conserv. Recycl. 2018, 137, 76–88. [Google Scholar] [CrossRef]
- American Association of Highway and Transportation Officials (AASHTO). Guide for Design of Pavement Structures; AASHTO: Washington, DC, USA, 1993. [Google Scholar]
- American Association of Highway and Transportation Officials (AASHTO). Mechanistic-Empirical Pavement Design Guide: A Manual of Practice; AASHTO: Washington, DC, USA, 2008. [Google Scholar]
- Huang, Y.H. Pavement Analysis and Design, 2nd ed.; Prentice Hall Inc.: Upper Saddle River, NJ, USA, 2004. [Google Scholar]
- Stroup-Gardiner, M.; Turochy, R.E.; Carter, A. Influence of various material and traffic inputs on flexible pavement design methods for Alabama roadways. J. Transp. Eng. 2007, 133, 455–461. [Google Scholar] [CrossRef]
- Baus, R.L.; Fogg, J.A. AASHTO flexible pavement design equation study. J. Transp. Eng. 1989, 115, 559–564. [Google Scholar] [CrossRef]
- Schwartz, C.W.; Li, R.; Ceylan, H.; Kim, S.; Gopalakrishnan, K. Global Sensitivity Analysis of Mechanistic–Empirical Performance Predictions for Flexible Pavements. Transp. Res. Rec. 2013, 2368, 12–23. [Google Scholar] [CrossRef] [Green Version]
- Haider, S.W.; Harichandran, R.S. Effect of axle load spectrum characteristics on flexible pavement performance. Transp. Res. Rec. 2009, 2095, 101–114. [Google Scholar] [CrossRef]
- Hajek, J.J.; Billing, J.R. Trucking trends and changes that affect pavements. Transp. Res. Rec. 2002, 1816, 96–103. [Google Scholar] [CrossRef]
- Associazione Italiana Società Concessionarie Autostrade e Trafori (AISCAT). Informazioni (Notiziario Trimestrale). (In English: Information). 2001–2018. Available online: http://www.aiscat.it/pubblicazioni.htm (accessed on 23 January 2020).
- Consiglio Nazionale delle Ricerche (CNR), (Italian National Research Council). Catalogo Delle Pavimentazioni Stradali (In English: Road Pavements Catalogue); CNR: Roma, Italy, 1995.
- Asphalt Institute. Thickness Design—Asphalt Pavements for Highways and Streets (No. 1); Asphalt Institute: Lexington, KY, USA, 1981. [Google Scholar]
- Stuckler, D.; Basu, S.; Suhrcke, M.; McKee, M. The health implications of financial crisis: A review of the evidence. Ulst. Med. J. 2009, 78, 142. [Google Scholar]
- Eurostat. Regions in the European Union. Nomenclature of Territorial Units for Statistics—NUTS 2016/EU-28; Publication Office of the European Union: Luxembourg, 2018.
- Santos, J.; Ferreira, A. Pavement design optimization considering costs and preventive interventions. J. Transp. Eng. 2012, 138, 911–923. [Google Scholar] [CrossRef]
Figure 1.
Sections of the Italian motorway network for which data are available until the end of 2018 (adapted from [14]).
Figure 1.
Sections of the Italian motorway network for which data are available until the end of 2018 (adapted from [14]).

Figure 2.
Multi-layer elastic pavement system.

Figure 3.
Trend of the heavy vehicles share in the average daily traffic (%HV) in the analyzed period.
Figure 3.
Trend of the heavy vehicles share in the average daily traffic (%HV) in the analyzed period.

Figure 4.
Trend of the average heavy vehicles per km of motorway trunk in the analyzed period.

Figure 5.
Local HVperkm increasing trends in the periods: (a) 2001–2007, (b) 2009–2011, (c) 2013–2018.
Figure 5.
Local HVperkm increasing trends in the periods: (a) 2001–2007, (b) 2009–2011, (c) 2013–2018.

Figure 6.
Minimum thickness required for the base course considering the variation of MR, %HV, AADT, gr, for low-traffic motorways as an output of: (a) the AASHTO method, (b) the KENLAYER software.
Figure 6.
Minimum thickness required for the base course considering the variation of MR, %HV, AADT, gr, for low-traffic motorways as an output of: (a) the AASHTO method, (b) the KENLAYER software.


Figure 7.
Minimum thickness required for the base course considering the variation of MR, %HV, AADT, gr, for higher traffic motorways as an output of: (a) the AASHTO method, (b) the KENLAYER software.
Figure 7.
Minimum thickness required for the base course considering the variation of MR, %HV, AADT, gr, for higher traffic motorways as an output of: (a) the AASHTO method, (b) the KENLAYER software.


Table 1.
Means, standard deviations (S.D.), and yearly variations (YV) of %HV and HVperkm over all the motorway sections inquired in the observation period.
Table 1.
Means, standard deviations (S.D.), and yearly variations (YV) of %HV and HVperkm over all the motorway sections inquired in the observation period.
| %HV | HVperkm | |||||
|---|---|---|---|---|---|---|
| Year | Mean (%) | S.D. (%) | YV (%) | mean | S.D. | YV (%) |
| 2001 | 19.5 | 5.5 | - | 217.04 | 187.28 | - |
| 2002 | 19.7 | 5.6 | 1.38 | 222.29 | 185.44 | 2.42 |
| 2003 | 19.9 | 5.5 | 0.89 | 230.39 | 188.29 | 3.65 |
| 2004 | 20.3 | 5.4 | 2.15 | 241.01 | 194.44 | 4.61 |
| 2005 | 20.5 | 5.3 | 0.81 | 243.99 | 192.49 | 1.24 |
| 2006 | 20.5 | 5.2 | −0.17 | 250.31 | 194.73 | 2.59 |
| 2007 | 20.4 | 5.3 | −0.38 | 255.37 | 198.18 | 2.02 |
| 2008 | 20.0 | 5.2 | −1.70 | 249.31 | 195.88 | −2.37 |
| 2009 | 18.6 | 4.6 | −7.09 | 232.82 | 185.48 | −6.61 |
| 2010 | 18.9 | 4.8 | 1.51 | 236.67 | 187.49 | 1.66 |
| 2011 | 19.2 | 4.9 | 1.38 | 237.03 | 185.86 | 0.15 |
| 2012 | 19.1 | 4.9 | −0.52 | 219.63 | 174.89 | −7.34 |
| 2013 | 19.0 | 4.8 | −0.54 | 215.33 | 172.07 | −1.96 |
| 2014 | 18.9 | 4.9 | −0.11 | 215.80 | 170.05 | 0.22 |
| 2015 | 19.0 | 4.8 | 0.15 | 221.57 | 171.39 | 2.68 |
| 2016 | 19.0 | 4.9 | 0.05 | 226.12 | 174.11 | 2.05 |
| 2017 | 19.1 | 5.2 | 0.83 | 233.41 | 177.38 | 3.23 |
| 2018 | 19.4 | 5.5 | 1.29 | 237.37 | 179.50 | 1.70 |
| Average | 19.5 | 5.1 | −0.00 | 232.53 | 184.16 | 0.58 |
Table 2.
Growth rates of motorways divided into region and traffic groups.
| Group Type | Region | Average Heavy Vehicle Volume | ||||||
|---|---|---|---|---|---|---|---|---|
| Group | North-West | North-East | Centre | South * | Very High | High | Medium | Low |
| Number of Motorways ** | 21 | 13 | 11 | 13 | 11 | 10 | 14 | 11 |
| Average Growth Rate (%) | 0.62 | 0.79 | 0.99 | 0.44 | 0.47 | 0.43 | 0.66 | 1.26 |
| Maximum Growth Rate (%) | 3.03 | 2.86 | 2.44 | 2.51 | 2.31 | 2.91 | 3.34 | 4.60 |
| Period (Maximum Growth Rate) | ‘01–‘07 | ‘13–‘18 | ‘01–‘07 | ‘01–‘07 | ‘13–‘18 | ‘01–‘07 | ‘02–‘07 | ‘01–‘07 |
* Includes the only motorway for the Islands region. Two years of data for the A56 motorway were extrapolated. ** Some motorways are considered for more than one region, since they significantly cross the borders of the considered macro-regions.
© 2020 by the authors. Licensee MDPI, Basel, Switzerland. This article is an open access article distributed under the terms and conditions of the Creative Commons Attribution (CC BY) license (http://creativecommons.org/licenses/by/4.0/).
Share and Cite
MDPI and ACS Style
Intini, P.; Berloco, N.; Colonna, P.; Ranieri, V. The Impact of Heavy Vehicle Traffic Trends on the Overdesign of Flexible Asphalt Pavements. Sustainability 2020, 12, 2688. https://doi.org/10.3390/su12072688
AMA Style
Intini P, Berloco N, Colonna P, Ranieri V. The Impact of Heavy Vehicle Traffic Trends on the Overdesign of Flexible Asphalt Pavements. Sustainability. 2020; 12(7):2688. https://doi.org/10.3390/su12072688
Chicago/Turabian StyleIntini, Paolo, Nicola Berloco, Pasquale Colonna, and Vittorio Ranieri. 2020. "The Impact of Heavy Vehicle Traffic Trends on the Overdesign of Flexible Asphalt Pavements" Sustainability 12, no. 7: 2688. https://doi.org/10.3390/su12072688
Note that from the first issue of 2016, this journal uses article numbers instead of page numbers. See further details here.