Comparing Hot and Cold Loading in an Integrated Biomass Recovery Operation


1
School of Forest Resources, University of Maine, Orono, ME 04469, USA
2
Ecological Restoration Institute, Northern Arizona University, Flagstaff, AZ 86011, USA
3
Rocky Mountain Research Station, U.S. Forest Service, Missoula, MT 59801, USA
4
Warnell School of Forestry and Natural Resources, University of Georgia, Athens, GA 30602, USA
*
Author to whom correspondence should be addressed.
Forests 2020, 11(4), 385; https://doi.org/10.3390/f11040385
Submission received: 17 February 2020
/
Revised: 20 March 2020
/
Accepted: 23 March 2020
/
Published: 28 March 2020
(This article belongs to the Special Issue Forest Operations in Environmentally Sensitive Areas)
Abstract
:The balance of production activities at the landing is pivotal to the success of any forest harvesting operation and has a direct impact on the cost and efficiency of the enterprise. The primary objective of this study was to understand the operational characteristics of the loader in a hot operation (handling both sawlog and biomass components concurrently) and cold operation (handling biomass and sawlogs separately) for harvesting sawlogs and biomass. Systematic work sampling techniques were employed to obtain “snapshots” of the loader activities for a cable logging operation, including the interaction of the loader with other operational phases and delay time for both hot and cold configurations. The results show that for hot loading at the landing, the yarder was the most utilized machine (85%), and was the bottleneck of the operation, followed by the loader (70%). In the hot loading configuration, 39% of operational delay during truck loading was caused by the loader and was predominantly due to movement of the loader within or between the landings. This was followed by the yarder (19%, due to rigging activities) and the chaser (15%, to maintain the crews’ safety). In the cold loading configuration, delays due to the unavailability of roll-off bins constituted up to 77% of the operational delay. This suggests that the number of bins and trucks hauling biomass has a crucial role in the overall efficiency of the biomass harvesting system, and should be well balanced with loading capacity. Additionally, the choice of hot or cold biomass loading operations is highly dependent on the site and operating conditions.
1. Introduction
Woody biomass energy has been recognized as a major contributor in the renewable energy sector, representing 2% of the total annual energy consumption of the US during 2018 [1]. According to the Renewable Energy Directive, the European Union is expecting woody biomass to contribute about 20% of renewable energy by 2020 [2]. Additionally, if forest residues produced by forest management were not being utilized for energy production, they would be burned on-site for disposal, which is a common practice with significant emissions and fire risk considerations [3]. Various aspects of recovering forest residues consisting of tree-tops, off-shoots, branches, foliage, non-merchantable and small-diameter trees left after timber harvest (referred to as “biomass” in this paper) have been widely researched, including harvesting operations, logistics, biomass recovery, moisture content, and economic and environmental benefits [2,4,5,6,7,8,9,10,11,12,13]. However, the major focus remains on the financial viability of biomass recovery. The reason for this can be primarily attributed to the comparatively high cost of handling and low value of the feedstock generated [14].
A “hot” operation is one that harvests sawlogs and biomass at the same time, rather than stockpiling biomass on-site and waiting until the sawlogs are removed before the biomass is processed and removed, which is known as a “cold” operation. The cost of an integrated operation (i.e., harvesting both sawlogs and biomass) is often considered when trying to utilize biomass and can vary greatly, depending on multiple factors such as market conditions, harvesting systems, silvicultural prescriptions, terrain, etc. [15,16]. For example, within Humboldt County, California, USA, the cost of different biomass recovery operations has been reported as US$34.37 BDMT−1 (Bone Dry Metric Ton) [17], $47.55 BDMT−1 [18], $27.00 BDMT−1 [19], and $40.19 BDMT−1 [7]. However, in northern California, the typical delivered price for processed biomass feedstock in the form of wood chips or hog fuel for energy production has been found to be around $45.36 BDMT−1 [20]. Therefore, the margin between profit and loss is small and is expected to remain so under current market conditions.
Because much of the forested landscape in the Pacific Northwest of the USA is located on steep terrain in remote locations, the profitability of biomass recovery operations is further reduced because the operational costs of cable yarding systems for sawlogs and biomass are higher compared to ground-based systems used on more gentle terrain. Additionally, a survey done in southern Oregon and northern California National Forests found that only five cable yarding contractors were involved in thinning treatments focused on mitigating fuel loads to reduce fire risk (i.e., “fuel treatments”) [21], which is a widespread forest management need in the region. As the cost of treatment is highly correlated with the topography of the terrain, breaking even between cost and revenue is extremely challenging without an effective operations plan [22,23].
Proper planning and execution of harvest operations have been shown to help reduce operational costs by 30% when using similar equipment and operators in comparable harvesting conditions [24]. Enhanced efficiency of forest operations depends on several critical strategies that are tailored for specific situations, among which machine productivity and system balance are the key factors [25]. Previous forest operations research has been focused on equipment involved in primary transportation and processing [26,27,28]. However, the loader can also be key to operations, especially in an integrated timber harvest, because the loader is used in both log and biomass harvest.
Coupled (Hot) and Decoupled (Cold) Loading Operations
Among the machines at the landing in a typical cable yarding operation, the loader can be considered as the most mobile and multi-tasking machine; its tasks include cleaning the landing, facilitating primary and secondary transportation, sorting, decking, and loading logs and biomass [29]. The cost of operating a loader ($1.74–5.83 BDMT−1) [7,19,26,30] on a biomass recovery operation is comparatively less than other harvesting phases, but can still be around 20% of the total in-woods operational cost. However, in an integrated harvest, the loader is one of the few machines handling both sawlogs and biomass materials. At peak production, the loader may have to handle several tasks at the same time (for example, loading sawlogs, piling biomass and clearing the deck for the yarder), which can result in operational delays to both upstream (yarder and processing) and downstream (trucking) activities. Without proper planning, the loader can turn into a bottleneck in the system influencing the harvesting productivity of the entire operation, especially on steep terrains with limited landing space. Although the loader is a relatively inexpensive machine to operate, delays due to such bottlenecking can decrease the productivity of other expensive machines and rapidly increase the unit cost ($ BDMT−1) of the operation as a result.
There are two types of loading arrangement typical to biomass recovery operations: hot and cold loading. A hot loading operation (coupled arrangement) occurs when woody biomass and sawlogs are loaded concurrently at the same landing. Multiple machines are working simultaneously and their operations are interdependent (i.e., coupled), therefore a delay in biomass operations might impact the sawlog operations, or vice versa. Here, priority is given to sawlog loading as the loader alternates between other activities, including, clearing landing for primary transportation, cleaning deck, sorting sawlogs, as well as handling biomass. In contrast, for a typical cold operation (decoupled arrangement), machines work independently and do not interact with each other excessively during the work process. “Cold” biomass loading occurs after all sawlogs and associated machinery (felling, primary transportation, and processing) have been moved out of the harvest unit and all that is left behind is equipment for biomass recovery. This is usually carried out for cleaning harvest units for replanting, recovering residues for utilization, or reducing the fuel load to reduce wildfire risk. Cold loading operations can immediately follow sawlog extraction; however, in many cases they are delayed for months to facilitate drying, which increases the value of biomass if it is used for fuel [10,31]. It is also common for loaders engaged in cold loading to do extra work onsite, such as closing roads.
From an economic point of view, both loading arrangements have varying effects on the overall efficiency of the harvesting operation. Additionally, each arrangement has different levels of interactions between various machines which can directly impact the entire operational productivity [25]. The goal of the study was to improve biomass operations and economic utilization of biomass residues by providing information that will help forest managers and contractors choose and manage the most efficient operations for a specific site. We evaluated the efficiency and operational patterns at the landing in hot and cold loading arrangements for a biomass recovery operation. The specific objectives of the study were to: (1) evaluate the interaction between various machines and operational phases in a hot loading operation; (2) analyze the operational pattern and distribution of work activities in a loader and compare hot and cold biomass loading arrangements; (3) identify imbalances in the systems that contribute to operational delays; and (4) develop operational strategies to address imbalances and other inefficiencies. Quantifying and comparing system productivity, efficiency and costs is the foundation of meeting these objectives. This information can enable managers and contractors to better understand and manage biomass recovery operations in a cost-effective manner and make economically sound managerial decisions and appropriate harvest system selections.
2. Materials and Methods
2.1. Study Site and Operation
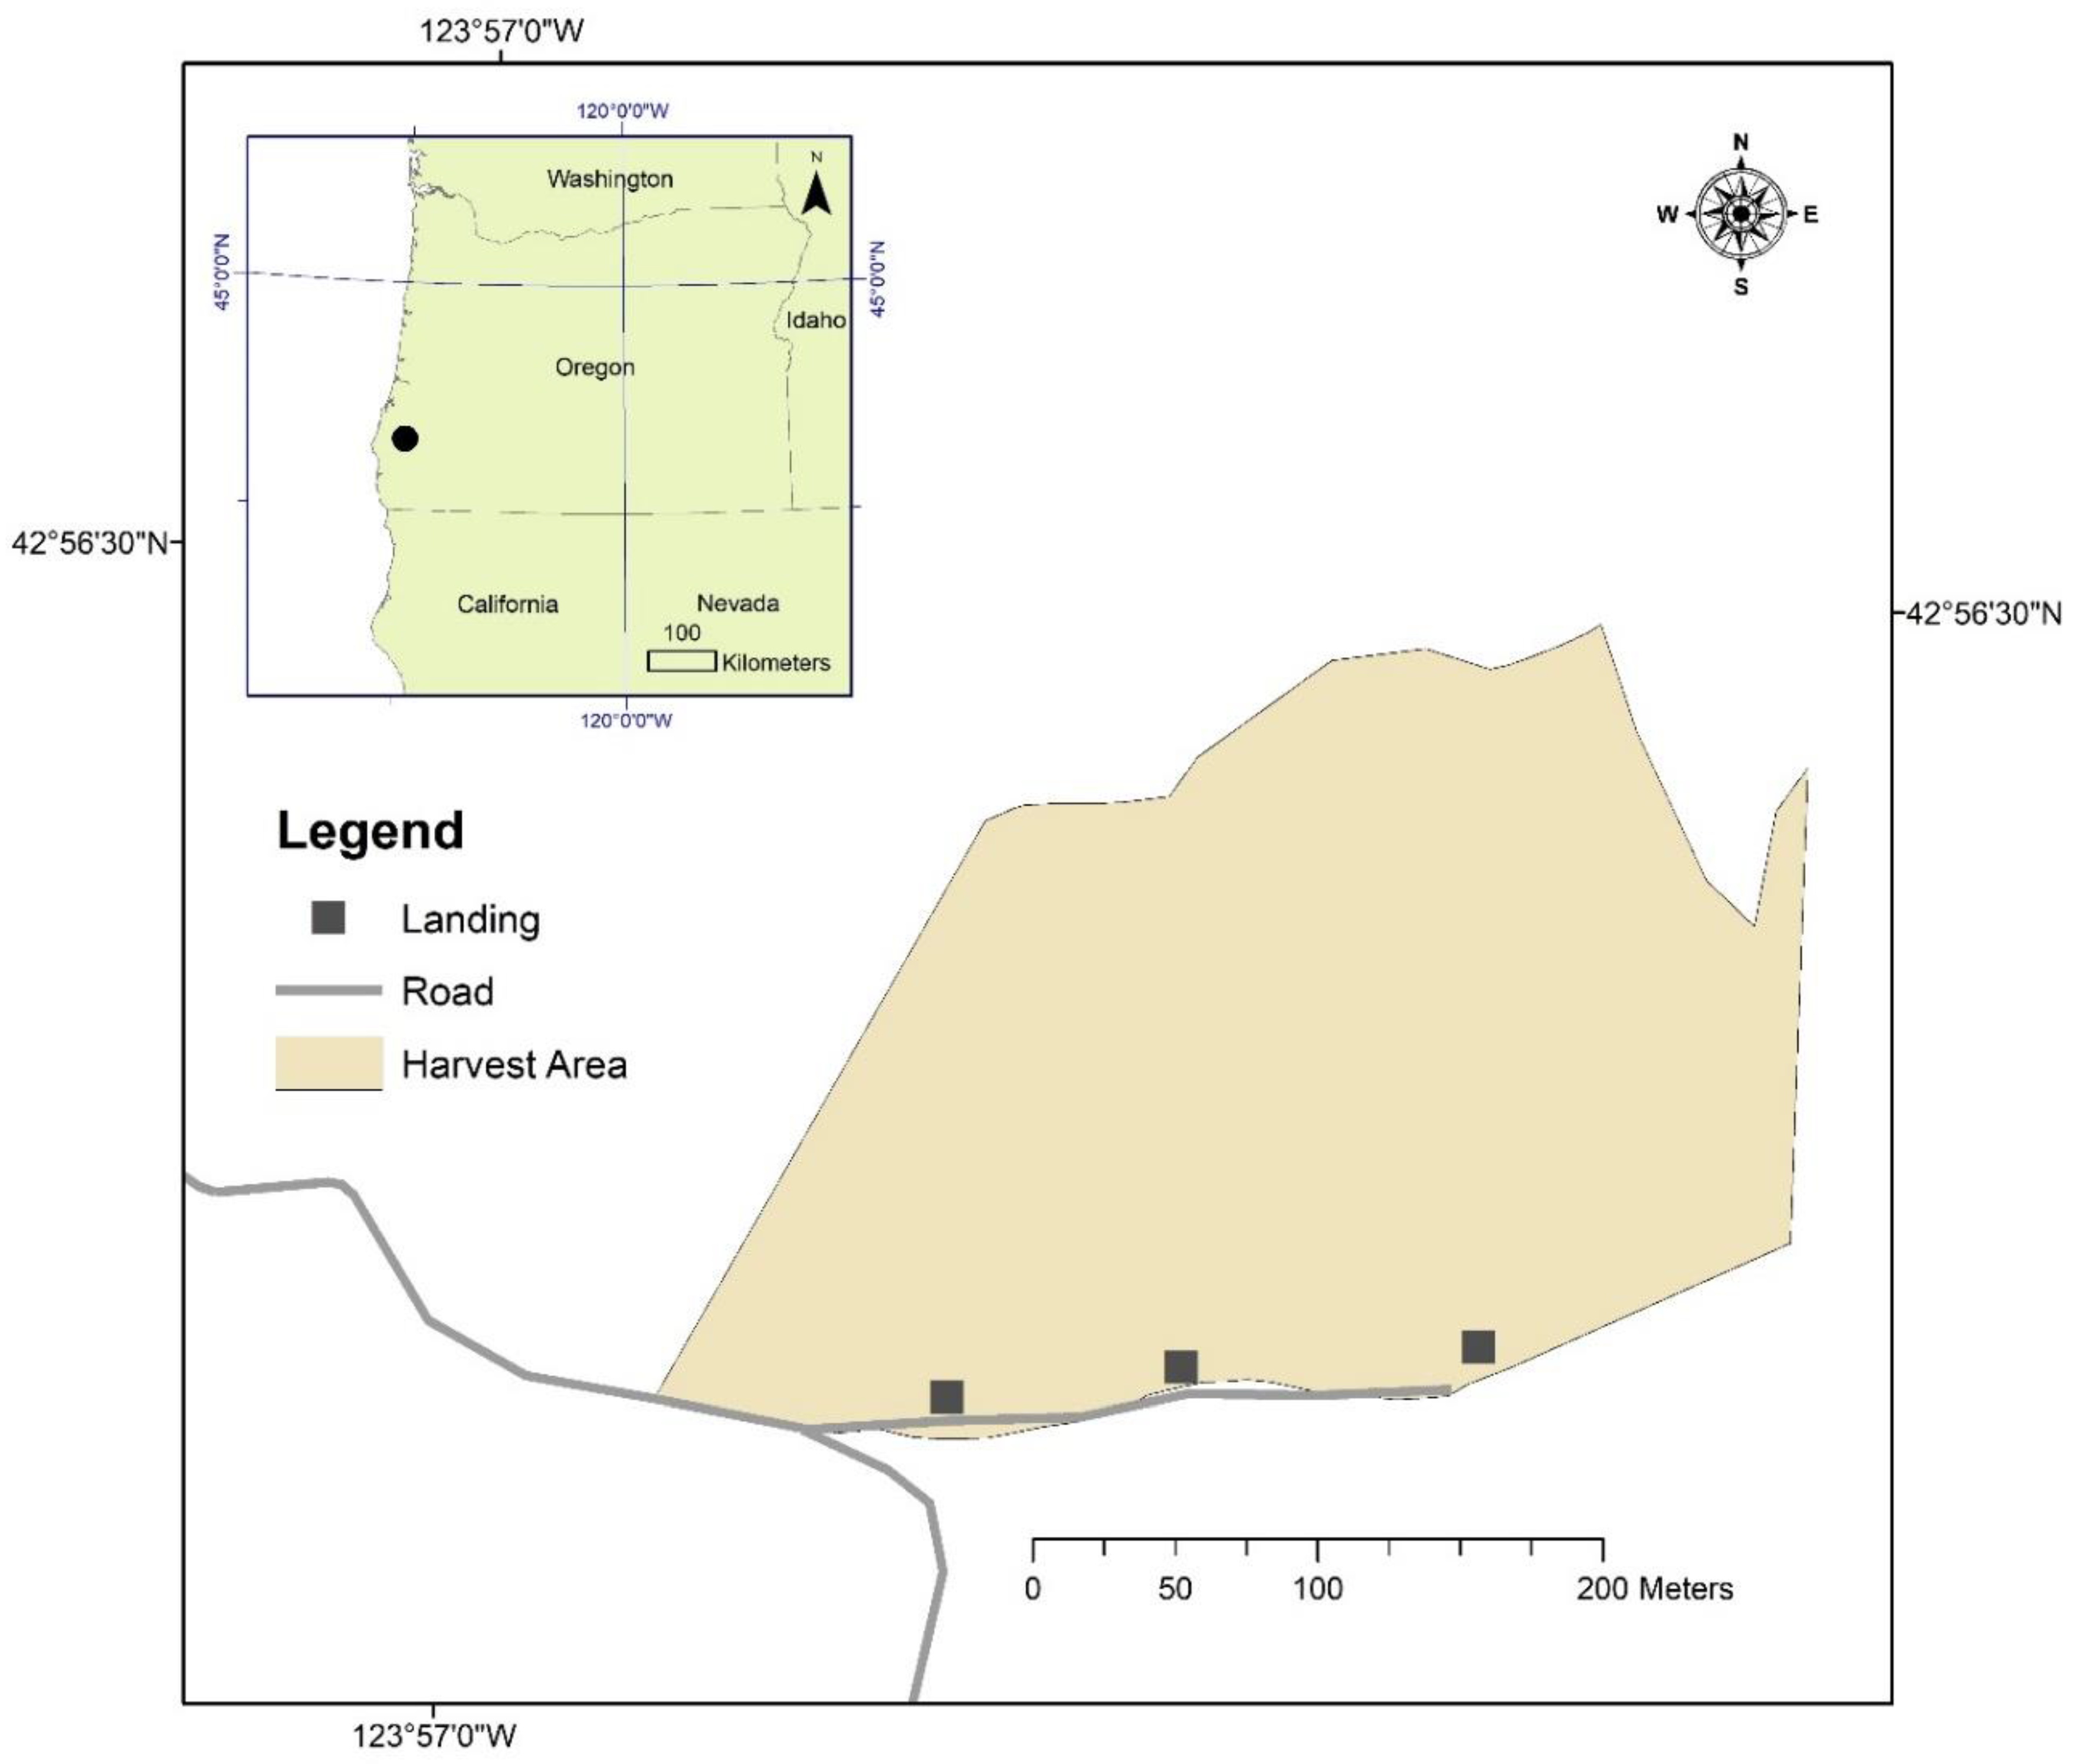
The study was conducted on industrial timberlands owned and managed by the Coquille Indian Tribe and situated in Coos County, Oregon (123°56′48″ W and 42°56′24″ N) (Figure 1). The harvest unit selected was 7.28 ha in area and about 420–600 m above sea level. The annual temperature ranges from 5 to 21 °C and is rarely below 0 °C or above 24 °C. The rainy season lasts for 10 months, from August to June, with an annual precipitation of around 157 cm. Soil type was predominantly Preacher-Digger-Umpcoos association. The slope of the units ranged from 0 to 53% with an average of 36%. The harvest site was dominated by Douglas fir (Pseudotsuga menziesii (Mirb.) Franco) (90%). The other tree species found were Western hemlock (Tsuga heterophylla (Raf.) Sarg.), Grand fir (Abies grandis (Douglas ex D. Don) Lindley), and Tan oak (Notholithocarpus densiflorus (Hook. & Arn.) Manos, Cannon & S.H.Oh).
The silvicultural system was classified as an even-aged management, with a clear-cut prescribed at the end of the rotation, leaving some trees according to Forest Stewardship Certification (FSC) requirements. The steep terrain of the region warranted cable yarding. Trees were manually felled and bucked at the stump using a chainsaw. Felling was decoupled from the yarding operations by several weeks. A TSY 255 cable yarder with an ACME motorized carriage hauled both sawlogs and biomass components uphill using a standing skyline system. Biomass yarding was done primarily to facilitate the manual replanting of trees. Three choker setters in the unit hooked chokers and assisted with rigging activities. At the landing, two chasers unhooked the yarded trees and processed them into merchantable lengths using chainsaws. A thunderbird 840 W loader (1980s Model) sorted, decked, and loaded sawlogs; along with handling biomass. The loader operator had 24 years of experience, and his work patterns were generally efficient.
There were five sorts for the sawlogs: (a) two quality sorts for Douglas-fir logs with a log length of 12 m or more; (b) two quality sorts for Douglas-fir logs of length 10 m or less; and (c) one western hemlock sort (all log lengths). The loader was designed for working with large logs (butt-end diameter of 76 cm). Biomass extraction used a roll-off container system, consisting of eleven detachable roll-off containers and one roll-off truck (Figure 2). This trucking configuration consisted of a truck equipped with a hydraulic hook-lift for self-loading the containers (having a volume of approximately 30 m3). The operation was staged at three landings over a period of three weeks in April of 2015 (Figure 2). Eleven days of hot operations and three days of cold operations were observed.
Work sampling (also referred to as activity sampling) techniques provide an opportunity to collect detailed information on various machine interactions in an efficient manner, thereby determining the limitations of current practices [32]. Work sampling techniques also help in better understanding the percentage of scheduled work time that a particular machine spends on each of the several heterogeneous operational tasks that take place in a given period, including delay. This understanding on the nature of work distribution, interaction among different operational phases, and the relative performance of individual machines in the system can be employed to identify potential bottlenecks and other inefficiencies [33]. This technique has been used in timber harvest operational studies to evaluate system balance [19,25].
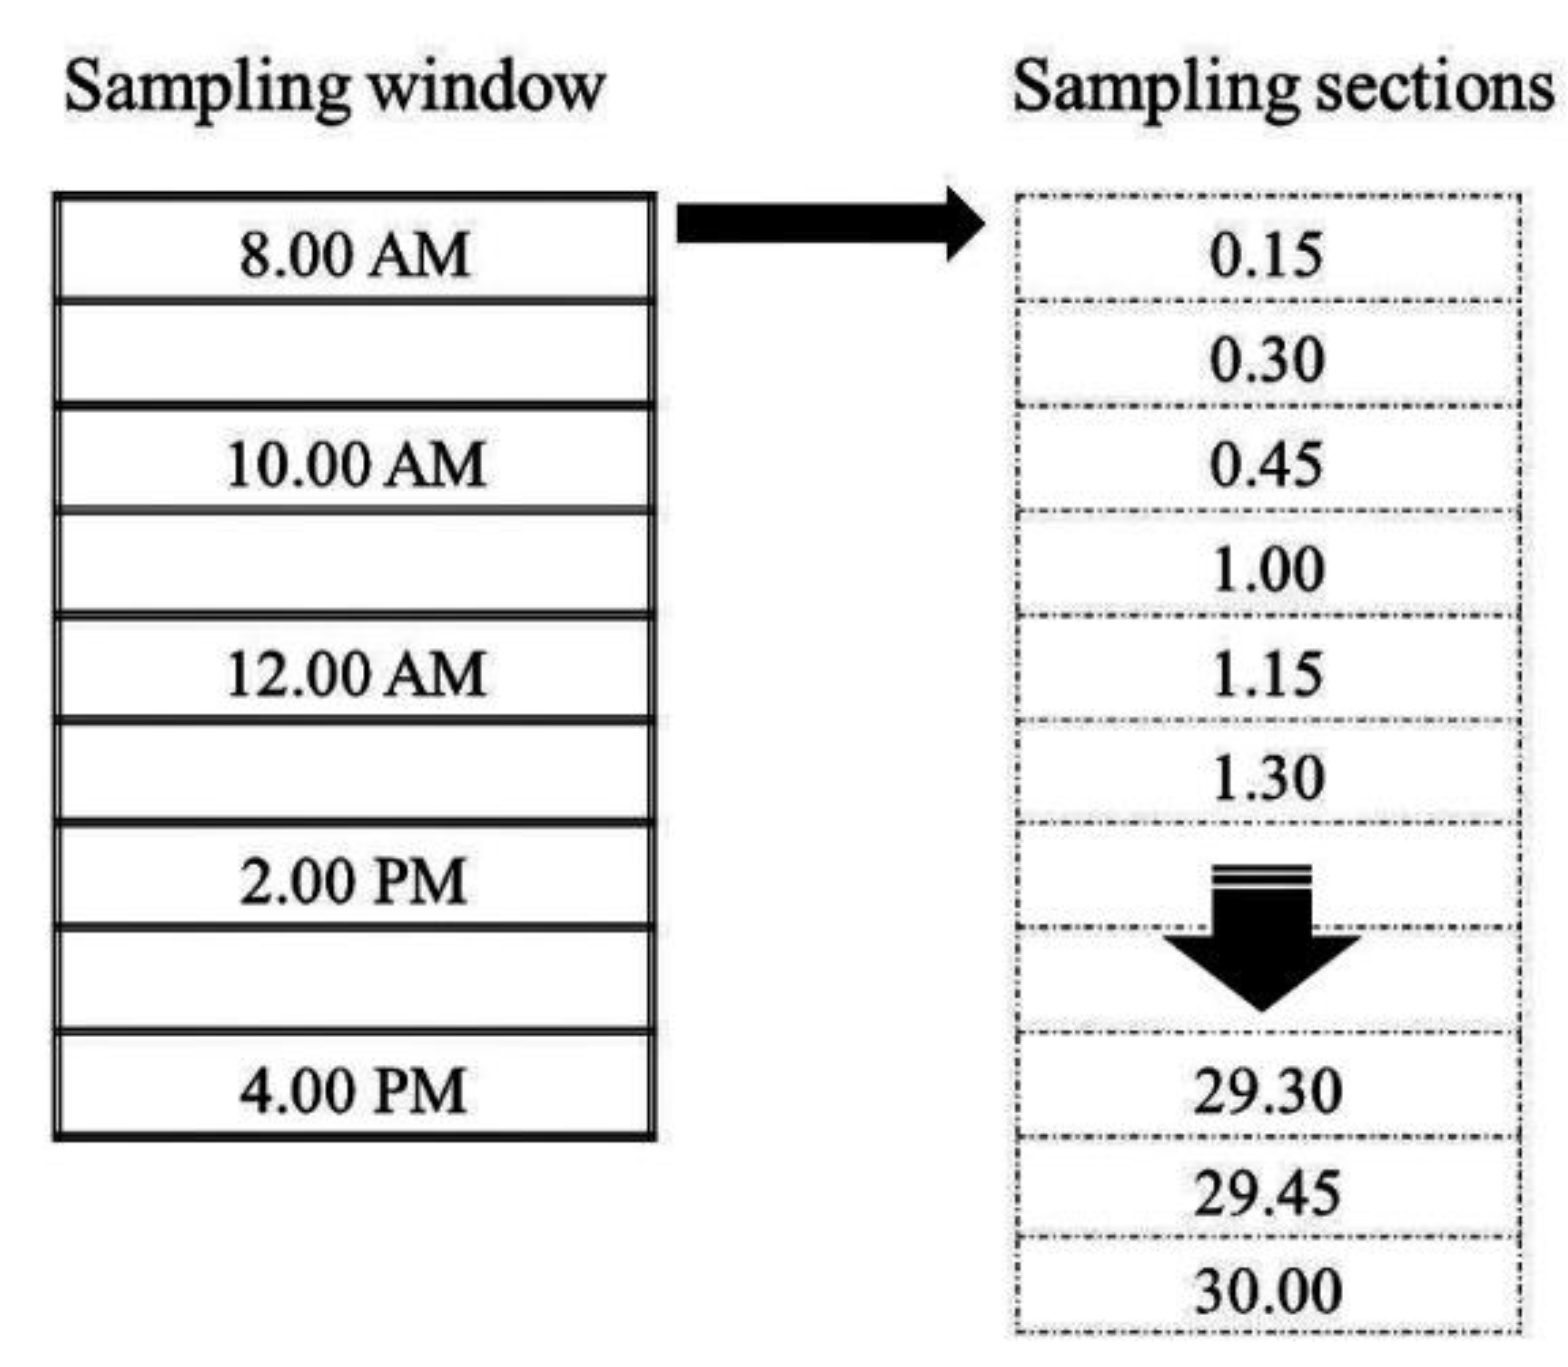
A systematic work sampling approach was utilized. The scheduled time for a work day was stratified into series of strata termed “sampling windows” (Figure 3). A systematic stratified sample can produce a more precise estimate compared to simple random sampling with the same sample size [33]. Sampling windows were designated at systematic time intervals every two hours, starting at the beginning of each work day. On a typical workday (7:00 AM to 5:00 PM), approximately five windows were captured. Sampling windows were further subdivided into sampling sections. A sampling window lasted for 30 minutes and comprised of 120 sampling sections. Each sampling section was 15 seconds long, during which the activities of machines were recorded, with a single dominant activity recorded for each sampling section. Additionally, the sampling window did not begin at a fixed time to account for delays/ activities that occurred on a regular interval such as lunch breaks and machine warming times. However, the nature and duration of these delays were recorded.
2.2. Activities of Loader
The activities performed by the loader were broadly divided into production, production-supporting, and delays (Table 1). The production phase was directly associated with productive operations handling salable products, and was comprised of loading and sorting both biomass and sawlogs. In contrast, activities under the production-supporting phase did not directly relate to handling salable products, but were required to maintain productive operations. This included activities such as clearing the deck for the yarder, cleaning the landing, and movement from one landing to another for loading or sorting. All activities that did not contribute to the production rate of the operation were considered as delays, which were classified into three types: personal, mechanical, and operational delays [26]. Among these, operational delays on the loader were further categorized by the source of the delay for understanding the system balance and were categorized into delays due to yarding, processing, and trucking.
2.3. Experimental Design and Data Analysis
Hot and cold operations were each done on all three landings. The operations began with a hot loading arrangement. Subsequently, after having shipped all sawlogs off the landing, a cold loading operation was initiated. Interaction between various operational activities was only studied for a hot loading operation and is termed “system sampling” from here on. The operational activities that were monitored in the system sampling technique comprised of choker setter, yarder, loader, chaser, log trucks, and roll-off container trucks. System sampling captured the active timeframe of these activities at the landing and was later utilized to analyze productivity and machine interactions. As cold loading involved only a loader and roll-off container trucks working together, system sampling was not done. The time spent by each truck at the landing was recorded in two categories: (1) waiting for the loader for loading roll-off bins (i.e., operational delays) and (2) loading time as a productive activity.
Distribution of activities performed by the loader was observed for both cold and hot loading, which is subsequently termed as “task sampling”. The task sampling technique evaluated the interaction of the loader with trucks, chasers, and cable yarder for hot loading and helped in understanding the distribution of activities. For cold loading, the interaction captured was limited to the interaction between the loader and the roll-off trucks.
A trial data collection was done by observing the operation one day prior to actual data collection, which helped in better understanding the operation, and was used to determine the estimated number of observations required for a confidence level of 95%. Additionally, this trial determined the sampling intensity of each activity; a balance in data collection had to be determined because a lack of data in one or more activities can lead poor statistical power for some activities. Descriptive statistics and figures were used to describe activities and accomplish all objectives. ANOVA was performed to see if a significant difference existed in the operational patterns among the landings (p ≥ 0.05).
2.4. Machine Rate Calculation
A detailed time and motion study was performed on the loader. The delay free cycle time (DFC) components for loading consisted of swinging empty to grapple (swing empty), grappling, swinging loaded, and placing piece in the truck, roll-off bin, or sorting. Along with the time components, predictor variables, such as species, diameter and length of the logs, were recorded. Diameter and log length were visually estimated in classes, and not measured. DFC was calculated for the observed cycles. Machine rates were calculated using the standard method by Miyata [34]. Purchase prices, salvage values, economic life, utilization rate, wages, and benefits for the crew were obtained from the logging company and published sources (Table 2). The fuel price was set at $1.02 L−1. Hourly machine costs in dollars per scheduled machine hour ($ SMH−1) were calculated using standard machine rate calculation methods. The datasets were initially screened for outliers using 95% confidence intervals and tested for normality. The sorted data were used for developing regression models in IBM SPSS Statistical Software. As the volume of the logs was not collected, the cost of loading activities was calculated in $ PMH−1 rather than on a volume or weight basis.
3. Results and Discussion
3.1. Description of Loading
A total of 167, 120, and 230 observations were taken to calculate the DFC for loading biomass, sorting, and loading sawlogs components from all three landings, with an average of 36 ± 7.21, 55 ± 3.69, and 47 ± 1.97 seconds per DFC for each of the three activities, respectively. Machine rate calculations showed that the hourly cost of operating a loader was $99.66 PMH−1 (Table 2), which is comparable to other research done in the region [26]. Studies have shown that unfavorable conditions such as steep terrains and limited landing space can negatively impact the loading time [35]. It took around 26 minutes to load a sawlog truck and an average of 25 truckloads were dispatched daily with an average work day lasting 10 hours. The one-way travel time to the mills was around 2–3 hours. The trucks tended to come in batches of three, during which loading was given top priority, leaving the deck often accumulated with incoming wood. This opens the possibility for better planning. The trucks could stagger to an optimal loading frequency and drivers could text or radio the loader operator with arrival times to allow better planning and minimizing delay time for both trucks and other activities at the landing. Sawlog trucking faced about 5 to 7 minutes of delay from turn around per trip while travelling empty through the narrow forest roads during peak traffic times. There was no significant difference in DFC among the three different landings (ANOVA, p = 0.656 and 0.423). The regression model developed for predicting the DFC for the loader was not significant and had negative value for the adjusted R2.
3.2. Hot Loading
Interaction between Various Harvesting Phases at the Landing
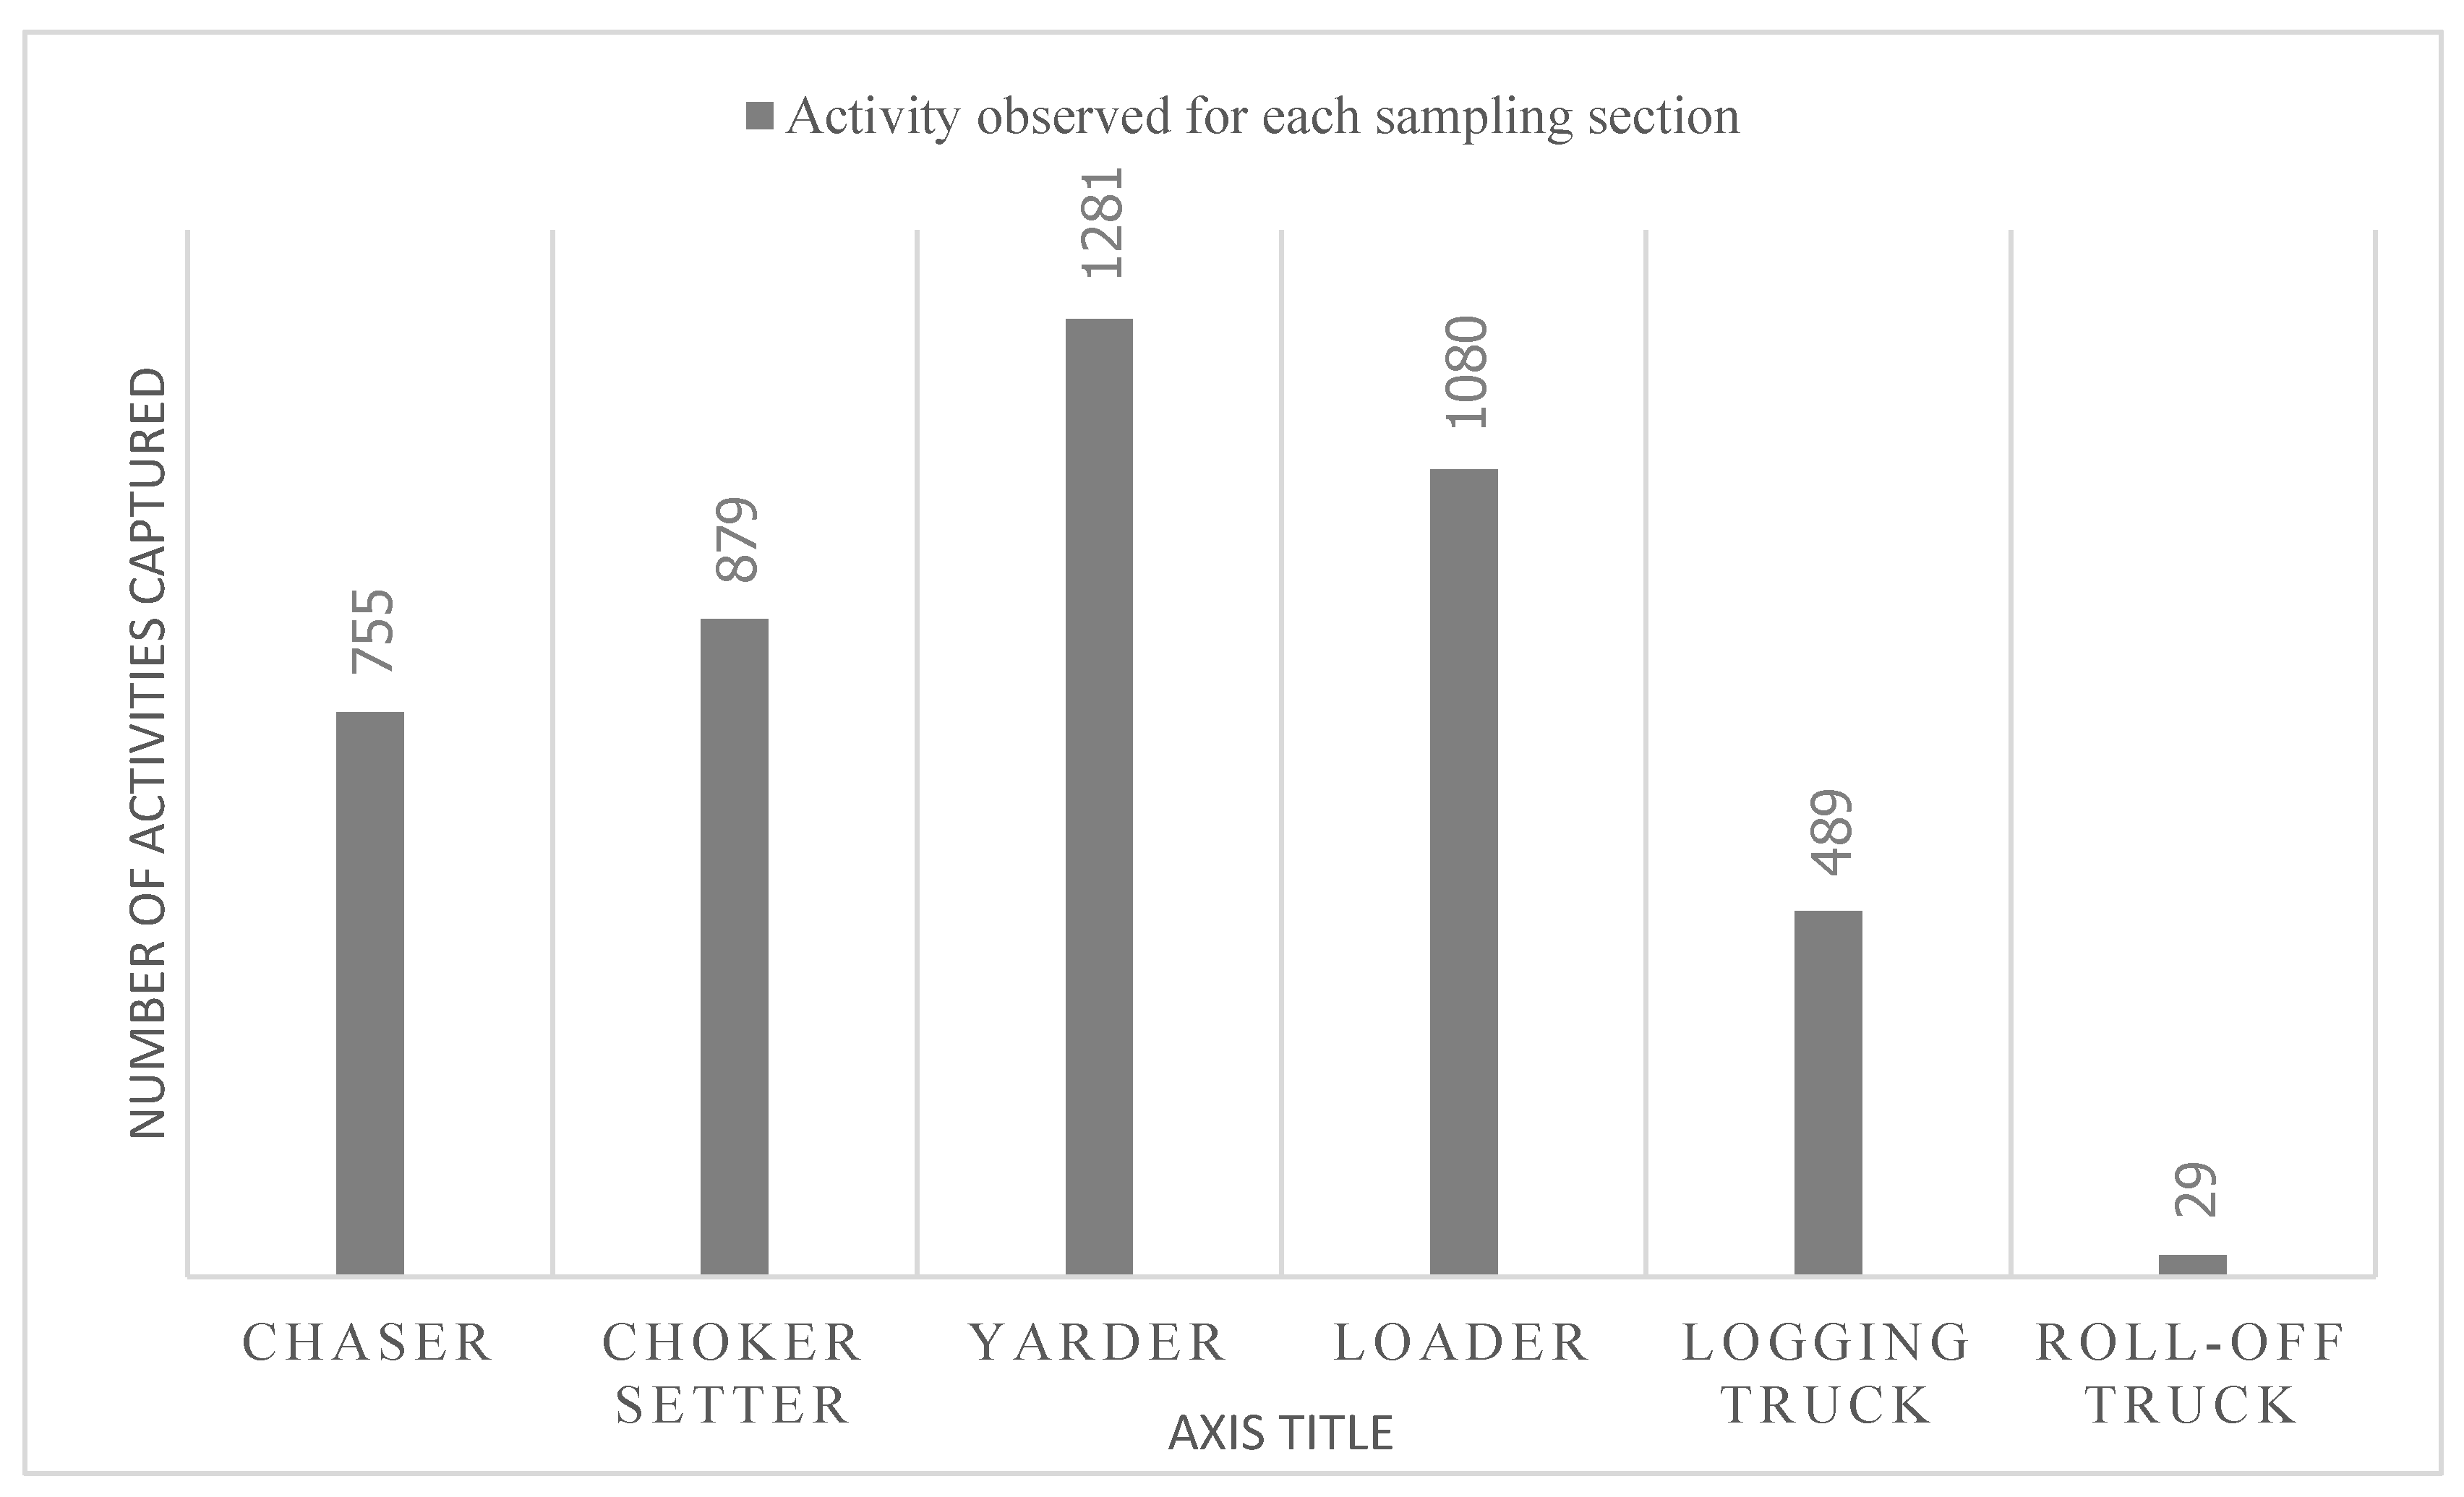
A total of 1687 sampling sections (i.e., observations) from 16 sampling windows ranging up to seven hours were captured for the system sampling. The sampling windows were not timed identically for each day, as often the operation started and ended at different times. The results and field observations show the yarder as the most utilized among the machines in the operation and the bottleneck for the entire landing operation (Figure 4). The working pattern of the yarder had an influence over other phases such as processing sawlogs (chaser) and sorting sawlogs (loader). However, the yarder was dependent on the upstream operation (setting chokers). When the yarder was not working, the entire harvesting operations came to a halt, except for the loader performing other activities, such as loading logs or biomass and clearing the landing area. Setting up a new yarding location or changing corridors averaged 49 minutes, and was a delay for other machines. Additionally, the work pieces (biomass and sawlogs) that the loader dealt with depended on what was yarded to the landing, which represents another interaction between the yarder that can influence the loader.
The loader was the second most utilized component (Figure 4). Even though the loader’s working pattern was influenced by the yarder’s activity, the focus of the loader shifted to loading when a truck arrived at the landing. The intention was to minimize operational delay in sawlog trucking.
3.3. Cold Loading
The loader was only present for the first two days of the operation, after which the trucks picked up the filled roll- off containers and delivered them to the centralized comminution center. Initially, during cold loading, the loader operator cleaned the landing and piled the biomass. It only took the loader around 11 minutes to fill a container. This resulted in the loader having piled all the materials brought to each landing in the first three hours, and waiting for the return of the roll-off truck. An adequate number of trucks for the round-trip travel time, spaced optimally on the route and in time, would balance a cold operation but would also require a large number of trucks for a long haul distance. For example, for a 2-hour round trip with an 11 minute load time, 10 trucks would balance operations and 11 trucks would produce a loading delay. This is an unrealistic trucking configuration for a site like this one. The alternative, which is more viable, is to fill detached roll-off containers to optimize loader productivity and decouple trucking from loading. This illustrates the benefit of roll-off containers in situations like this one.
3.4. Activity Sampling: Loader
A total of 2337 sampling sections (i.e., observations) from 21 sampling windows were captured for the task sampling, which constituted nine hours of data collection. Apart from operational delays, for hot loading arrangement, the sorting of sawlogs had the highest contribution to the production phase for the loader (20%), followed by loading sawlogs (19%, Figure 5). There were five sorts of sawlogs in the harvested unit, apart from the biomass piles. The number of sawlog types was found to have a negative relationship with the productivity of the loading [36]. The production-supporting phase, such as clearing the deck and other activities, constituted around 7% of the time. Handling biomass for the hot loading arrangement comprised 11% of the time.
3.5. Biomass Loading and Hauling
The average time for filling a detached roll-off container was 10.46 minutes. There was no significant difference between the time taken to load biomass between the hot and cold loading phase (p = 0.12). Additionally, it took around 2.30 minutes for the truck to load the filled container. The unloading time averaged to 11.70 minutes. On average, the containers carried 9 GMT (green metric ton) of biomass. Biomass materials were initially piled separately at the landing area and later filled to the nearest roll-off container. The containers were placed about 21 m away from the landing in order to minimize the spatial/traffic congestion. The containers were not usually filled to their maximum capacity because of the difficulty for the roll-off trucks to maneuver the steep and rough forest roads with a fully loaded container. The loader also had to distribute the weight evenly in the container for stability while travelling loaded through the steep terrain. However, sometimes, when the work piece was off-shoots and treetops, the loader frequently compacted the residues into the container to maximize the load. This task component has been found to be a significant predictor of DFC for biomass loading [19,30].
The forest roads for accessing the study sites were built for hauling logs using stinger-steered logging trucks, therefore a typical chip van (and low-boy) could not access the harvesting sites due to sharp curves, steep grades, and low ground clearance of chip vans and a low-boy. As a result, roll-off trucks were one of the few options to haul out the biomass to a centralized landing site. A typical roll-off truck system is designed for hauling short distances (less than 8 km) [17]; however, in this operation, one-way distance to the centralized grinding site was around 35 km. Of the 35 km, 24 km were through unpaved forest roads, characterized by steep terrain and sharp turns. The time and distance travelled by trucks were recorded for four cycles on spur roads (temporary roads), single lane unpaved roads, single lane gravel roads, and double lane paved roads. The loaded truck traveled slower compared to the empty travel time, especially on the temporary spur roads (44.3 minutes for 8 km) compared to the single lane dirt roads (10.1 minutes for 4 km) and single lane dirt roads with gravel surface (13.9 minutes for 6 km). The travel rate was lowest on the temporary spur road (16 km Hour−1) and highest on the double lane paved road (80 km Hour−1). On average, it took two hours for the roll-off truck to complete a round trip. The average operational delay while travelling empty for the roll-off truck was 15 minutes per trip and was mostly associated with truck turnaround waiting for loaded log trucks to pass. It took around four minutes to unload the container at the centralized landing. Cold loading was facilitated at a hauling price of around $2.72 GMT−1 (USD per green metric ton) [37].
3.6. Comparing Operational Delays between Hot and Cold Loading
Operational delay was the single largest time element for the loader for both hot (33% of total time) and cold loading arrangements (89% of total time, Figure 5). Based on machine rates, this translated to an added cost of $ 33.08 PMH−1 and $ 88.99 PMH−1 for the hot and cold loading arrangements, respectively. The overall utilization for the loader in the hot and cold loading arrangements was 55 and 7%, respectively. The two loading arrangements had distinct reasons for the operational delays.
In hot loading, the operational delay for the loader was attributed to the yarder and limited landing space and frequent rigging of the yarder. Delays for log trucks (53% of operational delays in hot loading) were mainly due to the frequent loader movement between the landings for loading similar types of log (Table 3). Meanwhile, the movement of the loader within the landing was regarded as a part of the productive machine hours. The yarding operations during rigging, the long yarding cycle times, and hang-ups directly impacted the loader’s work distribution at the landing. Yarding hang-ups and long cycle times were the results of manual felling on steep terrain and logs not being positioned in favorable alignment for yarding and choker setting. There was also one incident of a mainline breakage, resulting in a mechanical delay for the yarder, which in turn caused an operational delay for the loader. The chaser’s activities at the deck also influenced the loader, causing 20% of the operational delay in hot-loading. All machines, including the yarder and loader, stopped working as the crews entered the machine zone within the landing (approximately 15 m from either machine) due to safety reasons. This was mandatory according to Oregon Occupational Safety and Health Administration (OSHA) to safeguard from accidents [29]. Considering this constraint, mechanized processing using a processor substantially reduces the operational delay for both the loader and yarder. However, this was not a viable option in this operation due to limited landing space which could not accommodate another machine. There was also significant delay during hot loading for the roll-off trucks, which had to wait in a turn-around for the log truck to load. During the rush hours when multiple sawlog trucks were on site, this delay accounted for up to 15 minutes. However, this did not have an impact on the cold operations at the landing because they were entirely decoupled from the sawlog operations.
For cold loading, 77% of the operational delay for the loader was exclusively waiting for empty containers to arrive (idling due to trucking delay) (Table 3). There were 11 containers and one truck. This directly resulted in a high operational delay for the loader in the cold loading phase, as the loader had to wait for the dump-truck to bring empty containers. During a normal scenario (business as usual), there would have been at least two trucks, directly reducing the delays on loader. The delay time for the loader could have been minimized by having a sufficient number of trucks. However, this was not possible as there was a severe shortage of roll-off trucks and drivers, as stated by the timberland managing company [38]. In addition, placing the containers on flat terrains was critical; if not, it resulted in additional operational delay (for up to 20 minutes) during the loading of the container on to the truck. The roll-off trucks seldom faced operational delays at the landing because there were always more than three loaded containers at any given point of time.
3.7. Operational Implications and Recommendations
Dodson [37] reported that the cost of operations was not primarily influenced by loading arrangements; however, it can lead to operational delays. The advantages of hot loading include clearing the landing space for accommodating more wood when the landing space is limited, as biomass products are shipped out at the same time as logs. For this study, integrating the removal of the two products reduced operational delays in the loader when compared to cold loading, which had significant delays due to an insufficient number of trucks. However, the hot loading operation can lead to increased road traffic congestion during the peak times of operation, thereby reducing the transportation efficiency, particularly on narrow forest roads and small landings. In hot loading, biomass was usually loaded to detached (i.e., left on the ground) roll-off containers. When the loader was not handling sawlogs or assisting the yarder, it could handle biomass. The filled containers were then picked up by roll-off trucks when they arrive, minimizing the delay in other loader functions. It was observed during the field data collection that, during peak sawlog loading times, most often the roll-off truck had to wait 10–15 minutes to enter into the landing where the loaded containers were placed. Koirala et al. [39] reported the peak hour traffic congestion could potentially be reduced by the appropriate communication of trucks with crews at the landing, and by spacing trucks more evenly.
In contrast, for the cold loading arrangement, the operational delay time in the roll-off truck was reduced considerably because all the sawlogs and harvesting machines were moved from the landing. Cold loading operations can also enhance the operational efficiency of the sawlog components as biomass is handled in a way that causes delays for yarding or sawlog loading. However, the long hauling time of the roll-off truck caused major operational delays on the loader (77% idling of the loader, Table 2). The loader typically finished loading three containers at the landing in the first 30 minutes and had to wait for empty containers to arrive. Cold loading also necessitated a large landing space to accommodate all the woody materials brought to the landing. If the biomass component was left in the harvest unit and extracted later in a cold operation that yarded biomass independently from sawlogs, the operational cost would no longer be financially viable for energy production. This would be due to the additional cost of moving all other extraction machines to the site.
The decoupling of the sawlog and biomass operations should be site-specific and needs careful consideration of the amount of biomass volume to be harvested, the distance to comminution site/mills (for both biomass and sawlogs), and the landing space. In general, there can be numerous benefits to decoupling the biomass recovery operations from the sawlog operation in a cold operation compared to hot-loading, including the following:
- Efficiency of sorting (in terms of space and operational time) at the landing increases, because biomass materials are not handled, but rather piled for later processing. This situation is very applicable to the northeastern US, where a typical integrated harvest operation can have up to 14 sorts of logs [16].
- The productivity of the comminution equipment having the highest operational cost, such as grinders and chippers, can be enhanced to its full potential, minimizing the possibility of operational delay from other operational phases [7].
- Delays in biomass trucks caused by traffic both at the landing and road network, can be reduced as there are no other product removals going on, so the sawlog trucks do not delay the biomass trucks and vice versa.
4. Conclusions
Hot and cold forest biomass operations were examined using work sampling techniques to quantify various interactions between machines. The study also identified imbalances in the system that contributed to operational delays. For both loading arrangements, operational delay was the major time component for the loader. However, the single roll-off truck (used for the study) and long distance travelled to the centralized comminution site had major impacts on the operational efficiency of the loader in the cold loading arrangement. The coupling of biomass and sawlog operations comes with numerous advantages and limitations and should be considered according to the site and operational conditions. Delays in hot operations are particularly difficult to control when steep terrain limits landing size and truck movement.
Author Contributions
Conceptualization, H.-S.H. and N.A.; methodology, H.-S.H., N.A., and A.R.K.; software, A.R.K.; validation, A.R.K. and H.-S.H.; formal analysis, A.R.K. and H.-S.H.; investigation, ARK and H.-S.H.; resources, A.R.K. and H.-S.H.; data curation, A.R.K., H.-S.H., A.K., and L.T.L.; writing—original draft preparation, A.R.K.; writing—review and editing, A.R.K., H.-S.H., N.A., A.K., and L.T.L.; visualization, A.R.K. and L.T.L.; supervision, H.-S.H. and A.R.K.; project administration, H.-S.H. and N.A.; funding acquisition, H.-S.H., and N.A. All authors have read and agreed to the published version of the manuscript.
Funding
This research was funded by the USDA National Institute of Food and Agriculture, Agriculture and Food Research Initiative (AFRI), Biomass Research and Development Initiative under Grant 2010-05325 and AFRI Grant 2013-68005-21298 under the Bioenergy Alliance Network of the Rockies; and the United States Department of Agriculture National Institute of Food and Agriculture (McIntire-Stennis project) through the Maine Agricultural and Forest Experiment Station under Grant ME041909.
Acknowledgments
We would like to express our gratitude to Ethan Hill (Humboldt State University, CA) for assisting in data entry. Our appreciation goes to Peter Wakeland, Darren Cagley (Coquille Indian Tribe, OR) and Plikkat logging Inc. (Camas Valley, OR) for their cooperation on the operational aspect of the study.
Conflicts of Interest
The authors declare no conflict of interest. The funders had no role in the design of the study; in the collection, analyses, or interpretation of data; in the writing of the manuscript, or in the decision to publish the results.
References
- EIA Wood and Wood Waste—Energy Explained, Your Guide to Understanding Energy—Energy Information Administration. Available online: https://www.eia.gov/energyexplained/?page=biomass_wood (accessed on 25 June 2019).
- Moskalik, T.; Gendek, A. Production of Chips from Logging Residues and Their Quality for Energy: A Review of European Literature. Forests 2019, 10, 262. [Google Scholar] [CrossRef] [Green Version]
- Haikerwal, A.; Reisen, F.; Sim, M.R.; Abramson, M.J.; Meyer, C.P.; Johnston, F.H.; Dennekamp, M. Impact of smoke from prescribed burning: Is it a public health concern? J. Air Waste Manag. Assoc. 2015, 65, 592–598. [Google Scholar] [CrossRef] [PubMed] [Green Version]
- Laitila, J.; Heikkilä, J.; Anttila, P. Harvesting Alternatives, Accumulation and Procurement Cost of Small-Diameter Thinning Wood for Fuel in Central Finland. Silva Fennica 2010, 43, 465–480. [Google Scholar] [CrossRef] [Green Version]
- Röser, D.; Mola-Yudego, B.; Sikanen, L.; Prinz, R.; Gritten, D.; Emer, B.; Väätäinen, K.; Erkkilä, A. Natural drying treatments during seasonal storage of wood for bioenergy in different European locations. Biomass Bioenergy 2011, 35, 4238–4247. [Google Scholar] [CrossRef]
- Helmisaari, H.-S.; Kaarakka, L.; Olsson, B.A. Increased utilization of different tree parts for energy purposes in the Nordic countries. Scand. J. For. Res. 2014, 29, 312–322. [Google Scholar] [CrossRef]
- Bisson, J.; Han, H.-S. Quality of Feedstock Produced from Sorted Forest Residues. Am. J. Biomass Bioenergy 2016. [Google Scholar] [CrossRef]
- Hiesl, P.; Crandall, M.S.; Weiskittel, A.R.; Kizha, A.R. Assessing alternative silvicultural prescriptions for mid-rotation, unthinned, spruce-fir stands in Maine. Forests 2017, 8, 370. [Google Scholar] [CrossRef] [Green Version]
- Jones, G.; Loeffler, D.; Calkin, D.; Chung, W. Forest treatment residues for thermal energy compared with disposal by onsite burning: Emissions and energy return. Biomass Bioenergy 2010, 34, 737–746. [Google Scholar] [CrossRef]
- Kizha, A.R.; Han, H.-S.; Paulson, J.S.; Koirala, A. Strategies for reducing moisture content in forest residues at the harvest site. Appl. Eng. Agric. 2018, 34. [Google Scholar] [CrossRef]
- Kizha, A.R.; Han, H.-S. Forest Residues Recovered from Whole-tree Timber Harvesting Operations. Eur. J. For. Eng 2015, 1, 46–55. [Google Scholar]
- Koirala, A.; Kizha, A.R.; De Hoop, C.F.; Roth, B.E.; Han, H.-S.; Hiesl, P.; Abbas, D.; Gautam, S.; Baral, S.; Bick, S. Annotated bibliography of the global literature on the secondary transportation of raw and comminuted forest products (2000–2015). Forests 2018, 9, 415. [Google Scholar] [CrossRef] [Green Version]
- Sahoo, K.; Bilek, E.; Bergman, R.; Kizha, A.R.; Mani, S. Economic analysis of forest residues supply chain options to produce enhanced quality feedstocks. Biofuels Bioprod. Biorefining 2019, 13, 514–534. [Google Scholar] [CrossRef]
- Han, H.-S.; Bisson, J.; Kizha, A.R.; Woo, H.S. Quality feedstocks from forest residues generated from timber harvesting operations in northern California, United States of America (USA). Biomass Resour. 2015. [Google Scholar]
- Louis, L.T.; Kizha, A.R. Calculating the cost of integrated harvesting of small-diameter trees dominated stand using various apportioning methods. In Proceedings of the 52nd International Symposium on Forestry Mechanization; University of Sopron Press: Sopron, Hungary, 2019; pp. 613–622. [Google Scholar]
- Soman, H.; Kizha, A.R.; Roth, B.E. Impacts of silvicultural prescriptions and implementation of best management practices on timber harvesting costs. Int. J. For. Eng. 2019, 30, 14–25. [Google Scholar] [CrossRef]
- Han, H.-S.; Halbrook, J.; Pan, F.; Salazar, L. Economic evaluation of a roll-off trucking system removing forest biomass resulting from shaded fuelbreak treatments. Biomass Bioenergy 2010, 34, 1006–1016. [Google Scholar] [CrossRef]
- Vitorelo, B.D. Cost and Productivity of two Mechanical Fire Hazard Reduction Methods: Mastication and Thinning. MS. Thesis, Humboldt State University, Arcata, CA, USA, 2011; p. 85. [Google Scholar]
- Harrill, H.; Han, H.-S. Productivity and cost of integrated harvesting of wood chips and sawlogs in stand conversion operations. Int. J. For. Res. 2012, 2012, 1–10. [Google Scholar] [CrossRef]
- Kizha, A.R.; Han, H.-S.; Montgomery, T.; Hohl, A. Biomass power plant feedstock procurement: Modeling transportation cost zones and the potential for competition. Calif. Agric. 2015, 69, 184–190. [Google Scholar] [CrossRef]
- Coltrin, W.R.; Han, H.-S.; Han, S.-K. Costs and productivities of forest biomass harvesting operations: A literature synthesis. In Proceedings of the Annual CoFE Council on Forest Engineering Meeting, New Bern, NC, USA, 9–12 September 2012; p. 16. [Google Scholar]
- Montgomery, T.D.; Han, H.-S.; Kizha, A.R. Modeling work plan logistics for centralized biomass recovery operations in mountainous terrain. Biomass Bioenergy 2016, 85, 262–270. [Google Scholar] [CrossRef]
- Paulson, J.S.; Kizha, A.R.; Han, H.-S. Integrating Biomass Conversion Technologies with Recovery Operations In-Woods: Modeling Supply Chain. Logistics 2019, 3, 16. [Google Scholar] [CrossRef] [Green Version]
- Bick, S. Continuous Improvement in Logging; Northeastern Loggers Association: Old Forge, NY, USA, 2016. [Google Scholar]
- Bolding, M.C.; Kellogg, L.D.; Davis, C.T. Productivity and costs of an integrated mechanical forest fuel reduction operation in southwest Oregon. For. Prod. J. 2009, 59, 12. [Google Scholar]
- Kizha, A.R.; Han, H.-S. Processing and sorting forest residues: Cost, productivity and managerial impacts. Biomass Bioenergy 2016, 93, 97–106. [Google Scholar] [CrossRef] [Green Version]
- Soman, H.; Kizha, A.R.; Muñoz Delgado, B.; Kenefic, L.S.; Kanoti, K. Production economics: Comparing hybrid tree-length with whole-tree harvesting methods. For. Int. J. For. Res. 2020, cpz065. [Google Scholar] [CrossRef]
- Hiesl, P.; Benjamin, J.G. Cycle Time Analysis of Harvesting Equipment from an Early- Commercial-Thinning Treatment in Maine. In Proceedings of the 35th Council on Forest Engineering: Engineering New Solutions for Energy Supply and Demand, New Bern, NC, USA, 9–12 September 2012; p. 14. [Google Scholar]
- Wimer, T. Yarding and Logging Handbook; Oregon OSHA: Salem, OR, USA, 2010. [Google Scholar]
- Anderson, N.; Chung, W.; Loeffler, D.; Jones, J.G. A productivity and cost comparison of two systems for producing biomass fuel from roadside forest treatment residues. For. Prod. J. 2012, 62, 222–233. [Google Scholar] [CrossRef] [Green Version]
- Gendek, A.; Nurek, T.; Zychowicz, W.; Moskalik, T. Effects of intentional reduction in moisture content of forest wood chips during transport on truckload price. BioResources 2018, 13, 4310–4322. [Google Scholar] [CrossRef] [Green Version]
- Robinson, M.A. Work sampling: Methodological advances and new applications. Hum. Factors Ergon. Manuf. 2009, 20, 42–60. [Google Scholar] [CrossRef]
- Bales, A.F. Work Sampling; Defense Contract Audit Agency: Fort Belvior, VA, USA, 2015; p. 35. [Google Scholar]
- Miyata, E.S. Determining Fixed and Operation Costs of Logging Equipment; North Central Forest Experiment Station: St. Paul, MN, USA, 1980. [Google Scholar]
- Arcego, H.; Robert, R.C.G.; Brown, R.O. Effect of Log Length on Forestry Loading and Unloading. Floresta E Ambiente 2019, 26. [Google Scholar] [CrossRef]
- Tolan, A.; Visser, R. The effect of the number of log sorts on mechanized log processing productivity and value recovery. Int. J. For. Eng. 2015, 26, 36–47. [Google Scholar] [CrossRef]
- Dodson, E.M. Transportation of woody biomass using roll-off containers. In Proceedings of the 2009 Council on Forest Engineering: Environmentally Sound Forest Operations, Lake Tahoe, CA, USA, 15–18 July 2009; p. 5. [Google Scholar]
- Koirala, A.; Kizha, A.R.; Roth, B.E. Perceiving major problems in forest products transportation by trucks and trailers: A cross-sectional survey. Eur. J. Eng 2017, 3, 23–34. [Google Scholar]
- Koirala, A.; Kizha, A.; De Urioste-Stone, S. Policy Recommendation from Stakeholders to Improve Forest Products Transportation: A Qualitative Study. Forests 2017, 8, 434. [Google Scholar] [CrossRef] [Green Version]
Figure 1.
Harvest unit and landings for the study done to understand the system balance and operational phase interaction using work sampling techniques in Coos County, OR, USA.
Figure 1.
Harvest unit and landings for the study done to understand the system balance and operational phase interaction using work sampling techniques in Coos County, OR, USA.

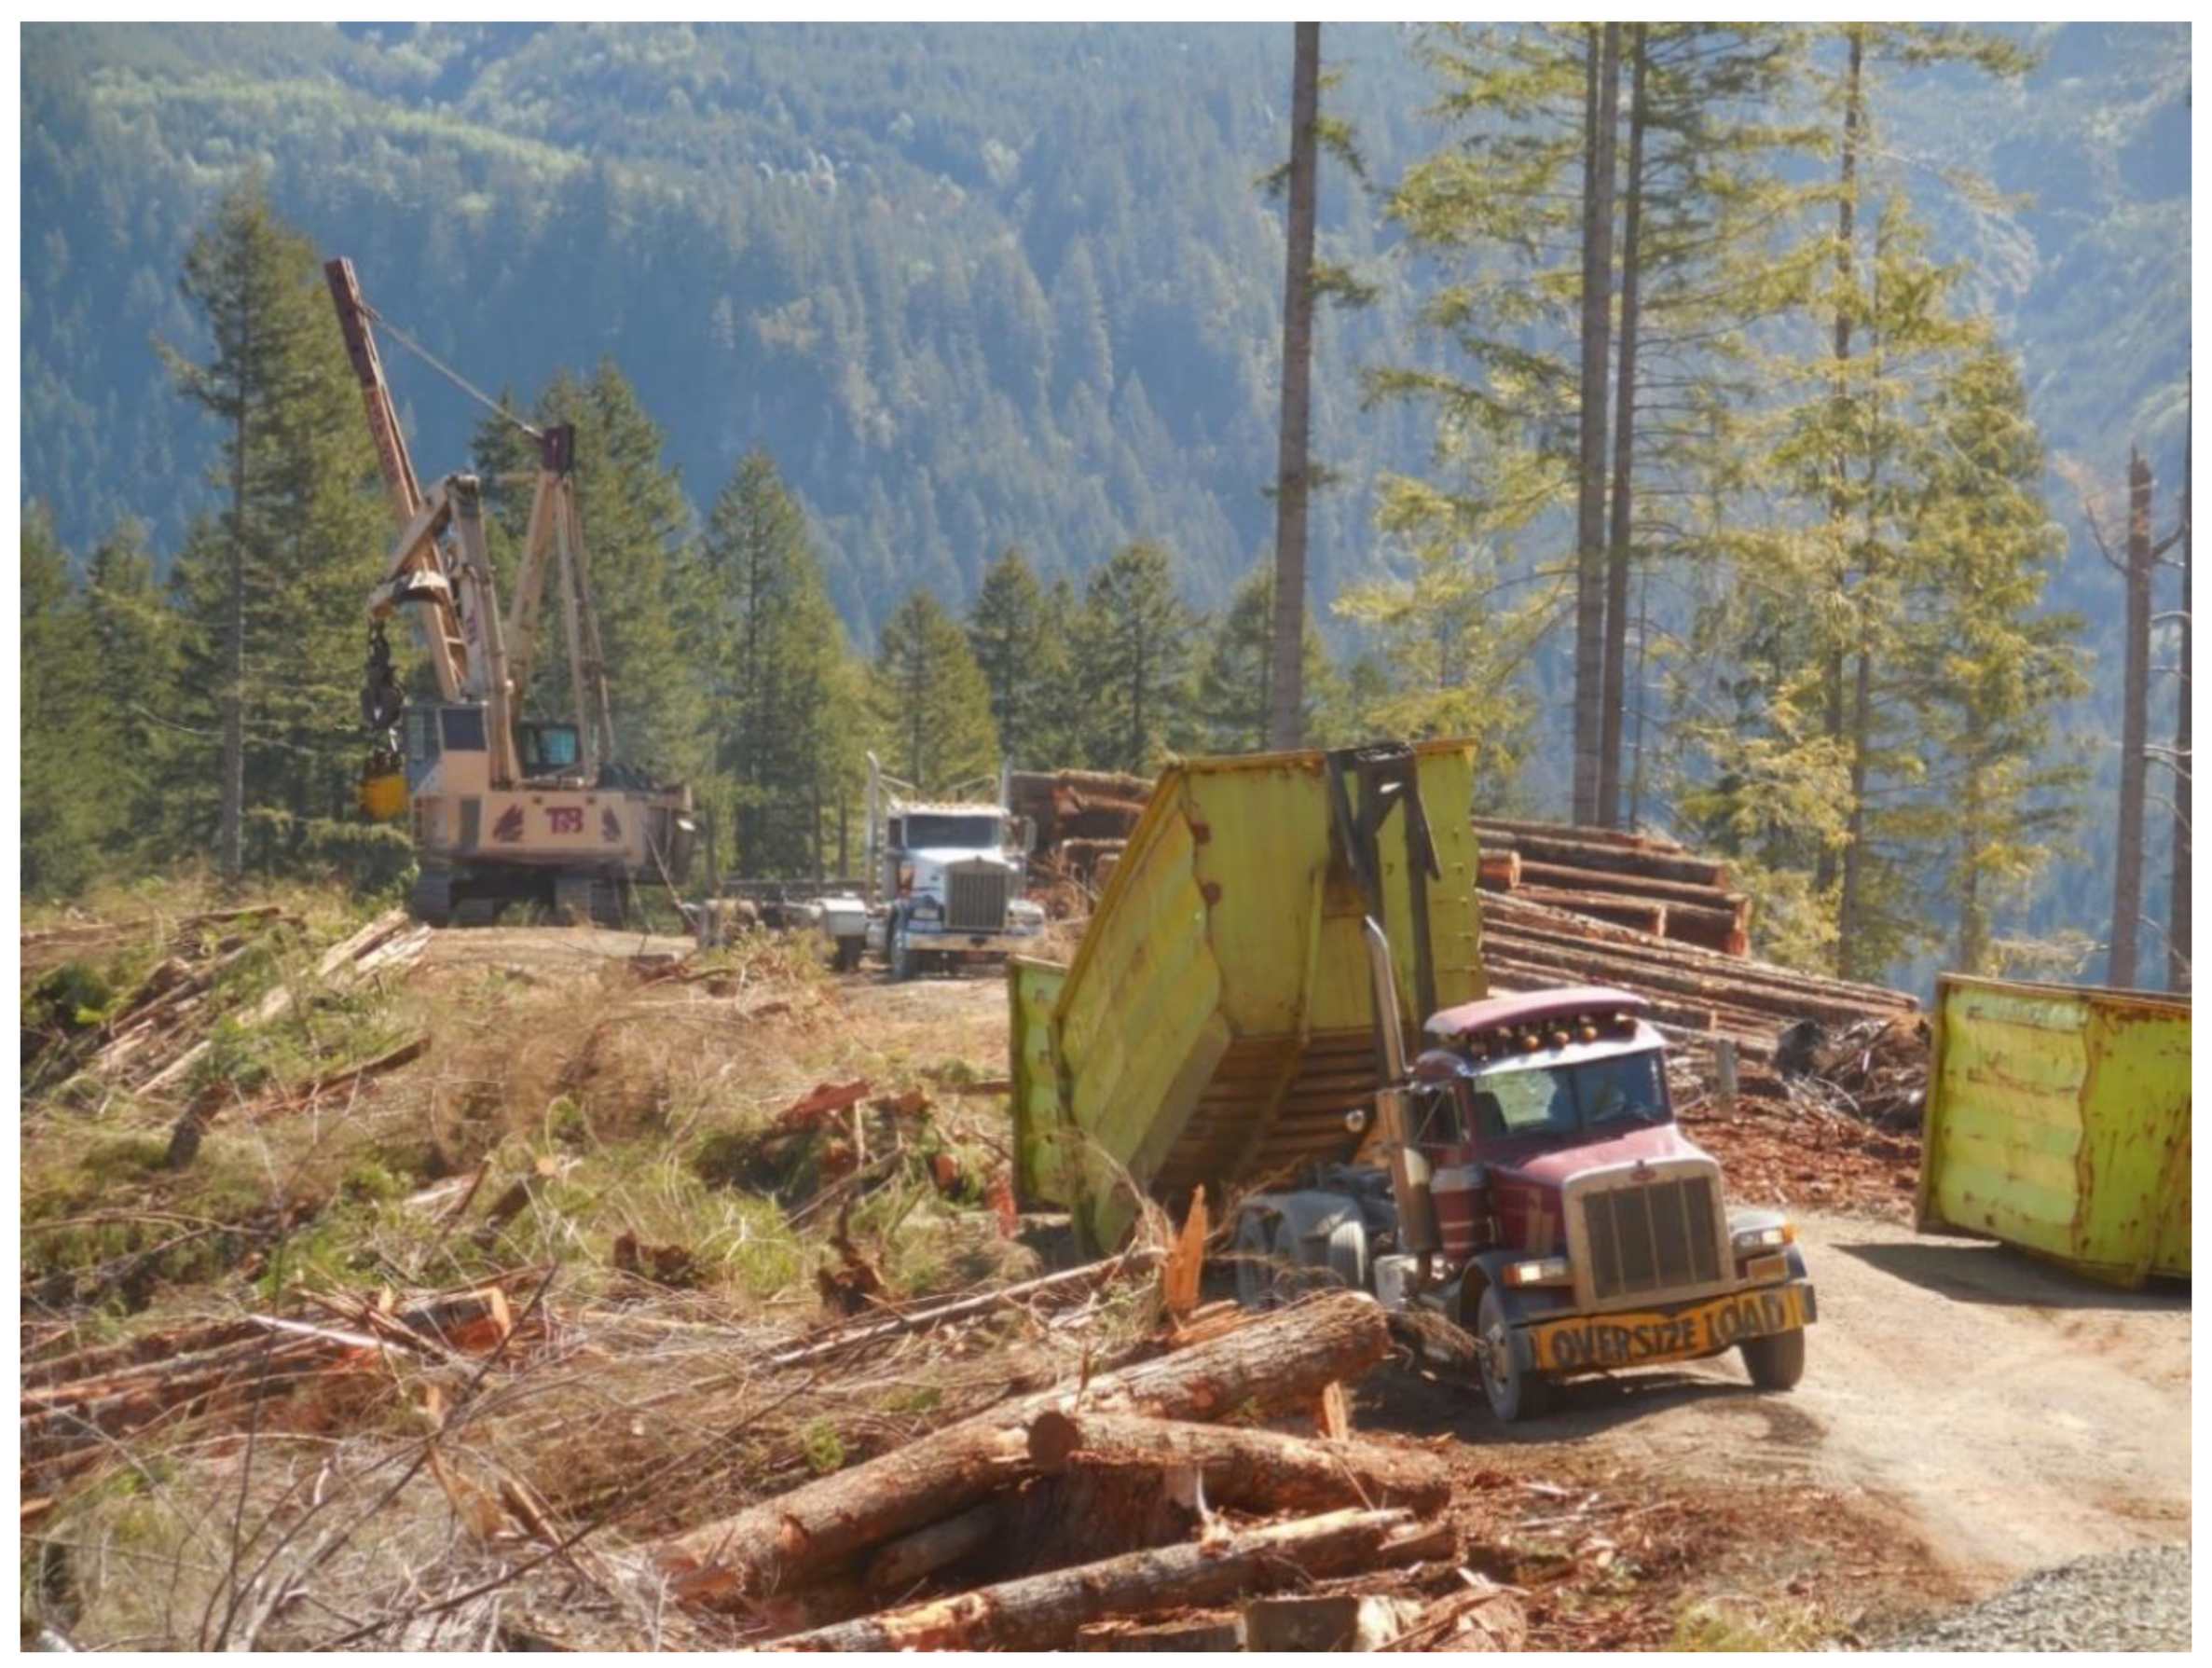
Figure 2.
Skyline yarding and landing operational phases in the study comprised: (a) one yarder, (b) one loader, (c) one roll-off truck, (d) eleven roll-off containers, (e) two chasers, and (f) three choker setters.
Figure 2.
Skyline yarding and landing operational phases in the study comprised: (a) one yarder, (b) one loader, (c) one roll-off truck, (d) eleven roll-off containers, (e) two chasers, and (f) three choker setters.

Figure 3.
The design for work sampling employing sampling windows and sampling sections in a stratified systematic design to evaluate system balance and interaction at the landing operation.
Figure 3.
The design for work sampling employing sampling windows and sampling sections in a stratified systematic design to evaluate system balance and interaction at the landing operation.

Figure 4.
Number of sample sections in which productive activity was observed to evaluate the system balance (n = 1361). Each sampling section comprised of 15 seconds and was collected from sampling windows with 120 sampling sections (30 minutes).
Figure 4.
Number of sample sections in which productive activity was observed to evaluate the system balance (n = 1361). Each sampling section comprised of 15 seconds and was collected from sampling windows with 120 sampling sections (30 minutes).

Figure 5.
Distribution of tasks for the loader developed from the task sampling method for hot and cold loading arrangements. Miscellaneous is comprised of mechanical and personal delays.
Figure 5.
Distribution of tasks for the loader developed from the task sampling method for hot and cold loading arrangements. Miscellaneous is comprised of mechanical and personal delays.


Table 1.
Operational tasks performed by the loader during the yarding operations.
| Phases | Task/Activities | Loading Arrangement | Notes | |
|---|---|---|---|---|
| Production | Loading | Sawlog | Hot | |
| Biomass | Hot and Cold | |||
| Sorting | Sawlog | Hot | Seven sorts of sawlogs | |
| Biomass | Hot and Cold | Biomass being loaded into containers | ||
| Production Supporting | Clearing deck | Hot | Loader creating room for the yarder to bring in the timber | |
| Cleaning landing | Hot and Cold | Biomass were initially set aside prior to loading in containers | ||
| Moving for loading and sorting | Hot and Cold | Loader frequently moved within and between landings for loading trucks and sorting sawlogs | ||
| Delays | Mechanical | Hot and Cold | Delays due to machine breakdowns and on-site maintenance | |
| Operational | Hot and Cold | Any time a machine was idle or otherwise unproductive for reasons other than mechanical or personal delays | ||
| Personal | Hot and Cold | Meal breaks and discussions | ||
Table 2.
Machine rates and other costs of the loader. The fuel cost was estimated to be $1.02 L−1. Machine rate per productive machine hours ($ PMH−1) were calculated using the values of 2000 SMH (scheduled machine hours) year−1, 10% interest, and 3% insurance (provided by the company that operated and owned the machines).
| Make & Model | Thunderbird 840W-1980s |
|---|---|
| Purchase price ($) | 200,000 |
| Variable and operating cost ($) | 28.03 |
| Labor cost ($ PMH−1) | 39.75 |
| Fuel use (L PMH−1) | 22.71 |
| Utilization (%) | 80 |
| Machine rate ($ PMH−1) | 99.66 |
Table 3.
Delays (in percentage) of loader observed during the various stages of the hot and cold loading arrangements using task sampling techniques.
Table 3.
Delays (in percentage) of loader observed during the various stages of the hot and cold loading arrangements using task sampling techniques.
| Delay | Hot | Cold | ||
|---|---|---|---|---|
| Operational | ||||
| Log truck | 39 | Trucking delay | 77 | |
| Yarder | 19 | Truck/container positioning | 13 | |
| Chaser | 15 | Movement | 10 | |
| Movement a | 12 | |||
| Personal | 8 | |||
| Mechanical | 5 | |||
a Movement of the loader between the landing for sorting sawlogs/biomass.
© 2020 by the authors. Licensee MDPI, Basel, Switzerland. This article is an open access article distributed under the terms and conditions of the Creative Commons Attribution (CC BY) license (http://creativecommons.org/licenses/by/4.0/).
Share and Cite
MDPI and ACS Style
Kizha, A.R.; Han, H.-S.; Anderson, N.; Koirala, A.; T. Louis, L. Comparing Hot and Cold Loading in an Integrated Biomass Recovery Operation. Forests 2020, 11, 385. https://doi.org/10.3390/f11040385
AMA Style
Kizha AR, Han H-S, Anderson N, Koirala A, T. Louis L. Comparing Hot and Cold Loading in an Integrated Biomass Recovery Operation. Forests. 2020; 11(4):385. https://doi.org/10.3390/f11040385
Chicago/Turabian StyleKizha, Anil Raj, Han-Sup Han, Nathaniel Anderson, Anil Koirala, and Libin T. Louis. 2020. "Comparing Hot and Cold Loading in an Integrated Biomass Recovery Operation" Forests 11, no. 4: 385. https://doi.org/10.3390/f11040385
Note that from the first issue of 2016, this journal uses article numbers instead of page numbers. See further details here.