Article

Suspended Sediment Transport Responses to Increasing Human Activities in a High-Altitude River: A Case Study in a Typical Sub-Catchment of the Yarlung Tsangpo River

1
State Key Laboratory of Hydroscience and Engineering, Department of Hydraulic Engineering, Tsinghua University, Beijing 100084, China
2
Hydrology and Water Resources Investigation Bureau of Tibet Autonomous Region, Lhasa 850000, China
*
Author to whom correspondence should be addressed.
Water 2020, 12(4), 952; https://doi.org/10.3390/w12040952
Submission received: 10 February 2020 / Revised: 21 March 2020 / Accepted: 23 March 2020 / Published: 27 March 2020
(This article belongs to the Section Hydrology)

Abstract

:
The Yarlung Tsangpo River is one of the highest major rivers in the world. The river is known for its pristine landscape. However, in recent years, increasing human activities, such as inhabitation, afforestation, and infrastructure projects, have significantly disturbed this fluvial system, while their impacts are not fully known. In this study, the water and sediment transport processes in the Nugesha–Yangcun (N–Y) reach of the Yarlung Tsangpo River, as well as the impact of human activity, are investigated. The N–Y sub-catchment consists of two parts, i.e., the Lhasa River catchment and the mainstream catchment. Riverine discharge, suspended sediment concentration (SSC), and precipitation data are acquired, and a detailed investigation is conducted. The water yield has not changed considerably in recent years, while the sediment yield has exhibited a sharp decline, from ~5 Mt to ~1 Mt. The sediment decrease is mainly caused by the reduced sediment source, which is considered highly related to afforestation. In addition, the dominant sediment contributor has changed from the mainstream catchment to the tributary catchment (while the sediment yield in the mainstream catchment has decreased to almost zero). An anomalously enhanced SSC occurred in the Lhasa River in two consecutive years from 2015, with the SSC value increasing sharply from 0.2 kg/m3 to 0.8 kg/m3, and maintaining a high level for approximately three months. This phenomenon is considered to be related to infrastructure projects in the same period, with the SSC recovered after road construction ended. The increasing human activities have had significant impacts on the sediment regimes in the Yarlung Tsangpo River; hence, more attention should be paid to river basin management.

1. Introduction

The Tibetan Plateau is the highest plateau on the Earth’s surface. It is often called the “water tower of Asia” because it is the headwater location of ten major rivers in Asia [1]. These rivers are efficient carriers of sediment from the headwaters to the sea. It is estimated that approximately one-third of the global sediment load to oceans is generated from the large rivers originating from the Tibetan Plateau and its neighboring regions [2]. In recent decades, the sediment regimes of these rivers have attracted increasing attention due to public concerns about climate change and increasing human activities [3,4,5,6,7,8,9,10,11]. Human activities, such as infrastructure development, soil conservation, and sand excavation, have played an important role in sediment load variations [12,13,14,15]. In the literature, the suspended sediment transport was widely analyzed, because it is important for understanding river channel dynamics and soil erosion in river basins and it is regularly measured at hydrological stations.
As one of the largest rivers in the Tibetan Plateau, the Yarlung Tsangpo River is the highest river in the world, with an average elevation greater than 4000 m above sea level [16,17]. This river is located in the upper reach of the Brahmaputra River, which meets the Ganges River before emptying into the Bay of Bengal. Because of the high elevation, the ecological environment in this river basin is very fragile and has experienced severe ecosystem degradation due to global and regional climate change and human interventions [18,19,20]. In addition, its fluvial process has been found to be sensitive to warming temperatures, melting glaciers, degrading permafrost, and land-use changes [21,22,23].
The Yarlung Tsangpo River is known for its pristine landscape with a sparse human population (approximately three people per square kilometer) and it is an almost free-flowing fluvial system [24]. Limited human activities have affected the fluvial systems in this region in the last century because of the cold and oxygen-deficient environment [22]. However, in recent decades, the river started to experience increasing human activities, such as urbanization and tourism [25], which are combined with rapid socioeconomic development and population expansion. Consequently, more attention has been paid to the impacts of human activities on fluvial systems in this region. Land-use change is one of the most visible changes in the river basin [26]. Human activities have induced a two-fold increase in residential areas and a five-fold increase in tree nursery areas in the last twenty years. These increases consume more water resources and have negative effects on streamflow [21]. Additionally, human activities lead to severe grassland degradation or desertification in the river basin [20,27,28,29]. Desertification will further result in serious soil erosion by both precipitation and wind [20,30]. Rainfall- and wind-induced soil erosion are the main sources of suspended sediment in the river flow [31]. Another remarkable human activity that affects land use is afforestation, which has been widely implemented across the Tibetan Plateau. Large-scale afforestation has been carried out since the 1980s [32,33]. As a result, the forest area in Tibet has increased significantly in recent years [34], and the increase is especially notable in the Yarlung Tsangpo River basin; furthermore, this increase in forest area may reduce the amount of suspended sediment in the river [9]. To summarize, the reported impacts of human-induced land use on the river have mainly focused on runoff discharge and sediment erosion in the river basin. However, human activity-induced suspended sediment changes have not been well studied in this high-altitude fluvial eco-environment.
In addition, the river serves as the economic and cultural center of Tibet, which has a developed economy and large population [35]. Almost all of the largest cities are located on the river, where intensive infrastructures, such as riverside roads, are frequently constructed as short-term human interventions. Large amounts of fine particulate sediment can be produced by road construction and can be transported into the river by overland flow [36,37,38]. Road construction can cause short-term variations in the suspended sediment concentration (SSC) during the construction project [38], and it can also increase the risks of landslides in high-relief terrain [39]. Landslide mass is an important source of riverine suspended sediment in the Yarlung Tsangpo River [31]. However, the effects of riverside construction on the sediment dynamics of the Yarlung Tsangpo River are not well understood.
The suspended sediment transport of the Yarlung Tsangpo River is analyzed in this paper. The aim is to investigate the land use induced changes in suspended sediment yield, as well as the road construction induced anomaly in the fluvial sediment concentration. The investigation can help fill in the gaps about the impact of human activity on sediment regimes in the Yarlung Tsangpo River. The study takes the Nugesha–Yangcun (N–Y) catchment as an example. The catchment is one of the most representative sub-catchments, and it comprises approximately 50% of the human settlement and farmland in the Yarlung Tsangpo River basin. The daily discharge and SSC obtained from three key gauging stations were available for this study. The suspended sediment load in the river reach, the contributions from the tributaries and the short-term sediment anomalies are analyzed. Finally, the impacts of human activities on the SSC of the N–Y reach and potential changes in other river reaches are discussed. These results provide a foundation for future works on water and soil conservation and river basin management in the Yarlung Tsangpo River.

2. Materials and Methods
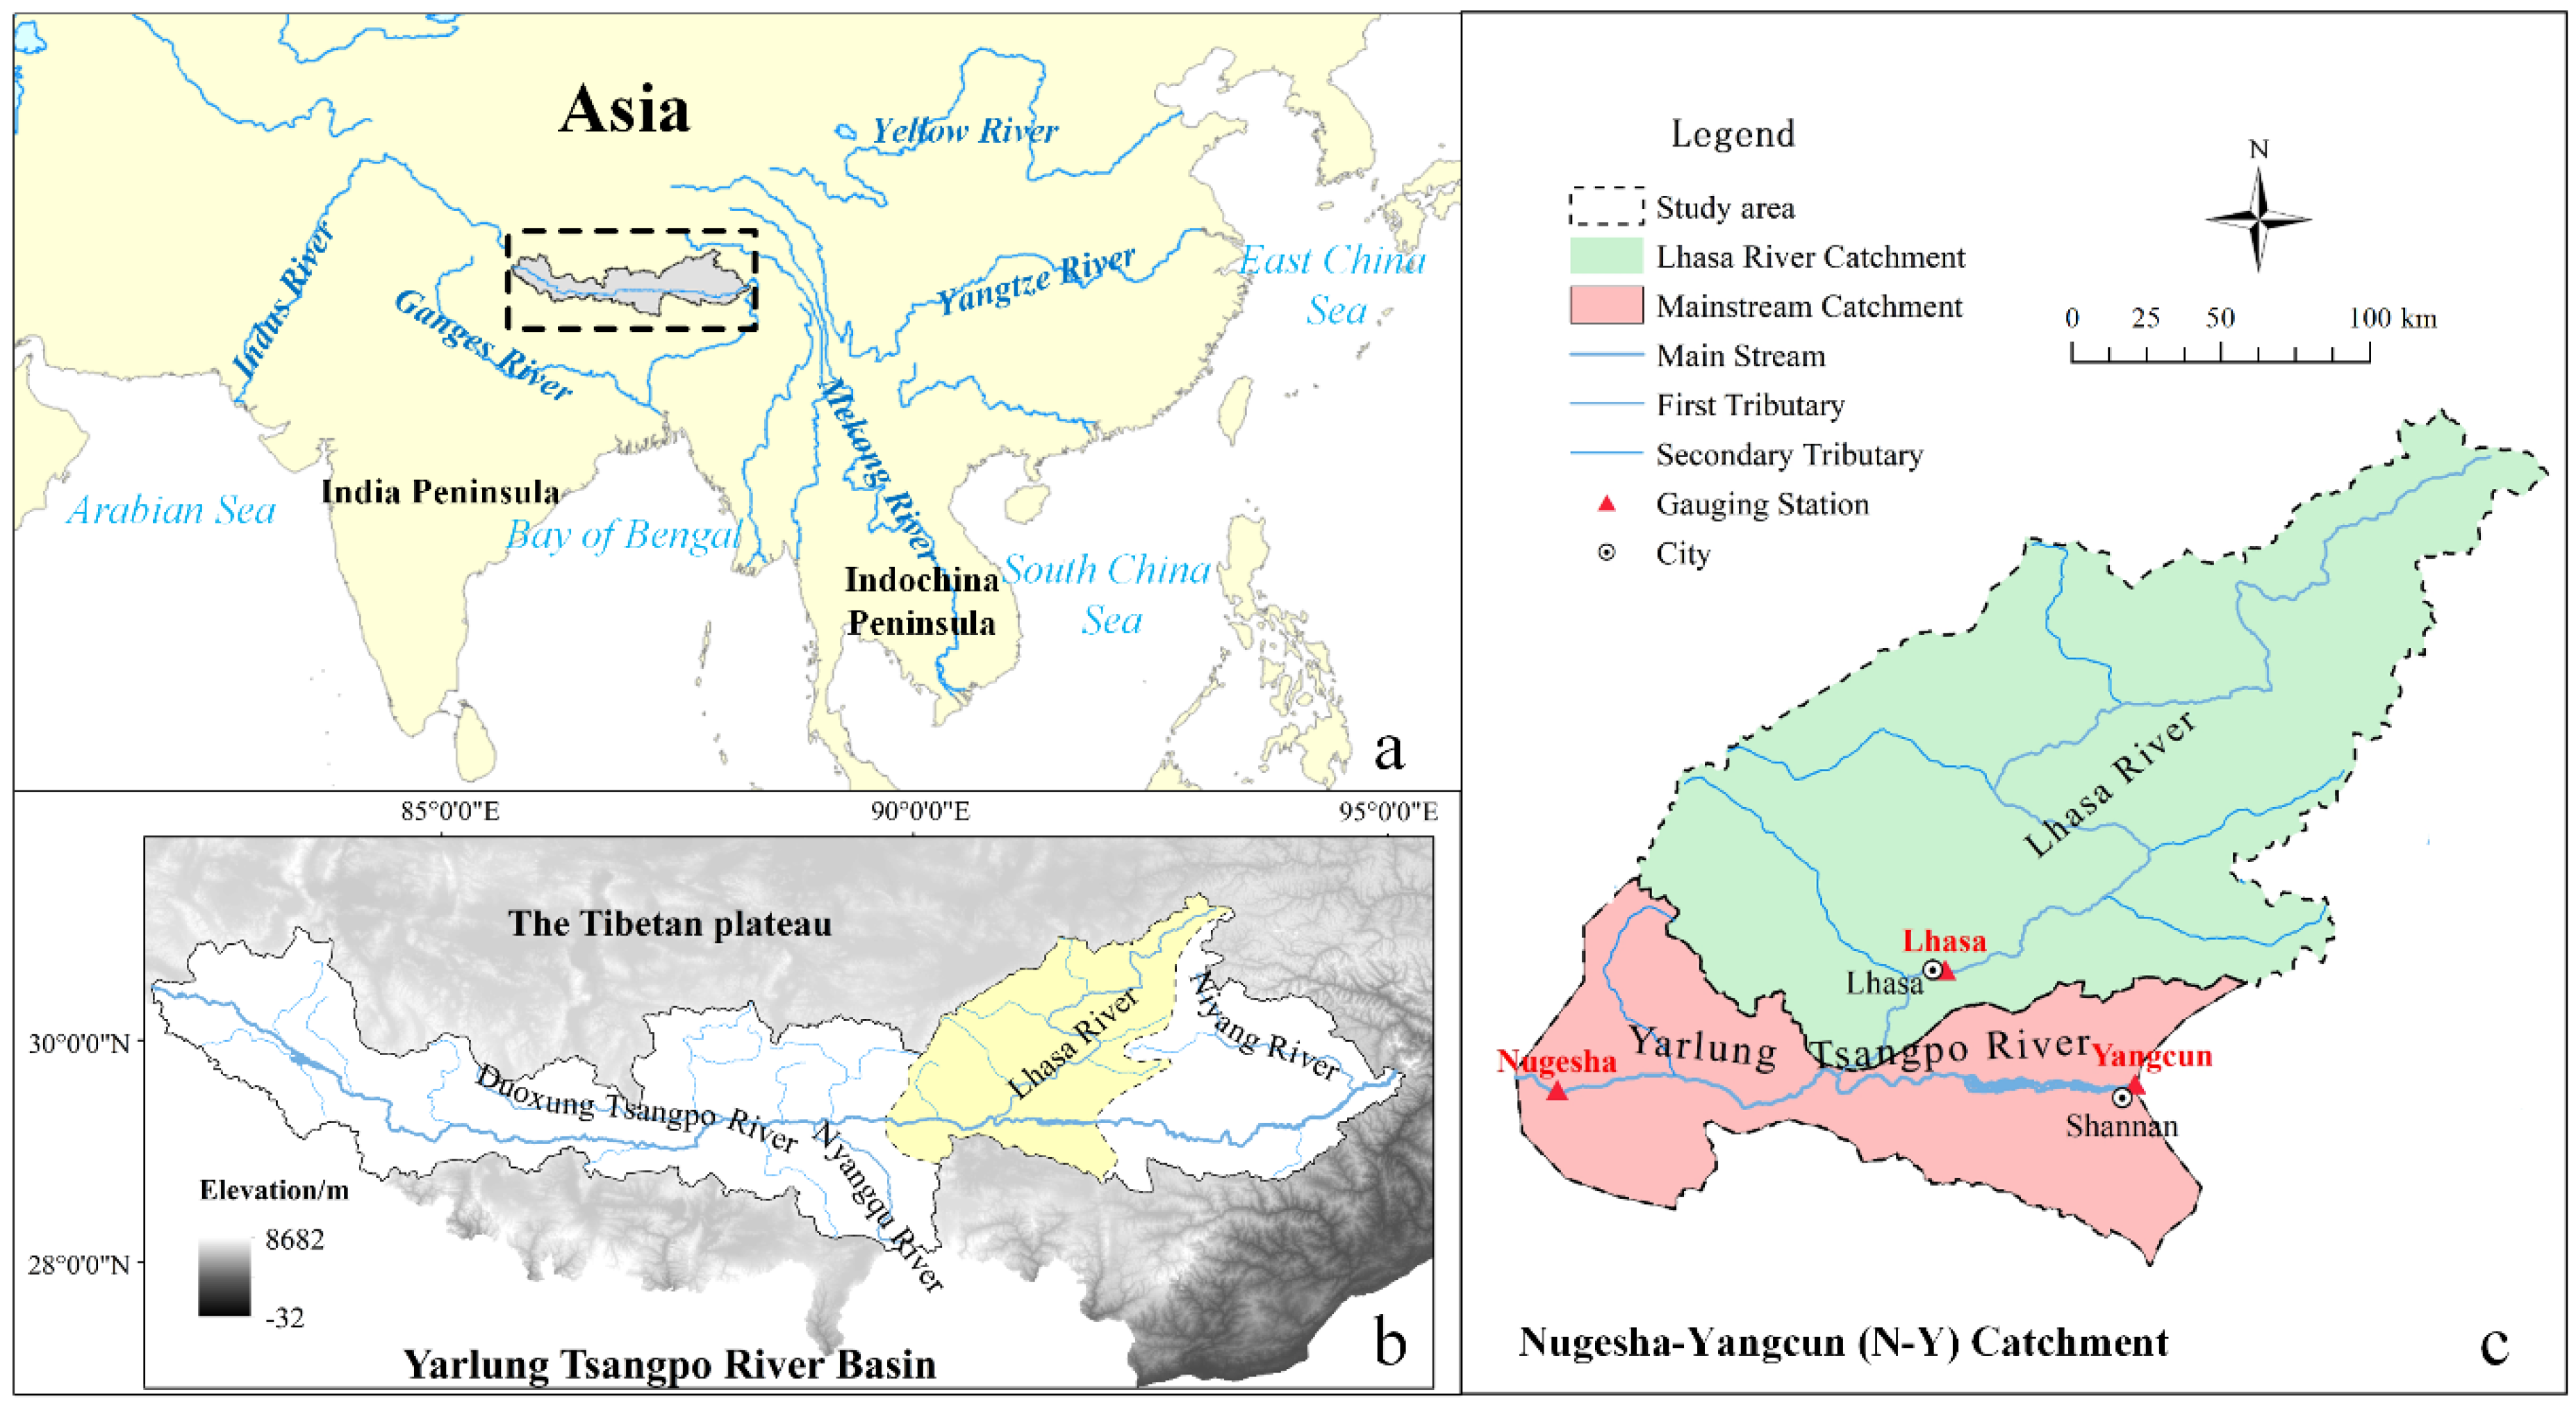
2.1. Study Area

The length of the N–Y mainstream reach is about 280 km and its catchment area is 4.6 × 10⁴ km2 (shown in Figure 1). The river reach has a slope of about 0.06% and is characterized by dendritic stream networks, with the Lhasa River tributary flowing into the mainstream. The riverbed sediment has a wide size range from 0.1 mm to 200 mm. In the wide valley, the median size (d50) of the river bed sediment is about 0.2 mm (sand-bed), according to our observation, while, in the narrow valley near the Yangcun Station, the d50 of the sediment is about 20 mm [40], where the river is a gravel-bed river. The Lhasa River is the largest tributary of the Yarlung Tsangpo River. It has the longest river length and the largest catchment area [41]. The river flows through the largest city in Tibet and is strongly affected by overgrazing, afforestation and infrastructure construction [34,42,43].
The N–Y sub-catchment has a typical continental plateau semi-arid frigid climate, with an annual mean temperature of approximately 5 °C and an annual precipitation of approximately 350–400 mm, which is primarily concentrated in the period from June to September. The main land use types in this sub-catchment are grassland (~73%) and barren or sparsely vegetated land (~19%) [35], and this sub-catchment has larger percentages of cropland (~2.3%) and urban and built-up areas (~0.2%) than do the other reaches of the Yarlung Tsangpo River. The N–Y catchment is regarded as a significant source of suspended sediment for the Yarlung Tsangpo River [35,40]. The sediment yield can be divided in two parts: from the tributary (i.e., the Lhasa River) catchment and from the mainstream (including other smaller tributaries) catchment (shown in Figure 1). The size of the tributary catchment is approximately 3.2 × 10⁴ km2, accounting for 70% of the N–Y sub-catchment. The tributary contributes approximately 70% of the water and 20% of the sediment to the river reach. While, the mainstream catchment is the main sediment contributor (accounting for 80%) to the river reach [35].
Three gauging stations were installed in the N–Y sub-catchment, two of which are located along the main Yarlung Tsangpo River and the other is in the Lhasa River (shown in Figure 1). The basic information of the hydrological stations is shown in Table 1. The Nugesha and Yangcun Stations are located at the upstream and downstream boundaries of the reach, respectively, where the inflow, outflow and sediment fluxes are monitored. Previous studies showed that the annual discharge of the two stations were about 160 × 108 m3/year and 300 × 108 m3/year [35,44] (shown in Table 2). The Lhasa Station is located in the downstream reaches of the tributary near its conjunction with the mainstream. The data from the tributary station can be used to evaluate the contributions of the tributary to both water and sediment fluxes. Additionally, the annual discharge was reported to be about 90 × 108 m3/year in previous studies [32] (shown in Table 2).

2.2. Data and Methods

The dataset includes the riverine discharge and SSC during the period from 2014 to 2017. The precipitation data were also collected from seven meteorological stations, to interpret the inter-annual variation of fluvial discharge in the same period, as the precipitation contributes about 70% of water to the annual runoff in the river [45]. In the dataset from 2014 to 2017, the SSCs were measured from every April 1 to October 31 at the Lhasa Station and from every May 1 to October 31 at the Nugesha Station. The discharge was measured using a velocity meter method. While, the SSC was measured at multiple locations with an interval of 50 m across each cross section, while for a narrow cross section, at least three locations were arranged. In every location, the measurement was carried out at 60% water depth below the water surface. The daily SSC was the average of the measured SSC in all locations.
The monthly and annual precipitations are calculated by integrating the daily values. The precipitations within each catchment, as shown in Table 2, are calculated as the arithmetic average of the data from corresponding meteorological stations. The monthly cumulative discharge and sediment load are obtained from the daily data using Equation (1) and Equation (2), respectively.
Q m o n = i = 1 M Q i t
S L = i = 1 M S S C i Q i t
where Qmon (m3/month) and SL (kg) are the monthly cumulative discharge and sediment load, respectively, at a given gauging station; Qi (m3/s) and SSCi (kg/m3) are the monitored daily discharge and SSC, respectively; t (s/d) is the number of seconds per day; and M is the number of days in one month.
The water yield and sediment yield are used to evaluate the catchment contribution to flow flux and sediment load of the river. The water yield is the inflow water from the catchment, and can be calculated using Equation (3). While, the sediment yield is the inflow of sediments from watersheds to a river, and is the numeric equivalent of the sediment load difference between the lower and upper hydrologic stations minus the sediment erosion/deposition in the river course. In practice, the sediment yield is usually estimated using the sediment load difference between two control stations [8,46] (shown in Equation (4)).
W Y = Q k + 1 Q k
S Y = S L k + 1 - S L k
where WY (m3) and SY (kg) are the water yield and sediment yield, respectively, and k+1 and k are the numbers of downstream and upstream gauging stations, respectively.
Table 2 lists the precipitation and annual discharge from the three hydrological stations in different periods, and it can be seen that during 2014–2017, the precipitation shows little difference from the previous observations. In addition, the annual discharge at the three gauging stations is largely consistent with the previous results, and the maximum difference is approximately 11.1%. In general, the data collected in this study are representative and can be used to analyze the sediment regimes of the N–Y reach of the Yarlung Tsangpo River.
Sediment rating curves are used to describe the relationships between discharge and SSC, and these relationships are commonly considered to follow the power formula [47,48] (shown in Equation (5)).
S S C = α Q β
where α and β are regression coefficients. The constant α generally represents soil erodibility and sediment source availability, while the exponent β is used as an index to reflect the transport capacity of water flow. High values of α occur in areas characterized by intensively weathered materials, which can easily be eroded and transported. The β-coefficient represents the erosive power of the river, with large values being indicative of rivers that experience a strong increase in erosive power and sediment transport capacity when discharge increases [47]. Other formulas can also be used to describe the discharge - SSC (Q – SSC) relationship [47,49,50], which are shown in Table 3.
The hysteresis loop is widely used to investigate the relationship between SSC and water discharge because the hysteresis patterns result from a variety of factors and processes, such as event discharge, catchment erosion and human activities. Therefore, this method can provide a useful amount of information on the suspended sediment process [51,52]. In the current study, the relationships between the monthly SSCs and water discharges at the three gauging stations are depicted. The monthly hysteresis patterns are used to analyse the sediment source and the impacts of human activities on the sediment regimes in the typical reach of the Yarlung Tsangpo River.

3. Results

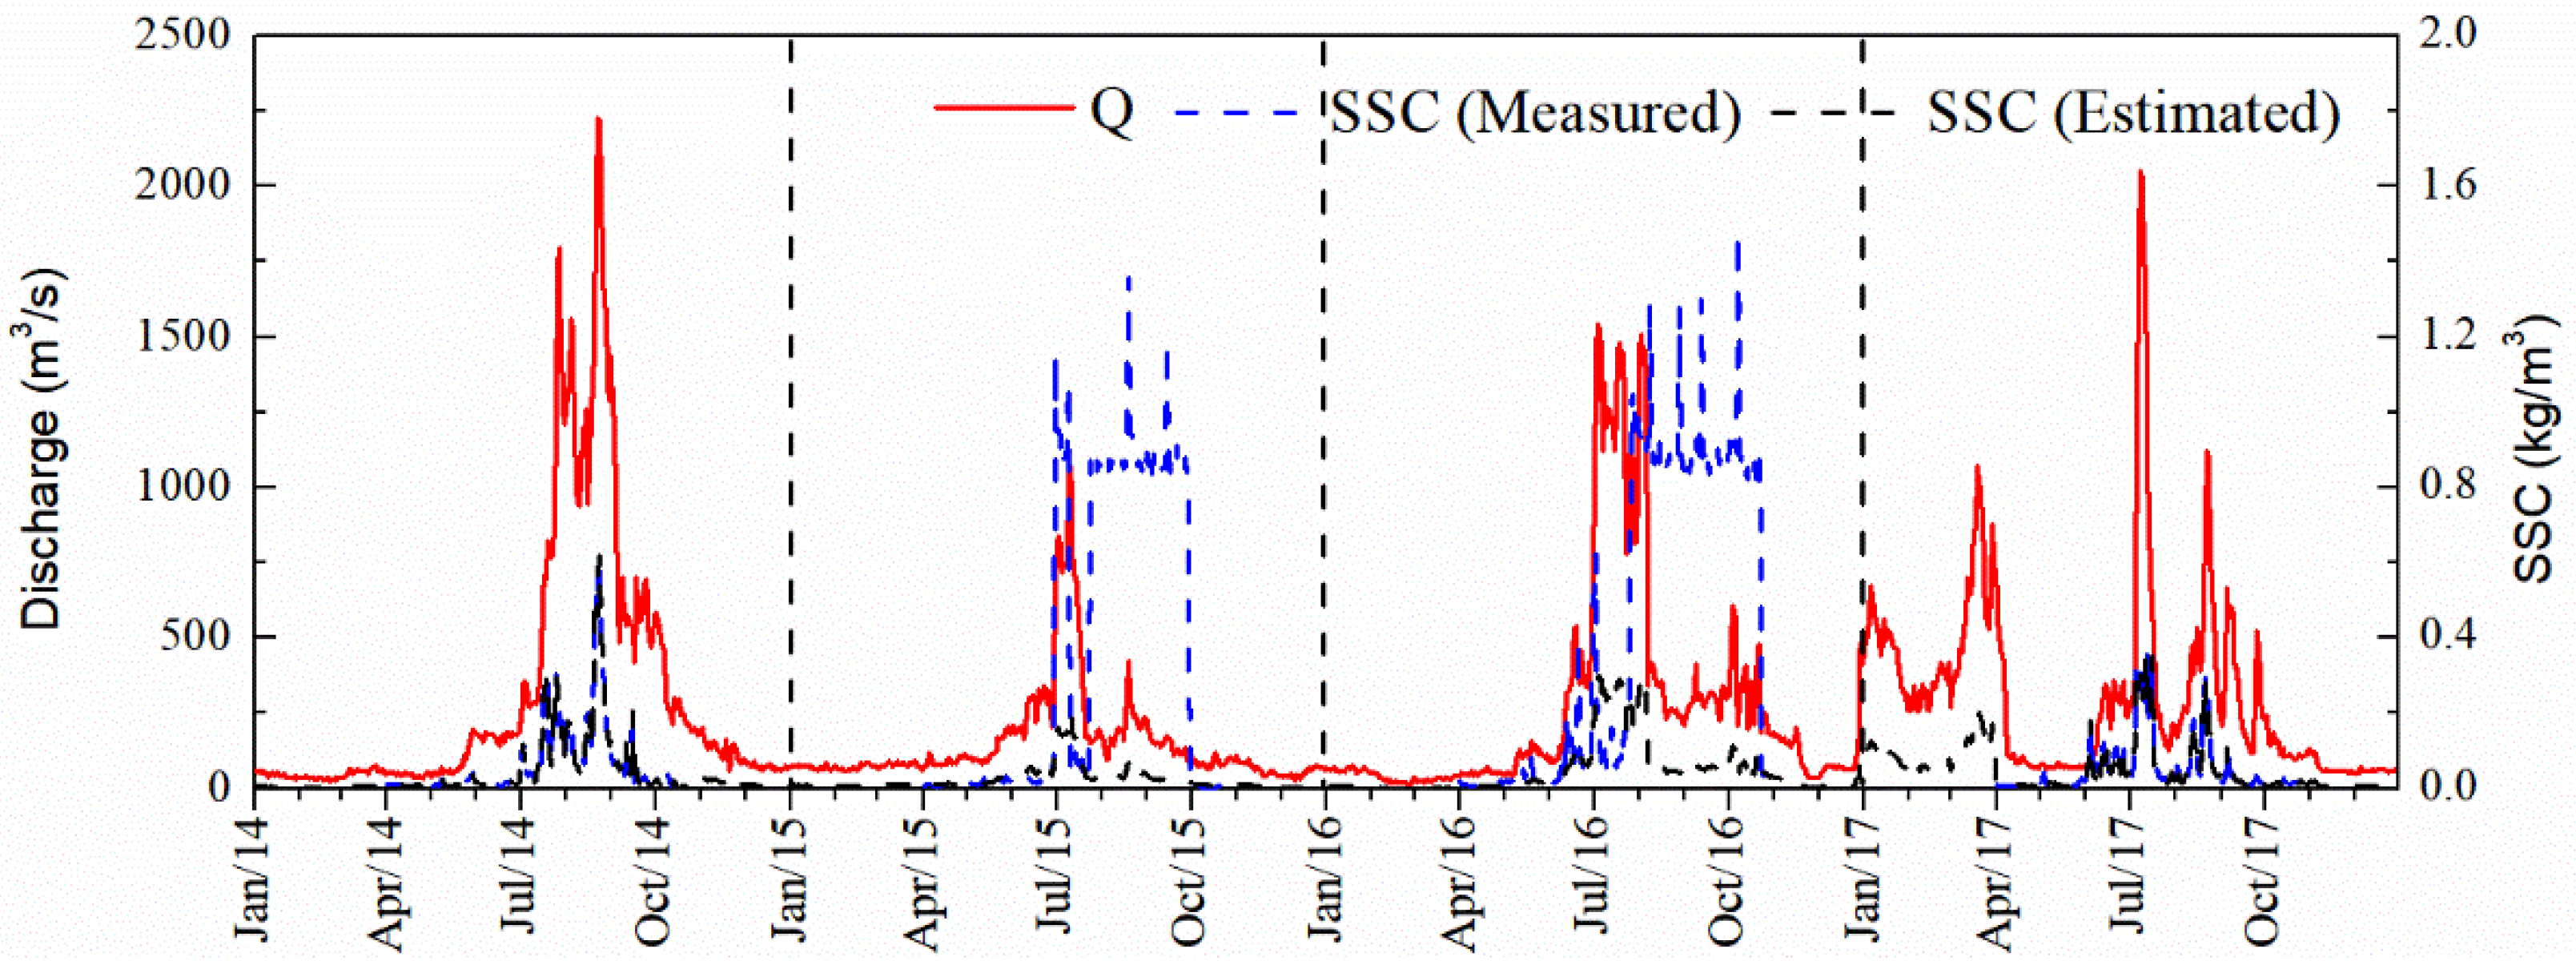
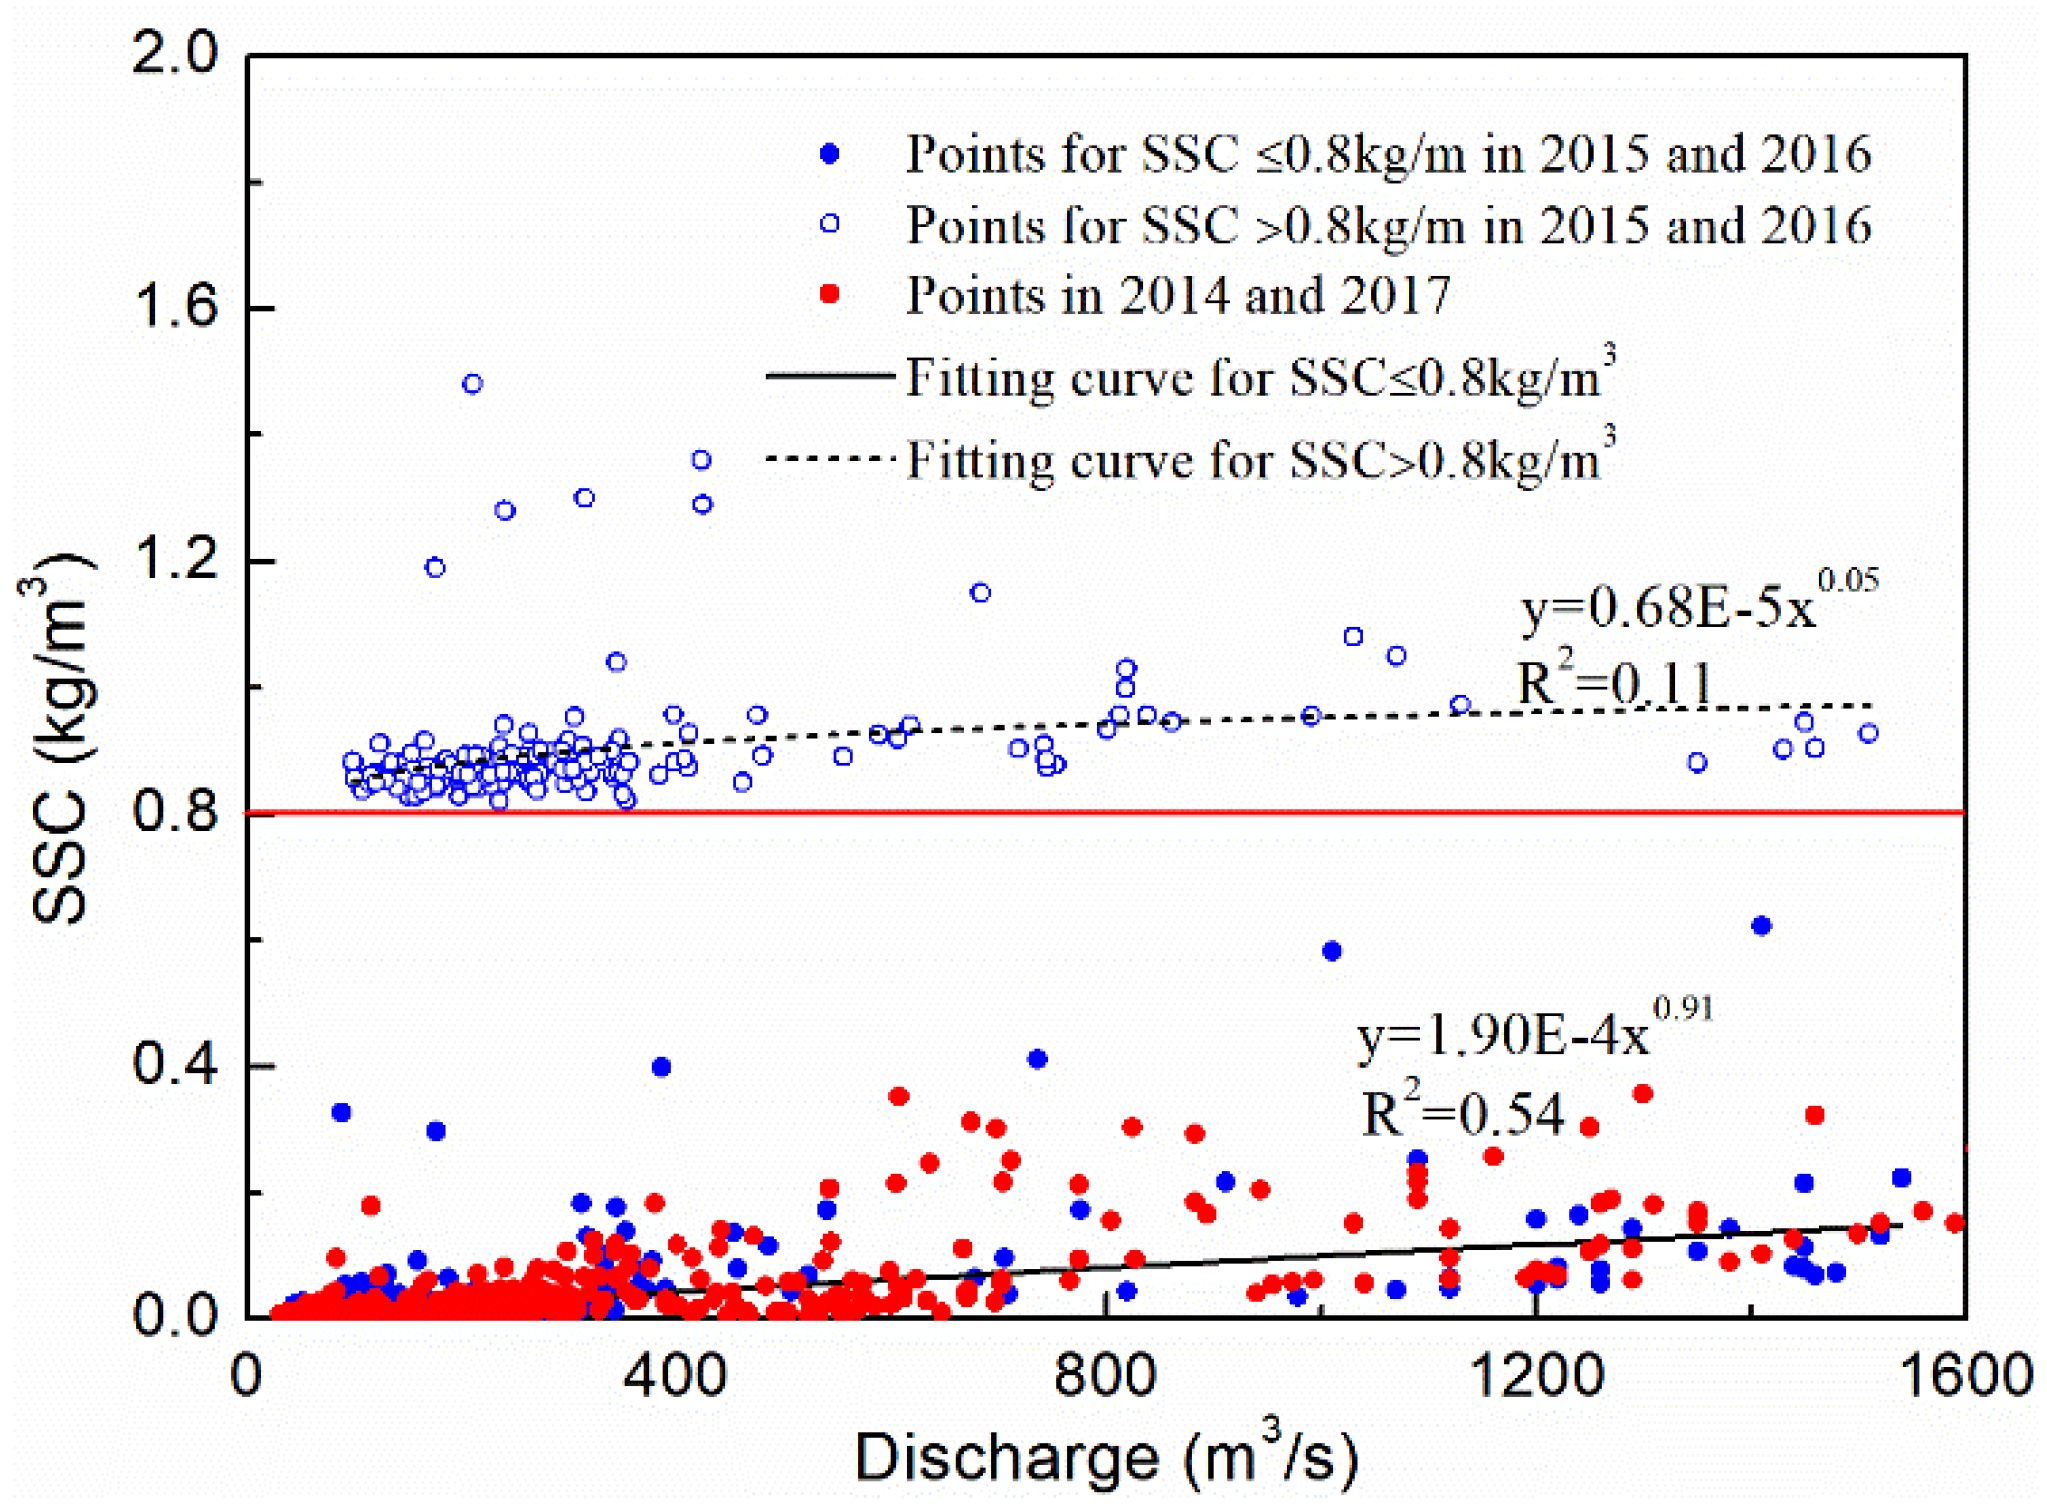
3.1. Estimation of the Undisturbed and Missing SSCs

In 2015 and 2016, at the Lhasa Station, the SSCs were anomalously high from July to September (shown in Figure 2). The measured anomalous SSCs included the undisturbed data as well as the increment caused by short-term disturbance events. To quantify the sediment load from the Lhasa River without considering these short-term events, the undisturbed SSCs should be separated from the measured values. The undisturbed data are mainly caused by riverine discharge and can be estimated with the Q-SSC relationship, as shown in Table 3. The coefficients in the formulas were determined, according to the fitting relationship between the SSCs and the discharge in the undisturbed years of 2014 and 2017 (shown in Table 3). The R2of the cubic polynomial formula means about 70% changes of the SSC can be explained by the flow discharge [47,48], while other factors, such as sediment available and grain size gradation have comparatively less impacts. Therefore, the cubic formula was used to estimate, approximately, the undisturbed SSCs. In addition, the SSCs at the Lhasa Station were not measured in the winter season from November to next March; however, the missing SSCs can be estimated using the cubic polynomial formula. All of the estimated SSCs are shown in Figure 2 and are depicted by the black dash line. It can be seen that in September and October of the anomalous years, the undisturbed SSCs represent less than 25% of the measured data. Moreover, the supplemented SSCs in the dry seasons have much smaller values than those in the rainy seasons. All estimated data have the same change trend as the discharge in the four years, and will be used to estimate the sediment load excluding the disturbance events in the following sections.

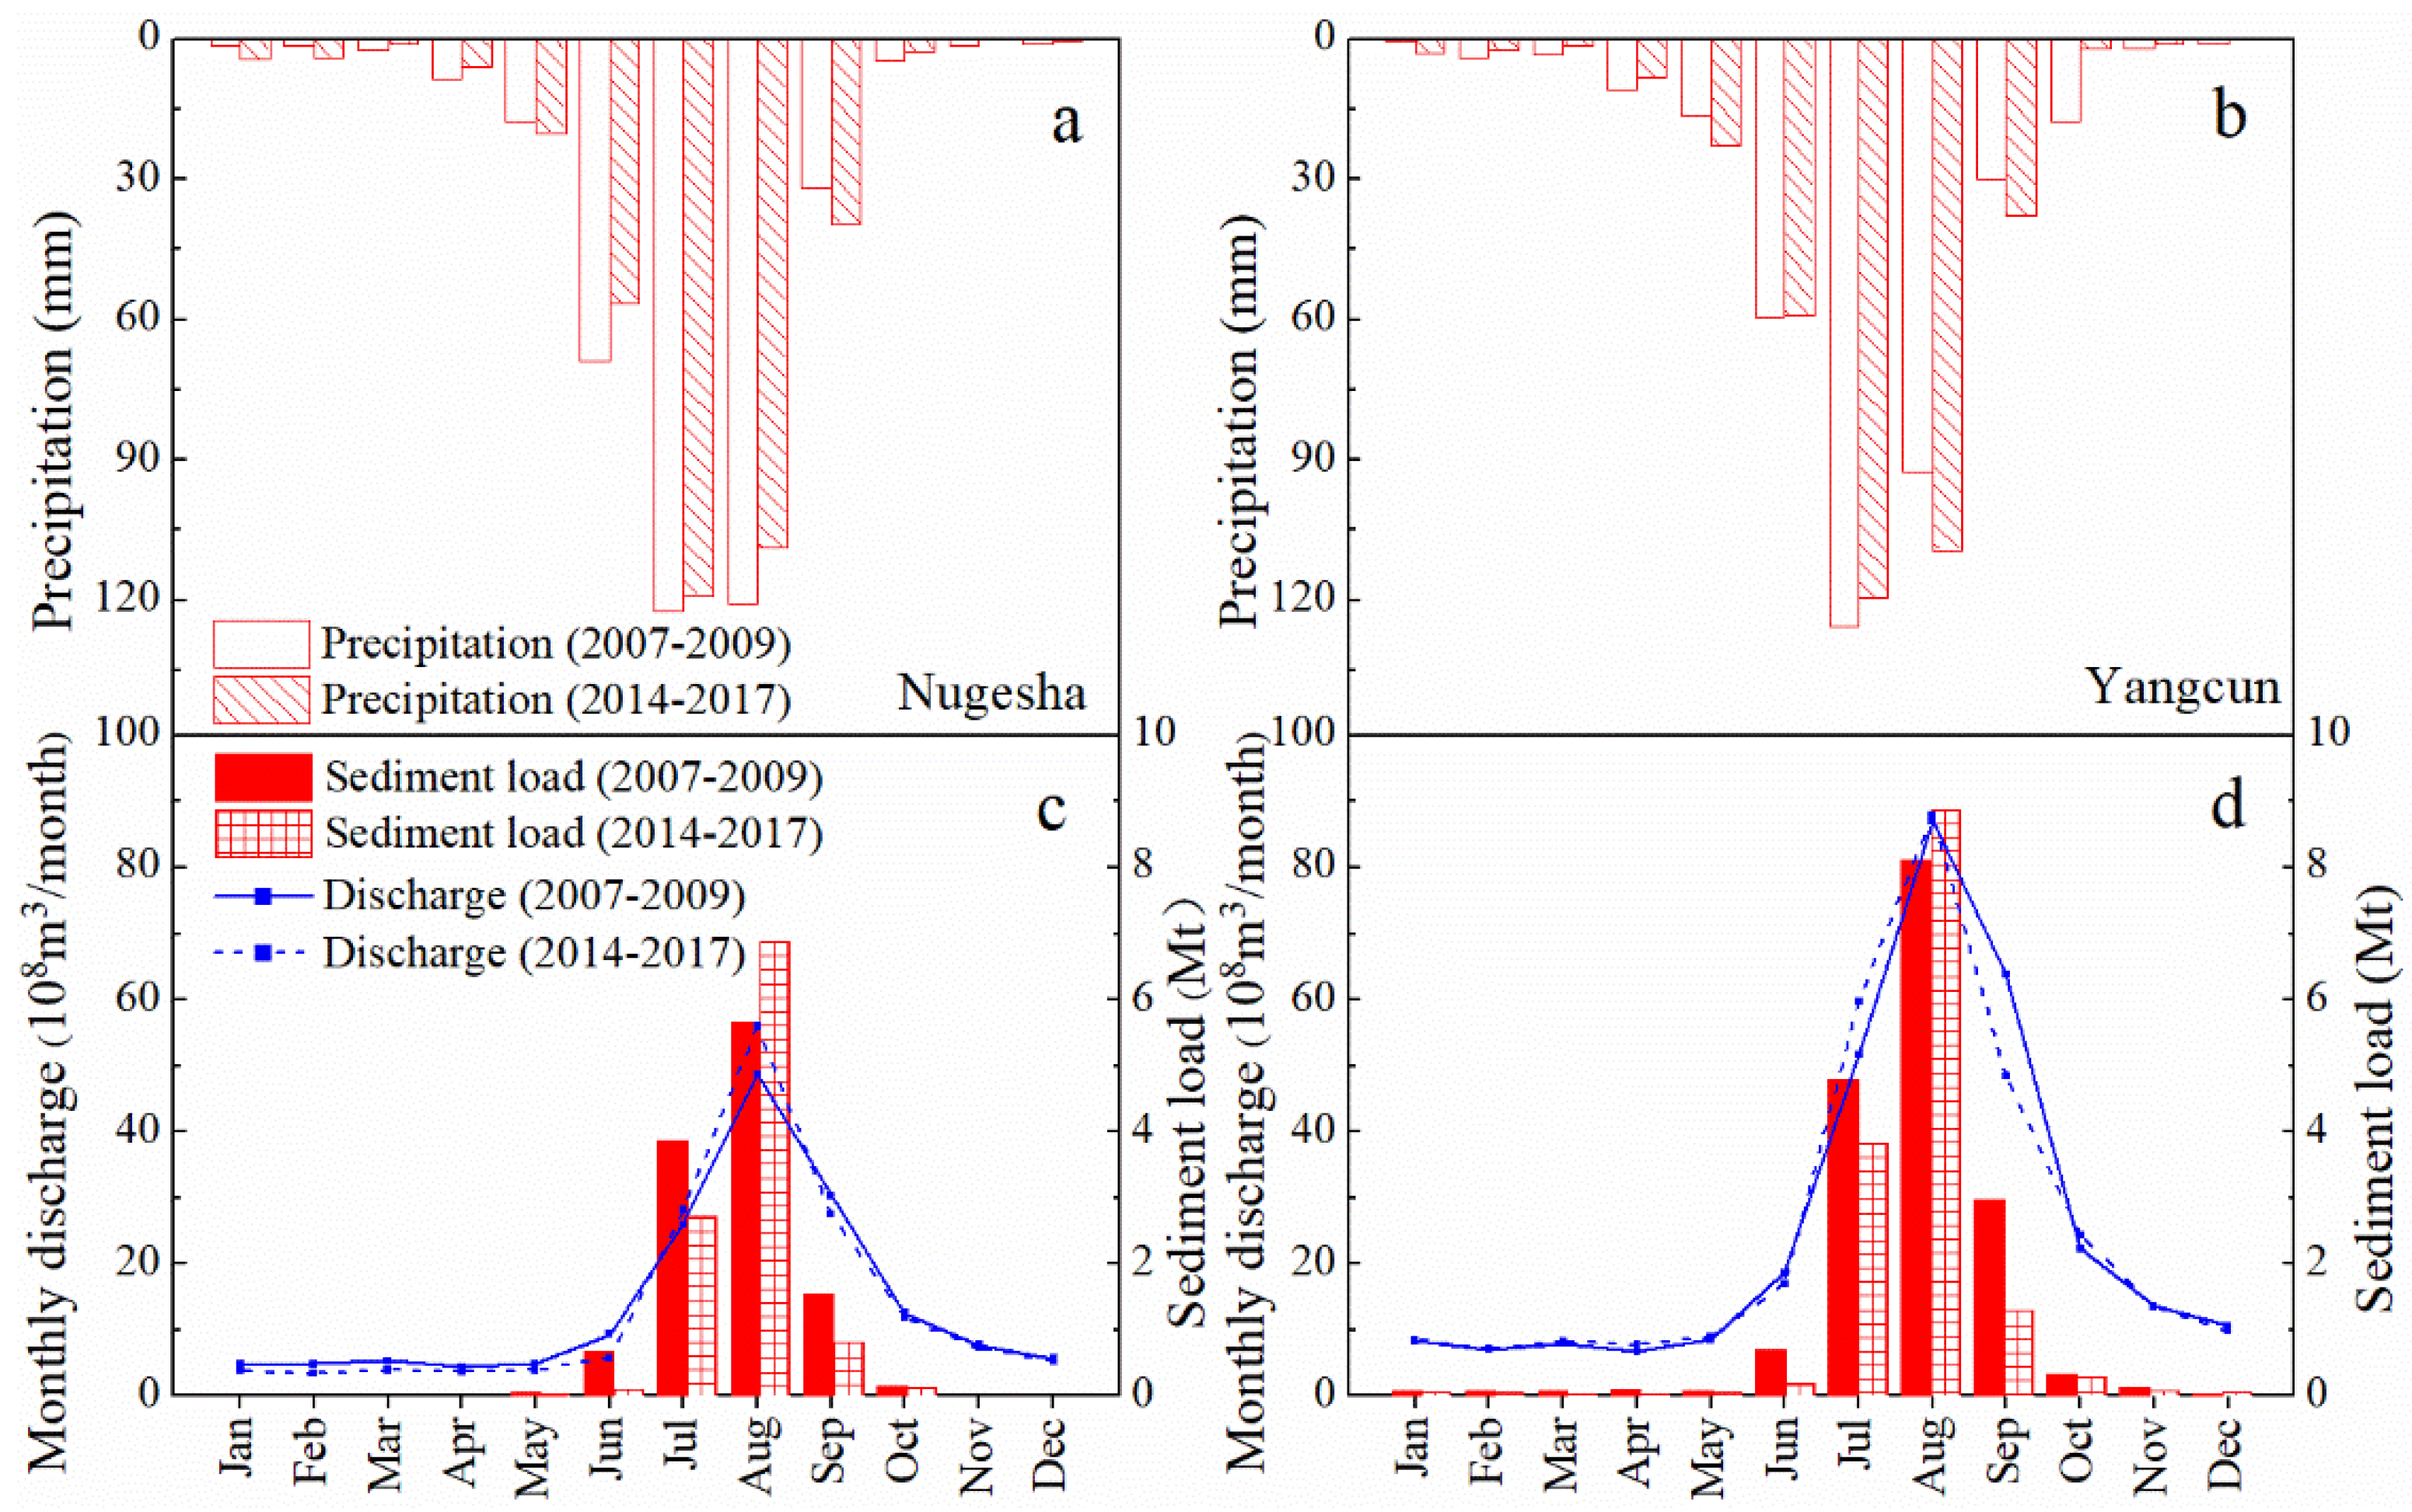
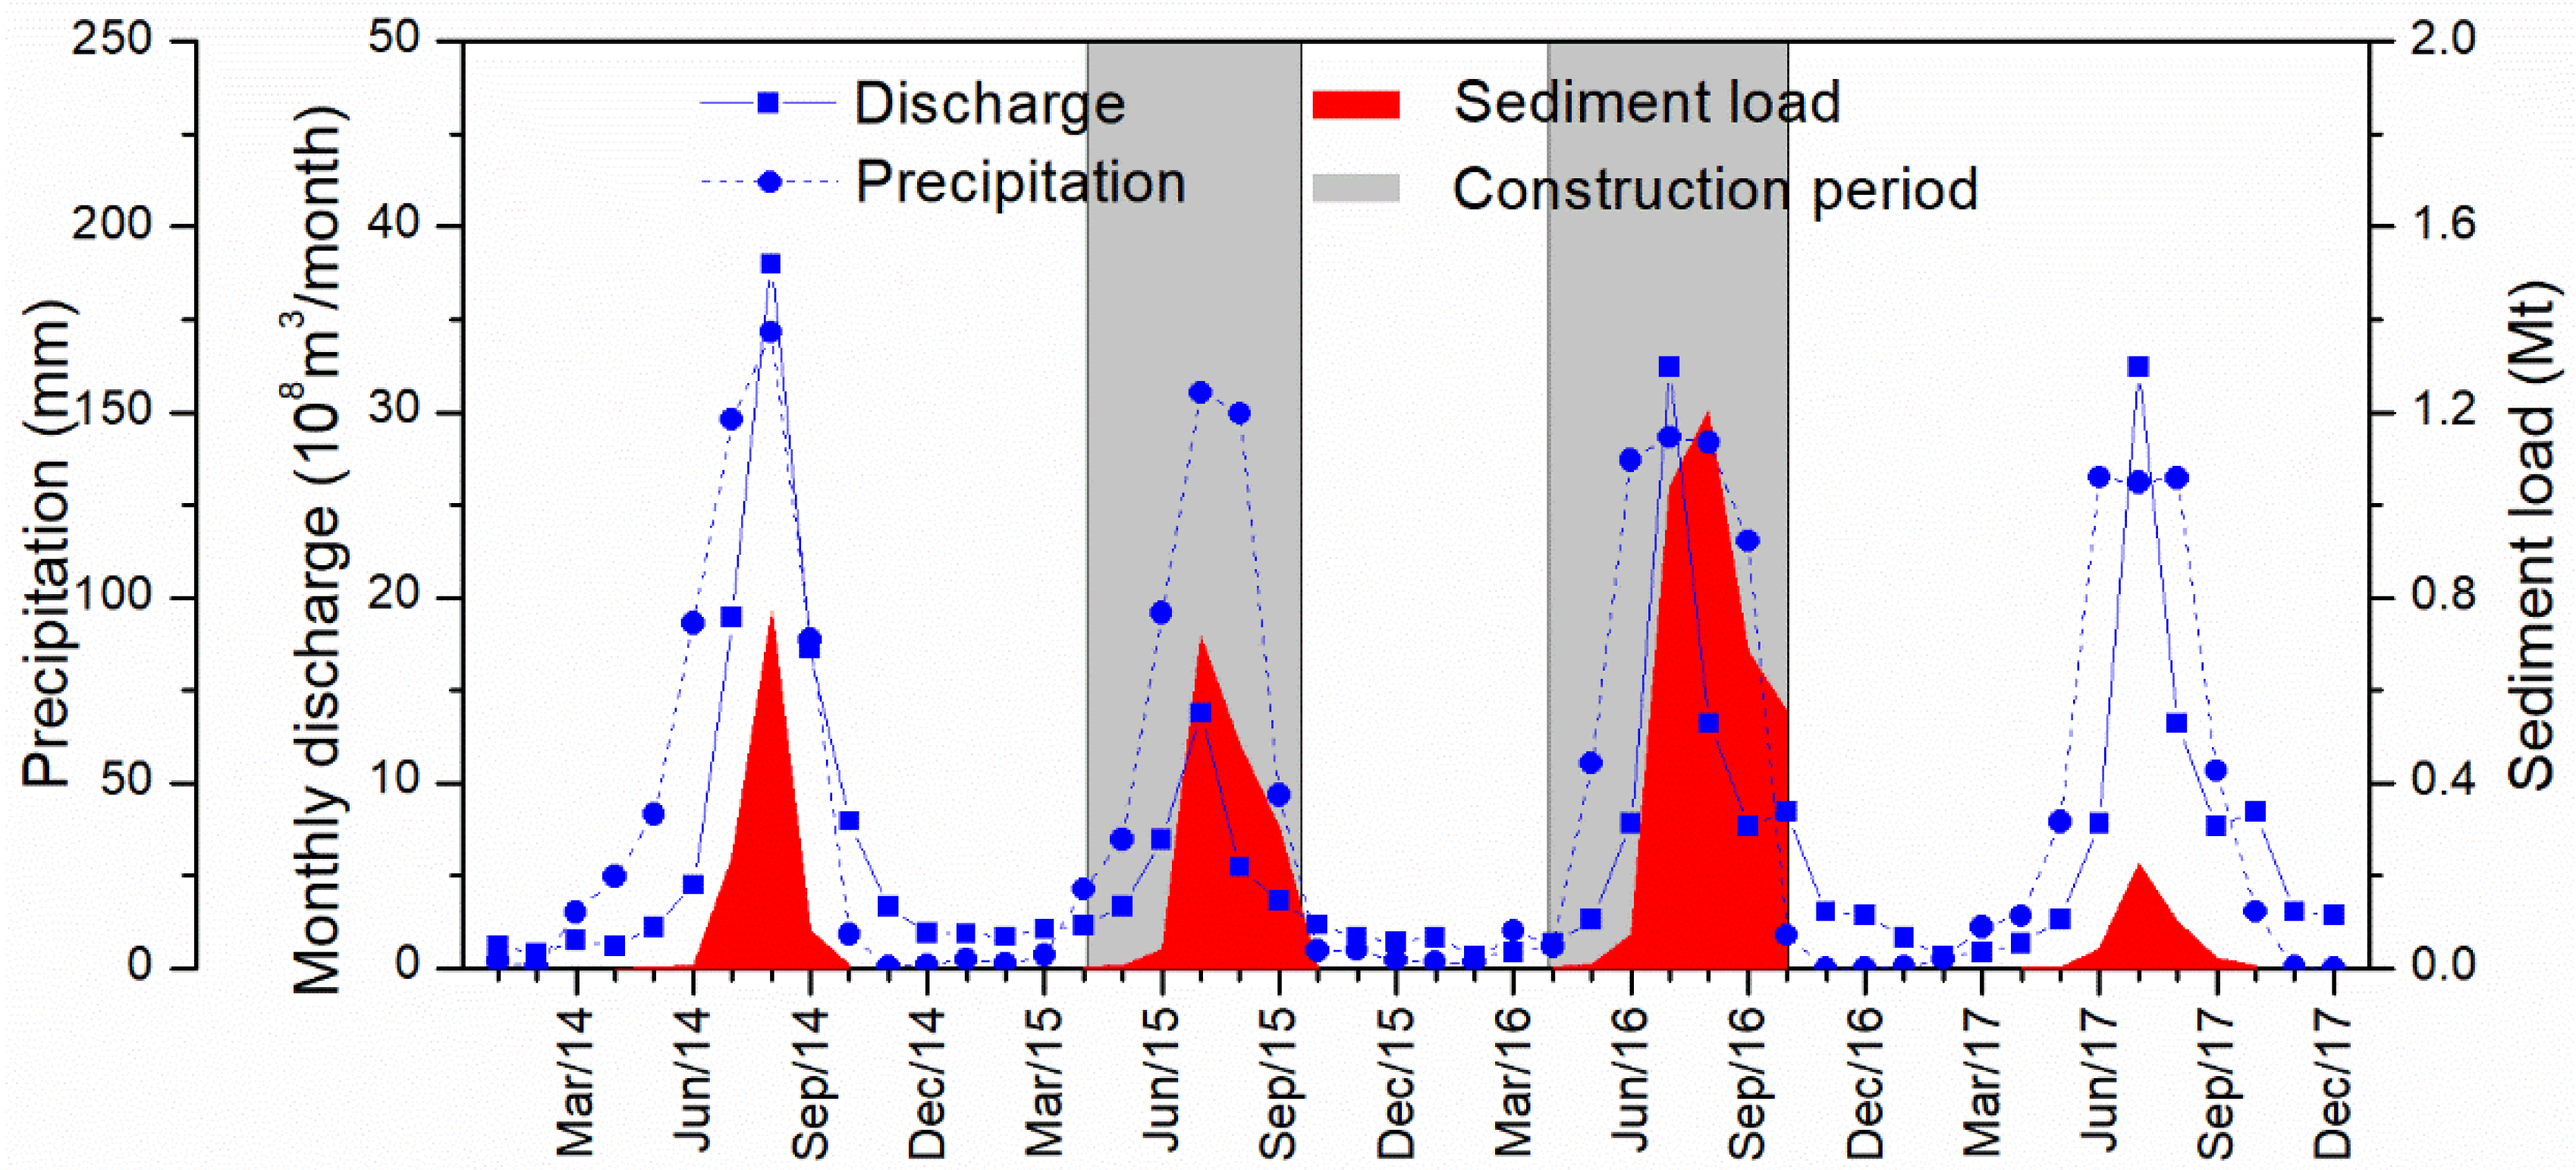
3.2. Sediment Load in the N–Y Reach

Figure 3 shows the monthly mean precipitation, discharge, and sediment load during the periods of 2007–2009 and 2014–2017 at the Nugesha and Yangcun Stations. Figure 3a,b show that, during the two periods, the precipitation and discharge have no significant change. The difference is less than 10% during the rainy season. Figure 3c,d show increases in the mean sediment loads in both periods in August, which is the month with the largest sediment load in the annual cycle. In June, July, and September, a significant decrease in the mean sediment loads can be found when comparing those in the period of 2014–2017 with those in the period of 2007–2009, and the steepest decline ratio can reach 50%.
The sediment yield in the N–Y sub-catchment is shown in Figure 4. The water yield has not changed significantly from 2007 to 2017, while there is a dramatic significant decrease in the sediment yield. The sediment yield in this catchment has reduced to less than ~1 Mt/year from ~5 Mt/year ten years ago. The most drastic changes occurred in 2017, when the river was dominated by sediment deposition instead of sediment erosion. As a result, the annual sediment load through the Yangcun Station has reduced from ~17.4 Mt to less than ~13.8 Mt; thus, the sediment load contribution from the N–Y sub-catchment to the Yarlung Tsangpo River has declined from ~30% to less than 8%.
The sediment rating curves at the Nugesha and Yangcun Stations have also changed in recent years. Table 4 shows the fitted results (with an R2 higher than 0.6) of the water discharge and SSC using power functions; the table also shows that the α constants of the regression equation are reduced by nearly 50% for both stations, while the exponent β is unchanged. As the explanation of the sediment rating curves in the ‘Data and Methods’ section, these results show that soil erodibility, or sediment source availability has decreased significantly; however, the sediment transport capacity of water flow has not changed in the two stations’ catchments. The annual Q-SSC hysteresis of the two stations in the two periods is shown in Figure 5. The hysteretic loops are consistently clockwise. However, there are differences in the two periods. In recent years, the loops became much slimmer than those ten years ago, and the SSC shows a monthly decreasing trend. During the water-falling stage, the SSCs were much closer to the rising stage at the same discharge. The mobilization of suspended sediment within the catchment was clearly restrained and not easily exhausted in recent years [53].

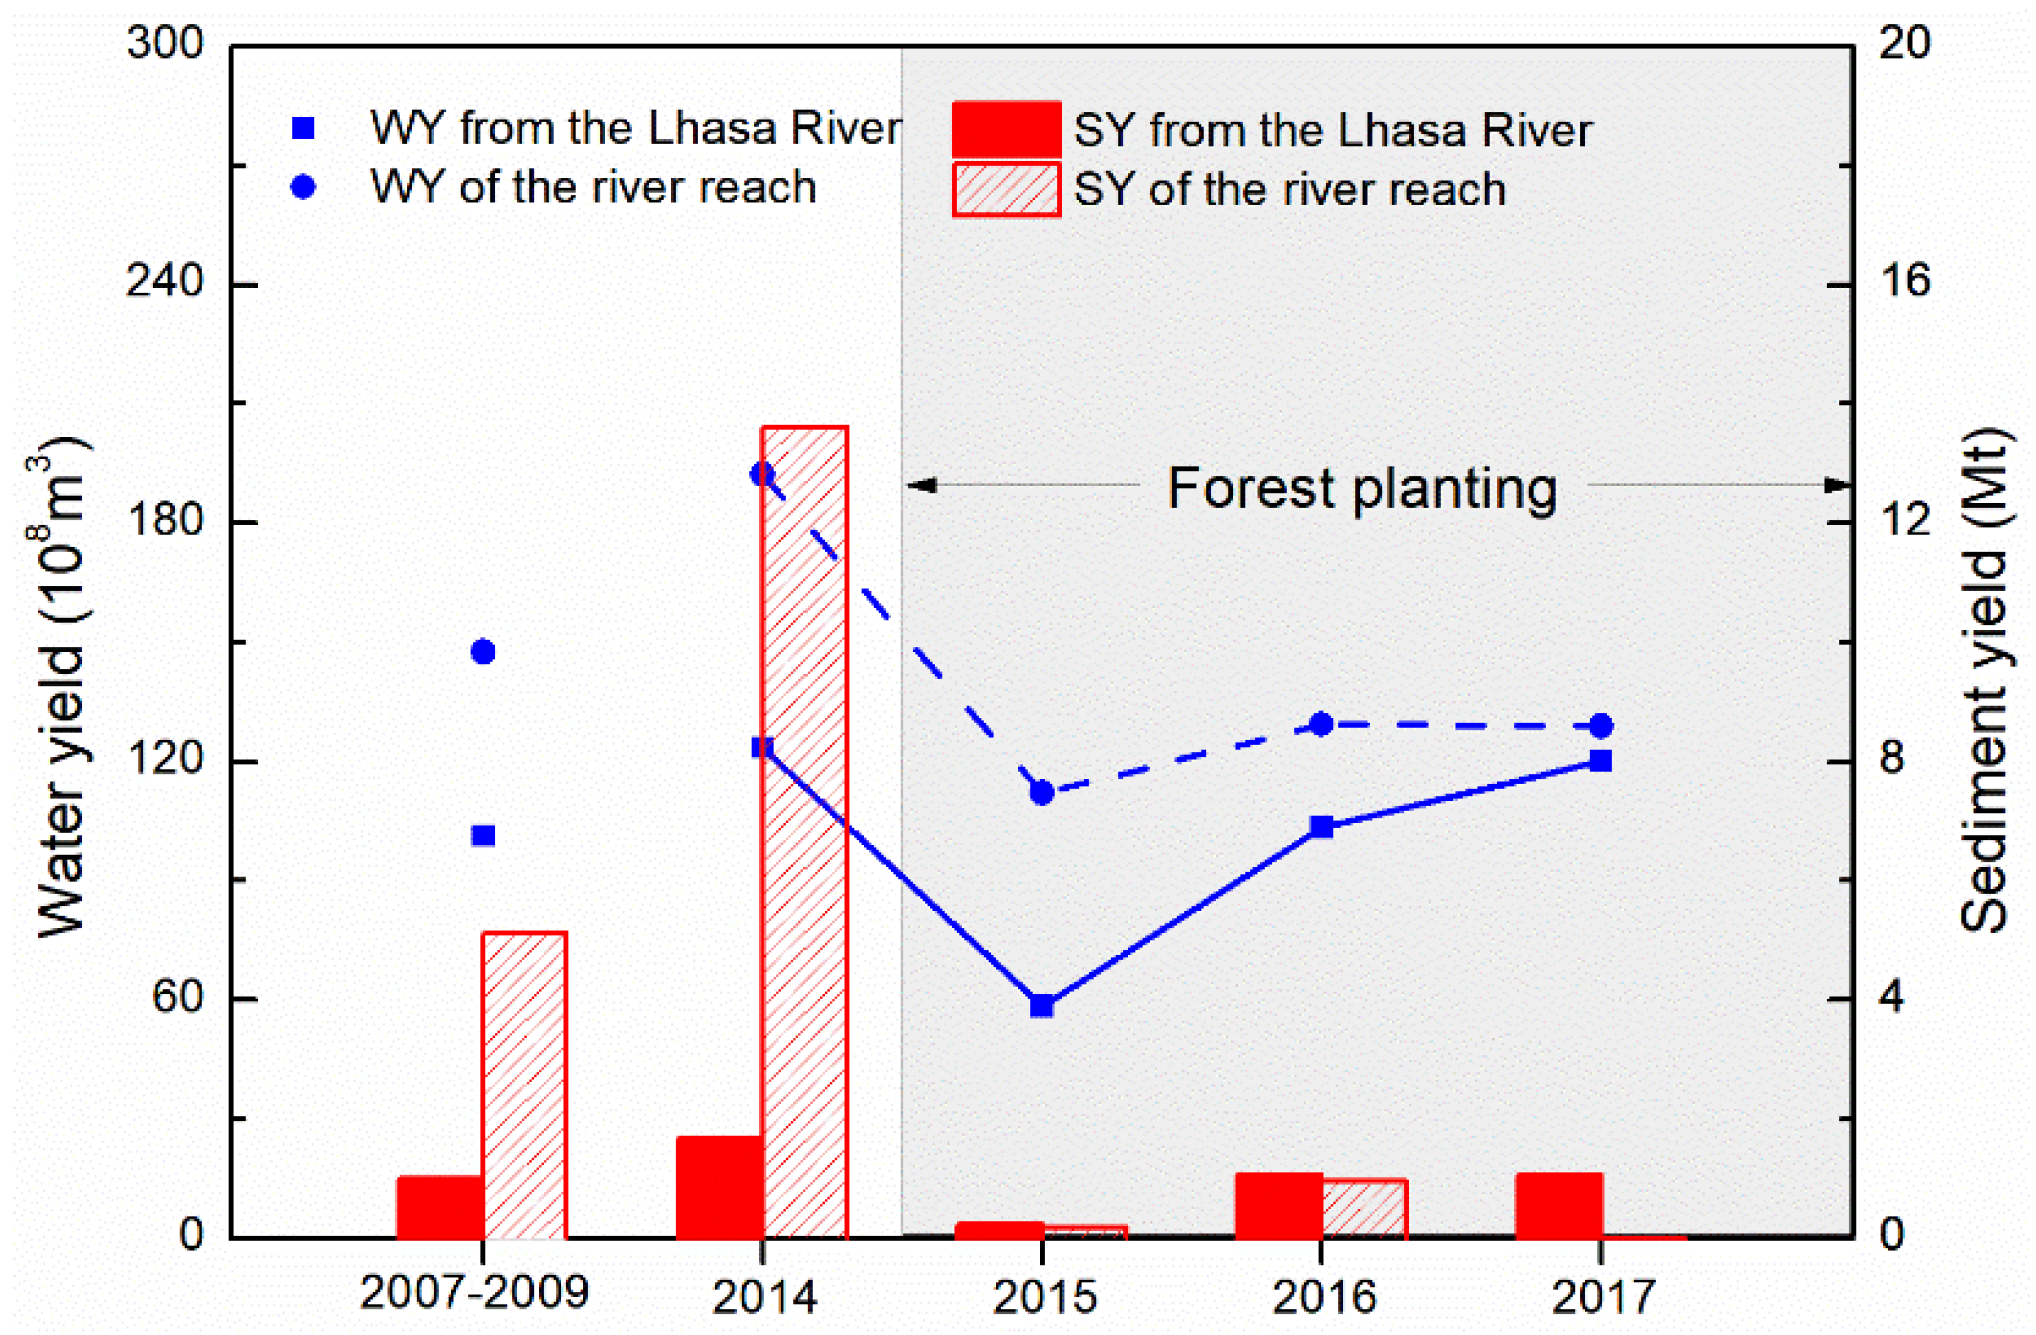
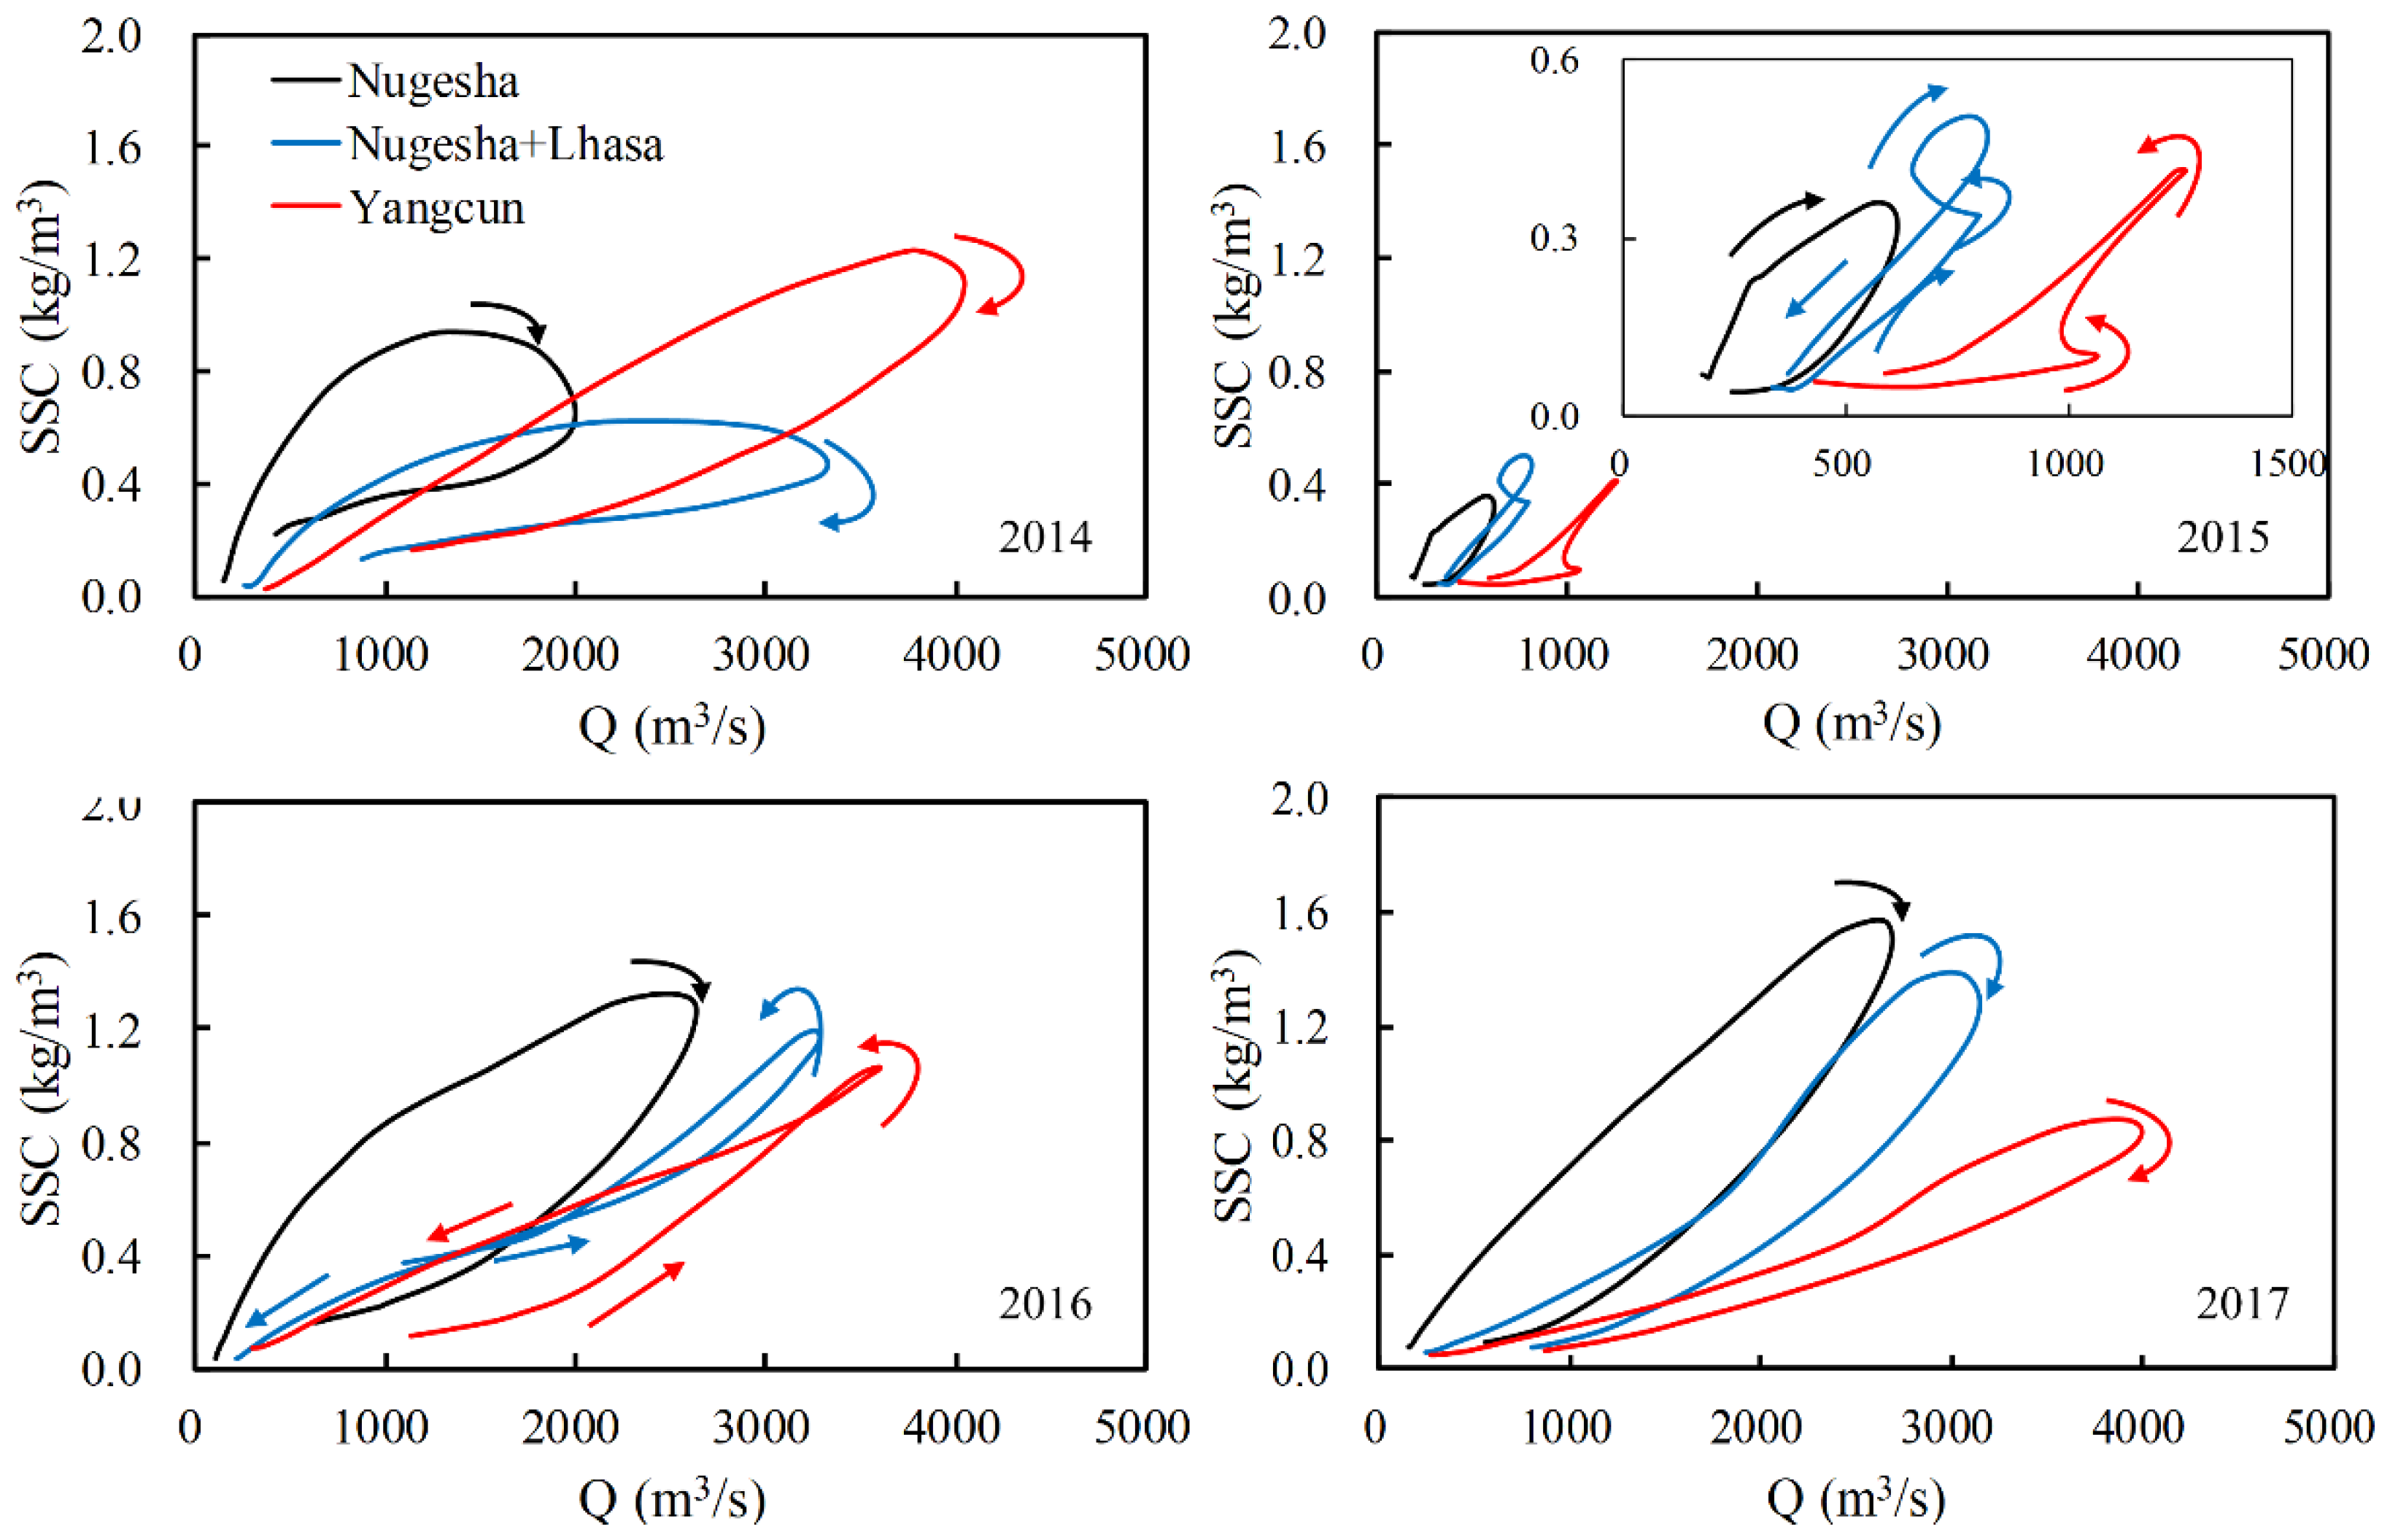
3.3. Contributions of the Lhasa River to the N–Y Reach

The monthly discharge of the Lhasa River is shown in Figure 6. The river drained more water into the mainstream during June-September, accounting for approximately 70% of the annual discharge for the periods of 1953–2003 and 2014–2017. However, there was an apparent difference between the two periods. In the recent period, the peak discharge occurred in July, while in the earlier period, it occurred in August. Additionally, the more recent discharge during the period from January to March was significantly greater than that in the earlier decades, which was mainly caused by the increasing discharge in 2017. Upstream reservoirs played an important role in the changes by maintaining the flood water level in August and supplying water to the river in the winter.
Figure 6 also shows the sediment load at the Lhasa Station. The high sediment load values are concentrated in the rainy months from June to September. Large sediment loads occurred in July and August, accounting for 80% of the annual load, which is an indication of the seriousness of soil erosion during the two months. Figure 7 shows the multiple sediment hysteresis curves at the Lhasa Station. The variable curves are induced by the discharge and complex sediment supply process [51,52]. For example, the curve in 2014 exhibited a figure-eight hysteresis, where a greater SSC occurred in the spring (from April to May) than that in the autumn (from September to October) under very similar discharge conditions, and a counter-clockwise loop occurred in the summer (from June to August). The pattern indicated the overall sediment supply depletion from the spring to the autumn and the irruptive supply replenishment in the summer months. The curve in 2017 exhibited a multiple clockwise hysteresis, where the greater SSC occurred in the water-rising stage than that in the water-falling stage. The pattern indicates that the sediment supply was depleted by successive flow peaks in the summer. However, the curves in the anomalous years of 2015 and 2016 exhibited counter-clockwise hysteresis, which indicated a delayed sediment supply or differential Q-SSC travel times.
The Lhasa River is characterized by more water and less sediment. The river drains approximately 101 × 108m3 of water and 1.01 Mt of sediment into the Yarlung Tsangpo River each year (shown in Figure 8). These values account for approximately 35% and 10% of the flow discharge and sediment load through the Yangcun Station, respectively, while the catchment area accounts for only approximately 20% of the mainstream gauging station. The drained water and sediment result in an average SSC of approximately 0.13 kg/m3 in the rainy season (from June to September). The SSC is approximately one-fifth of that at the Yangcun Station and results in significant dilution in the mainstream. The contributions of the Lhasa River to the water and sediment yield are shown in Figure 4, which shows that the Lhasa River contributes approximately 70% of the water to the N–Y sub-catchment, which is consistent with the period of 2007–2009. However, the contributions to the sediment show drastic changes. Since 2015, the sediment yield from the Lhasa River catchment has been almost equal to, or even greater than, that from the N–Y sub-catchment, especially compared to the proportion of less than 20% ten years ago. The drastic change is mainly attributed to the decrease in the sediment yield in the mainstream catchment because no obvious sediment yield change was found in the tributary catchment in the past decade.

3.4. Anomalous SSC in the Lhasa River and Mainstream Response

An anomalous SSC in the Lhasa River was found in both 2015 and 2016 (shown in Figure 2). In July of these two years, the SSC suddenly increased from 0.2 kg/m3 to greater than 0.8 kg/m3 and remained at the higher level for about three months. Under a typical low discharge of 200 m3/s in the Lhasa River, its sediment carrying capacity is estimated to be ~3.0 kg/m3 by applying the van Rijn’s formula [54] and using the field observed hydraulic and sediment parameters [55]. However, the real SSC is as low as 0.4 kg/m3 due to the limited sediment supply from this catchment in 2014 and 2017 (shown in Figure 9). Therefore, the suspended sediment transport in the Lhasa River is in a supply-limited condition and when there is high sediment supply, the fluvial SSC can increase correspondently.
The anomalous concentration enhanced the mainstream SSC and quadrupled the annual sediment load of the Lhasa River. The anomaly was also shown in the sediment rating curve of the Lhasa River (Figure 9). In this figure, the red points represent the data under the normal conditions of 2014 and 2017, and the hollow and solid blue circular points represent the data with SSCs greater and less than 0.8 kg/m3, respectively, in the two anomalous years. It can be seen from the figure that the hollow blue points do not conform to power equations. The larger SSC does not vary with increasing discharge, indicating a very low correlation between the two variables.
The anomalous SSC in the Lhasa River has a considerable influence on the sediment dynamics of the mainstream Yarlung Tsangpo River. Table 5 shows the influence on the sediment rating curves. In 2014, 2017 and the period 2007–2009, the constant α of the regression power equation at the Yangcun Station was less than that at the Nugesha Station, while the exponent β remained the same. However, in 2015 and 2016, at the Yangcun Station, α was significantly larger than that at the Nugesha Station, while the β value decreased. This result indicates that the anomalously larger SSC significantly increased the soil erodibility and sediment source availability, but gently decreased the sediment transport capacity of water flow in the Yarlung Tsangpo River.
Figure 10 shows the anomalous SSC influences on the hysteresis curves in the four years. The black lines from the Nugesha Station are clockwise, whereas SSC is consistently higher for the same discharge during the water-rising period than during the water-falling period. The blue lines are obtained from the proration of the discharge and SSC at the Nugesha and Lhasa stations. The abscissa values of the blue lines are the combined discharges from the Nugesha Station and the water yields in the Lhasa River catchment, while the ordinate values are the combined SSCs from the gauging station and the sediment yields of the tributary catchment. The lines remain clockwise in 2014 and 2017. In 2015 and 2016, the lines were deformed with a counter-clockwise segment around the peak discharge due to the anomalous counter-clockwise curves in the Lhasa River (shown in Figure 7). The red lines are from the Yangcun Station. They can be regarded as the discharge and SSCs in the blue lines combined with the water and sediment yield in the mainstream catchment. Despite the moderate impact of the water and sediment yield, the red curves are still reversed with counter-clockwise segments in 2015 and 2016. The Q-SSC hysteresis curve in the ~100 km downstream Yangcun Station has been obviously affected by the great SSC. Moreover, the water and sediment yield in the mainstream catchment can hardly eliminate the anomalous SSC in the Lhasa River.

4. Discussion

4.1. Human Activities in the N–Y Reach

Many changes in the sediment regime have occurred in recent years in the N–Y sub-catchment. All the changes indicate limitations of sediment transport, such as a decrease in sediment yield, a reduction in soil erodibility, and a limitation of sediment transport in the river, which are closely related to human-induced land-use changes in the N–Y sub-catchment (shown in Table 6). From 2010 to 2018, the area of forestland nearly tripled in the study area because of two large-scale afforestation projects. The first project was implemented in the 1980s [32] in the middle reach of the Yarlung Tsangpo River, and the project was a combined social and ecological development project in the N–Y sub-catchment. One of the main objectives of this project was forest planting on mainstream bank slopes and in the Lhasa River catchment. Because of the project, the soil and water loss in the middle reach of the Yarlung Tsangpo River was preliminarily controlled starting in 2005 [56]. In 2014, the second and significantly larger project was carried out, which was known as a specialized afforestation project aimed at reducing the soil and water loss in Tibet. The N–Y sub-catchment of the Yarlung Tsangpo River is a major focal area of the project [33,34]. As a result, the sediment yield in this area has been reduced by more than 80%, and the soil erodibility has been effectively controlled. Table 6 also shows that grassland degradation and desertification were both still serious because of the fragile ecological environment and overgrazing [57]. The grassland degradation and gravel erosion are the two critical driving forces of sediment erosion [31], but the sediment yield has not increased in recent years. This change indicates that gravity erosion, mainly caused by landslides and debris flow, has been prevented as a result of large-scale afforestation in the N–Y sub-catchment.
In addition, anomalous SSCs occurred in 2015 and 2016, with the sediment load remaining at high values for approximately three months during these two years (shown in Figure 11), which was thought to be related to short-term human interventions. In these two years, two roads named the Lin-La highway and South-ring Road of Lhasa City were constructed along the bank of the Lhasa River. The Lin-La highway stretches more than 100 km along the riverside, while the South-ring Road is about 20 km long. The roadbeds occupied the river course and served as a sediment source before they were paved with asphalt [39]. In addition, the two roads included several large bridges across the river, with piled foundations. During the construction of these piles, the riverbed was inevitably agitated, resulting in a sharp increase in SSC. Figure 11 shows the sediment load and the selected road construction periods combined with the riverine discharge and precipitation. It can be seen that anomalous SSCs occurred during the construction periods. The sediment load was sharply decreased at the end of September 2015 because the Lin-La highway project was completed in mid-September 2015. While in 2016, the sediment load remained high from July to the end of the construction period. Finally, after the road construction ended in 2017, the high SSC values recovered to the normal level. Figure 11 also shows that the sediment load was sharply increased with the increasingly heavy rainfall from June to August, and this increase in sediment load was mainly induced by roadbed erosion. With the decrease in precipitation in September and October, the sediment load decreased. However, the sediment loads in the two anomalous periods were higher than those in the period with very similar discharges in 2014 and 2017. Despite serious erosion by rainfall, sediment had not yet been exhausted in September or October of 2015 and 2016. Associated with the extremely high SSCs in September and October (shown in Figure 2) and the closed counter-clockwise hysteresis curves in Figure 7, the conclusion can be drawn that the road construction projects in the two years supplied short-term sediment sources until they were completed.
Similar constructions frequently happen in the N–Y catchment because the largest and most populous cities, Lhasa and Shannan, are located in this area, which have the most developed economy in Tibet [58,59]. Although the short-term effects on the sediment regimes occur within a few months, construction projects can manifest an increase in the SSC, and more attention should be paid to river basin management and river environmental protection in the N–Y sub-catchment.

4.2. Potential Changes in Other Reaches

In the Yarlung Tsangpo River, three river basins are confined by four main stream gauging stations, Lhaze, Nugesha, Yangcun and Nuxia (shown in Figure 1). These reaches are orderly named the Lhaze–Nugesha (L–N) reach, N–Y reach, and Yangcun–Nuxia (Y–N) reach, respectively. Four major tributaries, including the Duoxung Tsangpo, the Nyangqu River, the Lhasa River and the Niyang River, feed into the reaches (shown in Figure 1). The tributaries and connected mainstream all serve as important human settlements in Tibet; thus, human interventions have continuous impacts on their sediment regimes. The L–N reach has less water and more sediment than the other reaches [35], with two major tributaries, the Duoxung Tsangpo and Nyangqu Rivers. Similar to the N–Y catchment, the L–N catchment was also planned as a key area for soil and water conservation [32,33,34]. As a result, the forest area has increased by more than three times since 2000, even though it accounts for only 1% of the total catchment of the L-N catchment [35]. The soil loss may be reduced due to an increase in forest area, either now or in the future. The Y–N catchment had higher rates of forest coverage and was dominated by sediment deposition in 2007–2009 [35]. In 2015, the Zangmu Hydropower Station, which is located in the upper section of the reach, was constructed for operation, and it was the first hydropower station in the mainstream of the Yarlung Tsangpo River. The sediment regimes in this reach may have been changed and become more complex. In addition, the other two largest cities in Tibet, Shigatse and Nyingchi, are located in the L–N and Y–N reaches, respectively. Short-term infrastructure construction is also frequent, and its impacts on sediment transport should be given more attention in the future.

5. Conclusions

In this study, an investigation was undertaken on the sediment regimes of a sub-catchment of the Yarlung Tsangpo River, i.e., the Nugesha–Yangcun (N–Y) catchment. We gathered the river flow and suspended sediment data from key gauging stations in the mainstream and a tributary, the Lhasa River, analyzed the relationship between the discharge and SSC, calculated the sediment yield in the catchments, explored the sediment regime changes and anomalies, and discussed the effect of human activities. The main findings of the study are as follows:
(1) A significant decrease in the annual sediment yield is detected in the N–Y sub-catchment, from ~5 Mt to ~1 Mt. The reduction in the sediment yield is mainly explained by the reduced sediment source, which is highly related to afforestation in recent years. As a result, the contribution of the N –Y sub-catchment to the sediment load has declined from ~30% to less than 8%.
(2) The main sediment contributor has shifted from the mainstream catchment to the tributary (Lhasa River) catchment. The percentage of sediment yield from the tributary catchment has increased from ~20% to ~100%, while the proportion of mainstream-catchment sediment has dropped to almost zero.
(3) In the Lhasa River, an anomalously high suspended sediment was found from July to September in consecutive years, i.e., 2015 and 2016. In these periods, the SSC increased sharply from ~0.2 kg/m3 to ~0.8 kg/m3, the high concentration level lasted for ~90 days in each year, and the sediment rating curves were distorted. This anomaly is thought to be related to short-term human activity, a road construction project in the same period, and the SSC level has recovered after the road construction ended.
In summary, the human activities in the N–Y catchment and the potential changes in other river catchments are discussed in this study. The increasing human activities in the Yarlung Tsangpo River should be carefully monitored, and further research on water and soil conservation and river basin management should be undertaken.

Author Contributions

Z.H. and J.S. conceived the idea and approach for the study. N.L., P.D. and J.D. analyzed the data. Z.H. and B.L. wrote the paper and contributed to the language translation. All authors have read and agreed to the published version of the manuscript.

Funding

This research was funded by the National Natural Science Foundation of China (Grant No. 51779121, 51639005), the National Key R&D Program of China (Grant No. 2016YFC0502204) and the China Postdoctoral Science Foundation (Grant No. 2019M650693).

Acknowledgments

The data were supported by "National Earth System Science Data Sharing Infrastructure, National Science & Technology Infrastructure of China. (http://www.geodata.cn)".

Conflicts of Interest

The authors declare no conflicts of interest.

References

  1. Immerzeel, W.W.; Van Beek, L.P.H.; Bierkens, M.F.P. Climate Change Will Affect the Asian Water Towers. Science 2010, 328, 1382–1385. [Google Scholar] [CrossRef] [PubMed]
  2. Milliman, J.D.; Meade, R.H. World-Wide Delivery of River Sediment to the Oceans. J. Geol. 1983, 91, 1–21. [Google Scholar] [CrossRef]
  3. Wang, H.J.; Yang, Z.S.; Saito, Y.; Liu, J.P.; Sun, X.X.; Wang, Y. Stepwise decreases of the Huanghe (Yellow River) sediment load (1950–2005): Impacts of climate change and human activities. Glob. Planet. Chang. 2007, 57, 331–354. [Google Scholar] [CrossRef]
  4. Hassan, M.A.; Church, M.; Yan, Y.X.; Slaymaker, O. Spatial and temporal variation of in-reach suspended sediment dynamics along the mainstem of Changjiang (Yangtze River), China. Water Resour. Res. 2010, 46, W11551. [Google Scholar] [CrossRef] [Green Version]
  5. Wang, J.J.; Lu, X.X.; Kummu, M. Sediment load estimates and variations in the Lower Mekong River. River Res. Appl. 2011, 27, 33–46. [Google Scholar] [CrossRef]
  6. Suif, Z.; Fleifle, A.; Yoshimura, C.; Saavedra, O. Spatio-temporal patterns of soil erosion and suspended sediment dynamics in the Mekong River Basin. Sci. Total Environ. 2016, 568, 933–945. [Google Scholar] [CrossRef] [Green Version]
  7. Dai, Z.J.; Fagherazzi, S.; Mei, X.F.; Gao, J.J. Decline in suspended sediment concentration delivered by the Changjiang (Yangtze) River into the East China Sea between 1956 and 2013. Geomorphology 2016, 268, 123–132. [Google Scholar] [CrossRef] [Green Version]
  8. Zhang, J.J.; Zhang, X.P.; Li, R.; Chen, L.L.; Lin, P.F. Did streamflow or suspended sediment concentration changes reduce sediment load in the middle reaches of the Yellow River? J. Hydrol. 2017, 546, 357–369. [Google Scholar] [CrossRef]
  9. Yang, H.F.; Yang, S.L.; Xu, K.H.; Milliman, J.D.; Wang, H.; Yang, Z.; Chen, Z.; Zhang, C.Y. Human impacts on sediment in the Yangtze River: A review and new perspectives. Glob. Planet. Chang. 2018, 162, 8–17. [Google Scholar] [CrossRef]
  10. Wang, Y.K.; Rhoads, B.L.; Wang, D.; Wu, J.C.; Zhang, X. Impacts of large dams on the complexity of suspended sediment dynamics in the Yangtze River. J. Hydrol. 2018, 558, 184–195. [Google Scholar] [CrossRef]
  11. Liu, J.P.; Zhang, W.C.; Liu, T.; Li, Q.L. Runoff dynamics and associated multi-scale responses to climate changes in the middle reach of the Yarlung Tsangpo River basin, China. Water 2018, 10, 295. [Google Scholar] [CrossRef] [Green Version]
  12. Rudra, K. Changing river courses in the western part of the Ganga-Brahmaputra delta. Geomorphology 2014, 227, 87–100. [Google Scholar] [CrossRef]
  13. Manh, N.V.; Dung, N.V.; Hung, N.N.; Kummu, M.; Merz, B.; Apel, H. Future sediment dynamics in the Mekong Delta floodplains: Impacts of hydropower development, climate change and sea level rise. Glob. Planet. Chang. 2015, 127, 22–33. [Google Scholar] [CrossRef] [Green Version]
  14. Tian, S.M.; Xu, M.Z.; Jiang, E.H.; Wang, G.H.; Hu, H.C.; Liu, X. Temporal variations of runoff and sediment load in the upper Yellow River, China. J. Hydrol. 2019, 568, 46–56. [Google Scholar] [CrossRef]
  15. Chen, Y.; Wang, Y.G. Variations in Basin Sediment Yield and Channel Sediment Transport in the Upper Yangtze River and Influencing Factors. J. Hydrol. Eng. 2019, 24, 05019016. [Google Scholar] [CrossRef]
  16. Liu, Z.F.; Tian, L.D.; Yao, T.D.; Gong, T.L.; Yin, C.L.; Yu, W.S. Temporal and spatial variations of δ18O in precipitation of the Yarlung Zangbo River Basin. J. Geogr. Sci. 2007, 17, 317–326. [Google Scholar] [CrossRef]
  17. Shi, Y.; Gao, X.J.; Zhang, D.F.; Giorgi, F. Climate change over the Yarlung Tsangpo–Brahmaputra River Basin in the 21st century as simulated by a highresolution regional climate model. Quat. Int. 2011, 244, 159–168. [Google Scholar] [CrossRef]
  18. Han, X.M.; Zuo, D.P.; Xu, Z.X.; Cai, S.Y.; Gao, X.X. Analysis of vegetation condition and its relationship with meteorological variables in the Yarlung Zangbo River Basin of China. Proc. IAHS 2018, 379, 105–112. [Google Scholar] [CrossRef] [Green Version]
  19. Li, D.; Li, J.; Zhang, L.L.; Deng, Y.; Zhang, Y.W. Variations in the Key Hydrological Elements of the Yarlung Zangbo River Basin. Water Sci. and Tech.: W. Sup 2018, 19, 1088–1096. [Google Scholar] [CrossRef] [Green Version]
  20. Wang, L.; Zhang, F.; Fu, S.H.; Shi, X.N.; Chen, Y.; Jagirani, M.D.; Zeng, C. Assessment of soil erosion risk and its response to climate change in the mid-Yarlung Tsangpo River region. Environ. Sci. Pollut. Res. 2019, 26, 1–15. [Google Scholar] [CrossRef]
  21. Cuo, L.; Li, N.; Liu, Z.; Ding, J.; Liang, L.Q.; Zhang, Y.X.; Gong, T.L. Warming and human activities induced changes in the Yarlung Tsangpo basin of the Tibetan plateau and their influences on streamflow. J. Hydrol. Reg. Stud. 2019, 25, 100625. [Google Scholar] [CrossRef]
  22. Liu, X.; Xu, Z.; Liu, W.; Liu, L. Responses of hydrological processes to climate change in the Yarlung Zangbo River basin. Hydrol. Sci. J. 2019, 64, 2057–2067. [Google Scholar] [CrossRef]
  23. Xu, R.; Hu, H.C.; Tian, F.Q.; Li, C.; Khan, M.Y.A. Projected climate change impacts on future streamflow of the Yarlung Tsangpo-Brahmaputra River. Glob. Planet. Chang. 2019, 175, 144–159. [Google Scholar] [CrossRef] [Green Version]
  24. Grill, G.; Lehner, B.; Thieme, M.; Geenen, B.; Tickner, D.; Antonelli, F.; Babu, S.; Borrelli, P.; Cheng, L.; Crochetiere, H.; et al. Mapping the world’s free-flowing rivers. Nature 2019, 569, 215–221. [Google Scholar] [CrossRef] [PubMed]
  25. Wang, P.F.; Wang, X.; Wang, C.; Miao, L.Z.; Hou, J.; Yuan, Q.S. Shift in bacterioplankton diversity and structure: Influence of anthropogenic disturbances along the Yarlung Tsangpo River on the Tibetan Plateau, China. Sci. Rep. UK 2017, 7, 12529. [Google Scholar] [CrossRef] [PubMed]
  26. Li, F.P.; Xu, Z.X.; Feng, Y.C.; Liu, M.; Liu, W.F. Changes of land cover in the Yarlung Tsangpo River basin from 1985 to 2005. Environ. Earth Sci. 2013, 68, 181–188. [Google Scholar] [CrossRef]
  27. Harris, R.B. Rangeland degradation on the Qinghai-Tibetan plateau: A review of the evidence of its magnitude and causes. J. Arid Environ. 2010, 74, 1–12. [Google Scholar] [CrossRef]
  28. Cui, X.F.; Graf, H.F. Recent land cover changes on the Tibetan Plateau: A review. Clim. Chang. 2009, 94, 47–61. [Google Scholar] [CrossRef] [Green Version]
  29. Peng, F.; Xue, X.; You, U.G.; Huang, C.H.; Dong, S.Y.; Liao, J.; Duan, H.C.; Tsunekawa, A.; Wang, T. Changes of soil properties regulate the soil organic carbon loss with grassland degradation on the Qinghai-Tibetan Plateau. Ecol. Indic. 2018, 93, 572–580. [Google Scholar] [CrossRef]
  30. Shen, W.S.; Li, H.D.; Sun, M.; Jiang, J. Dynamics of aeolian sandy land in the Yarlung Zangbo River basin of Tibet, China from 1975 to 2008. Glob. Planet. Chang. 2012, 86–87, 37–44. [Google Scholar] [CrossRef]
  31. Wen, A.B.; Liu, S.Z.; Fan, J.R.; Zhu, Y.P. Current changes on sedimentation and control its method in middle Yalungtsangpo River. J. Soil Water Conserv. 2002, 16, 148–150. (In Chinese) [Google Scholar] [CrossRef]
  32. Lin, X.D.; Zhang, Y.L.; Yao, Z.J.; Gong, T.L.; Wang, H.; Chu, D.; Liu, L.S.; Zhang, F. The trend on runoff variations in the Lhasa River Basin. J. Geogr. Sci. 2008, 18, 95–106. [Google Scholar] [CrossRef]
  33. Luo, H.; Wu, J.P.; Bianba, D.J.; Gama, Q.Z.; Zhu, X.L. Characterization of Soil Nutrient Status of Areas to be Afforested in Tibet, China. Acta Pedol. Sin. 2017, 54, 421–433. (In Chinese) [Google Scholar] [CrossRef]
  34. Luo, H. The Impacts of Afforestation on Changes of Soil Organic Carbon and Major Nutrients in the Mid-Watershed of “One River and Two Tributaries” in Tibet. Ph.D. Thesis, Chinese Academy of Forestry Sciences, Beijing, China, 2018. Available online: http://cdmd.cnki.com.cn/Article/CDMD-82201-1018253315.htm (accessed on 1 April 2018). (In Chinese).
  35. Shi, X.N.; Zhang, F.; Lu, X.X.; Wang, Z.Y.; Gong, T.L.; Wang, G.X.; Zhang, H.B. Spatiotemporal variations of suspended sediment transport in the upstream and midstream of the Yarlung Tsangpo River (the upper Brahmaputra), China. Earth Surf. Proc. Landf. 2018, 43, 432–443. [Google Scholar] [CrossRef]
  36. Horowitz, A.J. Monitoring suspended sediments and associated chemical constituents in urban environments: Lessons from the city of Atlanta, Georgia, USA Water Quality Monitoring Program. J. Soils Sediments 2009, 9, 342–363. [Google Scholar] [CrossRef]
  37. Taylor, K.G.; Owens, P.N. Sediments in urban river basins: A review of sediment-contaminant dynamics in an environmental system conditioned by human activities. J. Soils Sediments 2009, 9, 281–303. [Google Scholar] [CrossRef]
  38. Vercruysse, K.; Grabowski, R.C.; Rickson, R.J. Suspended sediment transport dynamics in rivers: Multi-scale drivers of temporal variation. Earth-Sci. Rev. 2017, 166, 38–52. [Google Scholar] [CrossRef] [Green Version]
  39. Wohl, E. Legacy effects on sediments in river corridors. Earth Sci. Rev. 2015, 147, 30–53. [Google Scholar] [CrossRef]
  40. Wang, Z.Y.; Yu, G.A.; Wang, X.Z.; Melching, C.S.; Liu, L. Sediment storage and morphology of the Yalu Tsangpo valley due to uneven uplift of the Himalaya. Sci. China Earth Sci. 2015, 58, 1440–1445. [Google Scholar] [CrossRef]
  41. Sha, Y.K.; Li, W.P.; Fan, J.H.; Cheng, G.W. Determining critical support discharge of a riverhead and river network analysis: Case studies of Lhasa River and Nyangqu River. Chin. Geogr. Sci. 2016, 26, 456–465. [Google Scholar] [CrossRef] [Green Version]
  42. Bai, W.Q.; Shang, E.P.; Zhang, Y.L. Assessment and origin Analysis on wetland vulnerability in Lhasa River basin of Tibet Autonomous Region. Wetland Sci. 2014, 12, 7–14. (In Chinese) [Google Scholar] [CrossRef]
  43. Wu, X.Y.; Li, Z.W.; Gao, P.; Huang, C.; Hu, T.S. Response of the Downstream Braided Channel to Zhikong Reservoir on Lhasa River. Water 2018, 10, 1144. [Google Scholar] [CrossRef] [Green Version]
  44. Luozhu, N.; Wang, J.Q.; Xu, X.Y. Analysis of Runoff Variation Characteristics and Trends in the Yarlung Zangbo River Basin. J. China Hydrol. 2011, 31, 76–79. (In Chinese) [Google Scholar] [CrossRef]
  45. Zhang, L.L.; Su, F.G.; Yang, D.P.; Hao, Z.H.; Tong, K. Discharge regime and simulation for the upstream of major rivers over Tibetan Plateau. J. Geophys. Res. Atmos. 2013, 118, 8500–8518. [Google Scholar] [CrossRef]
  46. Gay, A.; Cerdan, O.; Delmas, M.; Desmet, M. Variability of suspended sediment yields within the Loire river basin (France). J. Hydrol. 2014, 519, 1225–1237. [Google Scholar] [CrossRef]
  47. Asselman, N.E.M. Fitting and interpretation of sediment rating curves. J. Hydrol. 2000, 234, 228–248. [Google Scholar] [CrossRef]
  48. Müller, G.; Fӧrstner, U. General Relationship between Suspended Sediment Concentration and Water Discharge in the Alpenrhein and some other Rivers. Nature 1968, 217, 244–245. [Google Scholar] [CrossRef]
  49. Fan, X.L.; Shi, C.X.; Zhou, Y.Y.; Shao, W.W. Sediment rating curves in the Ningxia-Inner Mongolia reaches of the upper Yellow River and their implications. Quat. Int. 2012, 282, 152–162. [Google Scholar] [CrossRef]
  50. De Girolamo, A.M.; Pappagallo, G.; Lo Porto, A. Temporal variability of suspended sediment transport and rating curves in a Mediterranean river basin: The Celone (SE Italy). Catena 2015, 128, 135–143. [Google Scholar] [CrossRef]
  51. Nistor, C.J.; Church, M. Suspended sediment transport regime in a debris-flow gully on Vancouver Island, British Columbia. Hydrol. Process. 2005, 19, 861–885. [Google Scholar] [CrossRef]
  52. Sun, L.Y.; Yan, M.; Cai, Q.G.; Fang, H.Y. Suspended sediment dynamics at different time scales in the Loushui River, south-central China. Catena 2016, 136, 152–161. [Google Scholar] [CrossRef]
  53. Blöthe, J.; Hillebrand, G.; Hoffmann, T. Sediment rating and annual cycles of suspended sediment in German upland rivers. E3S Web Conf. 2018, 40, 04020. [Google Scholar] [CrossRef]
  54. van Rijn, L.C. Sediment transport, Part II: Suspended load transport. J. Hydraul. Eng. 1989, 110, 1613–1641. [Google Scholar] [CrossRef]
  55. Wu, C.; Huang, G.F.; Zhang, T.; Tan, S.Y.; Zhang, J.Q.; Lu, H. Study on sedimentary calamity of Najin hydroelectric station in Tibet. J. Hydrodyn. Ser. A 2000, 15, 505–560. (In Chinese) [Google Scholar] [CrossRef]
  56. Zhang, L.; He, Z.W.; Chen, X.J.; Li, X.Q. Dynamic changes of soil erosion in the middle reaches of Yarlung Tsangpo River. Geospat. Inf. 2011, 9, 51–54. (In Chinese) [Google Scholar]
  57. Wang, Z.Q.; Zhang, Y.Z.; Yang, Y.; Zhou, W.; Gang, C.C.; Zhang, Y.; Li, J.L.; An, R.; Wang, K.; Inakwu, O.; et al. Quantitative assess the driving forces on the grassland degradation in the Qinghai–Tibetan Plateau, in China. Ecol. Inform. 2016, 33, 32–44. [Google Scholar] [CrossRef]
  58. Li, J.W.; Tang, X.Y. Study on Sand Liquefaction in the Site of Zhanang Bridge. Subgrade Eng. 2013, 5, 39–43. (In Chinese) [Google Scholar] [CrossRef]
  59. Chen, J.H. Research on Highway Planning in Lhasa. Master’s Thesis, Tianjin University, Tianjin, China, 2009. (In Chinese). [Google Scholar] [CrossRef]
Figure 1. Map of the study area and hydrological station locations; (a). the location of the Yarlung Tsangpo River basin against the Asia; (b). the location of the Nugesha–Yangcun (N–Y) catchment and the main tributaries of the Yarlung Tsangpo River; (c). the streams network in the N–Y catchment.
Water 12 00952 g001
Figure 2. SSC and flow discharge at the Lhasa Station.
Water 12 00952 g002
Figure 3. Monthly precipitation, discharge and sediment loads at the Nugesha and Yangcun Stations in the periods of 2007–2009 and 2014–2017; panels (a,b) show the monthly precipitation at Nugesha and Yangcun Stations, respectively; panels (c,d) show the monthly discharge and sediment load at Nugesha and Yangcun Stations, respectively.
Water 12 00952 g003
Figure 4. Water and sediment yields of the N–Y catchment.
Water 12 00952 g004
Figure 5. Q-SSC hysteresis at the Nugesha and Yangcun Stations.
Water 12 00952 g005
Figure 6. Average monthly discharge and sediment loads of the Lhasa Station.
Water 12 00952 g006
Figure 7. Q-SSC hysteresis in the Lhasa River.
Water 12 00952 g007
Figure 8. Contributions of the Lhasa Rive to annual discharge and sediment load.
Water 12 00952 g008
Figure 9. Sediment rating curve at the Lhasa Station.
Water 12 00952 g009
Figure 10. Q-SSC hysteresis in the mainstream in response to the inflow of the Lhasa River.
Water 12 00952 g010
Figure 11. Monthly sediment load of the Lhasa Station combined with the monthly discharge and precipitation during 2014–2017.
Water 12 00952 g011
Table 1. Basic information of the hydrological gauging stations.
StationLongitudeLatitudeAltitude
(m)
Catchment Area (104 km2)Measurement Period
YearMonth
Lhasa91°09′29°38′36502.62014–2017Jan.–Dec
Apr.–Oct
Nugesha89°45′29°18′372010.62014–2017Jan.–Dec
May–Oct.
Yangcun91°49′29°16′350015.22014–2017Jan.–Dec
Table 2. Comparison of precipitation and streamflow with previous studies.
YearsLhasaNugeshaYangcun
Precipitation 1
(mm)
Qyr (108m3/year)Precipitation (mm)Qyr (108m3/year)Precipitation (mm)Qyr (108m3/year)
2014595.398.8376.9156.5363.3348.7
2015422.746.7214.874.0246.9186.1
2016520.782.8429.2204.9441.9334.2
2017532.896.2427.4208.2412.6337.2
Mean (2014–2017)517.980.6362.1159.8366.2299.6
Mean 2 (2007–2009)506.3 378.2158.1361.4305.8
Mean 3 (Pre)515.990.8360.1162.3368.7298.9
1 The values are from the China Meteorological Data Center (http://data.cma.cn). 2 The mean values of the yearly cumulative discharge (Qyr) at the Nugesha Station and Yangcun Station are from Shi et al. [35]. 3 The mean values of Qyr at the Lhasa Station are from Lin et al. [32], and the mean values of Qyr at the Nugesha and Yangcun Stations are from Luozhu et al. [44].
Table 3. Sediment rating curves with different formulas 1.
Fitting Parameters or Correlation Coefficient 2 S S C   =   α Q β S S C   =   a Q b + c S S C   =   a Q 3 + b Q 2 + c Q + d log ( S S C ) = a ( log ( Q ) ) 2 + b log ( Q ) + c
α2.24 × 10⁴
β0.87
a 2.55 × 10−67.47 × 10−110.50
b 1.55−1.60 × 10⁻⁷−1.56
c 1.50× 1022.12 × 104−0.83
d 6.87× 10³
R20.570.670.690.61
1 Q is the discharge and SSC is the suspended sediment concentration. 2 α and β are fitting parameters of Equation (5) and are explained in the text, while a, b, c and d, are fitting parameters of other formulas with no detailed explanations. R2 is the correlation coefficient of the fitting formulas.
Table 4. Fitting parameters of the sediment rating curve.
StationPower Curve
S S C   =   α Q β
Log-Transformed Data Fitted with Quadratic Polynomials
log ( S S C )   =   a ( log ( Q ) ) 2 + b log ( Q ) + c
α1βR2abcR2
Nugesha (2014–2017)2.34 × 1041.060.640.170.13−2.390.64
Yangcun(2014–2017)1.01 × 1041.050.660.96−4.624.240.72
Nugesha (2007–2009)4 × 1041.010.54
Yangcun (2007–2009)2 × 1041.030.66
1 The values in 2007–2009 are from the previous observations in 2007–2009 [35].
Table 5. Fitting of the sediment rating curves at the Nugesha and Yangcun Stations.
YearNugeshaYangcun
αβR2αβR2
20143.9 × 1041.000.601.0 × 1051.170.77
20158.1 × 10−51.230.374.5 × 1040.810.34
20161.3 × 1041.130.675.1 × 1040.860.68
20174.2 × 1040.980.596.7 × 10−51.090.77
Pre 14 × 1041.010.542 × 1041.030.66
1 The values are from the previous observation in 2007–2009 [35].
Table 6. Land-use changes in the N–Y sub-catchment in 2010 and 2018.
YeasCroplandForestlandGrasslandWater BodiesUrban AreaBarren or Sparsely Vegetated Land
20102.4%3.8%71.4%2.9%0.2%19.3%
20183.4%10.4%59.6%3.6%0.2%22.7%

