Article

Differences in Biomass Production and Water Use Efficiency among Seven Different Cover Crops in the Wet Winter Seasons of 2016/17 and 2018 in South Carolina

by
Ricardo St Aime
1,
Geoffrey W. Zehnder
1,
Christopher Talley
2 and
Sruthi Narayanan
1,*
1
Department of Plant and Environmental Sciences, Clemson University, Clemson, SC 29634, USA
2
Clemson University Cooperative Extension, Anderson, SC 29624, USA
*
Author to whom correspondence should be addressed.
Agronomy 2020, 10(4), 463; https://doi.org/10.3390/agronomy10040463
Submission received: 12 February 2020 / Revised: 20 March 2020 / Accepted: 24 March 2020 / Published: 26 March 2020
(This article belongs to the Section Farming Sustainability)

Abstract

:
Cover crops can protect soil health and increase climate resilience of crop production systems. Agronomic crop producers in the southern USA often demand information on the best cover crops for their locality and cropping system and on the potential impacts of cover crops on stored soil water. The present research evaluated biomass production and water use efficiency (WUE) of single species and multispecies winter cover crops in South Carolina. Overall, a five-species mixture of Austrian winter pea, rye, crimson clover, hairy vetch, and oats and a single species of rye had the greatest biomass production (4600–6480 kg ha−1) at the end of the season (19 April 2017 in season-1 and 10 May 2018 in season-2). The five-species mixture also had the greatest WUE (2184–2232 g m−3). None of the cover crops depleted soil water (in 60 cm depth) greater than a weed-free fallow maintained through herbicide application and a weedy fallow (no herbicide application). Since both the seasons, in which the present study was conducted, received greater than normal rainfall, further studies should verify the applicability of the results in dry years.

1. Introduction

Most agricultural soils in the southern USA have low soil organic matter and limited water and nutrient holding capacity [1,2]. Excessive tillage, inadequate crop rotations, crop residue removal, overgrazing, and increasingly extreme weather events have further degraded soil health in this region [3,4]. Cover crops, if chosen properly, can enhance soil health, improve soil water holding capacity [5,6,7,8], reduce the need for herbicides or cultivation for weed control [4,9,10,11], and increase the resilience of production systems to extreme weather [12,13]. Annual nationwide surveys conducted by the Sustainable Agriculture Research and Education (SARE) report increasing farmer interest in cover cropping [14]. Cover crop adoption percentage is higher in the southern USA than in other parts of the country primarily due to favorable environmental conditions [15]. The long cropping season in the southern USA is particularly conducive for winter cover crops to be rotated with warm season cash crops. Agronomic crop producers in this region often demand information regarding (a) the most suitable cover crops for their locality and cropping system, (b) labor and cost associated with planting and managing cover crops, and (c) potential impacts of cover crops on soil water, soil nutrients, and cash crop productivity [16].
Even though the specific reasons for growing cover crops vary among locations, cover crops will be beneficial to the agroecosystems mostly if they produce sufficient biomass. Reberg-Horton et al. [4] evaluated the productivity of cereal and legume cover crops in the Southeast from 2008 to 2010 and found that this region is capable of producing >9000 kg ha−1 of cover crop biomass. Several studies in the country have evaluated cover crops as a single species or mixtures for biomass production [4,10,17,18,19,20,21,22,23,24,25,26,27,28,29,30]. For example, Dunavin [19] reported that a mixture of turnip–Chinese cabbage hybrid (Brassica campestris var. rapa L. × Brassica pekinensis (Lour.) Rupr.), ryegrass (Lolium multiflorum Lam.) and crimson clover (Trifolium incarnatum L.); a mixture of rape (Brassica napus L.), ryegrass, and crimson clover; a mixture of rye, ryegrass, and crimson clover; and a mixture of ryegrass and crimson clover produced more dry matter than any of the species grown as monocultures, except ryegrass in Florida. Contrasting findings have also been reported. For example, Nielsen et al. [28] found that a single species of flax (Linum usitatissimum L.), oat (Avena sativa L.), pea (Pisum sativum subsp. arvense L. Poir.), and rapeseed (Brassica napus L.) produced more biomass than a ten-species mixture containing all those four species in Colorado and Nebraska. Available literature indicates that any advantage of increased biomass production by cover crop mixtures compared to monocultures depends upon many factors such as location, species, soil type, and soil nutrient and water conditions.
Most agronomic crop producers in the southern USA (those who do not practice double cropping) use a fallow period in fall-spring. Keeping land in fallow may increase runoff and soil erosion and deteriorate soil health by adversely affecting soil organic matter content and microbial activity [31,32,33,34]. However, this practice is often perceived as a water storage strategy for the subsequent crop simply because there are no plants to take up water. The amount of soil water stored during fallow depends on many factors, including the amount of residue on the soil surface, soil type, precipitation patterns, and weed growth [35]. A recent study conducted on summer cover crops in the Great Plains region of the USA found that soil under fallow lost up to 7.9 cm less water than under cover crops during the cover crop growth period, but captured up to 3.4 cm less water in the following spring due to lack of residues on the soil surface [36]. Cover crop studies in Tennessee [7] and Nebraska [37] found that cover crop mixtures increased plant-available water for subsequent crops compared to fallow. Earlier studies in coastal South Carolina found that available soil water at 0–60 cm and 0–37 cm was lower for corn (Zea mays L.) and soybean (Glycine max (L.) Merr.), respectively, when the crop was planted after a rye cover crop rather than after fallow [38,39]. Similarly, Ewing et al. [40] found that crimson clover depleted soil water at 0–60 cm up to 55% compared to fallow treatments, before corn planting in coastal North Carolina. In contrast, a recent study in coastal South Carolina found that a rye (Secale cereale L.) cover crop enhanced plant-available water, rooting depth, and yield in cotton (Gossypium hirsutum L.) [41]. No studies have tested the effect of cover crops on stored soil water in the upstate of South Carolina, which has a very different soil type (significantly higher clay content) compared to the southern coastal plain (primarily sandy soils).
The objective of this study was to evaluate seven cover crops (single species or mixtures) for biomass production, stored soil water, and water use efficiency (WUE). The cover crops evaluated in this study were winter cover crops that are commonly available in the southern USA.

2. Materials and Methods

Field trials were conducted during the 2016–2017 fall-winter (season-1) and 2018 winter (season-2) seasons at the Milam farm in Sandy Springs, SC (34.601593° N, −82.743515° W, 240 m above sea level). The soil series at the study site is Madison sandy loam (fine, kaolinitic, thermic typic Kanhapludults). Soybean was grown on the study site in both 2014 and 2015 summer seasons. No crop was grown on the study site in the 2016 summer season. Land preparation in season-1 included a deep-tillage with a subsoiler (Model # VTJ677, Lubbock manufacturing company, Lubbock, TX, USA) 17 days before cover crop planting and harrowing with a 10-feet wide Taylor-Way disk harrow (Model # 351, Taylor Pittsburgh Manufacturing INC., Athens, TN, USA) 14 days before cover crop planting. No tillage operations were conducted before cover crop planting in season-2. As a pre-planting operation, the study site was sprayed with a broadleaf herbicide, 2,4-D (2,4-dichlorophenoxyacetic acid) at 1.17 L ha−1 and a broad-spectrum herbicide, glyphosate (N-(phosphonomethyl) glycine) at 2.34 L ha−1. Soil tests were conducted before planting in each season. For this purpose, soil samples were collected on 27 September 2016 in season-1 (42 days before planting) and 26 January 2018 in season-2 (right before planting). In season-1, soil samples were collected from 20 different locations in the study site and mixed to get a composite sample. In season-2, soil samples were collected from each plot and analyzed separately. Soil tests were conducted at the Clemson University Agricultural Service Laboratory, Clemson, SC, USA. Based on the soil test results (Table 1), the study site was not deficient in any nutrients in 2016, but was deficient in phosphorus in 2018. However, phosphorous was not supplemented in 2018 because we wanted to grow cover crops under no-fertilizer conditions, which is the widespread practice that farmers follow in our region.
Seven cover crop treatments, including grasses, legumes, and brassicas, as a single species or in mixtures (Table 2) were tested in the present study. Cover crops were planted using a Tye brand no-till drill seeder (Model 104-4474, The Tye Company Lockney, TX, USA). Planting was done on 8 November 2016 in season-1 and 26 January 2018 in season-2. Planting was delayed in season-2 due to the unavailability of the planting machinery and freezing temperatures. All cover crop species tested in this study are under current use in South Carolina and/or southern USA. The two-species mixtures were combinations of the functional groups, grass and brassica (oat and radish), legume and brassica (crimson clover and turnip), and legume and grass (crimson clover and rye). The mixture of five-a (a combination of legumes and grasses) was a five-species mixture marketed by Adams-Briscoe Seed Company, Jackson, GA, USA, a popular seed vendor in the southern USA. The mixture of five-b (a combination of brassicas, grasses, and a legume) was a cover crop mixture identified as a ‘soil health building cover crop mix’ by the United States Department of Agriculture Natural Resources Conservation Service (USDA NRCS) [42]. Two control treatments were included in the study: fallow with herbicide application (control-1) and fallow without herbicide application (control-2). Weeds were controlled in ‘control-1′ plots, whenever necessary through the application of herbicides: 2,4-D (1.17 L ha−1) and glyphosate (2.34 L ha−1). Thus, herbicides were applied in ‘control-1′ plots at 85 and 146 days after planting (DAP) in season-1 and at 85 DAP in season-2. The experiment was laid out in a randomized complete block design (RCBD) with five replications. Individual plots were 6.1 m by 6.1 m in size. Treatments (seven cover crops and two types of fallow) were randomly assigned to plots within each of the five blocks. A 1-m alley separated the individual plots and a 2 m alley separated the blocks (reps). Single species cover crops were planted at the seeding rates provided by Clark et al. [24]. The seeding rate of individual species in the mixtures were determined following the formula by Wortman et al. [43] (i.e., seeding rate of the species when used as a monoculture divided by the number of species in the mixture). More details on seeding rates and fractional compositions of mixtures are provided in Table 2. Row spacing was 0.17 m in all cover crop plots. Cover crops were maintained under rain-fed conditions without providing any irrigation in both seasons.
Temperature and precipitation data for season-1 and season-2 were obtained from the South Carolina State Climatology Office, a division within the South Carolina Department of Natural Resources. The historic temperature and precipitation data for a period of 30 years were obtained from the National Oceanic and Atmospheric Administration (NOAA).
Aboveground cover crop biomass was measured at 83, 111, 137, and 162 DAP in season-1 and at 62, 96, and 104 DAP in season-2 (Table S1). In both seasons, biomass was hand-harvested from a randomly chosen 0.5 m2 area from each plot. One meter from the edge was avoided on each side of the plots in order to avoid any edge effects. Biomass samples were dried to constant weight at 55 °C to determine dry weight [44].
Volumetric soil water content was measured at 74, 83, 97, 111, 130, 137, and 162 DAP and 37 days after cover crop termination in season-1 and at 38, 61, 75, 95, and 104 DAP and 35 days after cover crop termination in season-2 (Table S2). Measurements were taken at five different depths (10, 20, 30, 40, and 60 cm) using a PR2 capacitance probe [45] (PR2/6, Delta-T Devices Ltd., Cambridge, UK). When taking a reading, the probe was inserted into an access tube, which are specially constructed thin-wall fiberglass tubes supplied by the manufacturer (Delta-T Devices Ltd., Cambridge, UK). An access tube was installed at the center of each plot. An E43 earth auger (Earthquake, Cumberland, WI, USA) was used to drill a hole in each plot into which the access tube was placed. The total stored soil water (m) to a depth of 60 cm in each plot was estimated using individual volumetric soil water content values at 10, 20, 30, 40, and 60 cm depths and the respective depth intervals (0.1, 0.1, 0.1, 0.1, and 0.2) with the following formula: total stored soil water (m) to a depth of 60 cm = 0.1 (sum of individual volumetric soil water contents at 10, 20, 30, and 40 cm depths) + 0.2 (volumetric soil water content at 60 cm depth) [46].
Soil water depletion (evapotranspiration) in each plot between two specific water-monitoring dates was determined as the difference between the total stored soil water (in 60 cm depth) at the two monitoring dates plus precipitation during that time interval. Precipitation data were obtained from the South Carolina State Climatology Office, a division within the South Carolina Department of Natural Resources. Runoff was assumed to be negligible, as the slopes in the plot areas were <1% and we never visually observed runoff in any plot areas after a heavy rain [28,46,47]. Cover crop WUE on any specific sampling date was estimated as the ratio between biomass produced up until that date and cumulative soil water depletion until then (biomass and cumulative soil water depletion, relative to the initial value at 83 DAP in season-1 and 62 DAP in season-2).
All cover crops were terminated by herbicide application (2,4-D at 1.17 L ha−1 and glyphosate at 2.34 L ha−1) at 230 DAP (26 June 2017) in season-1 and 131 DAP (6 June 2018) in season-2. Termination was delayed in season-1 due to unavailability of machinery for herbicide spraying and wet soil conditions. Eleven days after termination, cover crop stubbles were chopped by a rotary mower (Bush hog 3210, 3 m heavy duty cutter, Bush hog, Selma, AL, USA) in season-1. In the same season, soybean was planted 31 days after cover crop termination. No cash crop was planted after cover crop termination in season-2.

Statistical Analysis

Analysis of variance for volumetric soil water content was performed with the GLIMMIX procedure in SAS (version 9.4, SAS Institute, Cary, NC, USA). The model for the analysis of variance was based on a factorial treatment arrangement in a split-plot randomized complete block experimental design. The model included the fixed effects of the whole plot factor of treatment (seven cover crops and two controls), the split plot factor of soil depth (five different depths: 10, 20, 30, 40, and 60 cm), and the treatment-by-depth interaction. Analysis of variance for cover crop biomass, stored soil water in 60 cm depth, and cover crop WUE was performed with the GLIMMIX procedure in SAS. The model for the analysis of variance was based on a randomized complete block experimental design. The model included the fixed effect of treatment (seven cover crops and two controls). Replication (or block) was considered as a random effect in the analysis, but not included as a factor in the model statement in the GLIMMIX procedure. Normality of residuals for the biomass, volumetric soil water content, and stored soil water data was checked using the UNIVARIATE procedure in SAS. Statistically significant differences in cover crop biomass, stored soil water, and cover crop WUE were determined by the least significant differences (LSD) test. The probability threshold level (α) was 0.05.

3. Results

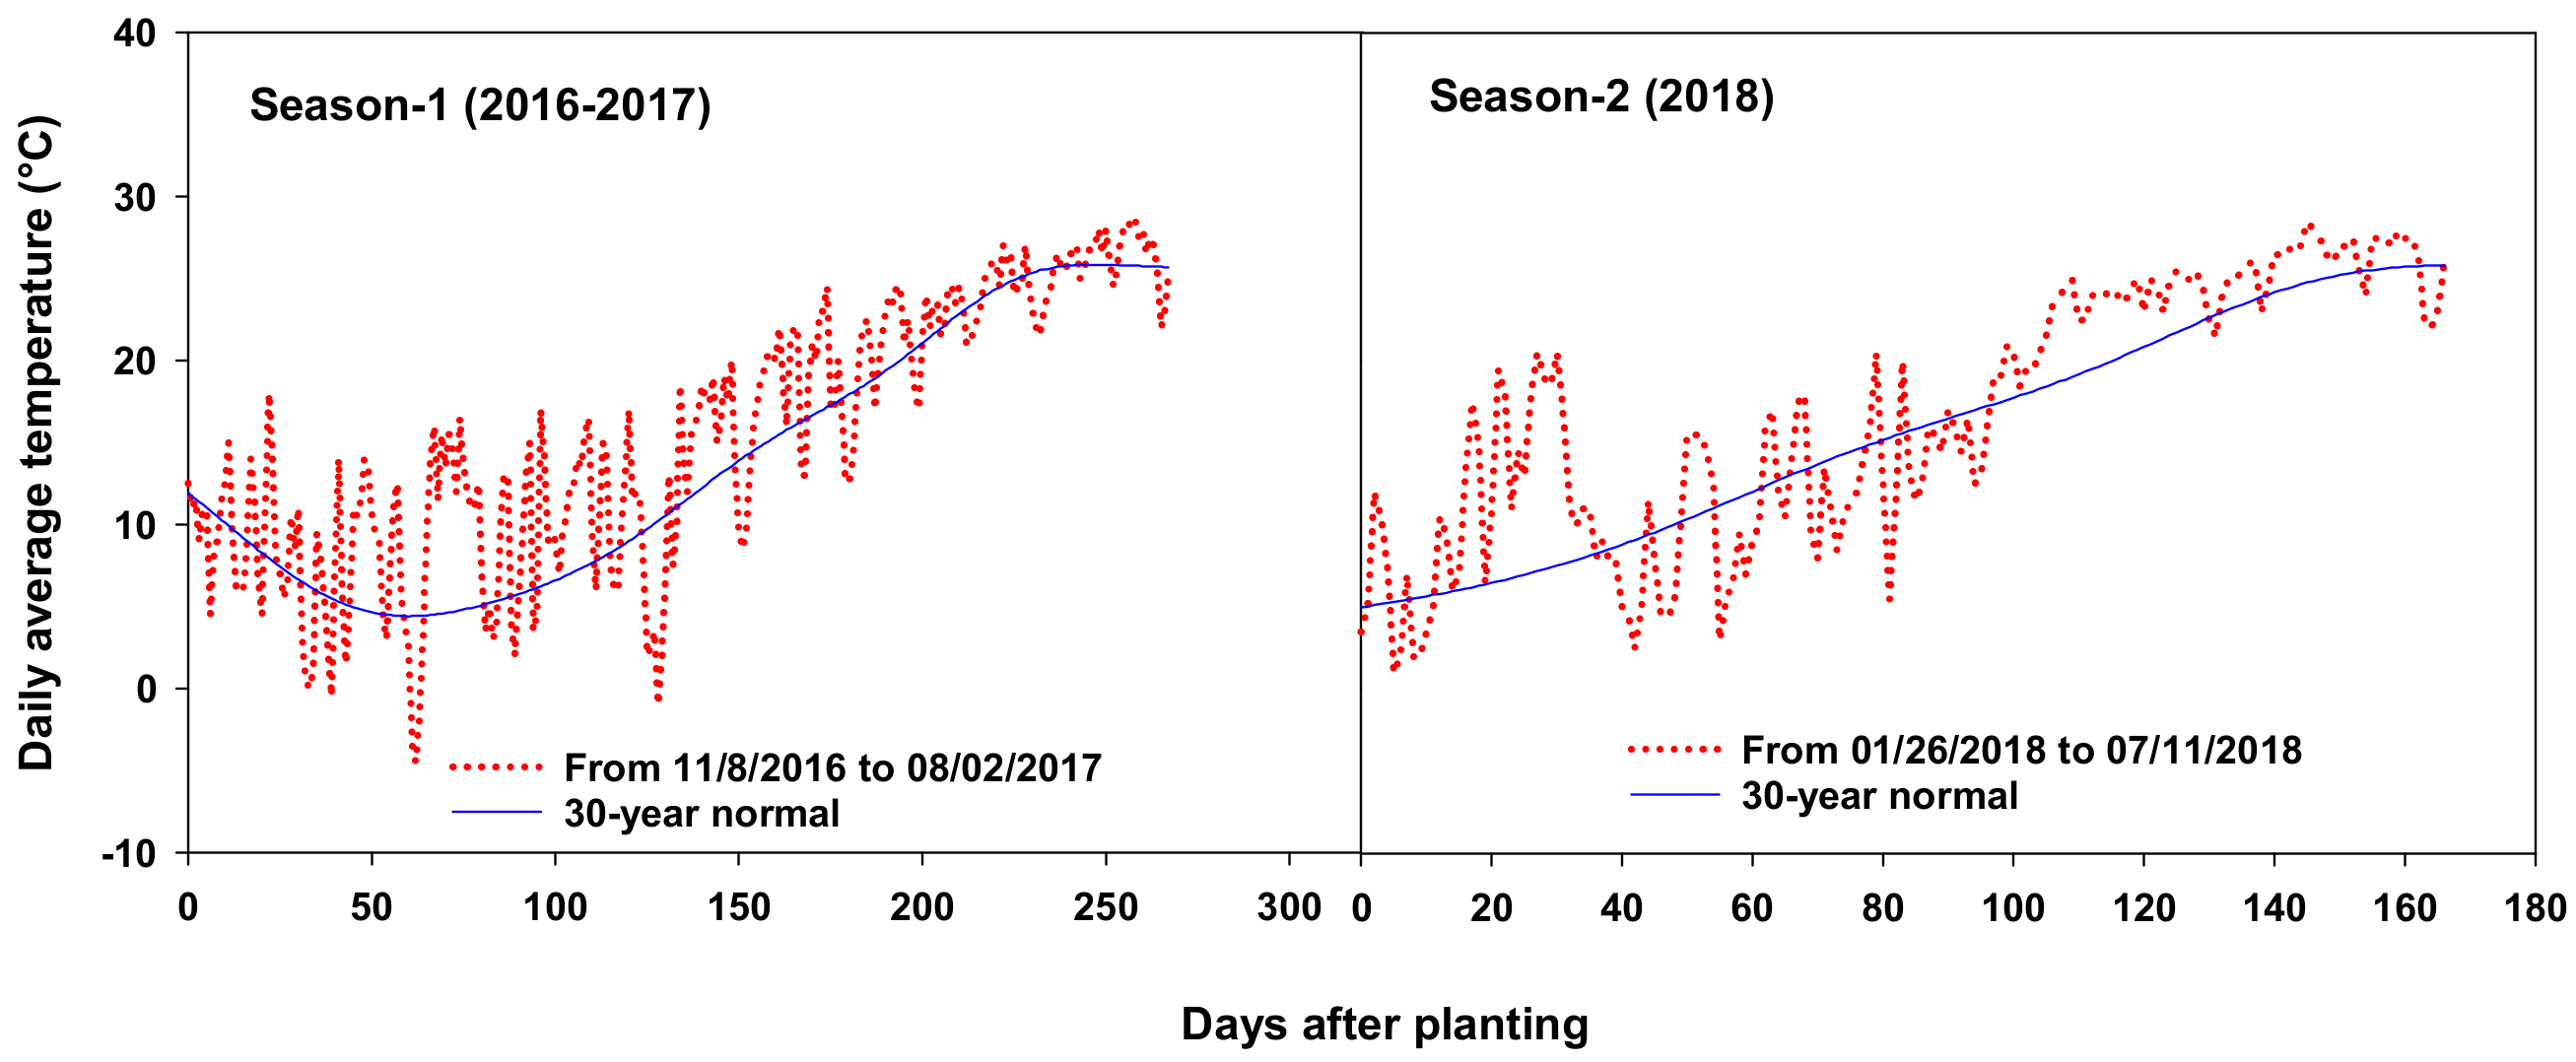
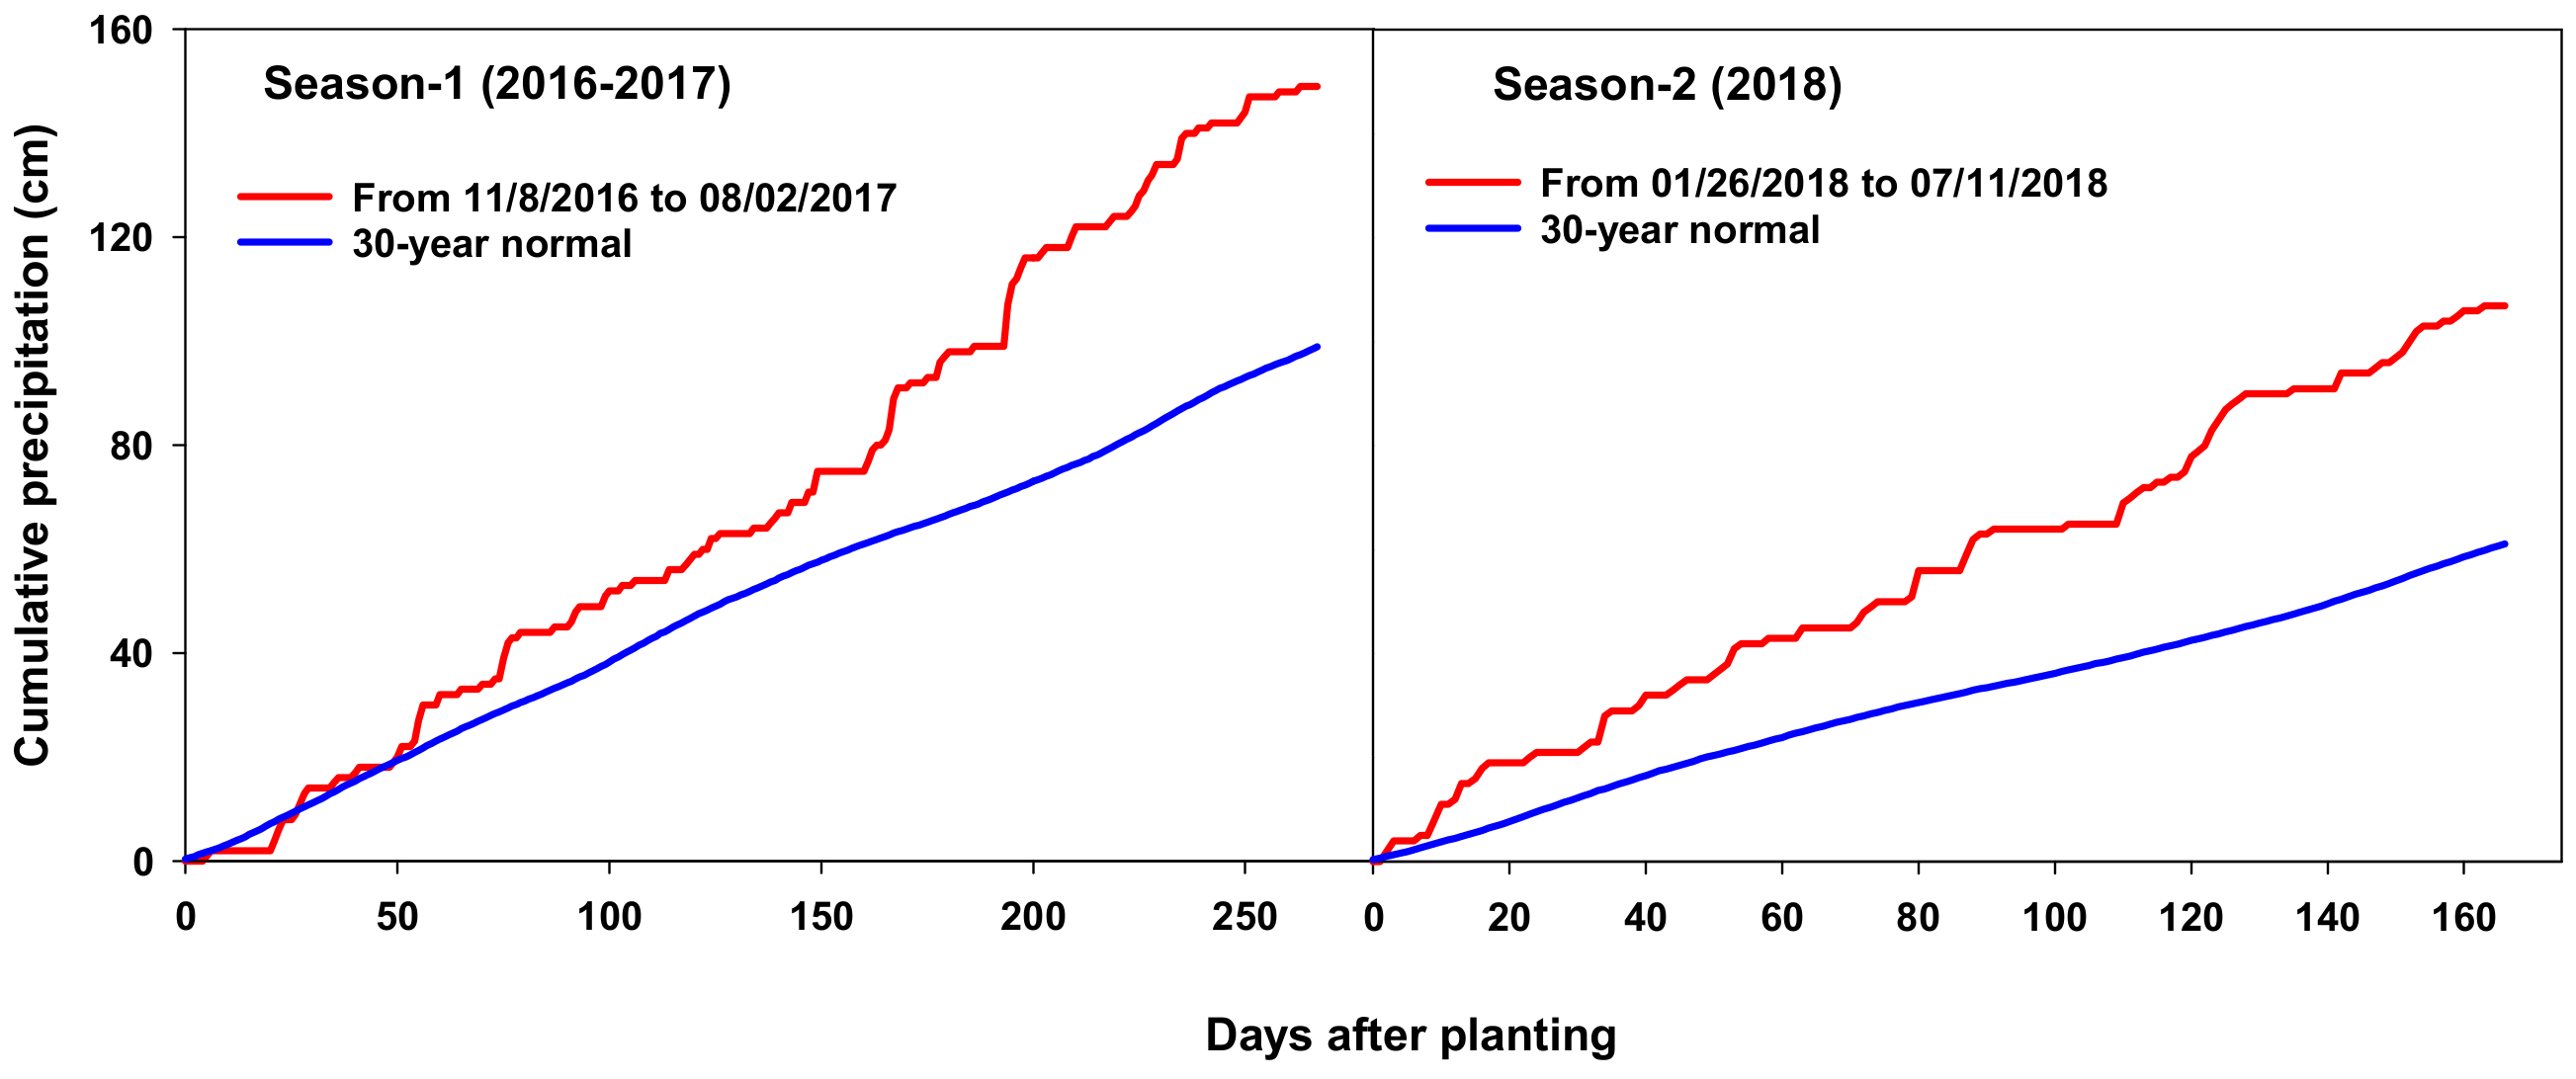
3.1. Environmental Conditions

Figure 1 and Figure 2 show air temperature and precipitation data, respectively, from planting of cover crops through the last day of volumetric soil water content measurement (2 August 2017 (267 DAP) in season-1 and 11 July 2018 (166 DAP) in season-2), in comparison with the climate normals. Daily average temperatures in season-1 and season-2 were higher than that of the 30-year normal on most days (Figure 1). Total precipitation was 149 cm during the 267-d period in season-1 and 107 cm during the 166-d period in season-2 (Figure 2). Both seasons were wetter than normal based on the 30-year historic precipitation data (Figure 2).

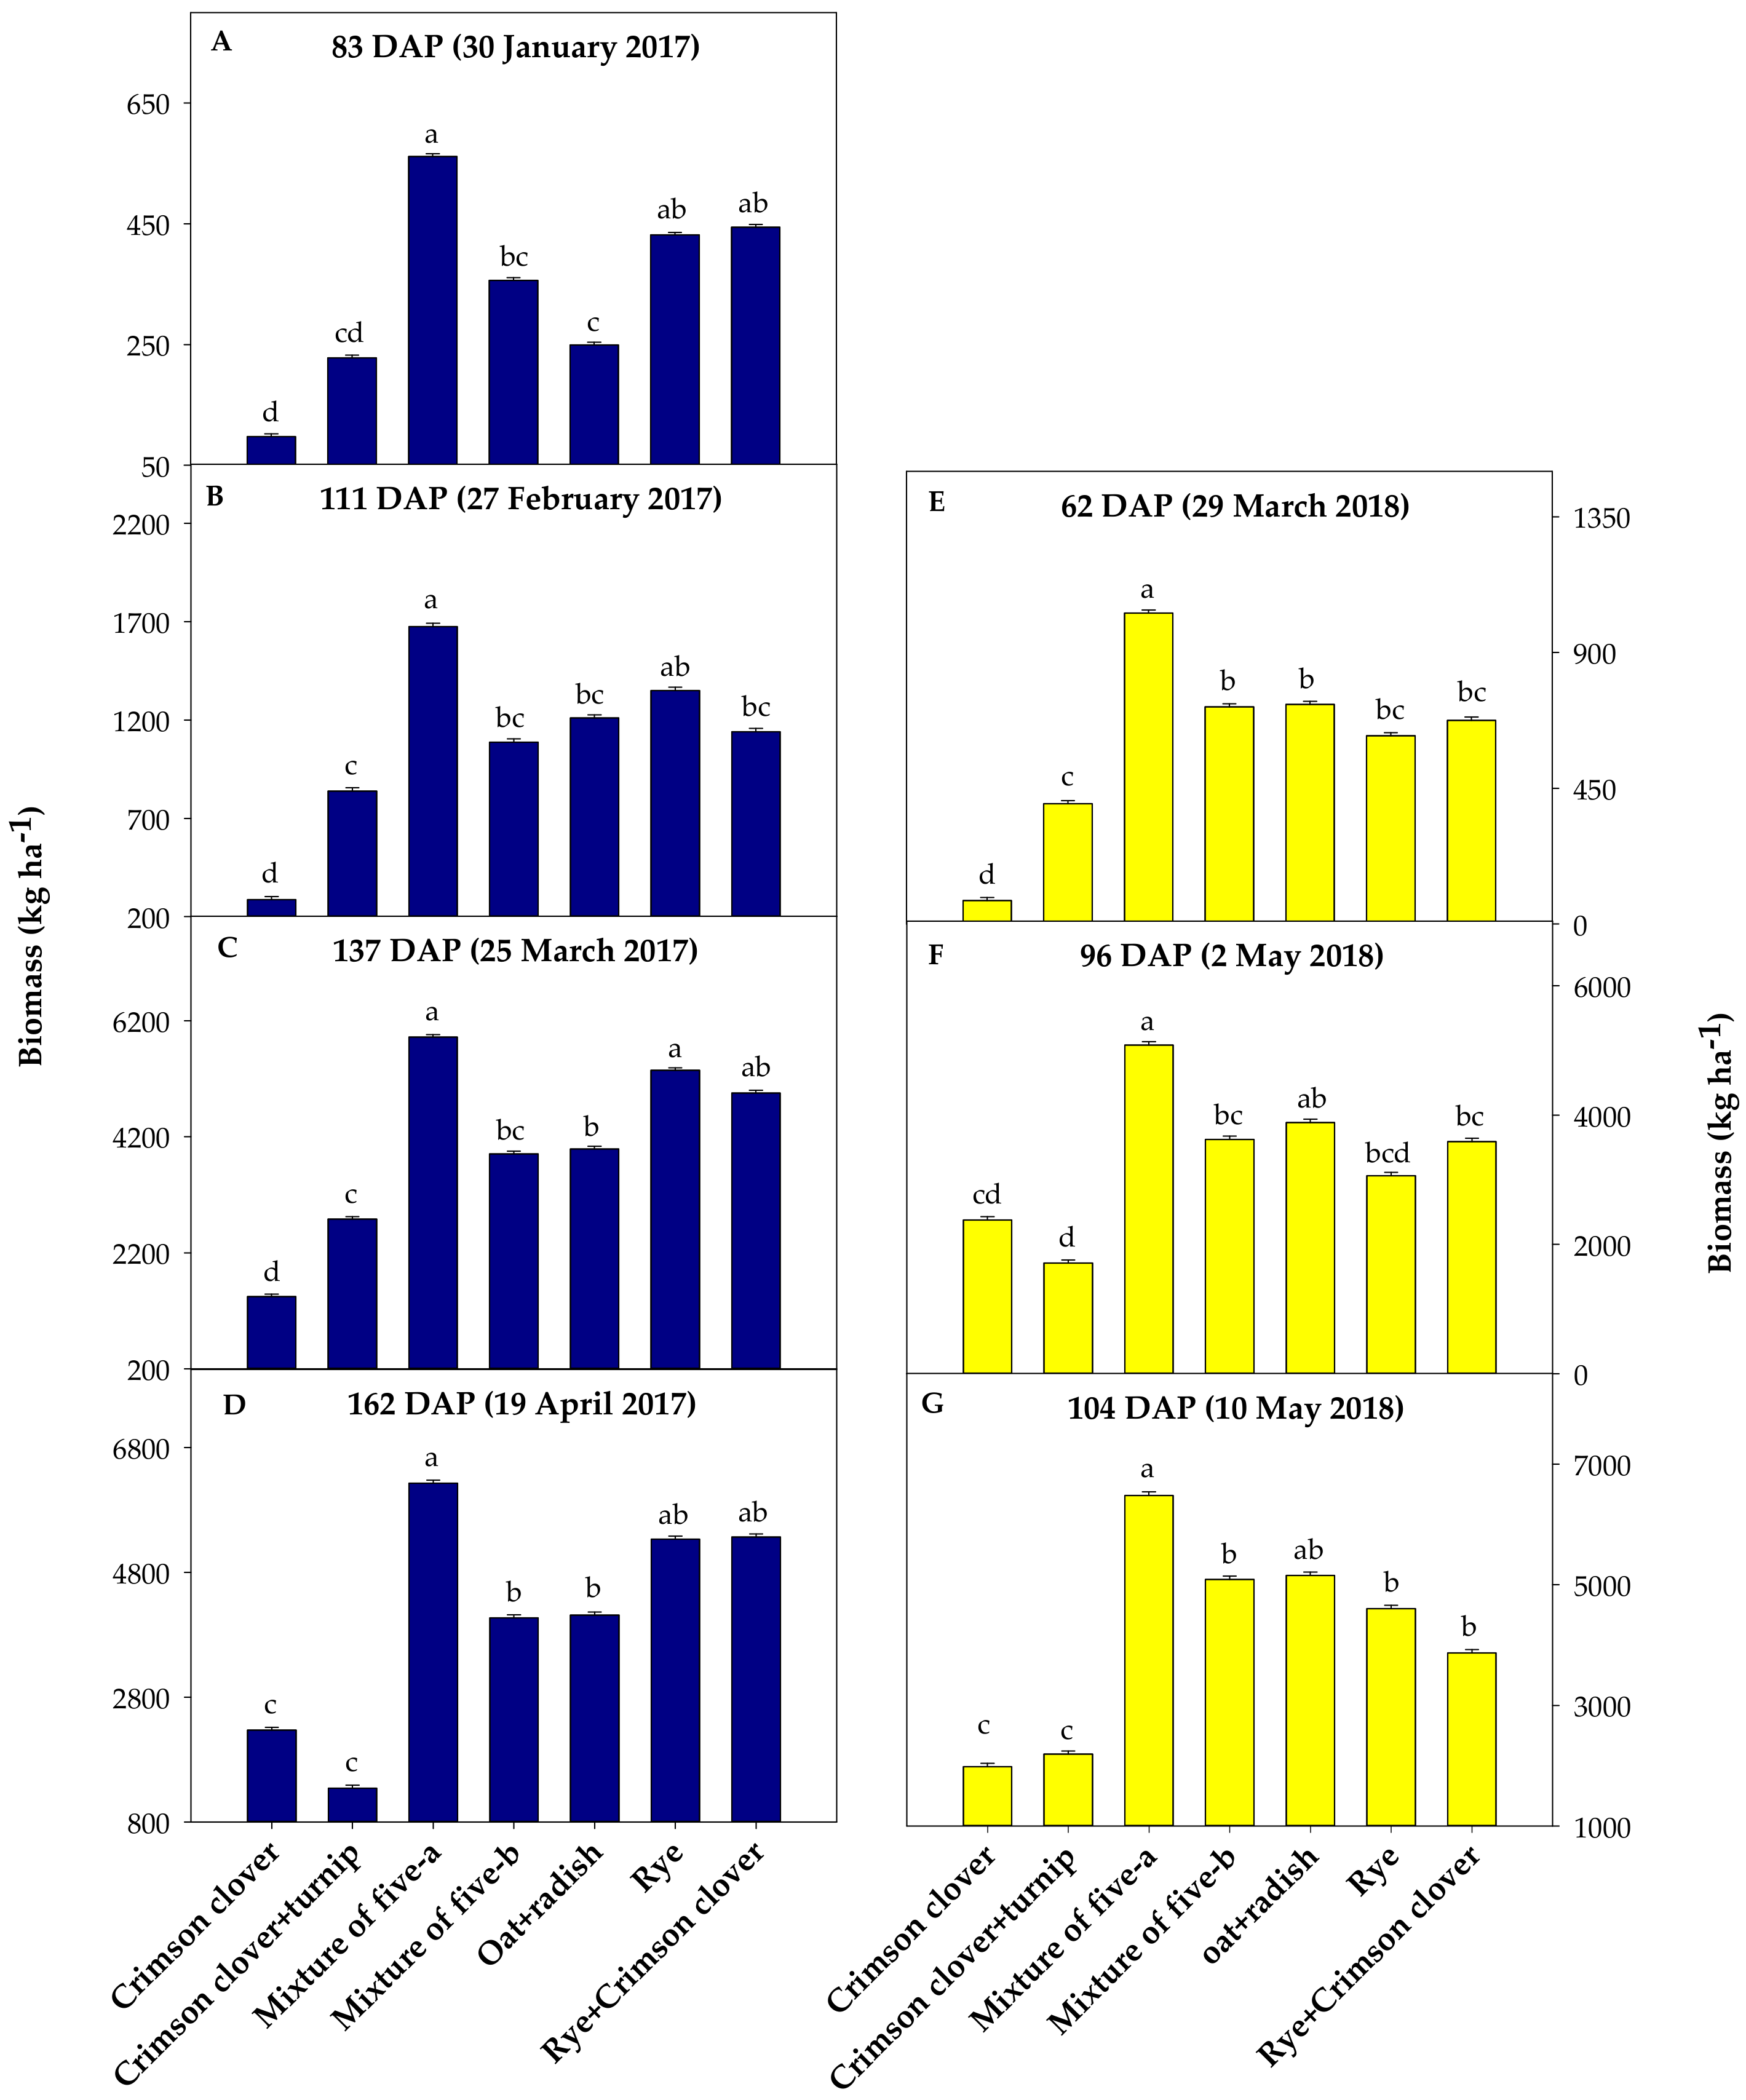
3.2. Cover Crop Growth and Biomass Production

In season-1, all cover crops were at vegetative stage until 111 DAP (27 February 2017); rye, wheat, crimson clover, radish, Austrian winter pea, and hairy vetch reached flowering stage by 137 DAP (25 March 2017); and rye reached ripening stage, oat and wheat reached flowering stage, and Austrian winter pea reached early pod stage (R3) by 162 DAP (19 April 2017). In season-2, all cover crops except radish were at vegetative stage until 95 DAP (1 May 2018); radish reached the flowering stage by 75 DAP (11 April 2018); crimson clover and hairy vetch reached the flowering stage by 104 DAP (10 May 2018); and rye, wheat, and oat reached the flowering stage and Austrian winter pea reached the early pod stage (R3) by 129 DAP (4 June 2018).
Normality of residuals for the biomass data was checked. According to the Shapiro–Wilk test, residuals were normally distributed (p > 0.05) for biomass data on all measurement dates in both seasons. Biomass production significantly varied among cover crop treatments on all measurement dates in both seasons (Table 3). The mixture of five-a produced the highest amount of biomass on all measurement dates in both seasons (Figure 3). Rye produced the same amount of biomass as the mixture of five-a on all measurement dates in season-1. The mixture of rye and crimson clover also produced the same amount of biomass as the mixture of five-a on all measurement dates in season-1, except 111 DAP. The mixture of five-b and the mixture of oat and radish generally produced intermediate amounts of biomass in both seasons. Rye and the mixture of rye and crimson clover also produced intermediate amounts of biomass in season-2. Crimson clover produced the least amount of biomass on most measurement dates in both seasons. The mixture of crimson clover and turnip was ranked as the lowest biomass producer along with the single species of crimson clover on multiple measurement dates in both seasons.
Biomass production of cover crops was generally lower in season-1 than in season-2. This might be because the study area, Sandy spring, South Carolina, was hit hard by a severe drought in 2015 and did not recover completely even during the 2016–2017 cover crop growing period (season-1). In addition, poor/no rainfall immediately after planting delayed emergence and resulted in poor stand establishment and vegetative growth in season-1.

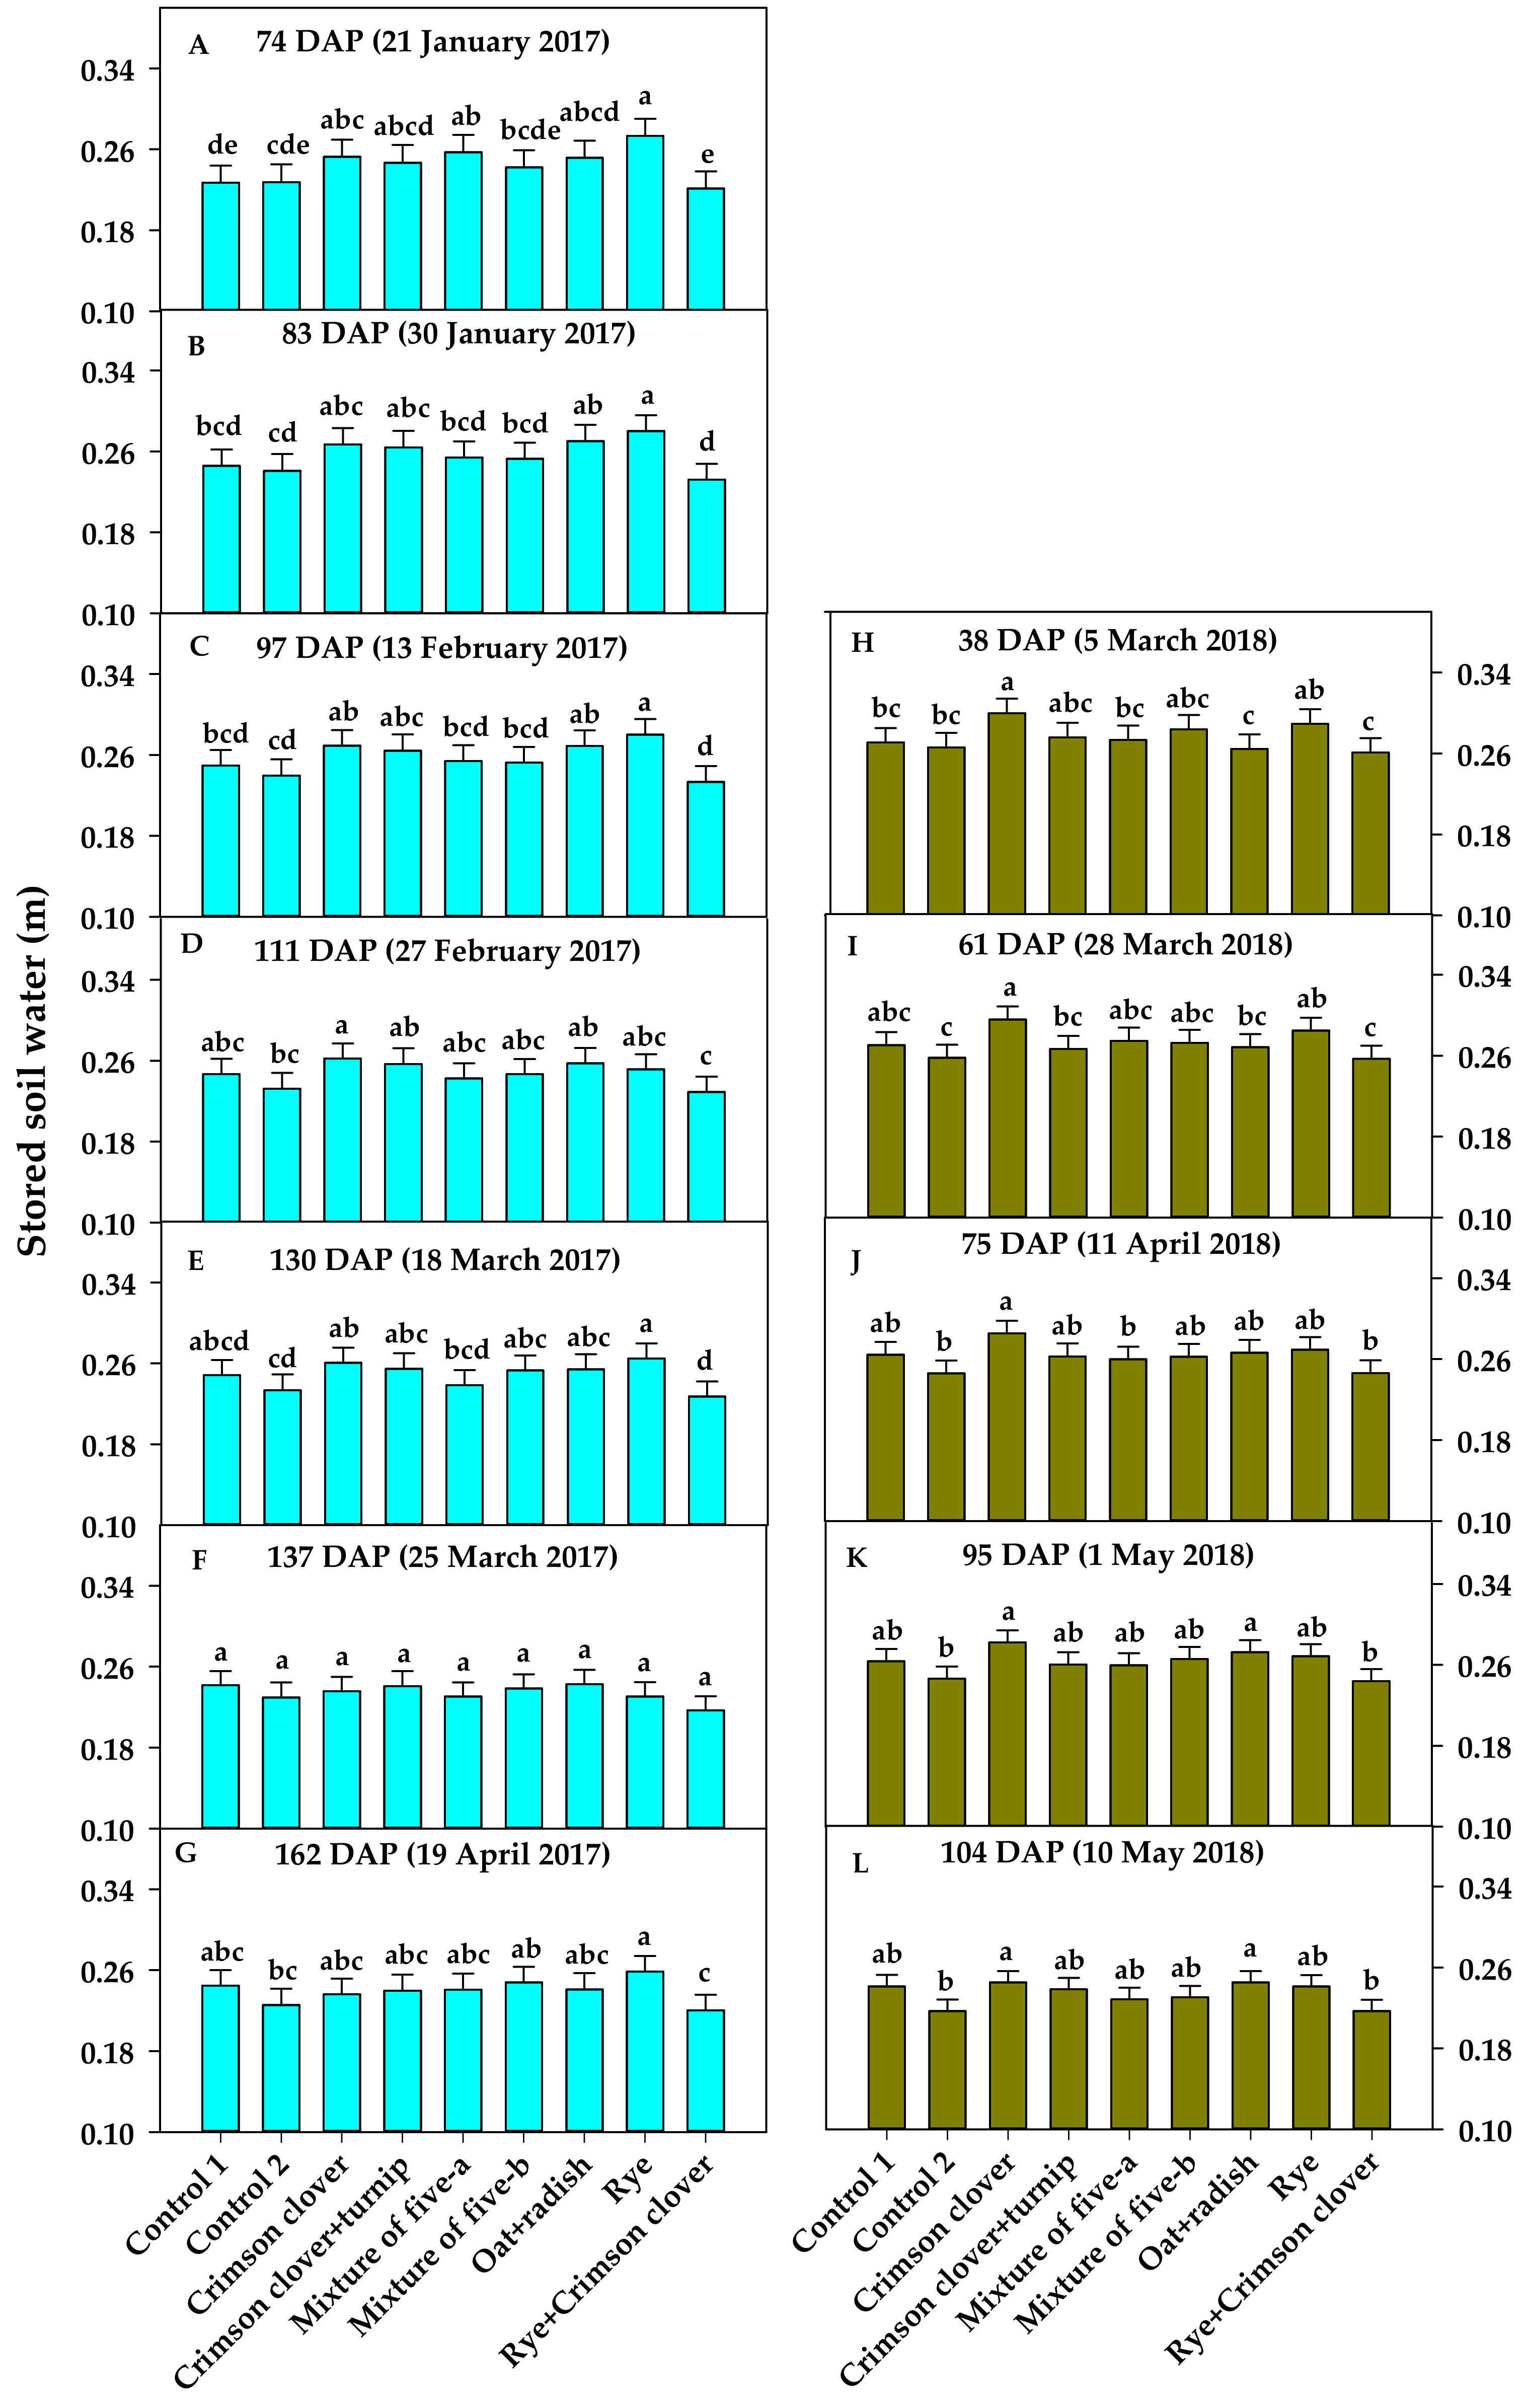
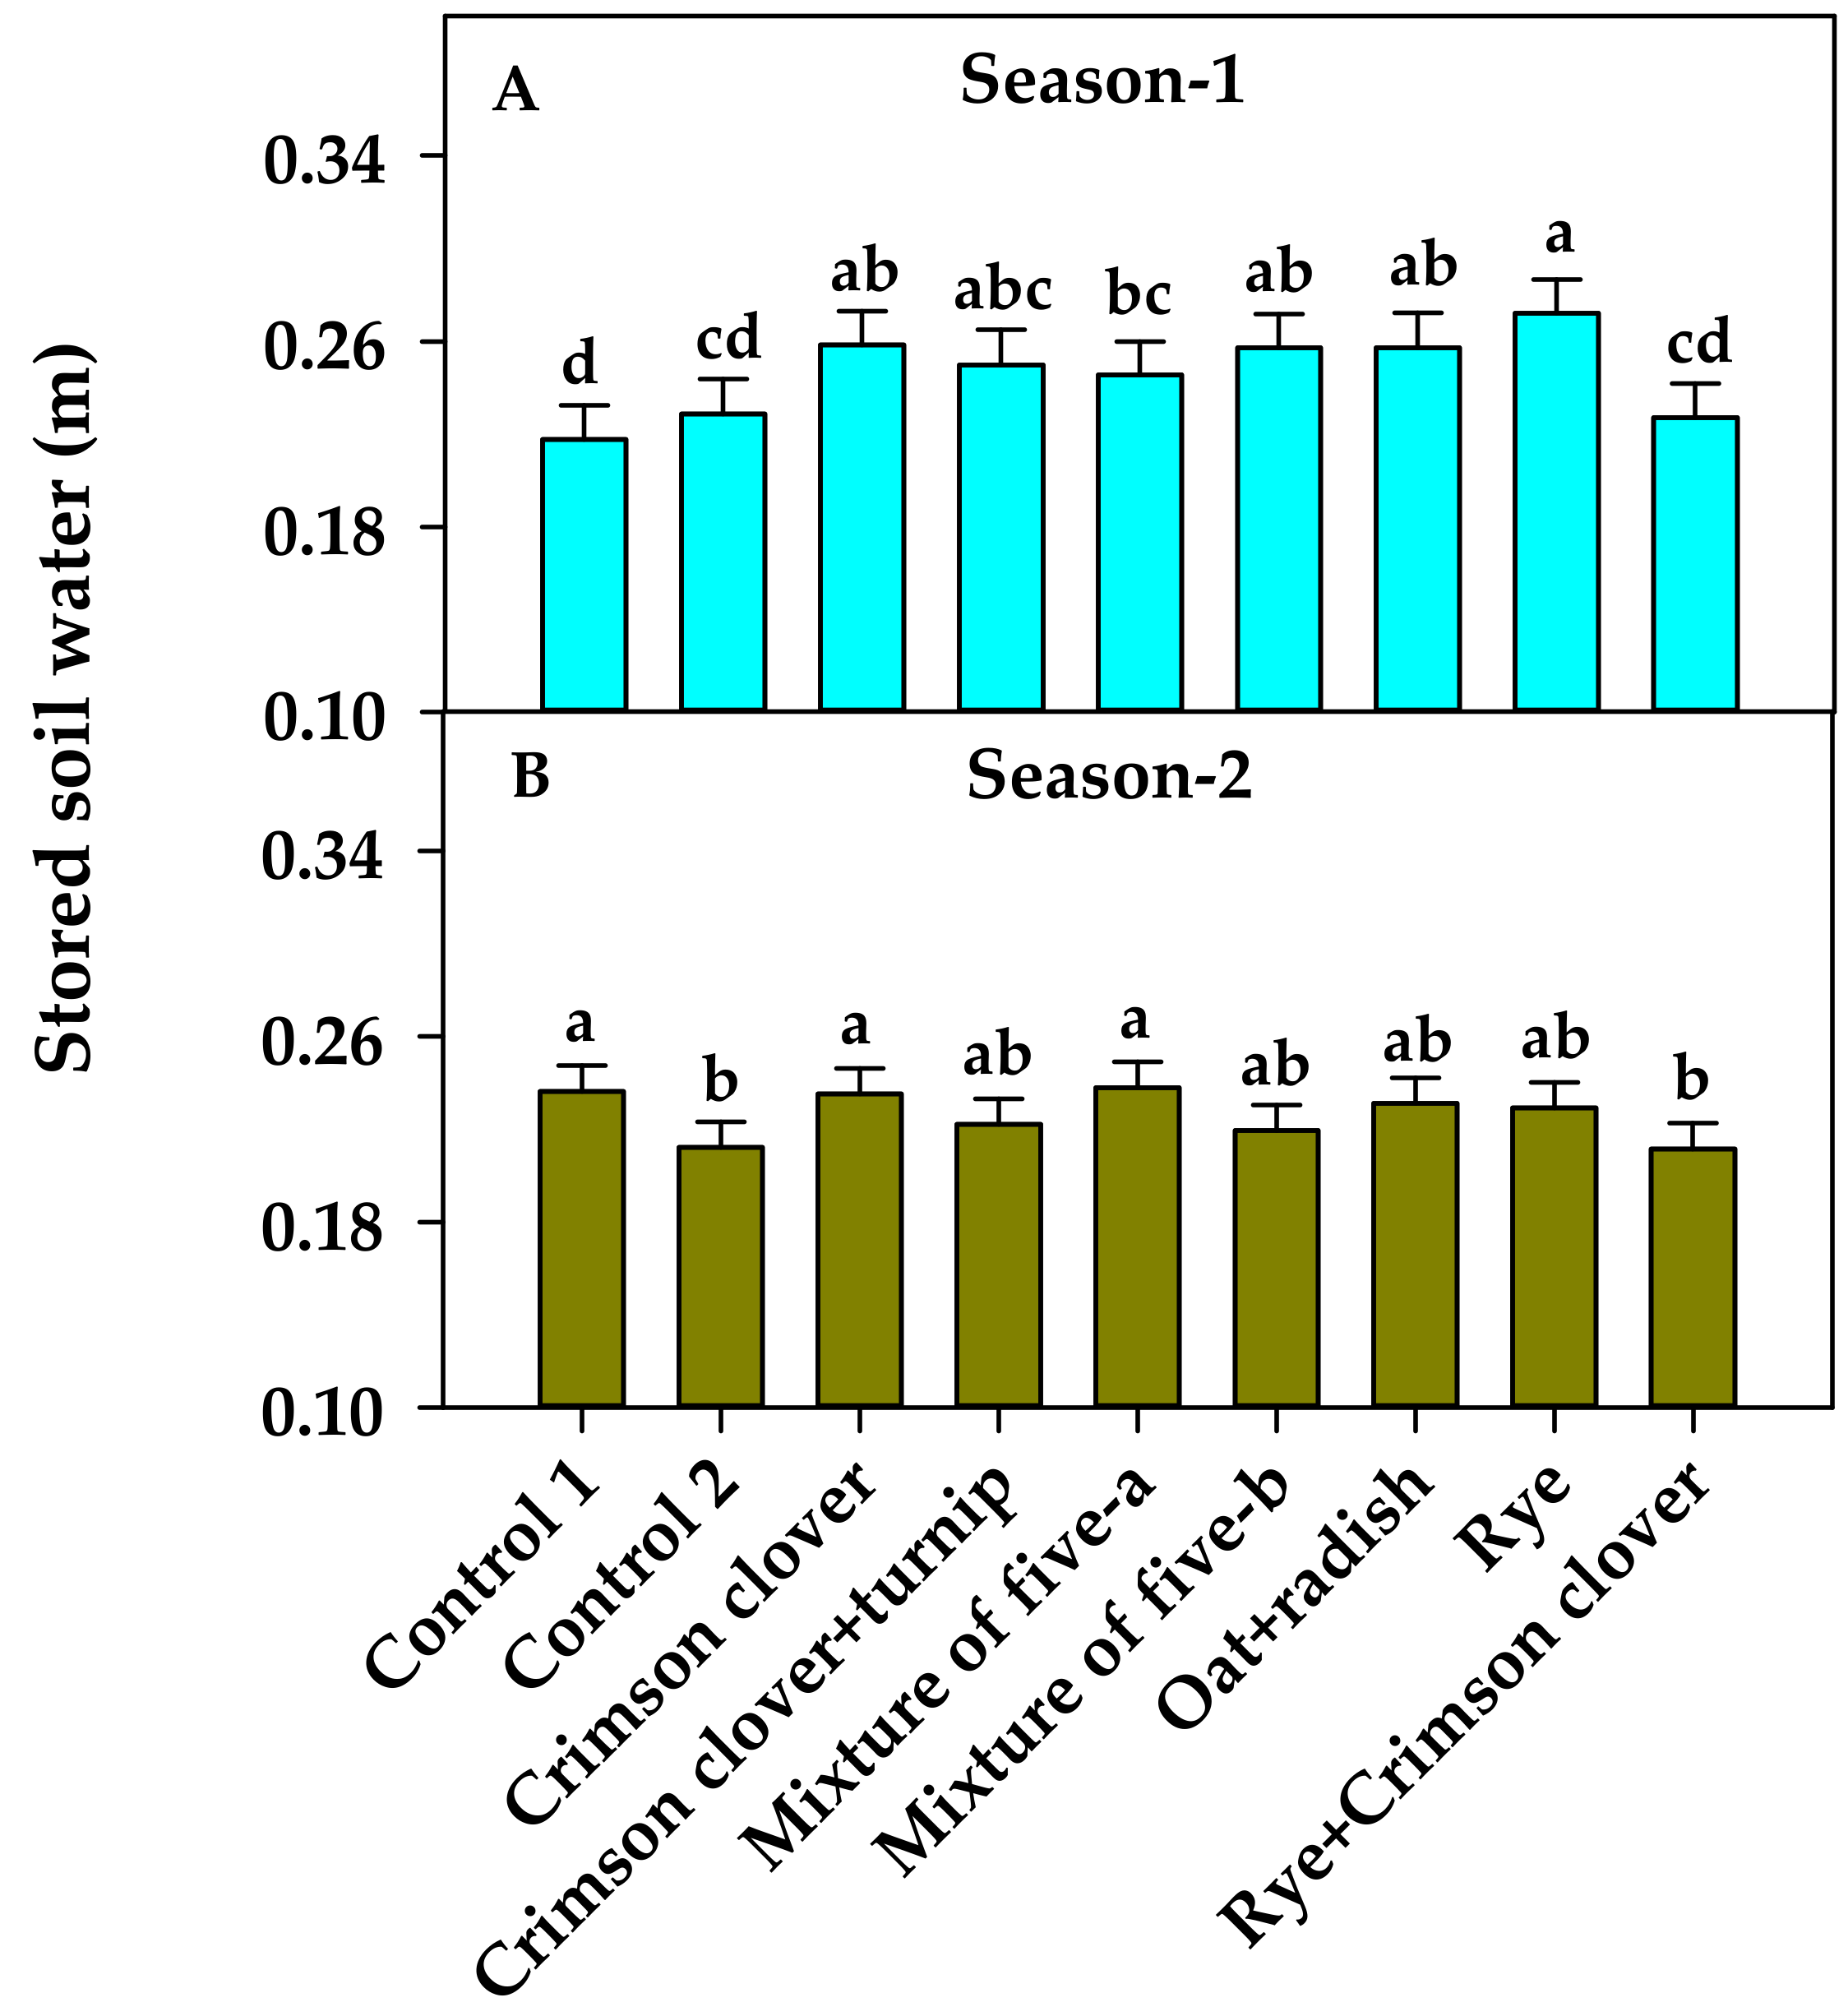
3.3. Volumetric Soil Water Content

The ranges of volumetric water content (m3 m−3) across all treatments (seven cover crops and two types of fallow) and measurement dates at 10, 20, 30, 40, and 60 cm depths were 0.002–0.195, 0.047–0.333, 0.121–0.365, 0.192–0.405, and 0.221–0.486, respectively, in season-1 and 0.005–0.243, 0.057–0.319, 0.125–0.365, 0.183–0.408, and 0.177–0.487, respectively, in season-2. The volumetric water contents at which soil reached saturation at 10, 20, 30, 40, and 60 cm depths were 0.428, 0.383, 0.436, 0.459, and 0.498 m3 m−3, respectively. Thus, our data showed that soil was never at saturation at any of the five depths on any measurement dates. This could have prevented the percolation of water to deeper layers.
Normality of residuals was checked for the data collected on volumetric soil water content and stored soil water in 60 cm depth. According to the Shapiro–Wilk test, residuals were normally distributed (p > 0.05) for volumetric soil water content data on all measurement dates in both seasons, except 75 and 95 DAP in season-2. Since residuals were normally distributed in all other cases, no data transformation was performed for these dates. Residuals for the data on stored soil water were normally distributed (p > 0.05) on all measurement dates in both seasons.
The interaction effect of treatment and depth was not significant on volumetric soil water content on any measurement dates in both seasons (Table 3). The total stored soil water in 60 cm depth under cover crop treatments were either equal or greater compared to that under fallow treatments (Figure 4). The same result was found after cover crop termination (267 DAP in season-1 (37 d after termination) and 166 DAP in season-2 (35 d after termination)) (Figure 5). The total stored soil water in 60 cm depth did not generally differ among the seven different cover crop treatments (Figure 4 and Figure 5).

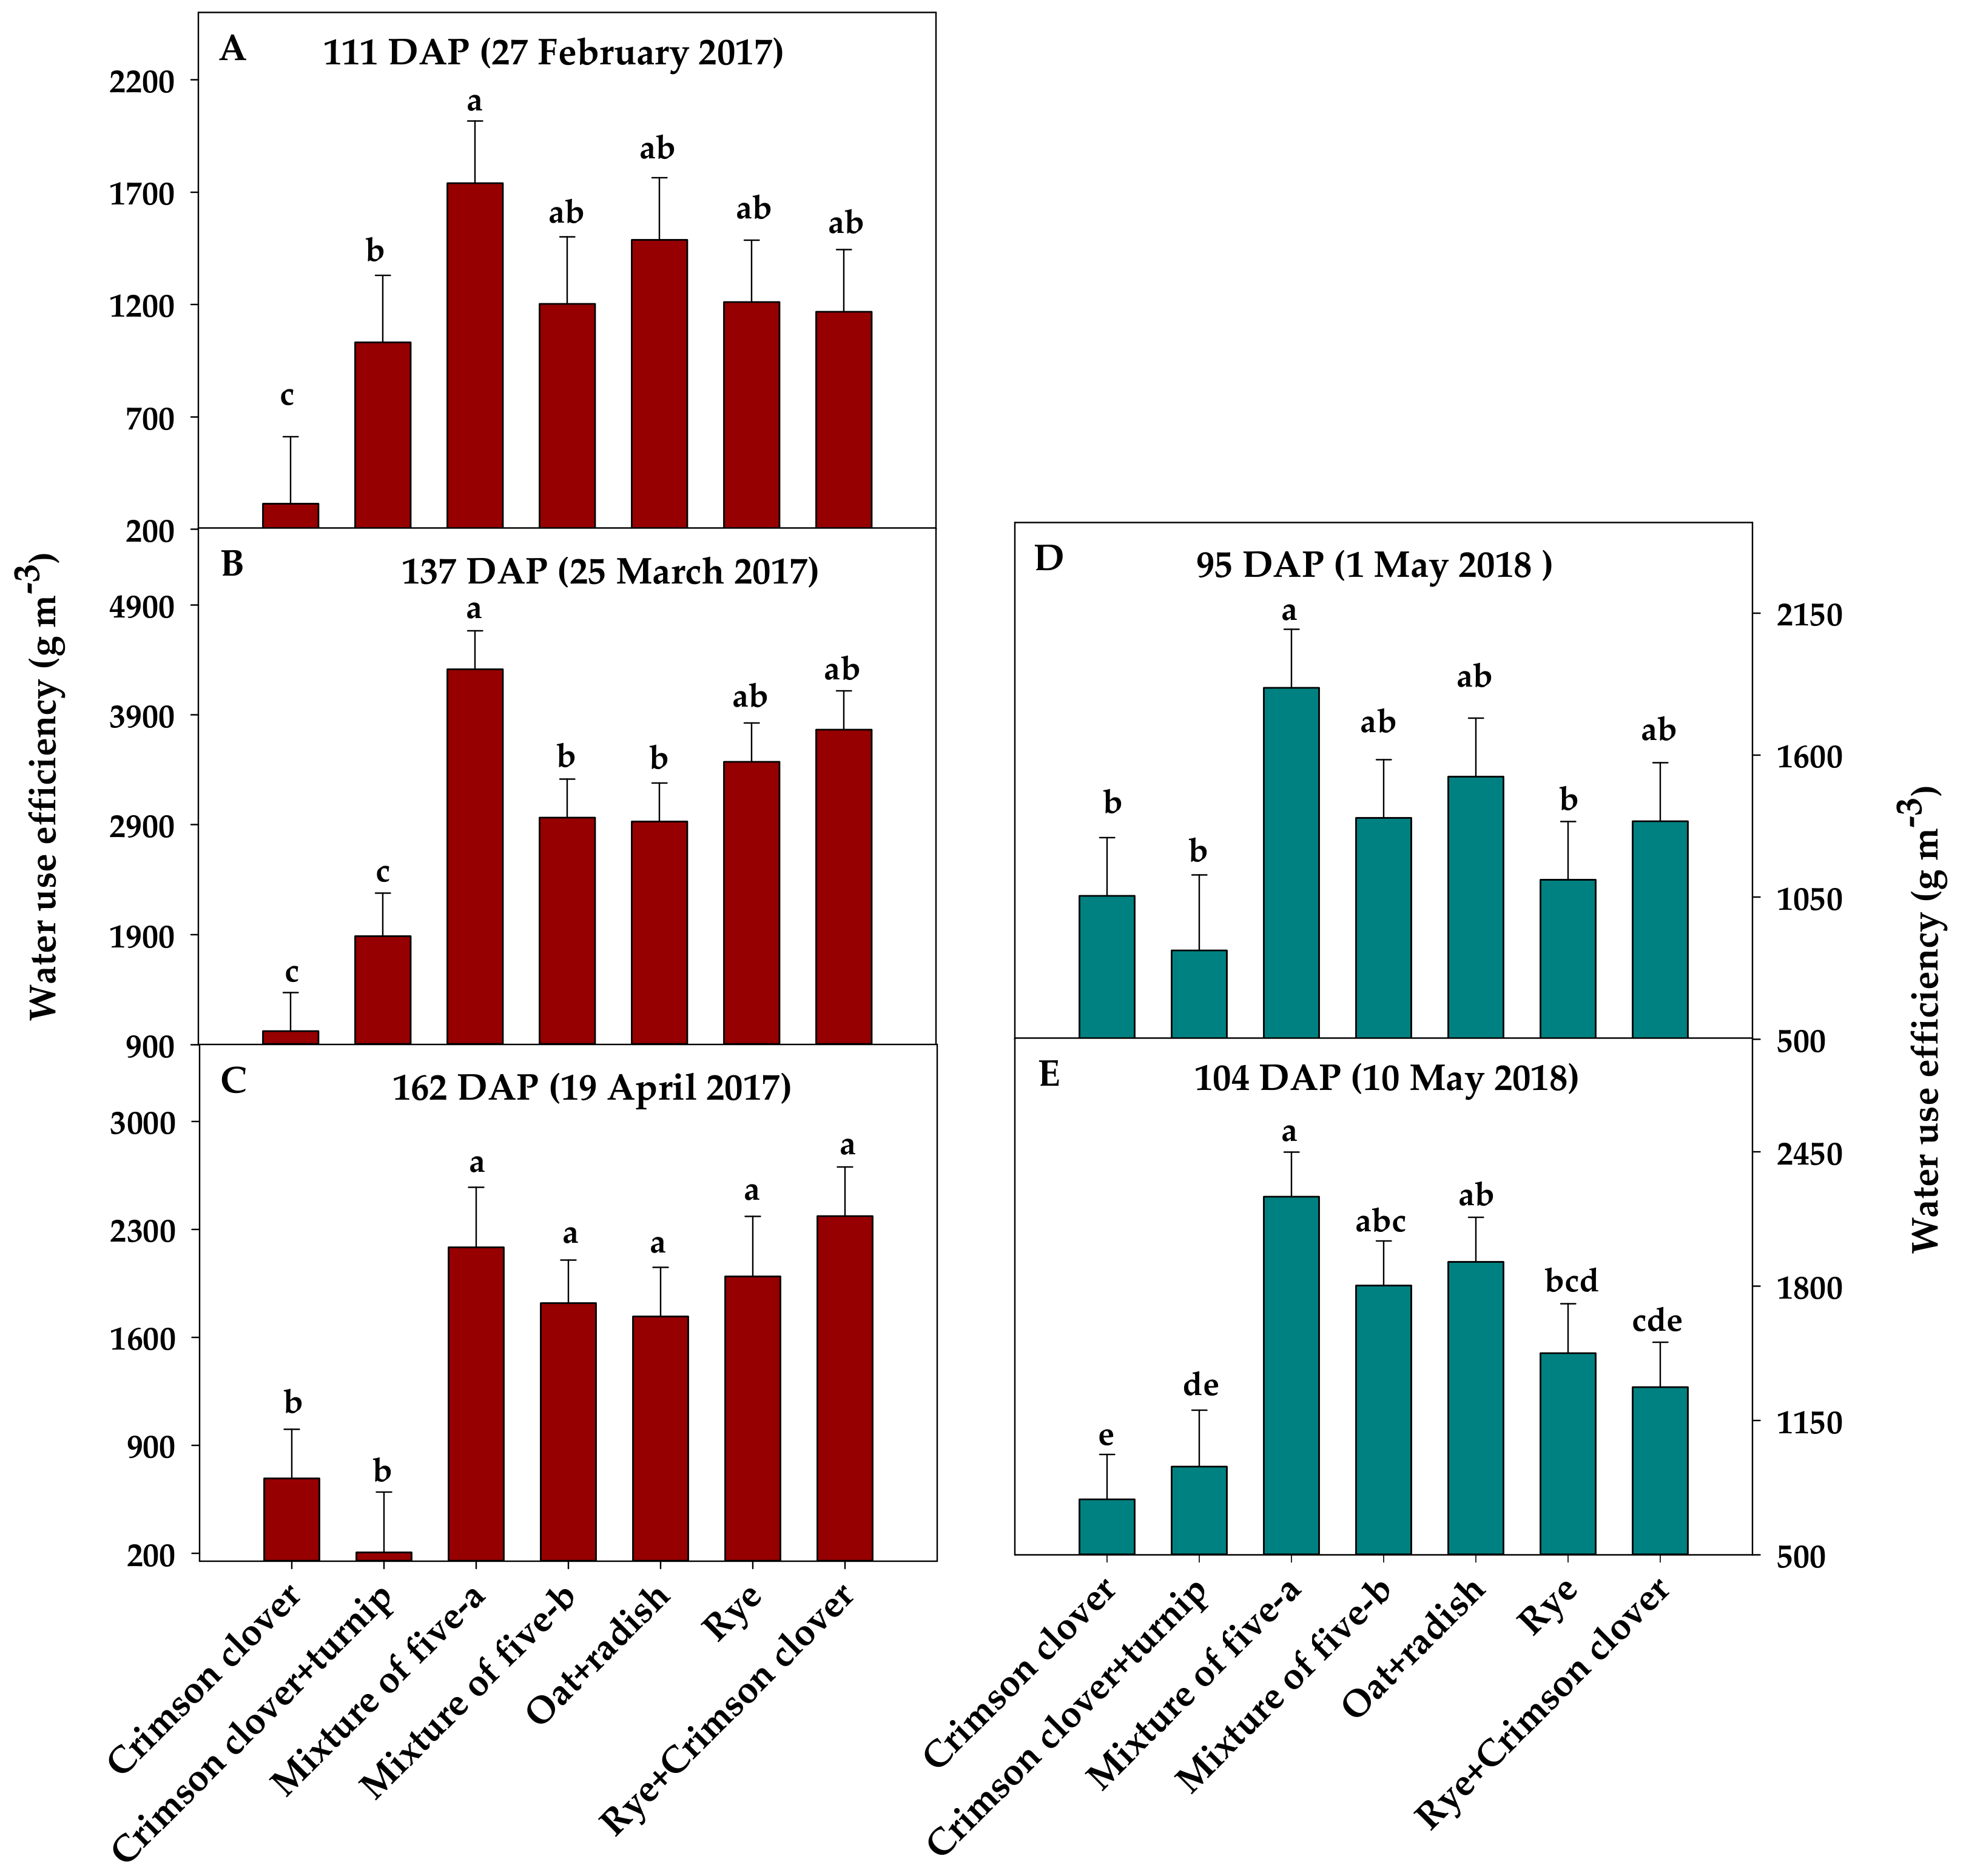
3.4. Cover Crop Water Use Efficiency

Cover crop treatments significantly differed in terms of WUE on all measurement dates, except 95 DAP in season-2 (Table 3). The mixture of five-a had the highest or one of the highest WUE values on all measurement dates in both seasons (Figure 6). Rye, which was another top biomass producer in season-1, had similar WUE values compared to the mixture of five-a on all measurement dates in that year. However, WUE values of rye were lower than that of the mixture of five-a on both measurement dates in season-2. The mixture of rye and crimson clover was ranked one among the highest in terms of WUE values on all measurement dates in season-1 and on 95 DAP in season-2. The mixture of five-b and the mixture of oat and radish generally had intermediate values for WUE in both seasons. Crimson clover had the lowest or one of the lowest WUE values on all measurement dates in both seasons.

4. Discussion

In this study, we evaluated seven different winter cover crops, including single species and mixtures that are commonly available in the southern USA, for biomass production and WUE. Additionally, we compared stored soil water under cover crop treatments with that under a fallow treatment. The study was conducted in the upstate of South Carolina in two seasons: 2016–2017 and 2018. Both seasons received more rainfall than what is typical for this region. Therefore, the results are most relevant to years with adequate amount of rainfall.
The mixture of Austrian winter pea, rye, crimson clover, hairy vetch, and oats (mixture of five-a) produced the highest amount of biomass and the single species of crimson clover produced the lowest amount of biomass, among the seven cover crop treatments tested (Figure 3). In South Carolina and many other parts of the southern USA, rye is a popular cover crop due to its high biomass production potential. It is interesting to note that the mixture of five-a produced the same amount of biomass (even higher, numerically) as rye in season-1. In season-2, rye produced only lower biomass than the mixture of five-a. In South Carolina, the ideal planting time for a rye cover crop is September to mid-November [48]. Rye was planted during this optimal planting period in season-1 (8 November 2016), but much later than that in season-2 (26 January 2018). The late planting may be a major reason for why rye only produced lower biomass than the mixture of five-a in season-2. We also suspect a poor-quality seed lot of rye in season-2 as we observed inert matter and broken seeds in the seed bag. However, our results suggest that the mixture of five-a and rye would be good winter cover crops for the upstate of South Carolina in terms of biomass production, if planting occurs in fall. The mixture of five-a would be a better choice over rye, if planting occurs in mid-late winter. It has been reported in previous literature that cover crop mixtures can improve organic matter production, optimize carbon-to-nitrogen ratio, suppress weeds, attract beneficial insects, and deter pests with greater efficiency than single-species cover crops [23,30]. As the mixture of five-a that produced the highest amount of biomass in the present study contained a combination of legume and grass functional groups, it would be interesting to further evaluate whether it can improve soil health more efficiently than a single species of rye in South Carolina.
The results from the present research show the yield advantage of the mixture of five-a in the upstate of South Carolina in relatively wet years. Cover crop studies from different parts of the country have reported contrasting results in terms of biomass production of mixtures in comparison with that of single species [18,19,20,21,22,24,28,30]. Some studies found that cover crop mixtures will improve biomass production compared to single species [19,22,30]. For example, Carr et al. [22] found that a mixture of oat and pea and a mixture of barley (Hordeum vulgare L.) and pea produced greater dry matter than monocultures of oat and barley in southwestern North Dakota under low soil nitrogen condition. In contrast, some other studies found no differences or reduced biomass production of mixtures compared to that of single species [28,49]. To give an example, Nielsen et al. [28] compared the biomass production of single-species plantings of flax (Linum usitatissimum L.), oat, pea (Pisum sativum subsp. arvense L. Poir), and rapeseed (Brassica napus L.) with that of a ten-species mixture containing all these four species in a two-year study conducted in Colorado and Nebraska. They found that the mixture did not produce greater biomass than the single-species plantings. These reports indicate that any advantage of increased biomass production by cover crop mixtures compared to monocultures depend upon factors such as location, species, soil type, and soil nutrient and moisture conditions.
The conventional approach considers cover crops as crops that are not taken for a profitable purpose [50]. However, the use of cover crops for animal feed or some other purpose can cause a direct profitability from growing them [51]. For that benefit to occur, the cover crops should produce sufficient biomass so that even after a portion was taken off as forage or through grazing, there will still be enough ground cover to provide adequate erosion control and other soil health benefits [28]. The amount of biomass that a cover crop should produce to meet all these demands depends on many factors such as soil type, soil organic matter content, and weather [52,53]. In the present study, biomass production of different cover crops ranged between 1350 kg ha−1 and 6320 kg ha−1 in season-1 and between 2160 kg ha−1 and 6480 kg ha−1 in season-2. According to earlier literature [54,55], this seems adequate for allowing some biomass removal and maintaining enough ground cover for erosion control.
The present study evaluated the effect of cover cropping on stored soil water at various growth stages of cover crops and after their termination. The results showed that stored soil water in 60 cm depth under cover crop treatments was either equal or greater compared to that under fallow throughout the cover crop season and after cover crop termination (Figure 4 and Figure 5). This suggested that none of the cover crops evaluated in this study depleted soil water more than fallow. It should be noted that both seasons in which the present study was conducted received greater than normal rainfall for the region. This might be one of the reasons for why we did not see differences in stored soil water between cover crops and fallow. Under conditions of adequate rainfall, there might not be a serious issue of cover crops depleting soil water as there would be in dry years. Further studies should verify the applicability of the observed results in dry years. In addition, the timing of rainfall relative to the date of soil water measurements could also influence the results. Though we wanted to make soil water measurements in a rain-free period of at least seven days, that was never possible in both seasons. In season-1 and season-2, 1–5 cm of rainfall occurred in the last seven days of volumetric soil water content measurements, except for the measurements on 5 March 2018 (38 DAP of season-2). For that date, 8 cm of rainfall occurred in the last seven days.
The equal or greater amounts of stored soil water under cover crop treatments compared to fallow in the present research might be a result of many factors other than rainfall. Possible improvements in soil physical properties due to cover crops might have increased infiltration and soil water retention [8,25,56,57]. Chalise et al. [8] found that volumetric water content in plots with cover crops was higher than that in plots with no cover crops. For example, volumetric water content at 0–5 cm depth was 16% higher under cover crop treatment than under no-cover crop treatment at 42 d after planting. Similarly, volumetric water content at 5–15 cm depth was 28% higher under cover crop treatment than under no-cover crop treatment at 96 d after planting. Russel [58] reported that wheat residues (4483 kg ha−1) reduced evaporation as much as 55% compared to bare soil. The principles involved in evaporation control through residues might be: (a) shading of the soil surface by residues that minimizes direct solar radiation reaching the soil surface, (b) prevention of heat conduction from the atmospheric air to the soil, and (c) providing an extra layer over the soil surface within which the air is more or less static, which in turn suppresses vapor movement to the atmosphere in proportion to vapor pressure gradient [58]. This refers to the importance of having enough cover crop biomass during the cover crop growing season and enough residue after their termination to cover the ground effectively that could potentially suppress evaporation. The biomass production by the different cover crops in this study seem to be sufficient for this purpose, as none of them depleted soil water more than fallow. This effect would likely be increased over multiple seasons of cover cropping as organic matter is increased.
In the present study, stored soil water in 60 cm depth did not differ between single-species cover crops and mixtures (Figure 5, Table 3). This result is supported by Nielsen et al. [29], who found that cover crop mixtures used a similar amount of water as single-species plantings in the semi-arid Central Great Plains. Berns and Berns [59] found that 9- and 16-species cover crop mixtures used less water compared to single-species plantings of sunflower (Helianthus annuus L.) and soybean (Glycine max L. Merr.) in South Central Nebraska. Our results indicated that the increased biomass production by the mixture of five-a was not at the expense of increased water use.
The mixture of five-a ranked high, crimson clover ranked low, and the mixture of crimson clover and rye, mixture of five-b, and mixture of oat and radish ranked as intermediate for WUE. This ranking was similar to the rankings for biomass production. As the cover crops did not differ in terms of water use (inferred from the similar amounts of water they retained in the soil (Figure 5)), the differences among them in terms of WUE (biomass/water use) may be the result of differences in biomass production. Our results indicated that, with the same amount of water, the mixture of five-a produced more biomass than crimson clover, the mixture of crimson clover and turnip, the mixture of oat and radish, the mixture of rye and crimson clover, and/or the mixture of five-b in the upstate of South Carolina. Farmers in our region grow cover crops primarily for biomass production for ground cover and erosion control. Therefore, the increased WUE of the mixture of five-a along with its high biomass production would be an added advantage of this cover crop in South Carolina.
In summary, the present research evaluated biomass production, stored soil water, and WUE of single species and multispecies cover crops in South Carolina. The mixture of five-a and rye produced the greatest amount of biomass (4600–6480 kg ha−1) at the end of the season (19 April 2017 in season-1 and 10 May 2018 in season-2). The mixture of five-a also had the greatest values for WUE (2184–2232 g m−3). On the other hand, crimson clover and the mixture of crimson clover and turnip produced the least amount of biomass (1344–2271 kg ha−1) and had the smallest values for WUE (207–685 g m−3) at the end of the season. None of the cover crops depleted soil water greater than fallow.

5. Conclusions

The results from this study suggest that a five-species mixture of Austrian winter pea, rye, crimson clover, hairy vetch, and oats and a single species of rye would be good winter cover crops for the upstate of South Carolina in terms of biomass production, if planting occurs in fall. The five-species mixture would be a better choice over rye, if planting occurs in mid-late winter. Since the five-species mixture is a combination of grass and legume functional groups, it could be superior when soil health benefits are also considered. The additional planning, labor, and cost that may be associated with dealing with a mixture should also be considered before choosing it for any cropping systems.

Supplementary Materials

The following are available online at https://www.mdpi.com/2073-4395/10/4/463/s1, Table S1: Data collected on cover crop biomass production on various measurement dates in season-1 (2016–2017) and season-2 (2018). Table S2: Data collected on volumetric soil water content at 10, 20, 30, 40, and 60 cm depths under each of the seven cover crop treatments and two control treatments (Fallow with herbicide application (control-1) and fallow without herbicide application (control-2)) on multiple measurement dates during season-1 (2016–2017) and season-2 (2018).

Author Contributions

Conceptualization, S.N.; methodology, R.S.A. and S.N.; formal analysis, R.S.A. and S.N.; investigation, R.S.A.; resources, S.N. and C.T.; data curation, R.S.A. and S.N.; writing—original draft preparation, R.S.A.; writing—review and editing, S.N., G.W.Z., C.T., and R.S.A.; visualization, R.S.A. and S.N.; supervision, S.N. and G.W.Z.; project administration, S.N.; funding acquisition, S.N. All authors have read and agreed to the published version of the manuscript.

Funding

This research was funded by the Southern Sustainable Agriculture Research and Education (SARE), grant number OS16-096. This material was based upon work supported by the NIFA/USDA, under project number SC-1700533.

Acknowledgments

The authors would like to thank the Fulbright LASPAU Board for graduate student support. The authors also thank Daniel Milam for serving as the farmer cooperator in the project team, providing land for the research, conducting field operations, and assisting with data collection. Appreciation is extended to Zolian Zoong Lwe, Jordan Withycombe, David Robb, Nicholas Accardo, and Harrison Fried for their support with field activities, and Wayne Chao for help with sample processing. This publication is Technical Contribution No. 6836 of the Clemson University Experiment Station.

Conflicts of Interest

The authors declare no conflicts of interest.

References

  1. Jenny, H. A study on the influence of climate upon the nitrogen and organic matter content of the soil. Res. Bull. Missouri Agric. Exp. Stn. Columbia 1930, 152, 1–67. [Google Scholar]
  2. Causarano, H.J.; Franzluebbers, A.J.; Reeves, D.W.; Shaw, J.N. Soil organic carbon sequestration in cotton production systems of the southeastern United States: A review. J. Environ. Qual. 2006, 35, 1374–1383. [Google Scholar] [CrossRef] [PubMed]
  3. Franzluebbers, A.J. Soil organic carbon sequestration and agricultural GHG emissions in the southeastern USA. Soil Till. Res. 2005, 83, 120–147. [Google Scholar] [CrossRef]
  4. Reberg-Horton, S.C.; Grossman, J.M.; Kornecki, T.S.; Meijer, A.D.; Price, A.J.; Place, G.T.; Webster, T.M. Utilizing cover crop mulches to reduce tillage in organic systems in the southeastern USA. Renew. Agric. Food Syst. 2012, 27, 41–48. [Google Scholar] [CrossRef] [Green Version]
  5. Unger, P.W.; Vigil, M.F. Cover crop effects on soil water relationships. J. Soil Water Conserv. 1998, 53, 200–207. [Google Scholar]
  6. Bergtold, J.S.; Ramsey, S.; Maddy, L.; Williams, J.R. A review of economic considerations for cover crops as a conservation practice. Renew. Agric. Food Syst. 2017, 34, 62–76. [Google Scholar] [CrossRef]
  7. Chu, M.; Jagadamma, S.; Walker, F.R.; Eash, N.S.; Buschermohle, M.J.; Duncan, L.A. Effect of multispecies cover crop mixture on soil properties and crop yield. Agric. Environ. Lett. 2017, 2, 170030. [Google Scholar] [CrossRef] [Green Version]
  8. Chalise, K.S.; Singh, S.; Wegner, B.R.; Kumar, S.; Pérez-Gutiérrez, J.D.; Osborne, S.L.; Nleya, T.; Guzman, J.; Rohila, J.S. Cover crops and returning residue impact on soil organic carbon, bulk density, penetration resistance, water retention, infiltration, and soybean yield. Agron. J. 2018, 110, 99–108. [Google Scholar] [CrossRef] [Green Version]
  9. Snapp, S.S.; Swinton, S.M.; Labarta, R.; Mutch, D.; Black, J.R.; Leep, R.; Nyiraneza, J.; O’Neil, K. Evaluating cover crops for benefits, costs and performance within cropping system niches. Agron. J. 2005, 97, 322–332. [Google Scholar]
  10. Wells, M.S.; Reberg-Horton, S.C.; Smith, A.N.; Grossman, J.M. The reduction of plant-available nitrogen by cover crop mulches and subsequent effects on soybean performance and weed interference. Agron. J. 2013, 105, 539–545. [Google Scholar] [CrossRef]
  11. Petrosino, J.S.; Dille, J.A.; Holman, J.D.; Roozeboom, K.L. Kochia suppression with cover crops in southwestern Kansas. Crop. Forage Turfgrass Manag. 2015, 1, 1. [Google Scholar] [CrossRef]
  12. Wick, A.; Berti, M.; Lawley, Y.; Liebig, M. Integration of annual and perennial cover crops for improving soil health. In Soil Health and Intensification of Agroecosystems; Al-Kaisi, M.M., Lowery, B., Eds.; Academic Press: Cambridge, MA, USA, 2017; pp. 127–150. [Google Scholar]
  13. Northeast Climate Hub Fact Sheet, Cover Cropping to Improve Climate Resilience. USDA; 2018. Available online: https://www.climatehubs.oce.usda.gov/sites/default/files/covercropsfactsheet_feb2018_web.pdf (accessed on 3 February 2020).
  14. 2017 Cover Crop Survey Analysis. SARE. Available online: https://www.sare.org/Learning-Center/Topic-Rooms/Cover-Crops/Cover-Crop-Surveys (accessed on 4 February 2020).
  15. Hamilton, A.V.; Mortensen, D.A.; Allen, M.K. The state of the cover crop nation and how to set realistic future goals for the popular conservation practice. J. Soil Water Conserv. 2017, 72, 111A–115A. [Google Scholar] [CrossRef]
  16. Economics of Cover Crops I: Profitability of Cover Crops in Row Crop Production and Federal Cost Share for Cover Crops. Available online: https://www.southernsare.org/Regional-News/Bulletins/Cover-Crops-Research-Across-the-Southern-Region/Economics-of-Cover-Crops-I-Profitability-of-Cover-Crops-in-Row-Crop-Production-and-Federal-Cost-Share-for-Cover-Crops (accessed on 7 February 2020).
  17. Briggs, L.J.; Shantz, H.L. The water requirement of plants as influenced by environment. Proc. 2nd Pan-Am. Sci. Congr. 1917, 3, 95–107. [Google Scholar]
  18. Robinson, R.G. Oat-pea or oat-vetch mixtures for forage or seed. Agron. J. 1960, 52, 546–549. [Google Scholar] [CrossRef]
  19. Dunavin, L.S., Jr. Comparison of turnip-Chinese cabbage hybrid, rape, and rye, alone and in combination with annual ryegrass and crimson clover. Agron. J. 1987, 79, 591–594. [Google Scholar] [CrossRef]
  20. Droushiotis, D.N. Mixtures of annual legumes and small grained cereals for forage production under low rainfall. J. Agric. Sci. Cambridge 1989, 113, 249–253. [Google Scholar] [CrossRef]
  21. Carr, P.M.; Martin, G.B.; Caton, J.S.; Poland, W.W. Forage and nitrogen yield of barley-pea and oat-pea intercrops. Agron. J. 1998, 90, 79–84. [Google Scholar] [CrossRef]
  22. Carr, P.M.; Horsley, R.D.; Poland, W.W. Barley, oat, and cereal-pea mixtures as dryland forages in the northern Great Plains. Agron. J. 2004, 96, 677–684. [Google Scholar] [CrossRef] [Green Version]
  23. Treadwell, D.; Creamer, N.; Baldwin, K. An Introduction to Cover Crop Species for Organic Farming Systems. EOrganic. 2010. Available online: https://eorganic.org/node/1484 (accessed on 8 February 2020).
  24. Clark, A. Managing Cover Crops Profitably, 3rd ed.; Handbook Series Book 9; Sustainable Agriculture Research and Education (SARE), University of Maryland: College Park, MD, USA, 2012; ISBN 978-1-888626-12-4. [Google Scholar]
  25. Hubbard, R.K.; Strickland, T.C.; Phatak, S. Effects of cover crop systems on soil physical properties and carbon/nitrogen relationships in the coastal plain of southeastern USA. Soil Till. Res. 2013, 126, 276–283. [Google Scholar] [CrossRef]
  26. Daigh, A.L.; Helmers, M.J.; Kladivko, E.; Zhou, X.; Goeken, R.; Cavdini, J.; Barker, D.; Sawyer, J. Soil water during the drought of 2012 as affected by rye cover crops in fields in Iowa and Indiana. J. Soil Water Conserv. 2014, 69, 564–573. [Google Scholar] [CrossRef] [Green Version]
  27. Smith, R.G.; Atwood, L.W.; Warren, N.D. Increased productivity of a cover crop mixture is not associated with enhanced agroecosystem services. PLoS ONE 2014, 9, e97351. [Google Scholar] [CrossRef] [PubMed] [Green Version]
  28. Nielsen, D.C.; Lyon, D.J.; Hergert, G.W.; Higgins, R.K.; Holman, J.D. Cover crop biomass production and water use in the central Great Plains. Agron. J. 2015, 107, 2047–2058. [Google Scholar] [CrossRef]
  29. Nielsen, D.C.; Lyon, D.J.; Hergert, G.W.; Higgins, R.K.; Calderón, F.J.; Vigil, M.F. Cover crop mixtures do not use water differently than single-species plantings. Agron. J. 2015b, 107, 1025–1038. [Google Scholar] [CrossRef]
  30. Wolters, B.R. To Mix or Not to Mix: Performance and Management of Diverse Cover Crop Mixtures. Ph.D. Thesis, Virginia Polytechnic Institute and State University, Blacksburg, Virginia, 20 September 2019. [Google Scholar]
  31. Biederbeck, V.O.; Campbell, C.A.; Zentner, R.P. Effects of crop rotation and fertilization on some biological properties of a loam in southwestern Saskatchewan. Can. J. Soil Sci. 1984, 64, 355–367. [Google Scholar] [CrossRef]
  32. Mikha, M.M.; Vigil, F.M.; Liebig, M.A.; Bowman, R.A.; McConkey, B.; Deibert, E.J.; Pikul, J.L., Jr. Cropping system influences on chemical properties and soil quality in the Great plains. Renew. Agric. Food Syst. 2006, 21, 26–35. [Google Scholar] [CrossRef]
  33. Steenwerth, K.L.; Jackson, L.E.; Calderón, F.J.; Stromberg, M.R.; Scow, K.M. Soil microbial community composition and land use history in cultivated and grassland ecosystems of coastal California. Soil Biol. Biochem. 2002, 34, 1599–1611. [Google Scholar] [CrossRef]
  34. Biederbeck, V.O.; Zentner, R.P.; Campbell, C.A. Soil microbial populations and activities as influenced by legume green fallow in a semiarid climate. Soil Biol. Biochem. 2005, 37, 1775–1784. [Google Scholar] [CrossRef]
  35. KSU Agronomy e-Update 387. 1 February 2013. Available online: https://www.agronomy.k-state.edu/documents/eupdates/eupdate020113.pdf (accessed on 3 February 2020).
  36. Kuykendall, M.B. Biomass Production and Changes in Soil Water with Cover Crop Species and Mixtures Following No-Till Winter Wheat. Master’s Thesis, Kansas State University, Manhattan, KS, USA, 2015. [Google Scholar]
  37. Wortman, S.E.; Francis, C.A.; Bernards, M.L.; Drijber, R.A.; Lindquist, J.L. Optimizing cover crop benefits with diverse mixtures and an alternative termination method. Agron. J. 2012, 104, 1425–1435. [Google Scholar] [CrossRef] [Green Version]
  38. Campbell, R.B.; Karlen, D.L.; Sojka, R.E. Conservation tillage for maize production in the U.S. Southeastern Coastal Plain. Soil Tillage Res. 1984, 4, 511–529. [Google Scholar] [CrossRef]
  39. Campbell, R.B.; Sojka, R.E.; Karlen, D.L. Conservation tillage for soybean in the U.S. Southeastern Coastal Plain. Soil Tillage Res. 1984, 4, 531–541. [Google Scholar] [CrossRef]
  40. Ewing, R.P.; Wagger, M.G.; Denton, H.P. Tillage and cover crop management effects on soil water and corn yield. Soil Sci. Soc. Am. J. 1991, 55, 1081–1085. [Google Scholar] [CrossRef]
  41. Marshall, M.W.; Williams, P.; Nafchi, A.M.; Maja, J.M.; Payero, J.; Mueller, J.; Khalilian, A. Influence of tillage and deep rooted cool season cover crops on soil properties, pests, and yield responses in cotton. Open J. Soil Sci. 2016, 6, 149–158. [Google Scholar] [CrossRef] [Green Version]
  42. USDA NRCS. Cover crop (340) requirements in Tennessee. In 2015 Environmental Quality Incentives Program (EQIP); United States Department of Agriculture Natural Resources Conservation Service: Nashville, TN, USA, 2015. [Google Scholar]
  43. Wortman, S.E.; Francis, C.A.; Lindquist, J.L. Cover crop mixtures for the western Corn Belt: Opportunities for increased productivity and stability. Agron. J. 2012, 104, 699–705. [Google Scholar] [CrossRef] [Green Version]
  44. Dabney, S.M.; Delgado, J.A.; Reeves, D.W. Using winter cover crops to improve soil and water quality. Commun. Soil Sci Plant. Anal. 2001, 32, 1221–1250. [Google Scholar] [CrossRef]
  45. Delta, T. User Manual for the Profile Probe Type PR2 5.0; Delta-T Devices Ltd.: Cambridge, UK, 2019. [Google Scholar]
  46. Narayanan, S.; Aiken, M.R.; Prasad, P.V.V.; Xin, Z.; Yu, J. Water and radiation use efficiencies in sorghum. Agron. J. 2013, 105, 649–656. [Google Scholar] [CrossRef] [Green Version]
  47. St Aime, R.; Narayanan, S.; Payero, J.; Clemson University, Clemson, SC, USA. Personal Communication. 2018. [Google Scholar]
  48. Home and Garden Information Center Factsheet 1252. Available online: https://hgic.clemson.edu/factsheet/cover-crops/ (accessed on 31 January 2020).
  49. Lenssen, A.W.; Cash, S.D.; Hatfield, P.G.; Sainju, U.M.; Grey, W.R.; Blodgett, S.L.; Goosey, H.B.; Griffith, D.A.; Johnson, G.D. Yield, quality, and water and nitrogen use of durum and annual forages in two-year rotations. Agron. J. 2010, 102, 1261–1268. [Google Scholar] [CrossRef] [Green Version]
  50. Lal, R.; Regnier, E.; Eckert, D.J.; Edwards, W.M.; Hammond, R. Expectations of cover crops for sustainable agriculture. In Cover Crops for Clean Water; Hargrove, W.L., Ed.; Soil and Water Conservation Society: Ankeny, IA, USA, 1991. [Google Scholar]
  51. Franzluebbers, A.J.; Stuedemann, J.A. Soil physical responses to cattle grazing cover crops under conventional and no tillage in the Southern Piedmont USA. Soil Tillage Res. 2008, 100, 141–153. [Google Scholar] [CrossRef]
  52. Wilhelm, W.W.; Johnson, J.M.F.; Hatfield, J.L.; Voorhees, W.B.; Linden, D.R. Crop and soil productivity response to corn residue removal: A literature review. Agron. J. 2004, 96, 1–17. [Google Scholar] [CrossRef]
  53. Andrews, S.S. Crop Residue Removal for Biomass Energy Production: Effects on Soils and Recommendations. NRCS White Paper; NRCS; 2006. Available online: www.nrcs.usda.gov/Internet/FSE_DOCUMENTS/nrcs142p2_053255.pdf (accessed on 31 January 2020).
  54. Fryrear, D.W. Soil cover and wind erosion. Trans. ASAE 1985, 28, 781–784. [Google Scholar] [CrossRef]
  55. Williams, J.D.; Wilkins, D.E.; Douglas, C.L.; Rickman, R.W. Winter erosion in four residue management systems: Preliminary report. Columbia Basin Agric. Res. Ann. Rep. Spec. Rep. 1997, 977, 73–76. [Google Scholar]
  56. Blanco-Canqui, H.; Mikha, M.M.; Presley, D.R.; Claassen, M.M. Addition of cover crops enhances no-till potential for improving soil physical properties. Soil Sci. Soc. Am. J. 2011, 75, 1471–1482. [Google Scholar] [CrossRef]
  57. Blanco-Canqui, H.; Holman, J.D.; Schlegel, A.J.; Tatarko, J.; Shaver, T.M. Replacing fallow with cover crops in a semiarid soil: Effects on soil properties. Soil Sci. Soc. Am. J. 2013, 77, 1026–1034. [Google Scholar] [CrossRef] [Green Version]
  58. Russel, J.C. The effect of surface cover on soil moisture losses by evaporation. Soil Sci. Soc. Am. Proc. 1939, 4, 65–70. [Google Scholar] [CrossRef] [Green Version]
  59. Berns, K.; Berns, B. Cover Crop Water Usage and Affect (Sic) on Yield in No-Till Dryland Cropping Systems, Final Report; Sustainable Agriculture Research and Education: College Park, MD, USA, 2009; Available online: https://projects.sare.org/project-reports/fnc07-653/ (accessed on 11 February 2020).
Figure 1. Daily average temperatures from planting through the last day of volumetric soil water content measurement in comparison with the historic temperature data (daily average temperature normal for a period of 30 years from 1981 to 2010).
Agronomy 10 00463 g001
Figure 2. Cumulative precipitation values from planting through the last day of volumetric soil water content measurement in comparison with the historic precipitation data. Cumulative precipitation normals for the same 267-d period in season-1 and 166-d period in season-2 were calculated from the daily precipitation normal for a period of 30 years from 1981 to 2010.
Agronomy 10 00463 g002
Figure 3. Cover crop biomass production on various measurement dates in (AD) season-1 (2016–2017) and (EG) season-2 (2018). Bars (least squares means) with different letters are significantly different according to the least significant difference (LSD) test at α = 0.05. Mixture of five-a is a combination of Austrian winter pea, rye, crimson clover, hairy vetch, and oat. Mixture of five-b is a combination of oat, wheat, crimson clover, radish, and turnip. All cover crops were planted on 8 November 2016 in season-1 and 26 January 2018 in season-2. DAP–days after planting.
Agronomy 10 00463 g003
Figure 4. Total stored soil water in 60 cm depth under each of the seven cover crop treatments and two control treatments (Fallow with herbicide application (control-1) and fallow without herbicide application (control-2)) on multiple measurement dates during (AG) the cover crop season-1 (2016–2017) and (HL) season-2 (2018). Bars (least squares means) with different letters are significantly different according to the least significant difference (LSD) test at α = 0.05. Mixture of five-a was a combination of Austrian winter pea, rye, crimson clover, hairy vetch, and oat. Mixture of five-b was a combination of oat, wheat, crimson clover, radish, and turnip.
Agronomy 10 00463 g004
Figure 5. Total stored soil water in 60 cm depth at (A) 37 days after cover crop termination in season-1 (2 August 2017) and (B) 35 days after cover crop termination in season-2 (11 July 2018). Bars (least squares means) with different letters are significantly different according to the least significant difference (LSD) test at α = 0.05. Control treatments were fallow with herbicide application (control-1) and fallow without herbicide application (control-2). Mixture of five-a was a combination of Austrian winter pea, rye, crimson clover, hairy vetch, and oat. Mixture of five-b was a combination of oat, wheat, crimson clover, radish, and turnip.
Agronomy 10 00463 g005
Figure 6. Water use efficiency values of seven cover crop treatments measured in: (AC) season-1 (2016–2017) and (D,E) season-2 (2018). Bars (least squares means) with different letters are significantly different according to the least significant difference (LSD) test at α = 0.05. Mixture of five-a was a combination of Austrian winter pea, rye, crimson clover, hairy vetch, and oat. Mixture of five-b was a combination of oat, wheat, crimson clover, radish, and turnip.
Agronomy 10 00463 g006
Table 1. Results of soil tests conducted before planting in season-1 and season-2. Average values for various soil parameters/nutrients are reported for season-1 and season-2. Low, medium, and sufficient indicate soil nutrient status provided in the soil test results.
Soil Parameter/NutrientsSeason-1Season-2
Soil pH6.46.6
Phosphorus (kg ha−1)36 (Medium)16 (Low)
Potassium (kg ha−1)152 (Sufficient)131 (Sufficient)
Calcium (kg ha−1)1500 (Sufficient)1291 (Sufficient)
Magnesium (kg ha−1)312 (Sufficient)294 (Sufficient)
Zinc (kg ha−1)4.5 (Sufficient)3.6 (Sufficient)
Manganese (kg ha−1)75 (Sufficient)70 (Sufficient)
Boron (kg ha−1)0.5 (Sufficient)0.6 (Sufficient)
Copper (kg ha−1)0.890.83
Sodium (kg ha−1)1012
Nitrate nitrogen (ppm)121
Organic matter (%)3.74.1
Table 2. Cover crop treatments and crops that were components of each treatment, their functional groups, seeding rate, and fractional compositions.
TreatmentCropSpeciesSeeding Rate (kg ha−1)Fractional Composition 1 (%)Functional Group
Single species
Single species-a2Cereal ryeSecale cereale L. cv. Wrens Abruzzi 112.1100Grass
Single species-b3Crimson cloverTrifolium incarnatum L. cv. Dixie33.6100Legume
Mixture of two species
Mixture of two-aRyeSecale cereale L. cv. Wrens Abruzzi5677Grass
Crimson cloverTrifolium incarnatum L. cv. Dixie16.823Legume
Mixture of two-bCrimson cloverTrifolium incarnatum L. cv. Dixie16.875Legume
TurnipBrassica rapa subsp. rapa. cv. Purple top white globe 5.625Brassica
Mixture of two-c4OatAvena sativa L. cv. Coker 2275683Grass
Radish (Daikon)Raphanus sativus var. Longipinnatus11.217Brassica
Mixture of five species
Mixture of five-aAustrian winter peaPisum sativum L. ssp. sativum var. arvense26.931Legume
RyeSecale cereale L. cv. Wrens Abruzzi22.425Grass
Crimson cloverTrifolium incarnatum L. cv. Dixie6.78Legume
Hairy vetchVicia villosa Roth cv. Namoi8.910Legume
OatAvena sativa L. cv. Coker 22722.426Grass
Mixture of five-bOatAvena sativa L. cv. Coker 22722.438Grass
WheatTriticum aestivum L. cv. Georgia. gore22.438Grass
Crimson cloverTrifolium incarnatum L. cv. Dixie6.712Legume
Radish (Daikon)Raphanus sativus var. Longipinnatus4.58Brassica
TurnipBrassica rapa subsp. rapa. cv. Purple top white globe 2.244Brassica
1 Fractional composition of a component in a mixture = (seeding rate of that component in the mixture/sum of seeding rates of all components in the mixture) × 100. 2,3,4 The letters ‘a’, ‘b’, and ‘c’ are used to denote different mixtures.
Table 3. Analysis of variance results on the effects of treatments (seven cover crops and two types of fallow controls), depths at which volumetric soil water content was measured, and treatment-by-depth interaction on biomass, volumetric soil water content at various depths, total stored soil water in 60 cm depth, and/or water use efficiency.
DAP 1p Values
Treatment 2Depth 3Treatment x Depth
Season-1 (2016–2017)
Biomass83<0.0001N/A 4N/A
111<0.0001N/AN/A
137<0.0001N/AN/A
162<0.0001N/AN/A
Volumetric soil water content 740.0013<0.00010.6162
830.0044<0.00010.6526
970.0051<0.00010.6406
1110.1856<0.00010.7253
1300.0317<0.00010.6440
1370.6676<0.00010.6378
1620.1560<0.00010.8909
267<0.0001<0.00010.8598
Total stored soil water in 60 cm depth740.1015N/AN/A
830.1944N/AN/A
970.1690N/AN/A
1110.6628N/AN/A
1300.3652N/AN/A
1370.9102N/AN/A
1620.6095N/AN/A
2670.0885N/AN/A
Water use efficiency 1110.0093N/AN/A
137<0.0001N/AN/A
1620.0079N/AN/A
Season-2 (2018)
Biomass 62<0.0001N/AN/A
960.0018N/AN/A
104<0.0001N/AN/A
Volumetric soil water content 380.0310<0.00010.9532
610.0947<0.00010.9869
750.0935<0.00010.9973
950.0741<0.00010.9904
1040.1348<0.00010.9895
1660.1452<0.00010.9885
Total stored soil water in 60 cm depth390.3922N/AN/A
630.5363N/AN/A
760.5260N/AN/A
960.4801N/AN/A
1050.6491N/AN/A
1670.6122N/AN/A
Water use efficiency 950.1197N/AN/A
1040.0004N/AN/A
1 Days after planting. 2 Seven cover crop treatments (rye; crimson clover; mixture of crimson clover and turnip; mixture of oat and radish; mixture of rye and crimson clover; mixture of Austrian winter pea, rye, crimson clover, hairy vetch, and oat (mixture of five-a); and mixture of oat, wheat, crimson clover, radish, and turnip (mixture of five-b)) and two control treatments (fallow with herbicide application and without herbicide application). 3 Volumetric soil water content was measured at 10, 20, 30, 40, and 60 cm depths. 4 N/A- Not applicable.

