Article

The C:N:P Stoichiometry of Planted and Natural Larix principis-rupprechtii Stands along Altitudinal Gradients on the Loess Plateau, China

1
Faculty of Forestry, Shanxi Agricultural University, Taigu, Shanxi 030801, China
2
Shanxi Key Laboratory of Functional Oil Tree Cultivation and Research, Taigu, Shanxi 030801, China
3
Faculty of Natural Resources Management, Lakehead University, Thunder Bay, Ontario P7B 5E1, Canada
4
Key Laboratory for Humid Subtropical Eco-Geographical Processes of the Ministry of Education, Fujian Normal University, Fuzhou 350007 China
*
Author to whom correspondence should be addressed.
Forests 2020, 11(4), 363; https://doi.org/10.3390/f11040363
Submission received: 8 February 2020 / Revised: 21 March 2020 / Accepted: 22 March 2020 / Published: 25 March 2020
(This article belongs to the Section Forest Ecology and Management)

Abstract

:
Carbon:nitrogen:phosphorus (C:N:P) stoichiometry plays a critical role in nutrient cycling, biodiversity, and ecosystem functionality. However, our understanding of the responses of C:N:P stoichiometry to elevation and forest management remains elusive. Here we sampled 18 Larix principis-rupprechtii sites along altitudinal gradients (1700-2300 m) on Guandishan Mountain in the Loess Plateau, China. We determined the leaf, litter, and soil C N P contents and C:N:P stoichiometric ratios, as well as nutrient resorption efficiency (NuRE), and diameter at breast height (DBH) increments in both planted and natural stands, and then tested the impacts of elevation and stand origin on these parameters’ management. We found different C:N:P stoichiometry between natural and planted forests. The results revealed that: soil C, N, and N:P ratios, litter C:P and N:P ratios, leaf C:N and N:P ratios increased significantly; however, soil C:N ratios, litter P, leaf N and P, nitrogen resorption efficiency (NRE), and DBH increments decreased significantly with elevation in the planted forests. Soil C,N and N:P ratios, litter C, as well as C:N and C:P ratios increased significantly with elevation in natural forests. The soil N, P and N:P ratios, litter C:P and N:P ratios, leaf C, C:P and N:P ratios, nitrogen resorption efficiency (NRE), phosphorus resorption efficiency (PRE), and DBH increments were, on average, higher in the planted, rather than natural forests. Our results indicated that there was an enhancing P-limitation in both the planted and natural forests, and the plantations were more restricted by P. Moreover, compared to natural forests, plantations converged toward a higher conservative N- and P-use strategy by enhancing resorption efficiencies of internal nutrient cycling and a higher annual growth rate.

1. Introduction

Ecological stoichiometry is a powerful indicator of diverse ecological processes such as energy flow, material cycling, and nutrient limitations across diverse ecosystems [1]. Nitrogen (N) and phosphorus (P) are among the most important nutrients that limit carbon (C) assimilation, plant growth, and other biological processes in terrestrial ecosystems [2]. Numerous studies have indicated that the C:N:P stoichiometry of plants can affect litter decomposition, nutrient cycling, species composition, and plant functionality in forest ecosystems [3,4,5]. Furthermore, the foliar N:P ratio of plant species has been employed as an index of soil nutrient limitations in terrestrial ecosystems [6] since plant C:N:P stoichiometry is sensitive to multiple global change drivers [7,8].
Plants, litter, and soil are three key ecosystem components that organically combine the aboveground and belowground domains of forest ecosystems, while playing vital roles in nutrient cycling and the utilization of adaptive efficiencies and strategies in response to environmental change during stand growth [9]. The organic matter of plants is lost to soils via litterfall following senescence, while soils provide the mineral nutrients required to facilitate plant growth within litter-soil systems [10]. Nutrient resorption (NuR) is an important nutrient conservation strategy [11], which recycles significant quantities of foliar nutrients (N and P) in ecosystems, during the process of leaf senescence [12]. Leaf nutrient resorption efficiency (NuRE) reflects how individual plants cope with nutrient limitations and provides feedbacks on nutrient cycling and plant productivity via litterfall [13,14].
Elevation is a decisive factor that impacts ecosystem properties and processes, particularly in mountainous regions [15], which alters the environment and vegetation type through the modification of a series of factors such as temperature, humidity, and the availability of soil nutrients [16]. Generally, investigations into the nutritional patterns of plants and soils focus primarily on variations in nutrient contents [17]; however, few studies consider this topic from the perspective of elemental stoichiometric ratios [18]. Forest soil characteristics can change with elevation which imparts insights into the variability of dynamic soil element responses to a range of climatic conditions.
One view, which has been supported by most, albeit not all researchers, is that both soil C and N increase with elevation [19,20,21]. As cold weather at high altitudes limits the activities of microbes and reduces soil respiration rates, it decreases the rate of litter decomposition, which includes C and N mineralization [22]. Unlike soil C and N, the efficacy of soil P is more affected by geochemical rock weathering [13]. Furthermore, moisture is a critical influencing factor that impacts soil element dynamics.
Altitude correlated foliar nutrient patterns can vary between regions and meet with ambiguous results. Studies have suggested that leaf C, N, and P contents increase with elevation [23,24]; however, other studies on tropical, subtropical mountains, and subarctic tundra have shown an opposite trend [25]. Leaf nutrient contents and stoichiometry status were primarily attributable to climate, soil type, phylogenetics, and variable ecological histories [26]. Evidence has revealed that climate (mean annual temperature (MAT) and mean annual precipitation (MAP)) was the dominant factor regulating the spatial patterns of plant C:P and N:P ratios, followed by soil [27].
On a global scale, an improved understanding of the relationships between climate factors, foliar N and P contents, and N:P ratios can contribute to a clearer elucidation of the interactive mechanisms at play between plants and their environment. Litter nutrient contents and stoichiometry depend primarily on complex interactions between soil properties, climatic factors, and litter types [28,29]. Both nitrogen (N) and phosphorus (P) contents in litter decrease with elevation [17,30], as do litter mass losses of C [31]; however, other studies have found no change, or even increases in litter N contents with elevation [25].
NuR plays a vital role in maintaining plant stoichiometric balance [12]. Nevertheless, there are few studies on the responses of plant NuR to elevation; however, it has been reported that NuR is largely dependent on the environment in which plants grow [32,33]. A previous study has suggested that along a latitudinal gradient of terrestrial biomes, NRE decreased with higher MAT and MAP, whereas PRE increased with increasing MAT and MAP [34]. However, another study suggested that both NRE and PRE decreased with MAT and MAP [35], Consequently, these inconsistent conclusions regarding PRE will require further examination.
The Larix principis-rupprechtii forest has an important and large distribution area in the Guandishan Mountain reserve, which mainly originated from planted and natural forests. The planted sites were formerly broadleaved, or mixed shrub and herb forests, and following anthropogenic disturbances, including clear-cutting and soil preparation, the seedlings were planted. In recent decades, the reality of ecological deterioration caused by the excessive consumption of natural forest resources in China over a prolonged time period, led the government to take a major decision to protect natural forests by prohibiting anthropogenic disturbances including harvesting, firewood collection, and grazing, which was named the ‘Natural Forest Protection Project’ [20].
Natural forests exhibit excellent dynamic nutrient cycling between the above- and underground components during their long-term adaptation to the environment. In contrast, the dynamic soil nutrient balance of plantations is altered as a consequence of anthropogenic disturbances. Different management regimes might explain the distinct stand origin patterns between planted and natural forests. This paper represents the first contribution toward an elucidation of the relationships between leaf, litter, and soil nutrient contents and stoichiometry along an altitudinal sequence (1700–2300 m) of two origins of Larix principis-rupprechtii at the same stable growth stage in the Guandishan Mountains of the Loess Plateau, China. The primary aims of this study were to:
  • Reveal the elevational and stand origin effects on the C:N:P stoichiometry of leaves, litter, and soil at the community level.
  • Determine the plant nutrient resorption and limiting status.
  • Explore the nutrient conservation strategies of the larch forest in our study region.
To explore the internal relationships between leaf, litter, soil C, N, P, and stoichiometric ratios, resorption, and tree growth, we investigated the above and belowground components of the forest community as an organic whole, and conducted a preliminary study on the mechanisms of nutrient cycling from a stoichiometric perspective. As a fundamental focus of plant nutrient research, nutrient limitation is a common phenomenon in forest ecosystems, where enhancing element resorption is an ecological mechanism for plants to cope with nutrient restriction.
We hypothesized that:
  • Planted forests have higher resorption efficiencies and nutrient limitations than natural forests. From the perspective of leaf economics, if the uptake of nutrients from the soil is too energy-demanding for plants, they might employ an internal nutrient cycling strategy that involves enhanced nutrient resorption. Due to the variable disturbance histories between planted and natural forests, they may have different nutrient conservation strategies.
  • We further hypothesized that: planted forests converged toward a highly conservative nutrient utilization strategy by enhancing nutrient resorption efficiencies; however, natural forests tended to a strategy that improved soil nutrient-status and utilization efficiencies.

2. Materials and Methods

2.1. Study Site

The research was conducted mainly at the Xiaowenshan Forestry Farm in the Guandishanshan Mountains, which is located ~22 km northwest of Jiaocheng County, Shanxi Province, China (Figure 1). The study area is situated in the middle region of the Lvliang mountains, which includes the Pangquangou National Natural Reserve as the center, with six forest farms surrounding it. The total area is 57,200 ha and the altitude ranges from 1360 m to 2839 m. This region has an inner-continental mountain monsoon climate, with a mean annual temperature and precipitation of 4.2 °C and 822.6 mm, respectively.
The soil originated from the granite and gneissic granite of the Archean Era, and brown mountain soil is present within the study area. Larch plantations and natural forests are widespread in this area, and larch was the primary species used for afforestation. The plantations were formerly broadleaved or mixed shrub and herb forests. Following anthropogenic management, which included clear-cutting and soil preparation, the seedlings were planted. A total of 18 larch stands derived from two different origins were distributed across a range at 1700 to 2300 meters above sea level, and all plots were established on the same soil type and texture with similar topography.

2.2. Sampling Design

To examine the elevational and management effects on soil, leaf, and litter C, N, P, we sampled nine stands from both the planted and natural forests, along an elevational gradient, using a stratified random sampling technique. The entire elevation range was partitioned into three segments, where three stands per stand origin were randomly selected from each segment. Every effort was made to ensure that the distance between the stands was greater than 150 m to minimize spatial autocorrelation. Subsequently, for each stand, a sample plot of 20 × 20 m was established, within which all measurements and sampling took place (Table 1).
To determine stand age and diameter growth for each sample plot, 15 trees of different diameters were selected to obtain increment cores at breast height (1.3 m above root collar). For each tree, cores were extracted along with the parallel and vertical slope directions, and 30 cores were obtained in each plot. We obtained tree ring widths for the past 30 years via tree core scanning analysis (EPSON 10000XL) and the software calculation (WINDENDRO) [36]. We use the average of all annual DBH increments (15 trees, two cores for each tree over the past 30 years) as the final DBHi data for each plot.
Leaf, soil and litter samples were collected during late July and early August 2018. Five trees were randomly selected for leaf samples in each sample plot. We collected mature leaves from the upper, middle, and lower crowns (three mixed into one) of healthy and well-spaced dominant trees and the leaves were combined to form one composite leaf sample per tree per plot. At 1.0 m away from the five sample trees, topsoil cores (0–10 cm depth) and topmost litter were sampled. The soil cores were collected from the higher, middle, and lower portions of each soil profile to account for any heterogeneity resulting from soil depth. Similar to leaf samples, soil and litter samples were respectively pooled into composite samples for each plot.
We used the topmost litter as senesced leaves in the resorption efficiency calculation. In most cases, senesced leaves were collected from live plants by shaking and collecting the fallen leaves. However, in some cases, it was not possible to collect senesced leaves directly from live plants; therefore, senesced leaves were collected from beneath the plant from recently fallen litter. During sampling, we collected litter that exhibited no obvious degradation, which had fallen mostly during the summer, and was not affected by significant precipitation scouring during the period between litter fall and collection [14]. Thus, we assumed that the nutrient loss caused by leaching is minimal, although some level of photodegradation might have occurred [37]. All samples were placed in plastic bags and stored at 4 °C pending laboratory analysis.

2.3. Sample Treatments and Determination

The plant and litter samples were dried at 65 °C until a constant weight was attained (the plant samples were initially dried at 105 °C for 15 min), after which the dry materials were crushed and passed through a 100-mesh sieve. The soil samples were air-dried, milled, and sieved through a 100-mesh sieve. The total carbon content within the plants and soil was determined using a total carbon analyzer (MULTIN/C 2100, Konrad-Zuse-Str.1, 07745 Jena/Germany). The total N and P contents were determined according to H2SO4-H2O2 digestion, the Kjeldahl method, as well as the H2SO4-H2O2 digestion and molybdenum antimony colorimetric methods, respectively.

2.4. Statistical Analysis

The nutrient resorption efficiency (NuRE) (and C loss) was calculated as the percentage of reduction in leaf elemental contents, from mature to senesced leaves Equation (1):
NuRE = (Cm – Cs) × 100% / Cm
where Cm is the concentration of a particular nutrient in mature leaves, and Cs is the nutrient concentration of the senesced leaves [13]. The nutrient resorption proficiency corresponded to the nutrient concentration of the senesced leaves [38].
To test the effects of elevation (E, continuous variable) and management (M, natural vs. planted forest) on the soil, litter, and plant stoichiometric characteristics, resorption efficiencies, and annual DBH increment variables, we employed the following model Equation (2):
Yijk = Ei + Mj + E × Mij + ek(ij
where Yijk is a given stoichiometric characteristic, and ek(ij) is the sampling error nested within E and M (k = 1, 2, 3).
We assessed the assumptions of normality, homogeneity, Shapiro-Wilk’’s test, and non-constant error variance tests, respectively, using the ‘car’ package [39]. Analysis of covariance (ANCOVA) was used to determine the effects of elevation, forest management, and their interactions on soil (or leaves and litter) stoichiometric characteristics, the resorption efficiency, and annual DBH increment. All statistical analyses were performed in R 3.6.1 [40].

3. Results

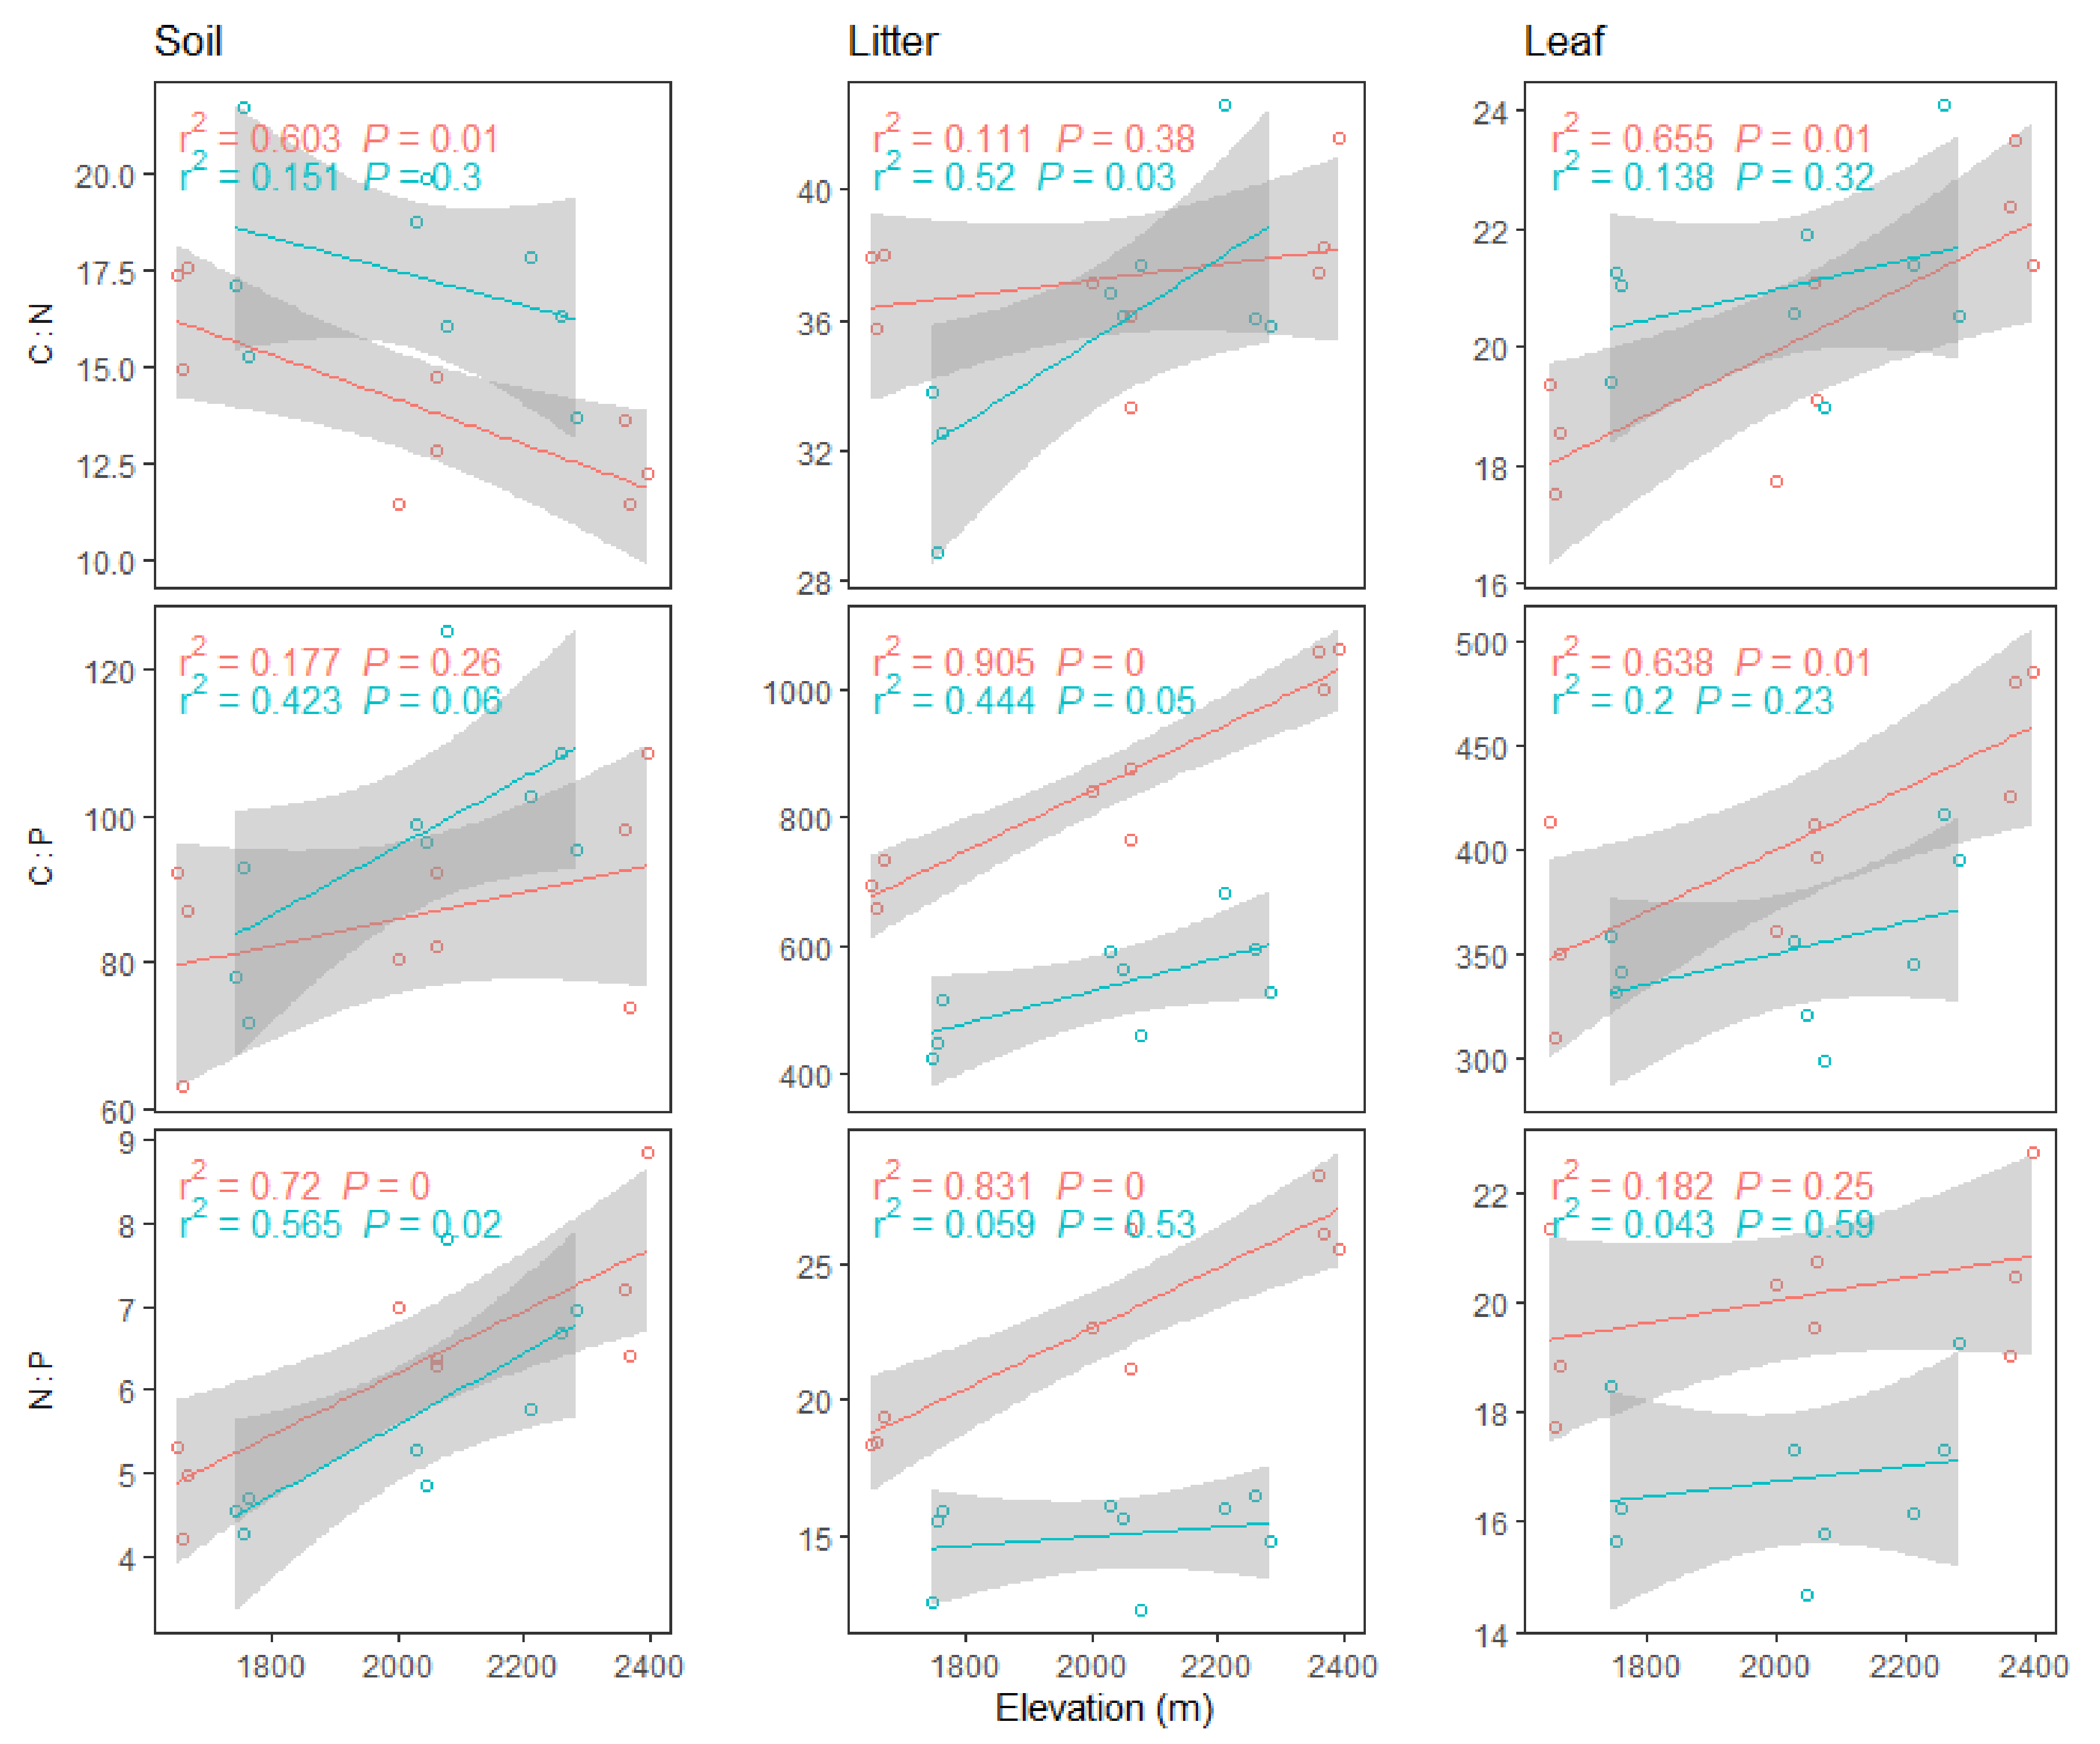
3.1. Altitudinal Patterns of Soil, Litter, and Leaf Carbon (C), Nitrogen (N), and Phosphorus (P) Content

Soil C increased significantly with elevation in both the planted and natural forests, and the rate of increase did not differ significantly between the two stand origins, nor did the average soil C (Figure 2, Table 2). On average, both litter and leaf C also increased significantly or marginally with both origins being pooled, although in some cases, the regressions individually fit for each origin were not statistically significant (Figure 2, Table 2). The soil N also increased with elevation in both the planted and natural forests, which was, on average, higher in the planted than natural forests (Figure 2, Table 2).
The litter N did not change, whereas the leaf N decreased with elevation in both stand origins; however, the litter N revealed only an insignificant declining trend (Figure 2, Table 2). The soil P did not change; however, both the litter and leaf P decreased significantly in both stand origins. Moreover, the litter and leaf P were significantly higher, on average, in natural than planted forests (Figure 2, Table 2). Significant positive correlations between soil C and litter C, soil C, and leaf C, as well as litter P and leaf P were observed under different altitude gradients (Table 3).

3.2. Altitudinal Patterns of Soil, Litter, and Leaf C:N:P Ratios

Overall, the soil C:N decreased significantly with elevation, which was higher, on average, in natural over planted forests (Figure 3, Table 2). Both the litter and leaf C:N also typically increased significantly without differences in the average or response slopes between the two stand origins (Figure 3, Table 2). Both C:P and N:P increased with elevation in the soil, litter, and leaves except for leaf N:P. Moreover, both litter and leaf C:P and N:P were typically higher in planted over natural forests (Figure 3, Table 2). Significant positive correlations were observed between soil N:P and leaf N:P ratios, litter C:P and leaf C:P ratios, litter N:P, and leaf N:P ratios (Table 3).

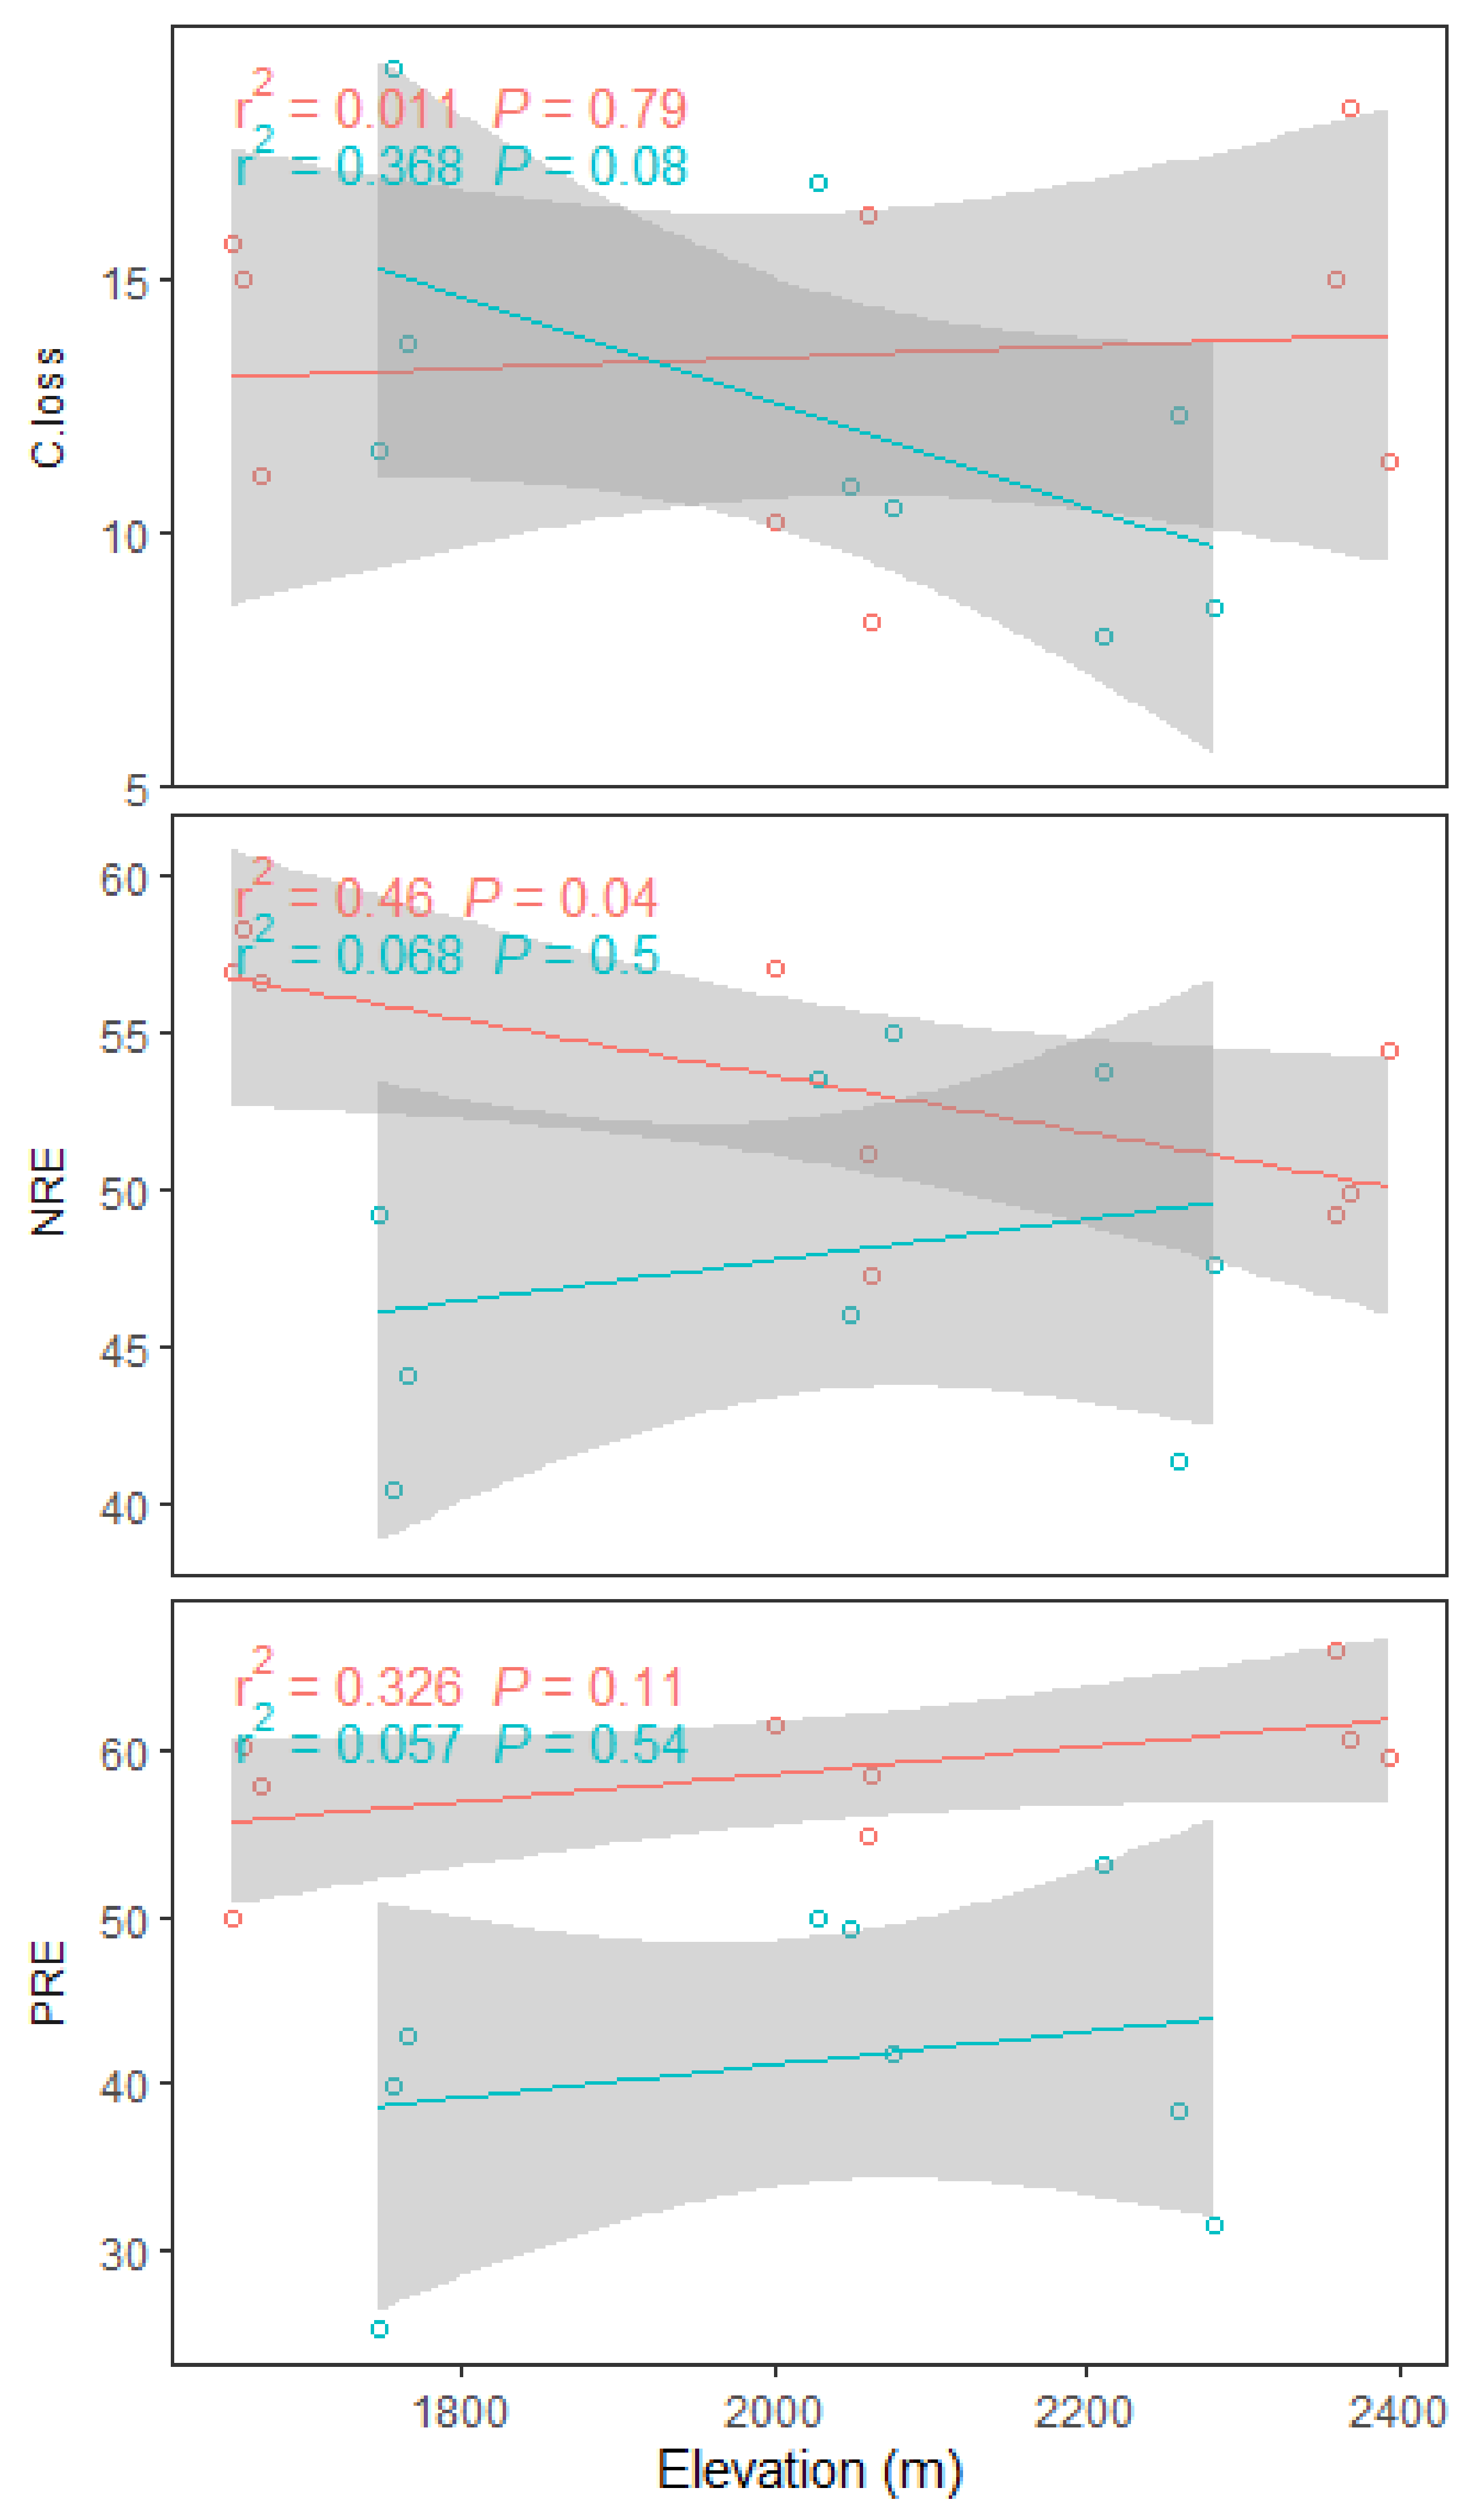
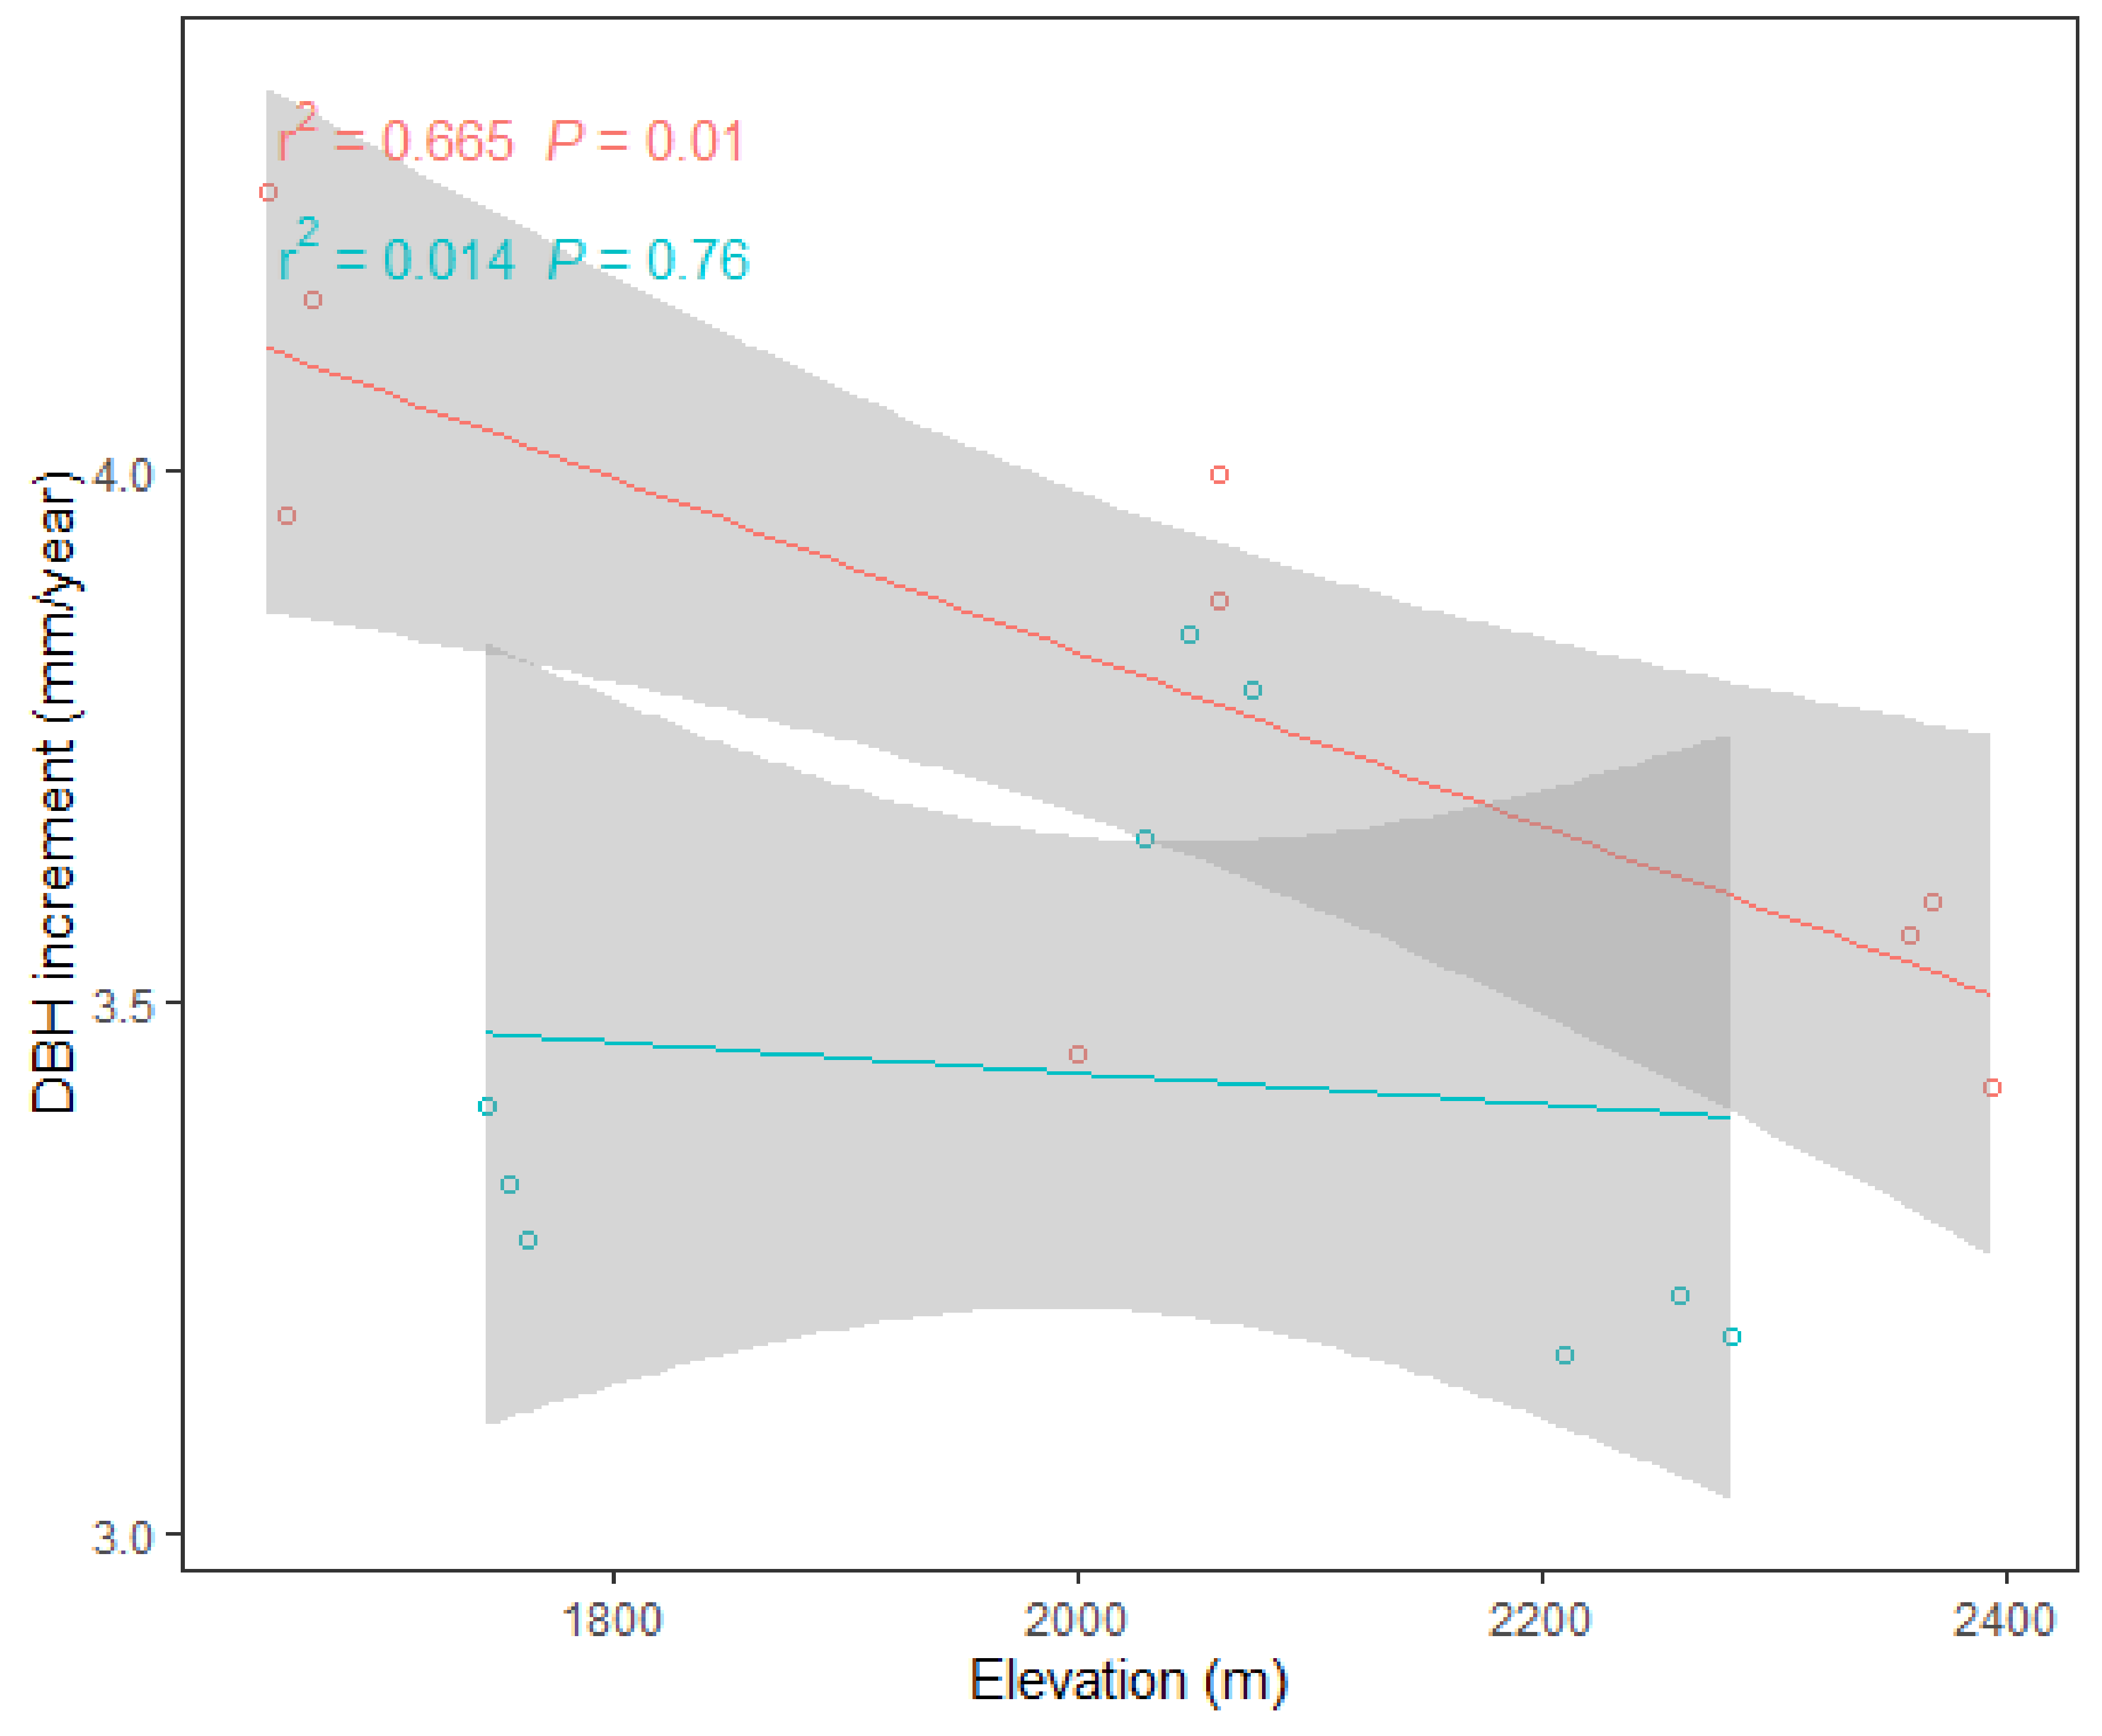
3.3. Effects of Elevation and Forest Management on Leaf Nutrient Resorption Efficiency (NuRE) and Plant Growth

Leaf C loss decreased marginally with elevation in natural forests, but was not altered in planted forests (Figure 4). Overall, both NRE and DBH increments decreased significantly with elevation in planted forests, whereas the leaf PRE did not change with elevation in both the planted and natural forests (Figure 4 and Figure 5). Moreover, NRE, PRE, and DBH increments were higher, on average, in planted forests, in contrast to natural forests (Figure 4 and Figure 5). ANCOVA indicated that elevation and management significantly affected DBH increments, where both NRE and PRE were significantly affected by management (Table 2).

4. Discussion

4.1. Variations of Soil, Litter, and Leaf C, N and P Content, and Ratios and Correlations

In the current study, we found that soil, litter, and leaf C, N, and P content and C:N:P ratios exhibited remarkable altitudinal patterns in the Guandishan Mountains. Soil C and N increased significantly with elevation in both planted and natural forests, which was consistent with previous findings [19]. The accumulation of biological fixation via litterfall and fine root mortality was attributable mainly to soil carbon and nitrogen [41]. In mountainous, forested areas, in particular temperatures decreased gradually with elevation, where lower temperatures can limit the activities of soil microbes, resulting in low litter and organic matter decomposition rates [13,42]. However, the total topsoil P content was basically consistent at all elevations in both the planted and natural forests. This may have been attributable to the source of soil P in natural forests, which originates from a prolonged and relatively stable process of rock weathering [43,44]. This might have explained the lack of changes in total topsoil P and the trends of C:P.
Litter C:N ratios are important factors that impact the decomposition of organic matter and the return of nutrients, whereby higher litter C:N ratios led to lower rates of decomposition and N release [45]. It is believed that there is a relatively fixed ratio between soil C and N (as structural components of soil) in the process of accumulation and consumption, where their responses to changes in the external environment are essentially synchronous [46]. Studies have attributed a relatively constant soil C:N ratio to the coupling of C and N contents in plant litter [47,48]. However, others have reported strong changes in soil C:N:P as a result of disturbances and stand development [49,50,51]. In the current study, we found that topsoil C:N was higher in natural than planted forests, and in both forest types, it decreased significantly with elevation, resulting from a smaller increase in C than N contents. Future studies are needed to better understand how stand origin, stand age and altitudinal change in climate affect the mechanisms associated with soil C and N formation and mineralization.
Soil C:P ratios are indexed to characterize the availability of phosphorus, and soil N:P ratios may be utilized as a measure of N-saturation, indicating the supply of soil nutrient elements in the process of plant growth [52]. The trends of soil C:P and N:P ratios with elevation were similar to the trends of litter and leaves, which all increased with elevation. We might explain these findings by the significant increase of topsoil C and N content, and the decline of litter and leaf P content with elevation. Since the temperature decreased with elevation, the capacity of the topsoil microbial mineralization of soil organic matter was weakened, which resulted in a gradual decrease in the availability of soil nutrients, such as nitrogen and phosphorus [53].
Leaf C increased slightly with elevation in both planted and natural forests, where the increased leaf C concentration was most likely caused by the higher presence of non-structural carbon (NSC), including starch, low molecular weight sugars, and storage lipids [54]. Plants at higher elevations experienced more severe climate and environmental pressures than those at lower elevations; thus, higher NSC contents accumulated to balance the osmotic pressure of cells to resist physiological damage [55,56].
Our results suggested that leaf N and P contents declined with elevation, which was consistent with the results of several previous studies [26,57,58,59,60]. The reduction of the metabolic rates of plants, and limited nutrient availability can interact to shape the altitudinal forms of leaf N and P contents and N:P ratios. Moreover, our results aligned with the predictions of the Biogeochemical Hypothesis [42] and the Growth Rate Hypothesis [61] that leaf N and P decline along elevation gradients, while the N:P ratio increases. At the community level, previous studies found that the N, P, and N:P levels in leaves exhibited high homeostasis, were well regulated, and the active organs of plants often maintained adequate nutritional levels.
This is a unique mechanism that evolves over long-term exposure to environmental changes [27]. Meanwhile, the leaf N:P ratio patterns found in our study also confirmed the growth rule based on studies, which found that leaf N:P ratios were inversely proportional to growth rates [62,63]. Leaf N:P ratios are employed to indicate N or P limitations, that is, N:P < 14 designates N limitation, N:P > 16 signifies P limitation, and 14 < N:P < 16 indicates that a plant is co-limited by N and P [64,65]. In this study, the average leaf N:P ratios ranged from 15.92 in natural forests at a middle altitude to 20.73 in plantations at a high altitude, which also suggested a strengthened P limitation with elevation in this region.
Terrestrial plants acquire most of their nutrient minerals from the soil, where soil chemicals play a vital role in plant growth and influence the distribution of minerals in plants [66,67,68]. Previous studies have demonstrated intimate links between C, N, and P in soils or plants [69], where most plant nutrients are limited by their availability in the soil [70,71]. Our results suggested that plant N:P ratios were intimately correlated with soil N:P ratios both in plantations and natural forests. Similarly, previous studies have reported significant correlations between topsoil stoichiometric ratios and foliar C:N, C:P, and N:P ratios [60,72]. Collectively, these findings indicated that the nutrient content of leaves might respond to variations in soil nutrient ratios, rather than the change of single nutrient supply. Moreover, the retranslocation of nutrients between soil and plants in forest ecosystems confirms these relationships [73].

4.2. Response of NuRE and Growth to Elevation and Forest Management Indicates a Nutrient Conservation Strategy

The different NuRE patterns reflected the influences of several coupling factors, such as climate, soil, genetic variation, and disturbance history. Improving our knowledge of resorption may provide critical data regarding nutrient conservation strategies [12]. The loss of leaf C remained constant with elevation in our study, which could be attributed to relatively stable carbon as a structural element, whether in green or senesced leaves. Previous studies found that the effects of the environment on NuRE were, in some respects, even more potent than genetics where climate was a primary driver [12]. However, the more generally accepted view is that NRE decreases with higher (MAT) and (MAP) [74]; however, PRE increases with higher MAT and MAP [34].
Our study suggested that the NRE in natural forests and PRE in both planted and natural forests showed negligible variations with elevation; however, NER decreased significantly with elevation in planted forests. This was somewhat inconsistent with the studies above, which might be attributed to the counteracting influences between lower temperature (MAT) and higher precipitation (MAP) on NuRE caused by higher elevations. However, for the NRE in planted forests, perhaps the effect of precipitation (MAP) on NRE was much higher than temperature (MAT), which resulted in a significant decrease in NRE with elevation.
A significant decrease in the DBH increment with elevation was found in our study, which could be attributed to environmental conditions. As is known, plants suffer through harsher environmental stresses with higher elevations in mountainous regions, which include lower air temperature, soil nutrient availability, and increasing relative humidity [16]. To survive under low-temperature stress and nutrient-limiting conditions, plants tend to have a reduced growth rate [75]. We found that the DBH increment was higher on average in planted than natural forests, and the significant effect of management on the DBH increment also confirmed this trend (Table 2).
This might be attributed, on the one hand, to the effects of stand origin and age, as plantations were managed by anthropogenic disturbances, including clear-cutting and soil preparation prior to planting. On the other hand, natural forests were first-generation and older than plantations, which grew along with other trees, shrubs, herbs, etc. during all plant developmental stages. Consequently, natural forests suffered more intense competition than planted forests, which resulted in lower growth rates. The difference in DBH increment between natural and planted forests could also be attributed to younger plantations versus older natural stands (Table 1) since individual tree and forest growth decline with stand age [76,77]. However, the stand structures of natural forests are complex, species diversity is rich, and soil fertility is relatively high.
Therefore, in contrast to plantations, natural forests form a self-regulating mechanism through strengthening nutrient absorption from the soil, rather than enhancing the NuRE. Meanwhile, the rapid growth of plantations may lead to higher soil nutrient demands, which subsequently exacerbate nutrient limitations. Under such circumstances, toward improving the utilization efficiency of nutrients while ensuring stand growth, planted forests would adopt strategies to enhance resorption efficiencies from senescent organs, as a response to nutrient shortages. This is consistent with our second hypothesis that planted and natural forests converged toward different nutrient utilization strategies. Earlier studies suggested that coniferous trees absorb nutrients from older leaves to promote tissue growth, resulting in positive relationships between basal area increments and the resorption efficiencies of N and P from needles [51]. Furthermore, both soil fertility and stand age may play roles in plant NuRE [12]. Studies have revealed negative correlations between NRE and PRE with stand age [78,79,80]. We note that many physiological changes occur with plant age that are not completely understood [76]. We recommend that future studies be designed to explicitly include age as a variable independent of management.
The relationships between growth and NuRE, as well as stand age and NuRE confirmed our results that planted forests represented a higher growth rate, higher NRE and PRE, and suffered stronger P limitations than natural forests in the region. This result supports our first hypothesis that planted forests have higher P limitations and NuRE. In summary, such adaptive strategies allow plants to adjust their bioelemental stoichiometric ratios to optimize the investment of nutrients and energy for growth and survival [75,81].

5. Conclusions

This study represents an advance in understanding the altitude-related patterns of C:N:P stoichiometry, resorption efficiency, and growth between two origins of larch forests on the Loess Plateau, where significant variations were found with elevation. Our results highlighted the comparison of planted and natural forests, and suggested that plantations converged toward a higher nutrient resorption efficiency and a higher growth rate than natural forests. This indicated that there were differences in responses to nutrient restriction and conservation strategies between them. Plantations engaged a highly conservative strategy by enhancing nutrient resorption efficiencies; however, natural forests employed strategies for improving the soil nutrient-status and utilization efficiencies. Moreover, the leaf N:P ratios in both origins of forests were higher than 16, and significantly higher in planted than natural forests, which suggested P limitations in both planted and natural forests, with plantations being more restricted by P in our study. This finding has important implications for forest management practices of larch plantations in this region.

Author Contributions

J.G. and Y.Z. conceived and designed the experiments; F.B., X.R. and P.W. performed the experiments; F.B. and Y.Z. collected and analyzed the data; F.B. and H.Y.H.C. wrote the manuscript. All authors have read and agreed to the published version of the manuscript.

Funding

This research received no external funding.

Acknowledgments

Thanks to W. W., N. B., X. L., S. L., X. Y., J. F., H. Z. and R. H. for their help with the field sampling and laboratory analyses. This work was supported by the National Natural Science Foundation of China (No. 30970480), and the Shanxi Key Technology Research and Development Program of China (2018LYCX32).

Conflicts of Interest

The authors declare no conflicts of interest.

References

  1. Elser, J.J.; Dobberfuhl, D.R.; Mackay, N.A.; Schampel, J.H. Organism size, life history, and n:P stoichiometrytoward a unified view of cellular and ecosystem processes. Bioscience 1996, 46, 674–684. [Google Scholar] [CrossRef] [Green Version]
  2. Elser, J.J.; Bracken, M.E.; Cleland, E.E.; Gruner, D.S.; Harpole, W.S.; Hillebrand, H.; Ngai, J.T.; Seabloom, E.W.; Shurin, J.B.; Smith, J.E. Global analysis of nitrogen and phosphorus limitation of primary producers in freshwater, marine and terrestrial ecosystems. Ecol. Lett. 2007, 10, 1135–1142. [Google Scholar] [CrossRef] [PubMed] [Green Version]
  3. Gusewell, S. High nitrogen: Phosphorus ratios reduce nutrient retention and second-year growth of wetland sedges. New Phytol. 2005, 166, 537–550. [Google Scholar] [CrossRef] [PubMed]
  4. Zhang, H.; Wu, H.; Yu, Q.; Wang, Z.; Wei, C.; Long, M.; Kattge, J.; Smith, M.; Han, X. Sampling date, leaf age and root size: Implications for the study of plant c:N:P stoichiometry. PLoS ONE 2013, 8, e60360. [Google Scholar] [CrossRef] [PubMed] [Green Version]
  5. Cui, Y.X.; Fang, L.C.; Deng, L.; Guo, X.B.; Han, F.; Ju, W.L.; Wang, X.; Chen, H.S.; Tan, W.F.; Zhang, X.C. Patterns of soil microbial nutrient limitations and their roles in the variation of soil organic carbon across a precipitation gradient in an arid and semi-arid region. Sci. Total Environ. 2019, 658, 1440–1451. [Google Scholar] [CrossRef] [PubMed]
  6. Sardans, J.; Janssens, I.A.; Alonso, R.; Veresoglou, S.D.; Rillig, M.C.; Sanders, T.G.M.; Carnicer, J.; Filella, I.; Farre-Armengol, G.; Penuelas, J. Foliar elemental composition of european forest tree species associated with evolutionary traits and present environmental and competitive conditions. Glob. Ecol. Biogeogr. 2015, 24, 240–255. [Google Scholar] [CrossRef] [Green Version]
  7. Yuan, Z.Y.; Chen, H.Y.H. Decoupling of nitrogen and phosphorus in terrestrial plants associated with global changes. Nat. Clim. Change 2015, 5, 465–469. [Google Scholar] [CrossRef]
  8. Tian, D.; Reich, P.B.; Chen, H.Y.H.; Xiang, Y.; Luo, Y.; Shen, Y.; Meng, C.; Han, W.; Niu, S. Global changes alter plant multi-element stoichiometric coupling. New Phytol. 2019, 221, 807–817. [Google Scholar] [CrossRef]
  9. Wardle, D.A.; Bardgett, R.D.; Klironomos, J.N.; Setala, H.; Van der Putten, W.H.; Wall, D.H. Ecological linkages between aboveground and belowground biota. Science 2004, 304, 1629–1633. [Google Scholar] [CrossRef]
  10. Lambers, H.; Mougel, C.; Jaillard, B.; Hinsinger, P. Plant-microbe-soil interactions in the rhizosphere: An evolutionary perspective. Plant Soil 2009, 321, 83–115. [Google Scholar] [CrossRef]
  11. Aerts, R. Nutrient resorption from senescing leaves of perennials: Are there general patterns? J. Ecol. 1996, 84, 597–608. [Google Scholar] [CrossRef]
  12. Brant, A.N.; Chen, H.Y.H. Patterns and mechanisms of nutrient resorption in plants. Crit. Rev. Plant Sci. 2015, 34, 471–486. [Google Scholar] [CrossRef]
  13. Aerts, R.; Chapin, F. The mineral nutrition of wild plants revisited: A re-evaluation of processes and patterns. Adv. Ecol. Res. 1999, 30, 1–67. [Google Scholar]
  14. Hayes, P.; Turner, B.L.; Lambers, H.; Laliberte, E. Foliar nutrient concentrations and resorption efficiency in plants of contrasting nutrient-acquisition strategies along a 2-million-year dune chronosequence. J. Ecol. 2014, 102, 396–410. [Google Scholar] [CrossRef]
  15. Mayor, J.R.; Sanders, N.J.; Classen, A.T.; Bardgett, R.D.; Clement, J.C.; Fajardo, A.; Lavorel, S.; Sundqvist, M.K.; Bahn, M.; Chisholm, C.; et al. Elevation alters ecosystem properties across temperate treelines globally. Nature 2017, 542, 91–95. [Google Scholar] [CrossRef] [Green Version]
  16. Piaget, A. Mountain weather and climate. EOS Trans. AGU 1982, 63, 1225. [Google Scholar] [CrossRef]
  17. Sundqvist, M.K.; Sanders, N.J.; Wardle, D.A. Community and ecosystem responses to elevational gradients: Processes, mechanisms, and insights for global change. Annu. Rev. Ecol. Evol. S. 2013, 44, 261–280. [Google Scholar] [CrossRef] [Green Version]
  18. Sundqvist, M.K.; Giesler, R.; Wardle, D.A. Within- and across-species responses of plant traits and litter decomposition to elevation across contrasting vegetation types in subarctic tundra. PLoS ONE 2011, 6, e27056. [Google Scholar] [CrossRef] [Green Version]
  19. He, X.; Hou, E.; Liu, Y.; Wen, D. Altitudinal patterns and controls of plant and soil nutrient concentrations and stoichiometry in subtropical china. Sci. Rep. 2016, 6, 24261. [Google Scholar] [CrossRef] [Green Version]
  20. Ouyang, Z.; Zheng, H.; Xiao, Y.; Polasky, S.; Liu, J.; Xu, W.; Wang, Q.; Zhang, L.; Xiao, Y.; Rao, E.; et al. Improvements in ecosystem services from investments in natural capital. Science 2016, 352, 1455–1459. [Google Scholar] [CrossRef]
  21. Graham, H. Ecological stoichiometry: Biology of elements from molecules to the biosphere. J. Plankton Res. 2002, 25, 1183. [Google Scholar]
  22. Boczulak, S.A.; Hawkins, B.J.; Maynard, D.G.; Roy, R. Long- and short-term temperature differences affect organic and inorganic nitrogen availability in forest soils. Can. J. Soil Sci. 2015, 95, 77–86. [Google Scholar] [CrossRef] [Green Version]
  23. Macek, P.; Klimeš, L.; Adamec, L.; Doležal, J.; Chlumská, Z.; De Bello, F.; Dvorský, M.; Řeháková, K. Plant nutrient content does not simply increase with elevation under the extreme environmental conditions of ladakh, nw himalaya. Arct. Antarc. Alpine Res. 2018, 44, 62–66. [Google Scholar] [CrossRef] [Green Version]
  24. Krner, C. The nutritional status of plants from high altitudes-a worldwide comparison. Oecologia 1989, 81, 379–391. [Google Scholar] [CrossRef] [PubMed]
  25. Van de Weg, M.J.; Meir, P.; Grace, J.; Atkin, O.K. Altitudinal variation in leaf mass per unit area, leaf tissue density and foliar nitrogen and phosphorus content along an amazon-andes gradient in peru. Plant Ecol. Div. 2009, 2, 243–254. [Google Scholar] [CrossRef]
  26. Sardans, J.; Rivas-Ubach, A.; Penuelas, J. Factors affecting nutrient concentration and stoichiometry of forest trees in catalonia (ne spain). For. Ecol. Manag. 2011, 262, 2024–2034. [Google Scholar] [CrossRef]
  27. Zhang, J.H.; Zhao, N.; Liu, C.C.; Yang, H.; Li, M.L.; Yu, G.R.; Wilcox, K.; Yu, Q.; He, N.P. C:N:P stoichiometry in china’s forests: From organs to ecosystems. Funct. Ecol. 2018, 32, 50–60. [Google Scholar] [CrossRef]
  28. Murphy, K.L.; Klopatek, J.M.; Klopatek, C.C. The effects of litter quality and climate on decomposition along an elevational gradient. Ecol. Appl. 1998, 8, 1061–1071. [Google Scholar] [CrossRef]
  29. Aerts, R. Climate, leaf litter chemistry and leaf litter decomposition in terrestrial ecosystems: A triangular relationship. Oikos 1997, 79, 439–449. [Google Scholar] [CrossRef]
  30. Tanner, E.V.J.; Vitousek, P.M.; Cuevas, E. Experimental investigation of nutrient limitation of forest growth on wet tropical mountains. Ecology 1998, 79, 10. [Google Scholar] [CrossRef]
  31. Xu, G.P.; Hu, Y.G.; Wang, S.P.; Zhang, Z.H.; Chang, X.F.; Duan, J.C.; Luo, C.Y.; Chao, Z.G.; Su, A.L.; Lin, Q.Y.; et al. Effects of litter quality and climate change along an elevation gradient on litter mass loss in an alpine meadow ecosystem on the tibetan plateau. Plant Ecol. 2010, 209, 257–268. [Google Scholar] [CrossRef]
  32. Agren, G.I.; Weih, M. Plant stoichiometry at different scales: Element concentration patterns reflect environment more than genotype. New Phytol. 2012, 194, 944–952. [Google Scholar] [CrossRef] [PubMed]
  33. Zhou, W.; Wang, Z.; Xing, W.; Liu, G. Plasticity in latitudinal patterns of leaf n and p of oryza rufipogon in china. Plant Biol. 2014, 16, 917–923. [Google Scholar] [CrossRef] [PubMed]
  34. Yuan, Z.Y.; Chen, H.Y.H. Global-scale patterns of nutrient resorption associated with latitude, temperature and precipitation. Glob. Ecol. Biogeogr. 2009, 18, 11–18. [Google Scholar] [CrossRef]
  35. Vergutz, L.; Manzoni, S.; Porporato, A.; Novais, R.F.; Jackson, R.B. Global resorption efficiencies and concentrations of carbon and nutrients in leaves of terrestrial plants. Ecol. Monogr. 2012, 82, 205–220. [Google Scholar] [CrossRef] [Green Version]
  36. Shumilov, O.; Kanatjev, A.; Kasatkina, E. A measuring tool for tree-rings analysis. Geophys. Res. Abstr. 2013, 15, 2347. [Google Scholar]
  37. Austin, A.T.; Vivanco, L. Plant litter decomposition in a semi-arid ecosystem controlled by photodegradation. Nature 2006, 442, 555–558. [Google Scholar] [CrossRef]
  38. Killingbeck, K.T. Nutrients in senesced leaves: Keys to the search for potential resorption and resorption proficiency. Ecology 1996, 77, 1716–1727. [Google Scholar] [CrossRef]
  39. Fox, J.; Weisberg, S.; Adler, D.; Bates, D.; Baud-Bovy, G.; Ellison, S.; Firth, D.; Friendly, M.; Gorjanc, G.; Graves, S. Package ‘car’; R Foundation for Statistical Computing: Vienna, Austria, 2012. [Google Scholar]
  40. R Development Core Team. R: A Language and Environment for Statistical Computing, 3.6.0; R Foundation for Statistical Computing: Vienna, Austria, 2019; Available online: http://www.Rproject.org/ (accessed on 24 March 2020).
  41. Wardle, D.A.; Hornberg, G.; Zackrisson, O.; Kalela-Brundin, M.; Coomes, D.A. Long-term effects of wildfire on ecosystem properties across an island area gradient. Science 2003, 300, 972–975. [Google Scholar] [CrossRef]
  42. Reich, P.B.; Oleksyn, J. Global patterns of plant leaf n and p in relation to temperature and latitude. Proc. Natl. Acad. Sci. USA 2004, 101, 11001–11006. [Google Scholar] [CrossRef] [Green Version]
  43. Walbridge, M.R.; Richardson, C.J.; Swank, W.T. Vertical distribution of biological and geochemical phosphorus subcycles in two southern appalachian forest soils. Biogeochemistry 1991, 13, 61–85. [Google Scholar] [CrossRef]
  44. Tiessen, H.; Stewart, J.W.B.; Cole, C.V. Pathways of phosphorus transformations in soils of differing pedogenesis1. Soil Sci. Soc. Am. J. 1984, 48, 853. [Google Scholar] [CrossRef]
  45. Leitner, S.; Wanek, W.; Wild, B.; Haemmerle, I.; Kohl, L.; Keiblinger, K.M.; Zechmeister-Boltenstern, S.; Richter, A. Influence of litter chemistry and stoichiometry on glucan depolymerization during decomposition of beech (fagus sylvatica l.) litter. Soil Biol. Biochem. 2012, 50, 174–187. [Google Scholar] [CrossRef] [PubMed] [Green Version]
  46. Cleveland, C.C.; Liptzin, D. C:N:P stoichiometry in soil: Is there a “redfield ratio” for the microbial biomass? Biogeochemistry 2007, 85, 235–252. [Google Scholar] [CrossRef]
  47. Mcgroddy, M.E.; Daufresne, T.; Hedin, L.O. Scaling of c:N:P stoichiometry in forests worldwide: Implications of terrestrial redfield-type ratios. Ecology 2004, 85, 2390–2401. [Google Scholar] [CrossRef]
  48. Yang, Y.; Luo, Y. Carbon: Nitrogen stoichiometry in forest ecosystems during stand development. Glob. Ecol. Biogeogr. 2011, 20, 354–361. [Google Scholar] [CrossRef]
  49. Hume, A.; Chen, H.Y.H.; Taylor, A.R.; Kayahara, G.J.; Man, R.Z. Soil c:N:P dynamics during secondary succession following fire in the boreal forest of central canada. For. Ecol. Manag. 2016, 369, 1–9. [Google Scholar] [CrossRef]
  50. Hume, A.M.; Chen, H.Y.H.; Taylor, A.R. Intensive forest harvesting increases susceptibility of northern forest soils to carbon, nitrogen and phosphorus loss. J. Appl. Ecol. 2018, 55, 246–255. [Google Scholar] [CrossRef] [Green Version]
  51. Smethurst, P.J.; Sadanandan Nambiar, E.K. Changes in soil carbon and nitrogen during the establishment of a second crop of pinus radiata. For. Ecol. Manag. 1995, 73, 145–155. [Google Scholar] [CrossRef]
  52. Stark, S.; Ylanne, H.; Tolvanen, A.T. Long-term warming alters soil and enzymatic n:P stoichiometry in subarctic tundra. Soil Biol. Biochem. 2018, 124, 184–188. [Google Scholar] [CrossRef]
  53. Xu, Z.W.; Yu, G.R.; Zhang, X.Y.; He, N.P.; Wang, Q.F.; Wang, S.Z.; Wang, R.L.; Zhao, N.; Jia, Y.L.; Wang, C.Y. Soil enzyme activity and stoichiometry in forest ecosystems along the north-south transect in eastern china (nstec). Soil Biol. Biochem. 2017, 104, 152–163. [Google Scholar] [CrossRef]
  54. Zhao, N.; He, N.; Wang, Q.; Zhang, X.; Wang, R.; Xu, Z.; Yu, G. The altitudinal patterns of leaf crationratiop stoichiometry are regulated by plant growth form, climate and soil on changbai mountain, china. PLoS ONE 2014, 9, e95196. [Google Scholar]
  55. Hoch, G.; Korner, C. Global patterns of mobile carbon stores in trees at the high-elevation tree line. Glob. Ecol. Biogeogr. 2012, 21, 861–871. [Google Scholar] [CrossRef]
  56. Hoch, G.; Popp, M.; Körner, C. Altitudinal increase of mobile carbon pools in pinus cembra suggests sink limitation of growth at the swiss treeline. Oikos 2010, 98, 361–374. [Google Scholar] [CrossRef]
  57. Santiago, L.S.; Kitajima, K.; Wright, S.J.; Mulkey, S.S. Coordinated changes in photosynthesis, water relations and leaf nutritional traits of canopy trees along a precipitation gradient in lowland tropical forest. Oecologia 2004, 139, 495–502. [Google Scholar] [CrossRef] [Green Version]
  58. Sandel, B.; Goldstein, L.J.; Kraft, N.J.; Okie, J.G.; Shuldman, M.I.; Ackerly, D.D.; Cleland, E.E.; Suding, K.N. Contrasting trait responses in plant communities to experimental and geographic variation in precipitation. New Phytol. 2010, 188, 565–575. [Google Scholar] [CrossRef]
  59. Han, W.; Fang, J.; Guo, D.; Zhang, Y. Leaf nitrogen and phosphorus stoichiometry across 753 terrestrial plant species in china. New Phytol. 2005, 168, 377–385. [Google Scholar] [CrossRef]
  60. Müller, M.; Oelmann, Y.; Schickhoff, U.; Böhner, J.; Scholten, T. Himalayan treeline soil and foliar c:N:P stoichiometry indicate nutrient shortage with elevation. Geoderma 2017, 291, 21–32. [Google Scholar] [CrossRef] [Green Version]
  61. Matzek, V.; Vitousek, P.M. N:P stoichiometry and protein:Rna ratios in vascular plants: An evaluation of the growth-rate hypothesis. Ecol. Lett. 2009, 12, 765–771. [Google Scholar] [CrossRef]
  62. Agren, G.I. The c:N:P stoichiometry of autotrophs–theory and observations. Ecol. Lett. 2010, 7, 185–191. [Google Scholar] [CrossRef]
  63. Elser, J.J.; Fagan, W.F.; Kerkhoff, A.J.; Swenson, N.G.; Enquist, B.J. Biological stoichiometry of plant production: Metabolism, scaling and ecological response to global change. New Phytol. 2010, 186, 593–608. [Google Scholar] [CrossRef] [PubMed] [Green Version]
  64. Dj, T.J.R. Use of nitrogen to phosphorus ratios in plant tissue as an indicator of nutrient limitation and nitrogen saturation. J. Appl. Ecol. 2003, 40, 523–534. [Google Scholar]
  65. Reich, P.B. Global biogeography of plant chemistry: Filling in the blanks. New Phytol. 2010, 168, 263–266. [Google Scholar] [CrossRef] [PubMed]
  66. Crews, T.E.; Kitayama, K.; Fownes, J.H.; Riley, R.H.; Herbert, D.A.; Muellerdombois, D.; Vitousek, P.M. Changes in soil-phosphorus fractions and ecosystem dynamics across a long chronosequence in hawaii. Ecology 1995, 76, 1407–1424. [Google Scholar] [CrossRef]
  67. Vitousek, P.M.; Porder, S.; Houlton, B.Z.; Chadwick, O.A. Terrestrial phosphorus limitation: Mechanisms, implications, and nitrogen-phosphorus interactions. Ecol. Appl. 2010, 20, 5–15. [Google Scholar] [CrossRef] [Green Version]
  68. Lynch, J.P.; St Clair, S.B. Mineral stress: The missing link in understanding how global climate change will affect plants in real world soils. Field Crop Res. 2004, 90, 101–115. [Google Scholar] [CrossRef]
  69. Liao, Y.C.; McCormack, M.L.; Fan, H.B.; Wang, H.M.; Wu, J.P.; Tu, J.; Liu, W.F.; Guo, D.L. Relation of fine root distribution to soil c in a cunninghamia lanceolata plantation in subtropical china. Plant Soil 2014, 381, 225–234. [Google Scholar] [CrossRef]
  70. Bui, E.N.; Henderson, B.L. C:N:P stoichiometry in australian soils with respect to vegetation and environmental factors. Plant Soil 2013, 373, 553–568. [Google Scholar] [CrossRef]
  71. Townsend, A.R.; Cleveland, C.C.; Asner, G.P.; Bustamante, M.M. Controls over foliar n:P ratios in tropical rain forests. Ecology 2007, 88, 107–118. [Google Scholar] [CrossRef]
  72. Bowman, W.D.; Theodose, T.A.; Schardt, J.C.; Conant, R.T. Constraints of nutrient availability on primary production in two alpine tundra communities. Ecology 1993, 74, 2085–2097. [Google Scholar] [CrossRef] [Green Version]
  73. Fife, D.N.; Nambiar, E.K.; Saur, E. Retranslocation of foliar nutrients in evergreen tree species planted in a mediterranean environment. Tree Physiol. 2008, 28, 187–196. [Google Scholar] [CrossRef] [PubMed] [Green Version]
  74. Oleksyn, J.; Reich, P.B.; Zytkowiak, R.; Karolewski, P.; Tjoelker, M.G. Nutrient conservation increases with latitude of origin in european pinus sylvestris populations. Oecologia 2003, 136, 220–235. [Google Scholar] [CrossRef] [PubMed]
  75. Wright, I.J.; Reich, P.B.; Westoby, M.; Ackerly, D.D.; Baruch, Z.; Bongers, F.; Cavender-Bares, J.; Chapin, T.; Cornelissen, J.H.; Diemer, M.; et al. The worldwide leaf economics spectrum. Nature 2004, 428, 821–827. [Google Scholar] [CrossRef]
  76. Binkley, D.; Stape, J.L.; Ryan, M.G.; Barnard, H.R.; Fownes, J. Age-related decline in forest ecosystem growth: An individual-tree, stand-structure hypothesis. Ecosystems 2002, 5, 58–67. [Google Scholar] [CrossRef]
  77. Searle, E.B.; Chen, H.Y.H. Complementarity effects are strengthened by competition intensity and global environmental change in the central boreal forests of canada. Ecol. Lett. 2020, 23, 79–87. [Google Scholar] [CrossRef] [PubMed]
  78. Yuan, Z.Y.; Chen, H.Y.H. Changes in nitrogen resorption of trembling aspen (populus tremuloides) with stand development. Plant Soil 2010, 327, 121–129. [Google Scholar] [CrossRef]
  79. Li, Y.; Chen, J.; Cui, J.; Zhao, X.; Zhang, T. Nutrient resorption in Caragana microphylla along a chronosequence of plantations: Implications for desertified land restoration in North China. Ecol. Eng. 2013, 53, 299–305. [Google Scholar] [CrossRef]
  80. Ye, G.F.; Zhang, S.J.; Zhang, L.H.; Lin, Y.M.; Wei, S.D.; Liao, M.M.; Lin, G.H. Age-related changes in nutrient resorption patterns and tannin concentration of casuarina equisetifolia plantations. J. Trop. For. Sci. 2012, 24, 546–556. [Google Scholar]
  81. Westoby, M.; Wright, I.J. Land-plant ecology on the basis of functional traits. Trends Ecol. Evol. 2006, 21, 261–268. [Google Scholar] [CrossRef]
Figure 1. Study area and sampling sites along the altitudinal gradients of Guandishan Mountain, China.
Forests 11 00363 g001
Figure 2. Changes in soil, litter and leaf carbon (C), nitrogen (N), and phosphorus (P) contents with altitudinal gradients for two stand origins of Larix principis-rupprechtii forests (red and blue are planted and natural, respectively). Lines and shade represent fitted regressions and corresponding 95% confidence intervals.
Forests 11 00363 g002
Figure 3. Changes in soil, litter, and leaf C:N:P ratios with elevation for two origins of Larix principis-rupprechtii forests (red and blue are planted and natural, respectively). Lines and shade represent fitted regressions and corresponding 95% confidence intervals.
Forests 11 00363 g003
Figure 4. Changes in nutrient resorption efficiency (NuRE) with elevation for two origins of Larix principis-rupprechtii forests (red and blue are planted and natural, respectively). Lines and shade represent fitted regressions and corresponding 95% confidence intervals.
Forests 11 00363 g004
Figure 5. Changes in annual DBH increment with elevation for two origins of Larix principis-rupprechtii forests (red and blue are planted and natural, respectively). Lines and shade represent fitted regressions and corresponding 95% confidence intervals.
Forests 11 00363 g005
Table 1. Characteristics of study stands on Guandishan Mountain, Shanxi, China.
OriginAltitude GradientAltitude (m) Slope
Aspect
Slope Degree Mean Tree Age (Years) Mean Tree DBH (cm) Mean Tree Height (m) Stand Density (Trees per Hectare) Canopy Cover
PlantationP-H11694.16Shady slope17.004124.5518.289250.57
P-H22031.52semi-shady slope18.003923.3617.9711580.61
P-H32330.19semi-shady slope24.004122.4815.7111900.69
Natural ForestN-H11732.07Shady slope19.006633.1023.618750.52
N-H22030.74Shady slope22.006334.6323.0010500.53
N-H32293.56semi-shady slope21.006531.6425.1210900.67
Table 2. Effects of E (elevation) and M (management) on soil, litter, and leaf C, N, and P content, and C:N:P stoichiometry, DBHi (DBH increment), C loss, NRE (nitrogen resorption efficiency), and PRE (phosphorus resorption efficiency) as evaluated by analysis of covariance ANCOVA.
AttributeEME × M
FPFPFP
Soil C21.8<0.001<0.10.8743.20.096
Soil N49.2<0.00114.80.0020.10.734
Soil P0.50.5023.40.085<0.10.959
Soil C:N8.10.01312.10.0040.10.735
Soil C:P5.20.0393.00.1081.30.278
Soil N:P26.1<0.0012.50.1380.10.746
Litter C4.50.0530.10.7152.70.120
Litter N1.60.2312.40.1411.60.232
Litter P13.90.00268.6<0.001<0.10.952
Litter C:N5.90.0291.90.1874.00.065
Litter C:P55.6<0.001131.4<0.0013.60.079
Litter N:P28.8<0.001103.5<0.0018.30.012
Leaf C6.70.0210.60.4530.10.740
Leaf N9.10.0094.00.0661.50.248
Leaf P9.40.0088.00.0140.60.434
Leaf C:N11.80.0042.20.1641.10.309
Leaf C:P14.10.0029.10.0091.10.312
Leaf N:P1.90.18922.3<0.0010.10.825
DBHi6.80.02011.40.0052.00.182
C loss0.70.4160.50.4933.00.108
NRE0.80.3936.70.0212.90.109
PRE1.90.19126.5<0.001<0.10.912
Table 3. Coefficients of correlations for C, N, and P contents and their ratios between ecosystem components.
Components C N P C:N C:P N:P
Soil vs. litter0.51 *−0.24−0.46−0.35−0.060.44
Soil vs. leaf0.49 *−0.18−0.430.010.030.49 *
Litter vs. leaf0.30.050.65 **0.080.73 ***0.69 **
Asterisks (*) show significant correlations at p < 0.05, double asterisks (**) show significant correlations at p < 0.01, and triple asterisks (***) show significant correlations at p < 0.001.

