Nitrogen Rate Increase Not Required for No-Till Wheat in Cool and Humid Conditions
by
 ,
,
Juan Manuel Herrera
1,*, 
Christos Noulas
2 ,
,
Peter Stamp
3,
Lilia Levy-Häner
1,
Didier Pellet
1 and
Ruijun Qin
4 1
Agroscope, CH-1260 Nyon, Switzerland
2
Industrial and Forage Crops Institute, Hellenic Agricultural Organization “DEMETER”, 41335 Larissa, Greece
3
Swiss Federal Institute of Technology, CH-8092 Zürich, Switzerland
4
Hermiston Agricultural Research & Extension Center, Oregon State University, Hermiston, OR 97838, USA
*
Author to whom correspondence should be addressed.
Agronomy 2020, 10(3), 430; https://doi.org/10.3390/agronomy10030430
Submission received: 5 February 2020
/
Revised: 7 March 2020
/
Accepted: 18 March 2020
/
Published: 21 March 2020
(This article belongs to the Special Issue Managing Nitrogen for Agricultural Productivity and Environmental Quality)
Abstract
:An increased nitrogen (N) supply was proposed to avoid grain yield (GY) reductions and successfully implement conservation agriculture (CA). We investigated interactions effects of tillage system and N supply on winter wheat (Triticum aestivum L.) at two sites in the Swiss midlands with no (0 kg N ha−1) and high (150–160 kg N ha−1) N supply using 15N-labelled ammonium nitrate in selected treatments. Wheat’s GY, yield components, N related traits and soil mineral N content (Nmin) under conventional tillage (CT), minimum tillage (MT), and no-tillage (NT) were studied following two preceding crops: oilseed rape (Brassica napus L.) and maize (Zea mays L.). Wheat after oilseed rape had significantly higher GY and biomass than after maize while a yield decrease under NT compared with CT and MT was observed regardless of N supply level. Differences in soil Nmin among tillage systems were seldom found and were inconsistent. No differences in 15N fertilizer recovery were found between NT and CT while residual Nmin after harvest was lower under NT than CT or MT. In conclusion, we did not found consistent reductions in soil N availability and N uptake under NT that would justify an increased N supply for wheat under CA.
1. Introduction
Conventional farming practice, based on intensive tillage and removal of residues from the soil surface, can result in serious soil degradation [1]. Conservation agriculture (CA) has been promoted as an agricultural system that increases agricultural sustainability and has the potential to mitigate greenhouse gas emissions [2,3] and climate change [4]. CA is based on minimizing soil disturbance and using adequate levels of crop residues for soil and water conservation [5]. Reduced tillage systems have been designed to minimize soil disturbance and offer long-term benefits from an improved soil structure [6], restored soil organic carbon stocks, improved soil properties, and reduced soil erosion [7].
Despite the reported benefits of CA, its adoption has been more widespread in semi-arid climates [8] and certain temperate regions [8,9,10] while its adoption in other areas of the world continues to be obstructed by different constraints. Reduced crop yields has been suggested as a major constraint for a larger adoption of CA [11,12,13,14,15,16,17]. One of the factors proposed to explain lower yields under CA is lower available nitrogen (N) during the early growth stages of wheat [18,19,20]. The surface residue under CA may result in significant immobilization of surface-applied N [18]. Therefore, different authors suggested to increase N rate under CA in temperate regions [21]. However, it was reported that the efficiency of applied N is different in various climatic zones: data from over 800 experiments report that on average only 51% of the fertilizer-N applied to cereal crops was recovered by the plant tops and average N fertilizer recoveries can be even lower when applied at high (>150 kg N ha−1) rates [22]. The high variability in N efficiency indicates that our knowledge of optimal fertilizer management of cereals in most agro-climatic zones is still incomplete [23,24,25]. Indeed, it is critical to apply the right type of fertilizer at the right rate, time and place respecting practices that avoid N losses that cause environmental pollution [26]. This makes N management under CA also challenging. For example, with low or no fertilization, N and sulfur deficiencies were more severe under no-tillage (NT) than under conventional tillage (CT) in a heavy clay soil [27]. Nitrogen mineralization may be retarded in spring on such soils [19] and initial plant N supply may be insufficient. If less soil N is available to plants, an increased N fertilization would be recommended for CA. Therefore, understanding the processes that affect N uptake and utilization is of major importance with respect to the quality of crop products, the costs of production [28] and the likelihood that CA is adopted by farmers [17].
Preceding crops can alter the total supply of N and the timing of N availability of the succeeding crop [29,30]. The N retained in the stalks/stems and roots of the preceding crop will be available for the succeeding crop if its mineralization is well synchronized with the N demand of the succeeding crop [31,32]. On the other hand, high levels of crop residues, which are expected in humid environments, can reduce the grain yield of wheat as a result of diseases [33] or immobilize N that would otherwise be available for the crop. Residues are a central principle of CA because they reduce soil erosion and protect the soil surface [34,35]. Therefore, nutrient management measures to support an optimized quantity and quality of residues in cool and humid climates are to be elucidated.
The main goal of this study was to determine if interactions between tillage system and N supply would justify increasing N supply under CA. We studied the effects on wheat grain yield, yield components, and N related traits of CT, minimum tillage (MT), and NT in two sites (silt-loam and loam textured soil) following two preceding crops: oilseed rape (Brassica napus L.) and maize (Zea mays L.).
2. Materials and Methods
2.1. Experimental Conditions
The experiment was conducted at two sites in the Swiss midlands from 1995 to 1999 at Zollikofen near Berne (47°00′ N, 7°28′ E; 555 m above sea level) and from 1996 to 2000 at Schafisheim near Zurich (47°23′ N, 8°09′ E; 429 m above sea level). At Zollikofen and Schafisheim the soils (0–30 cm) were silty loam (SiL) and loamy (L) according to their texture and were classified as Gleyic Cambisol and Orthic Luvisol respectively (FAO, 1988). Soil pH (H2O) ranged from moderately to slightly acidic (pH = 5.6 in Zollikofen and 6.3 in Schafisheim). Both soils were rich in organic matter content (27 g kg−1 in Zollikofen and 33 g kg−1 in Schafisheim). Other physicochemical properties of the studied soils are compiled in Table 1.
The winter wheat (Triticum aestivum L.) variety Runal (Breeder: Swiss Federal Research Station for Agroecology and Agriculture, FAL, Zurich, Switzerland), which is a high-quality variety with an intermediate yield potential was grown. As of 2020, Runal was still cultivated and included in the official list of recommended varieties [43]. Following the guidelines for fertilization of the Swiss federal research stations, 22 kg P ha−1 and 8 kg Mg ha−1 were broadcasted at the sowing of winter wheat. At each site winter wheat was grown succeeding maize (Zea mays L.) or oilseed rape (Brassica napus L.). These preceding crops are common crops cultivated in rotations with winter wheat in Switzerland. The following three tillage systems were studied: CT with mouldboard plough (CT, 25 cm depth), minimum tillage with chisel (MT, 15 cm depth), and no-tillage (NT). Two rates of N fertilization were compared: 0 kg N ha−1 (N0) and recommended N fertilization (N1). For the recommended N rate, N was broadcasted as ammonium nitrate (NH4NO3) at three stages (according to BBCH scale [44]): beginning of tillering (BBCH 25), first-node stage (BBCH 31) and appearance of the flag leaf (BBCH 37). Recommended N rate applied at beginning of tillering was estimated as 120 kg N ha−1 - soil Nmin (0 to 90 cm) while at the first-node stage and at the appearance of the flag leaf, the amount of N fertilizer was calculated according to a N status test (Lonza, Basel, Switzerland) and applied up to a total supply of 30 and 50 kg N ha−1, respectively. The N status test was based on the nitrate concentration in the basal stem sap as proposed by Justes et al. [45]. The total amount of N fertilizer for the recommended rate ranged from 150 to 160 kg N ha−1 (N1).
Wheat was sown at Zollikofen on 14 October 1995, 4 November 1996, 28 October 1997, and 5 December 1998 and at Schafisheim on 4 November 1996, 24 October 1997, 9 November 1998, and 19 October 1999. In the CT and MT treatments, wheat was sown with a ‘Rototiller’ rotary harrow—drill combination. In the NT treatment, wheat was sown with a disc-opener, John Deere ‘NT 750 A’ planter (Deere and Co., Moline IL, USA) directly into the dead mulch. In all the tillage systems, seeding rate was 400 grains m−2. The distance between plant rows was 14.3 cm at Zollikofen and 12.5 cm at Schafisheim in the CT and MT systems; the distance between the rows was 16.6 cm in the NT systems at both sites.
Crop protection measures included control of weeds, fungal diseases, and pests. Before the growth stage of stem elongation (BBCH 29), the herbicides isoproturon (1363 g ai ha−1) + fluoroglycophen (30 g ai ha−1) + triasulfuron (7.5 g ai ha−1) (Lumeton®, Novartis) and 260 g ai ha−1 of fluroxypyr (Starane 180®, Novartis) were sprayed. At first-node (BBCH 31) 125 g ai ha−1 of the growth regulator trimexapac (Moddus®, Novartis) was applied. At the stage of flag leaf (BBCH 37), fenpropimorph (375 g ai ha−1) + difenoconazol (125 g ai ha−1) (Avenir®, Novartis) was sprayed against fungal diseases. At anthesis, 250 g ai ha−1 of the fungicide tebuconazol (Horizont®, Bayer) and 144 g ai ha−1 of the insecticide diflubenzuron (Dimilin®, Maag) were applied. Crop residues were left on the soil surface following a main principle of CA.
Long-term climatic data from meteorological stations at Berne-Liebefeld (near Zollikofen) and Buchs-Suhr (near Schafisheim) were obtained from the Swiss Meteorological Institute (SMI, Zurich). In the 20 years prior to the experiments, mean annual temperature and precipitation at Zollikofen were 8.7 °C and 1075 mm, respectively. The corresponding values at Schafisheim were 9.2 °C and 1047 mm, respectively. Growing conditions in the two sites were representative of average conditions for winter wheat cropping in Switzerland.
The experimental design was a split-plot with completely randomized blocks and two treatments (tillage systems and N supply). Tillage systems (CT, MT, and NT) and nitrogen supply (N0 and N1) were assigned to the main and the subplots, respectively. The tillage main-plots were 12 × 35 m2 and separated from each other by a one meter border. The N subplots were 6 × 35 m2. Each combination of main-plot and subplot was replicated three times while each different combination of year, site, and preceding crop was considered a single environment in the statistical analysis.
2.2. 15N labelled Fertilizer Assessment
This assessment was conducted for two years at each site. In the CT and NT treatments, two zones per plot were defined to apply and trace the fate of 15N-labelled fertilizer for the recommended N rate treatment.
Each zone was defined at the center of the plots to avoid the dispersion of 15N [46,47] and covered an area of 3.25 m2. Within each zone, double labelled ammonium nitrate (15NH415NO3) was dissolved in water and applied at the end of tillering in five places of 0.25 m2 each [46]. The fertilizer solution was made up with 1.325 atom% excess for an 80 kg 15N ha−1 treatment and was applied homogeneously. At the first-node stage (BBCH 31) and at the appearance of the flag leaf (BBCH 37), the required amount of N fertilizer in each plot was calculated using the above described N status test and applied as non-labeled NH4NO3 to complete the N rate of the treatment.
2.3. Plant Sampling and Analysis
Shoot samples were taken at tillering (BBCH 25), shooting (BBCH 31), and anthesis (BBCH 65) from four areas (0.25 m2) per plot. At maturity (BBCH 92), an area of 15 m2 per plot was harvested by combine harvester (Wintersteiger, Ried, Austria). Straw was collected and its fresh weight determined on the field; a random sample was taken to determine the dry weight and the N content. Plant material was dried at 65 °C for 48 h and then weighed. The grains were ground with a mill (‘A10′, Janke & Kunkel Labortechnik, Staufen, Germany) prior to analysis. The milled grains were analyzed for N with a LECO CHN-1000 autoanalyzer (LECO Corporation, St. Joseph, MI, USA). This instrument involves dry combustion according to the Dumas principle to extract N from the samples.
Shoot samples from the subplots for 15N-labelled fertilizer assessments were taken from two places per 15N application zone at the end of tillering (BBCH 29) after 15N application, at shooting (BBCH 31), at anthesis (BBCH 65), and at physiological maturity (BBCH 92). At each sampling, plants were cut at soil surface level. Shoots were divided into grains and vegetative parts (chaff and straw). Dried shoot material (65 °C for 48 h) was weighed. Vegetative parts were ground with two mills, through a 3-mm sieve (Wolf Mühle, Wien, Austria) and then through a 1-mm sieve (‘Cyclotec Tecator 1093′ mill, Tecator AB, Höganäs, Sweden), the grains with an ‘A10′ mill (Janke & Kunkel Labortechnik, Staufen, Germany). Then, the plant and grain material was ground with a ‘MM2′ ball mill (Retsch, Arlesheim, Switzerland). N and 15N concentrations were determined with a bench-top isotope ratio mass spectrometer (Europa Scientific Integra, Cambridge, UK) in the stable isotope facility of the University of California at Davis, USA.
%Ndff calculations (percentage of plant N derived from N fertilizer) were made as follows [48]:
%Ndff = (%N excess in sample/%N excess in fertilizer) × 100
The resulting percentage was multiplied by the total N quantity in the plant sample to obtain a value of plant derived from N fertilizer in kg ha−1 (NR).
2.4. Soil Sampling and Analysis
At the end of winter, four soil cores (0.0 to 90 cm) per plot were taken using a ‘Pürckhauer’ auger (Eijkelkamp, Giesbeek, The Netherlands) and separated according to depth (0 to 15 cm, 15 to 30 cm, 30 to 60 cm, and 60 to 90 cm). Samples were taken right after shoot sampling from the centre of the shoot sampling areas. Additional, soil samples were taken in the autumn, at the end of the vegetation period, following the same protocol described above. Soil samples were frozen at −18 °C until analysis. For each sample, 100 g of soil were extracted using 100 mL of a 0.005 M CaCl2 solution. After shaking the solutions for 90 min, the samples were filtered through N-free filters. Concentrations of NO3−-N and NH4+-N in the extract were determined using a colorimetric method with an ‘Evolution II’ autoanalyser (Alliance Instruments, Nanterre, France).
2.5. Statistical Analysis
Data were analyzed by means of the analysis of variance (ANOVA) according to the GLM procedure of the SAS software [49]. Briefly, the GLM procedure uses the method of least squares to fit general linear models and allows specifying interaction and nested effects. We also used this procedure to compute least square means and least square mean differences. Factors in ANOVA were tillage system and N fertilization level. Environments were considered combinations of year, site, and preceding crop. Single ANOVAs were conducted for each environment. As meaningful interactions between tillage systems and the level of N fertilization did not occur, we only present results from the recommended N fertilization level. On the other hand, data are shown separately for single environments because strong effects of environment existed which included the effects of the preceding crops oilseed rape and maize.
3. Results
3.1. Soil Mineral N Content (Nmin)
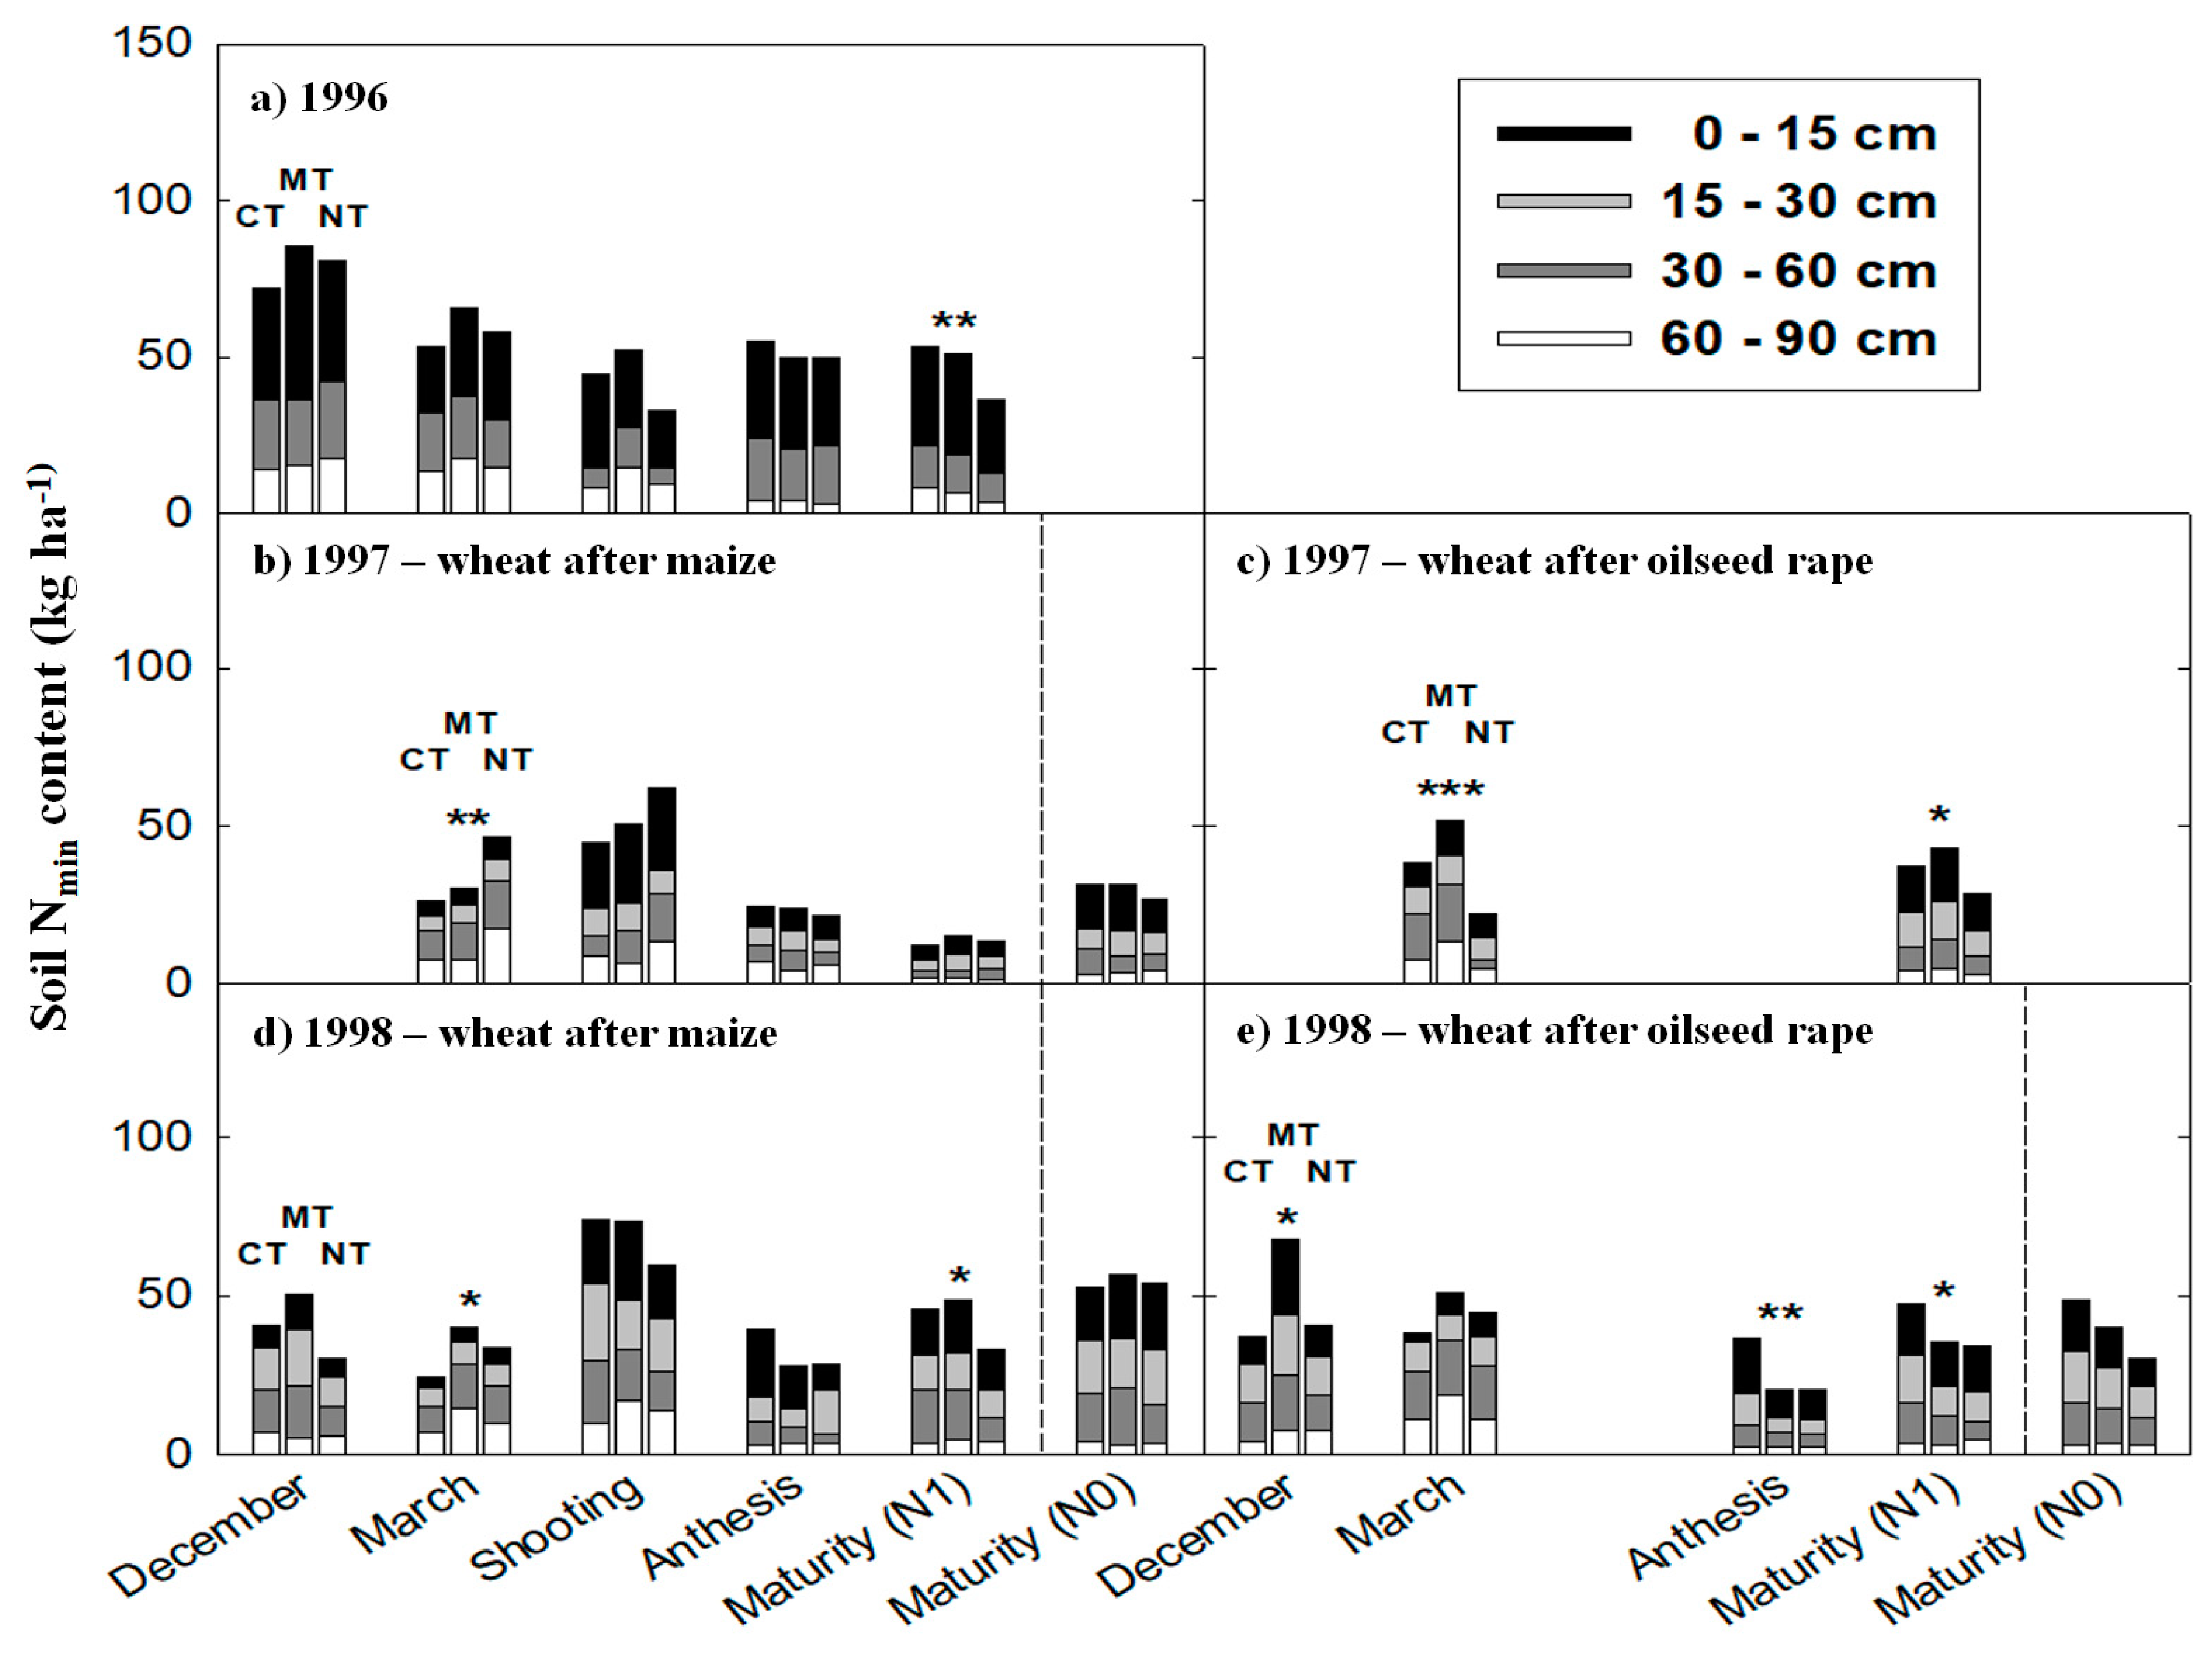
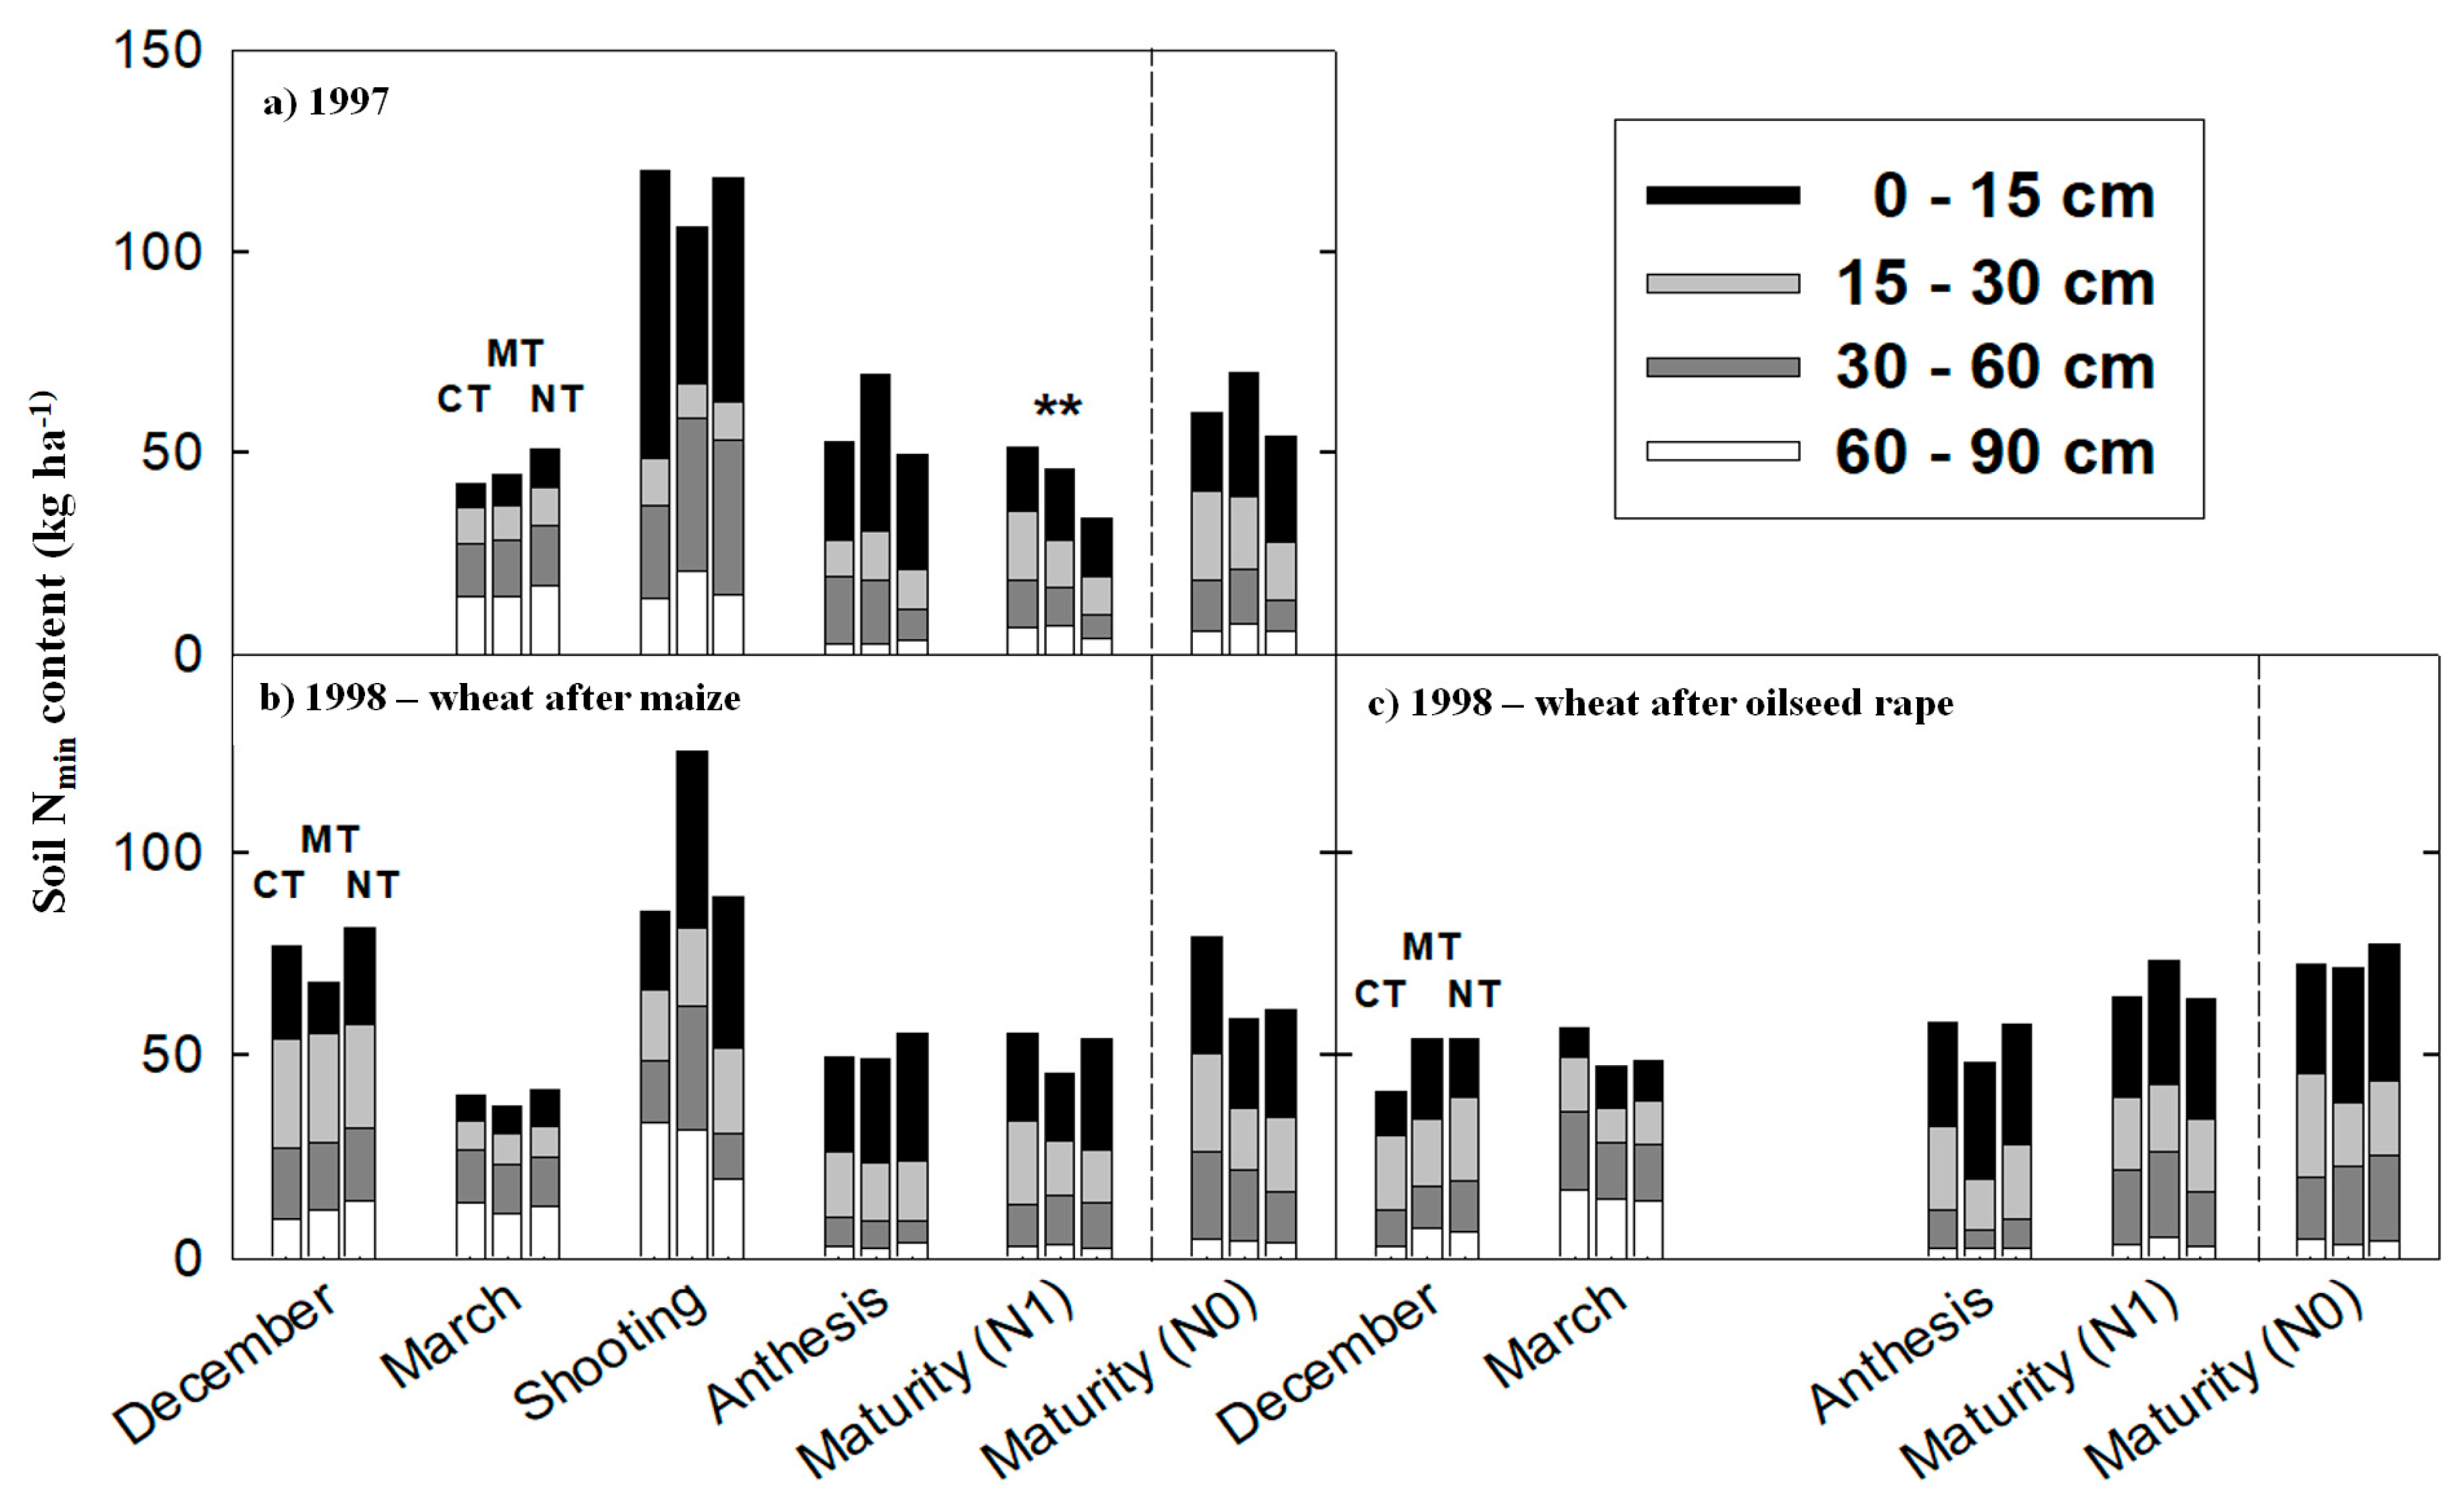
Total soil Nmin (Figure 1 and Figure 2) varied among environments (i.e., combination of year, site, and preceding crop) with a mean value of 54 kg N ha−1 and a coefficient of variation of 30%. Total soil Nmin contents at Schafisheim were generally higher than at Zollikofen. At Schafisheim, tillage systems had no significant effect on Nmin, with the exception of the assessment at the maturity of wheat (Figure 2). In contrast, at Zollikofen soil Nmin contents were significantly (p < 0.05) affected by preceding crop and tillage system.
Total soil Nmin (0 to 90 cm) tended to be higher after oilseed rape than after maize in the heavier soil (Figure 1c,e) and this was especially the case in the topsoil (0 to 30 cm). Averaged across all treatments, the soil Nmin content of the MT system was higher than that of NT and slightly but significantly higher than that of CT system (data not shown). Around 60% of the total soil Nmin content was found in the topsoil, regardless of the tillage system and site (Figure 1 and Figure 2). Before winter (i.e., December in Figure 1 and Figure 2), the average soil Nmin content was 10 kg N ha−1 higher under MT than under CT and 8 kg N ha−1 higher than under NT. After winter (i.e., March in Figure 1 and Figure 2), soil Nmin contents were still the highest under MT, but differences among tillage systems were usually below 10 kg N ha−1. Changes in soil Nmin content between autumn and winter occurred mainly in the topsoil while the soil Nmin content in the subsoil (30 to 90 cm) was less variable. Net increases in soil Nmin contents from the beginning of the vegetation period until shooting were, on average, slightly higher under CT and MT than under NT, brought about mainly by a higher soil Nmin content in the topsoil (Figure 1b,d and Figure 2a,b). At shooting, the average Nmin content was nearly twice as high as after winter; and although average differences among tillage systems were small, the highest values were still recorded under MT (Figure 1a,d, and Figure 2b). From shooting to anthesis, soil Nmin contents decreased by around 30 kg N ha−1, and significant differences disappeared among tillage systems (Figure 1 and Figure 2). The subsoil (30 to 90 cm) contained only marginal levels of mineral N with values below 20 kg N ha−1. Between anthesis and maturity, few changes in the content of soil Nmin were observed (Figure 1 and Figure 2). Therefore, N mineralization on the one hand and the sum of N uptake and N losses on the other were probably counterbalanced. Average soil Nmin at maturity (an indicator of residual N) was significantly lower (by about 8 kg N ha−1) under NT than under CT and MT, with a significantly higher percentage of Nmin in the topsoil than in the subsoil (Figure 1b,d,e, and Figure 2a,b).
3.2. Establishment and N Uptake of Wheat
The emergence of wheat plants was lower and less regular under NT than under CT and MT. There was a significant reduction (20%) in wheat plant density under NT compared to CT at Zollikofen in 1996 and at both sites in 1998, while the number of wheat plants per area was intermediate under MT (data not shown). Despite this initial difference, wheat under NT compensated for the reduced plant stand with a higher number of fertile tillers.
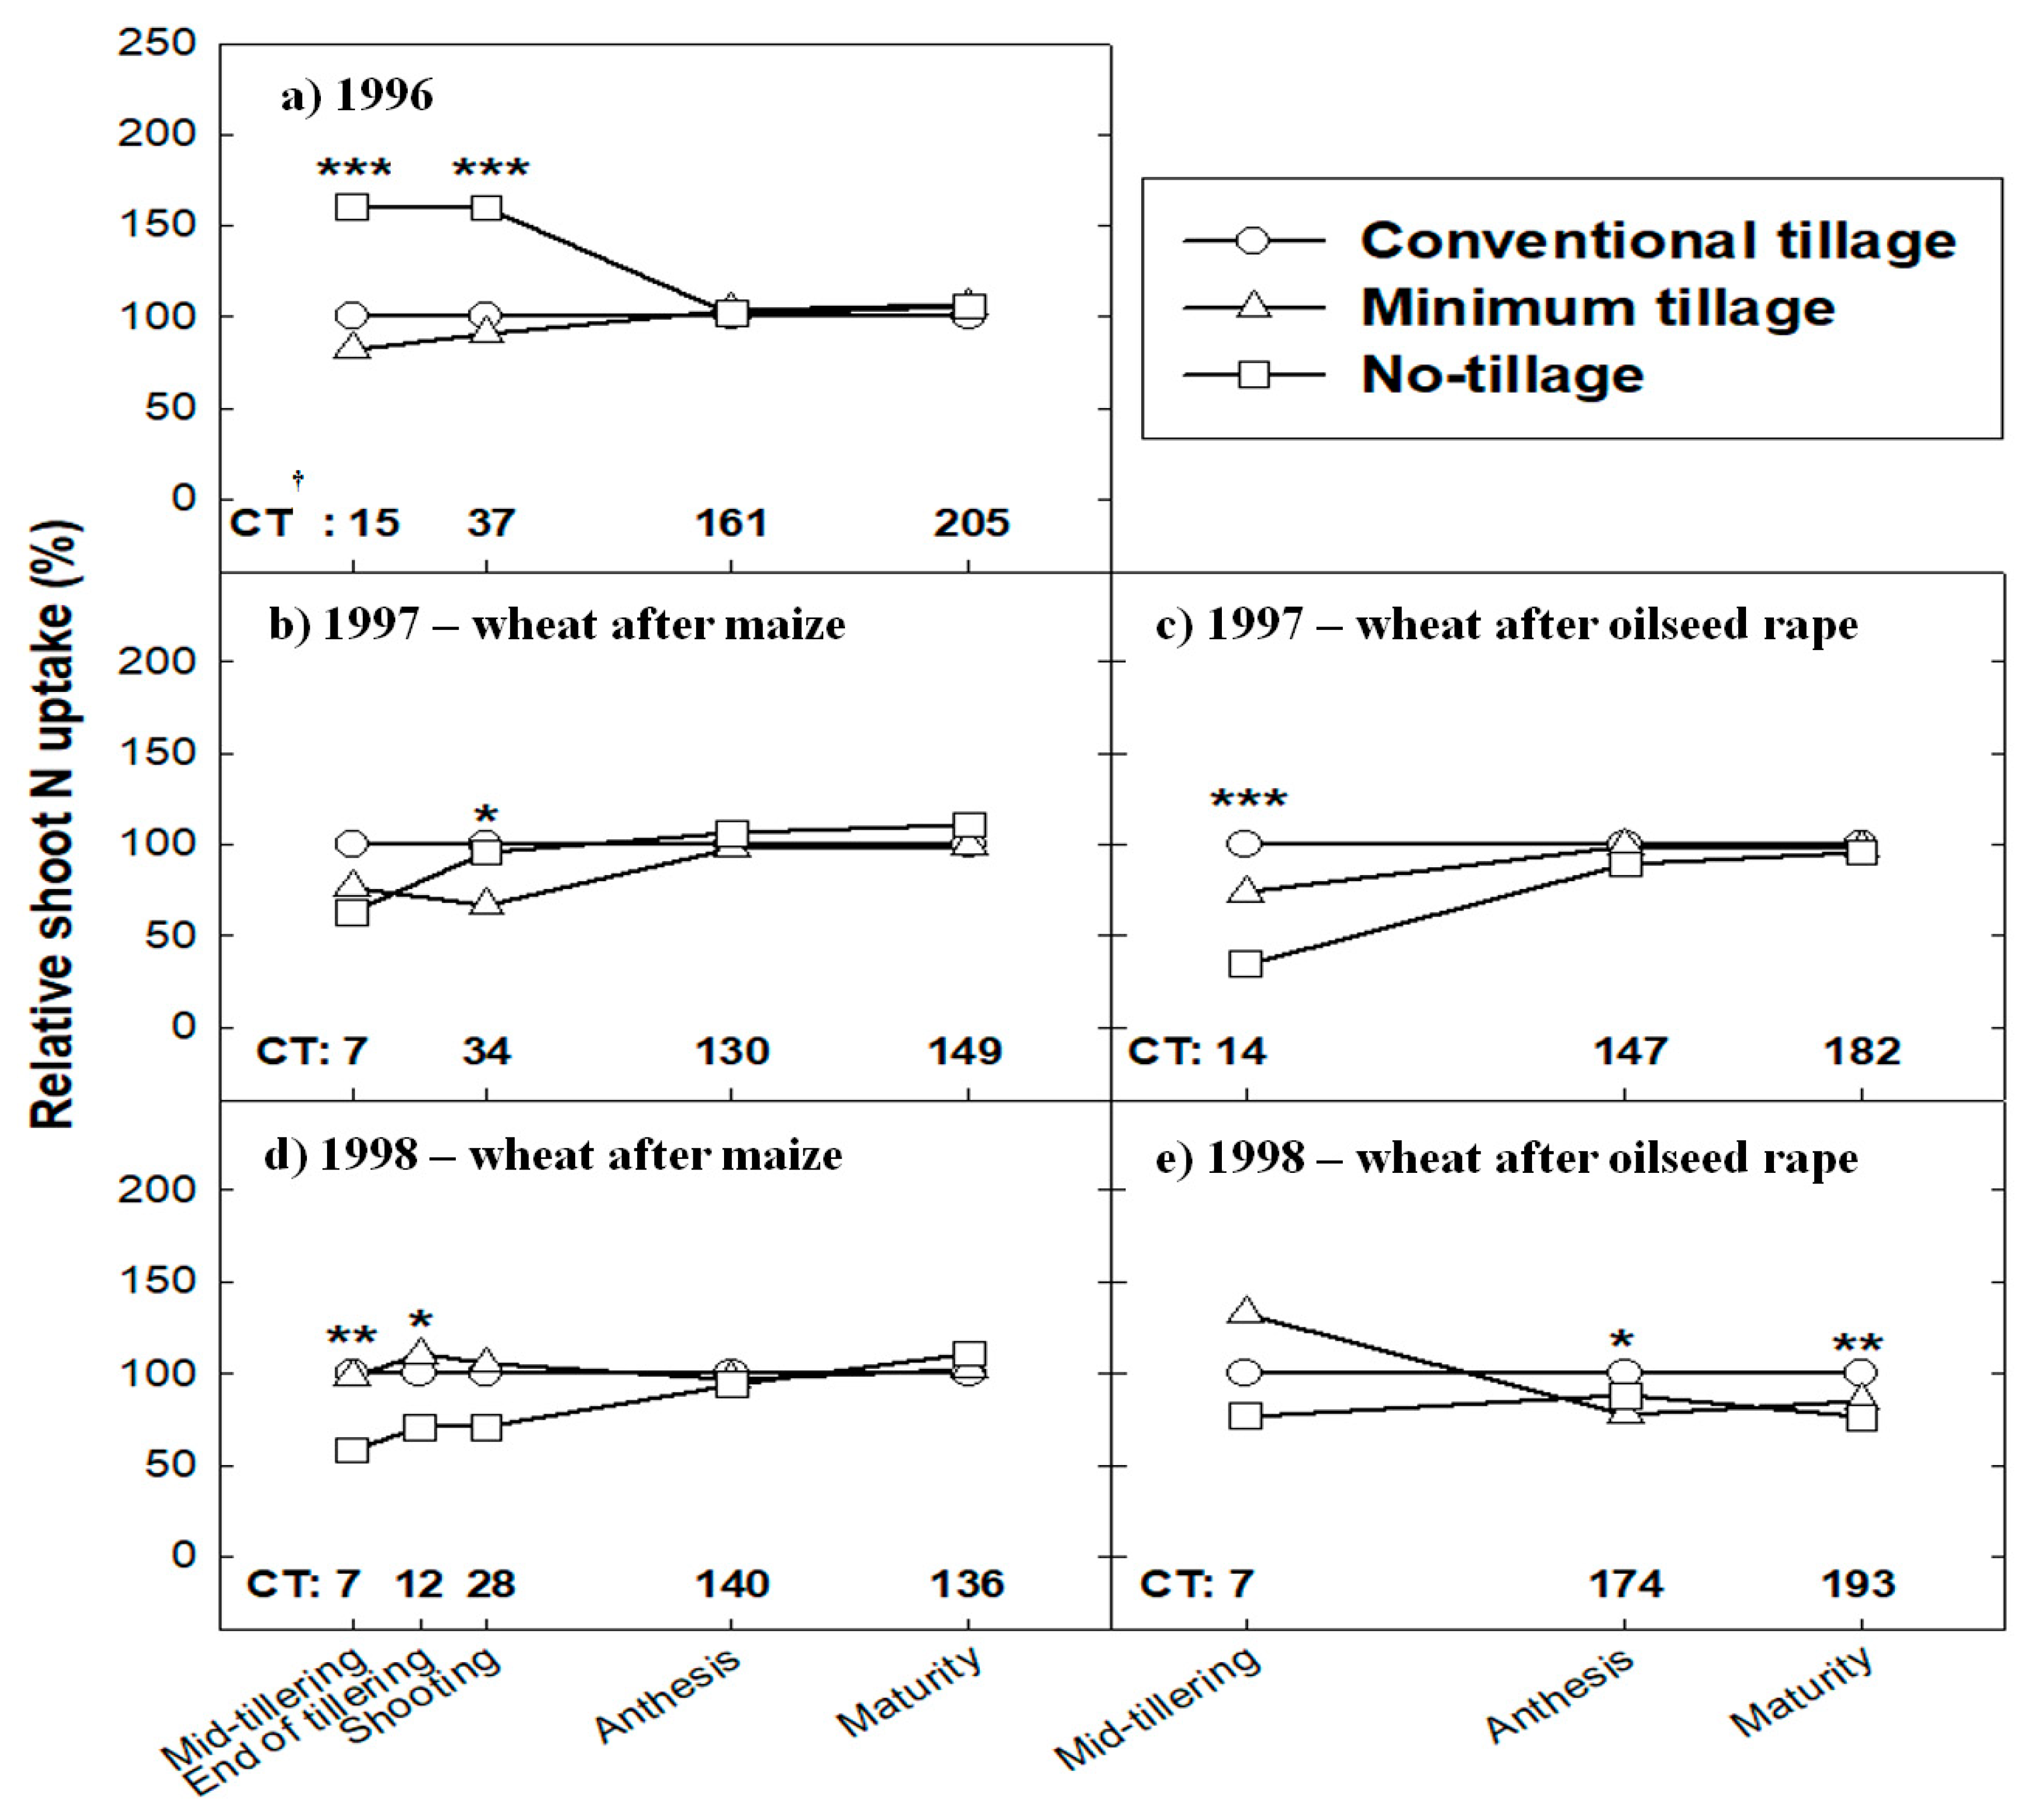
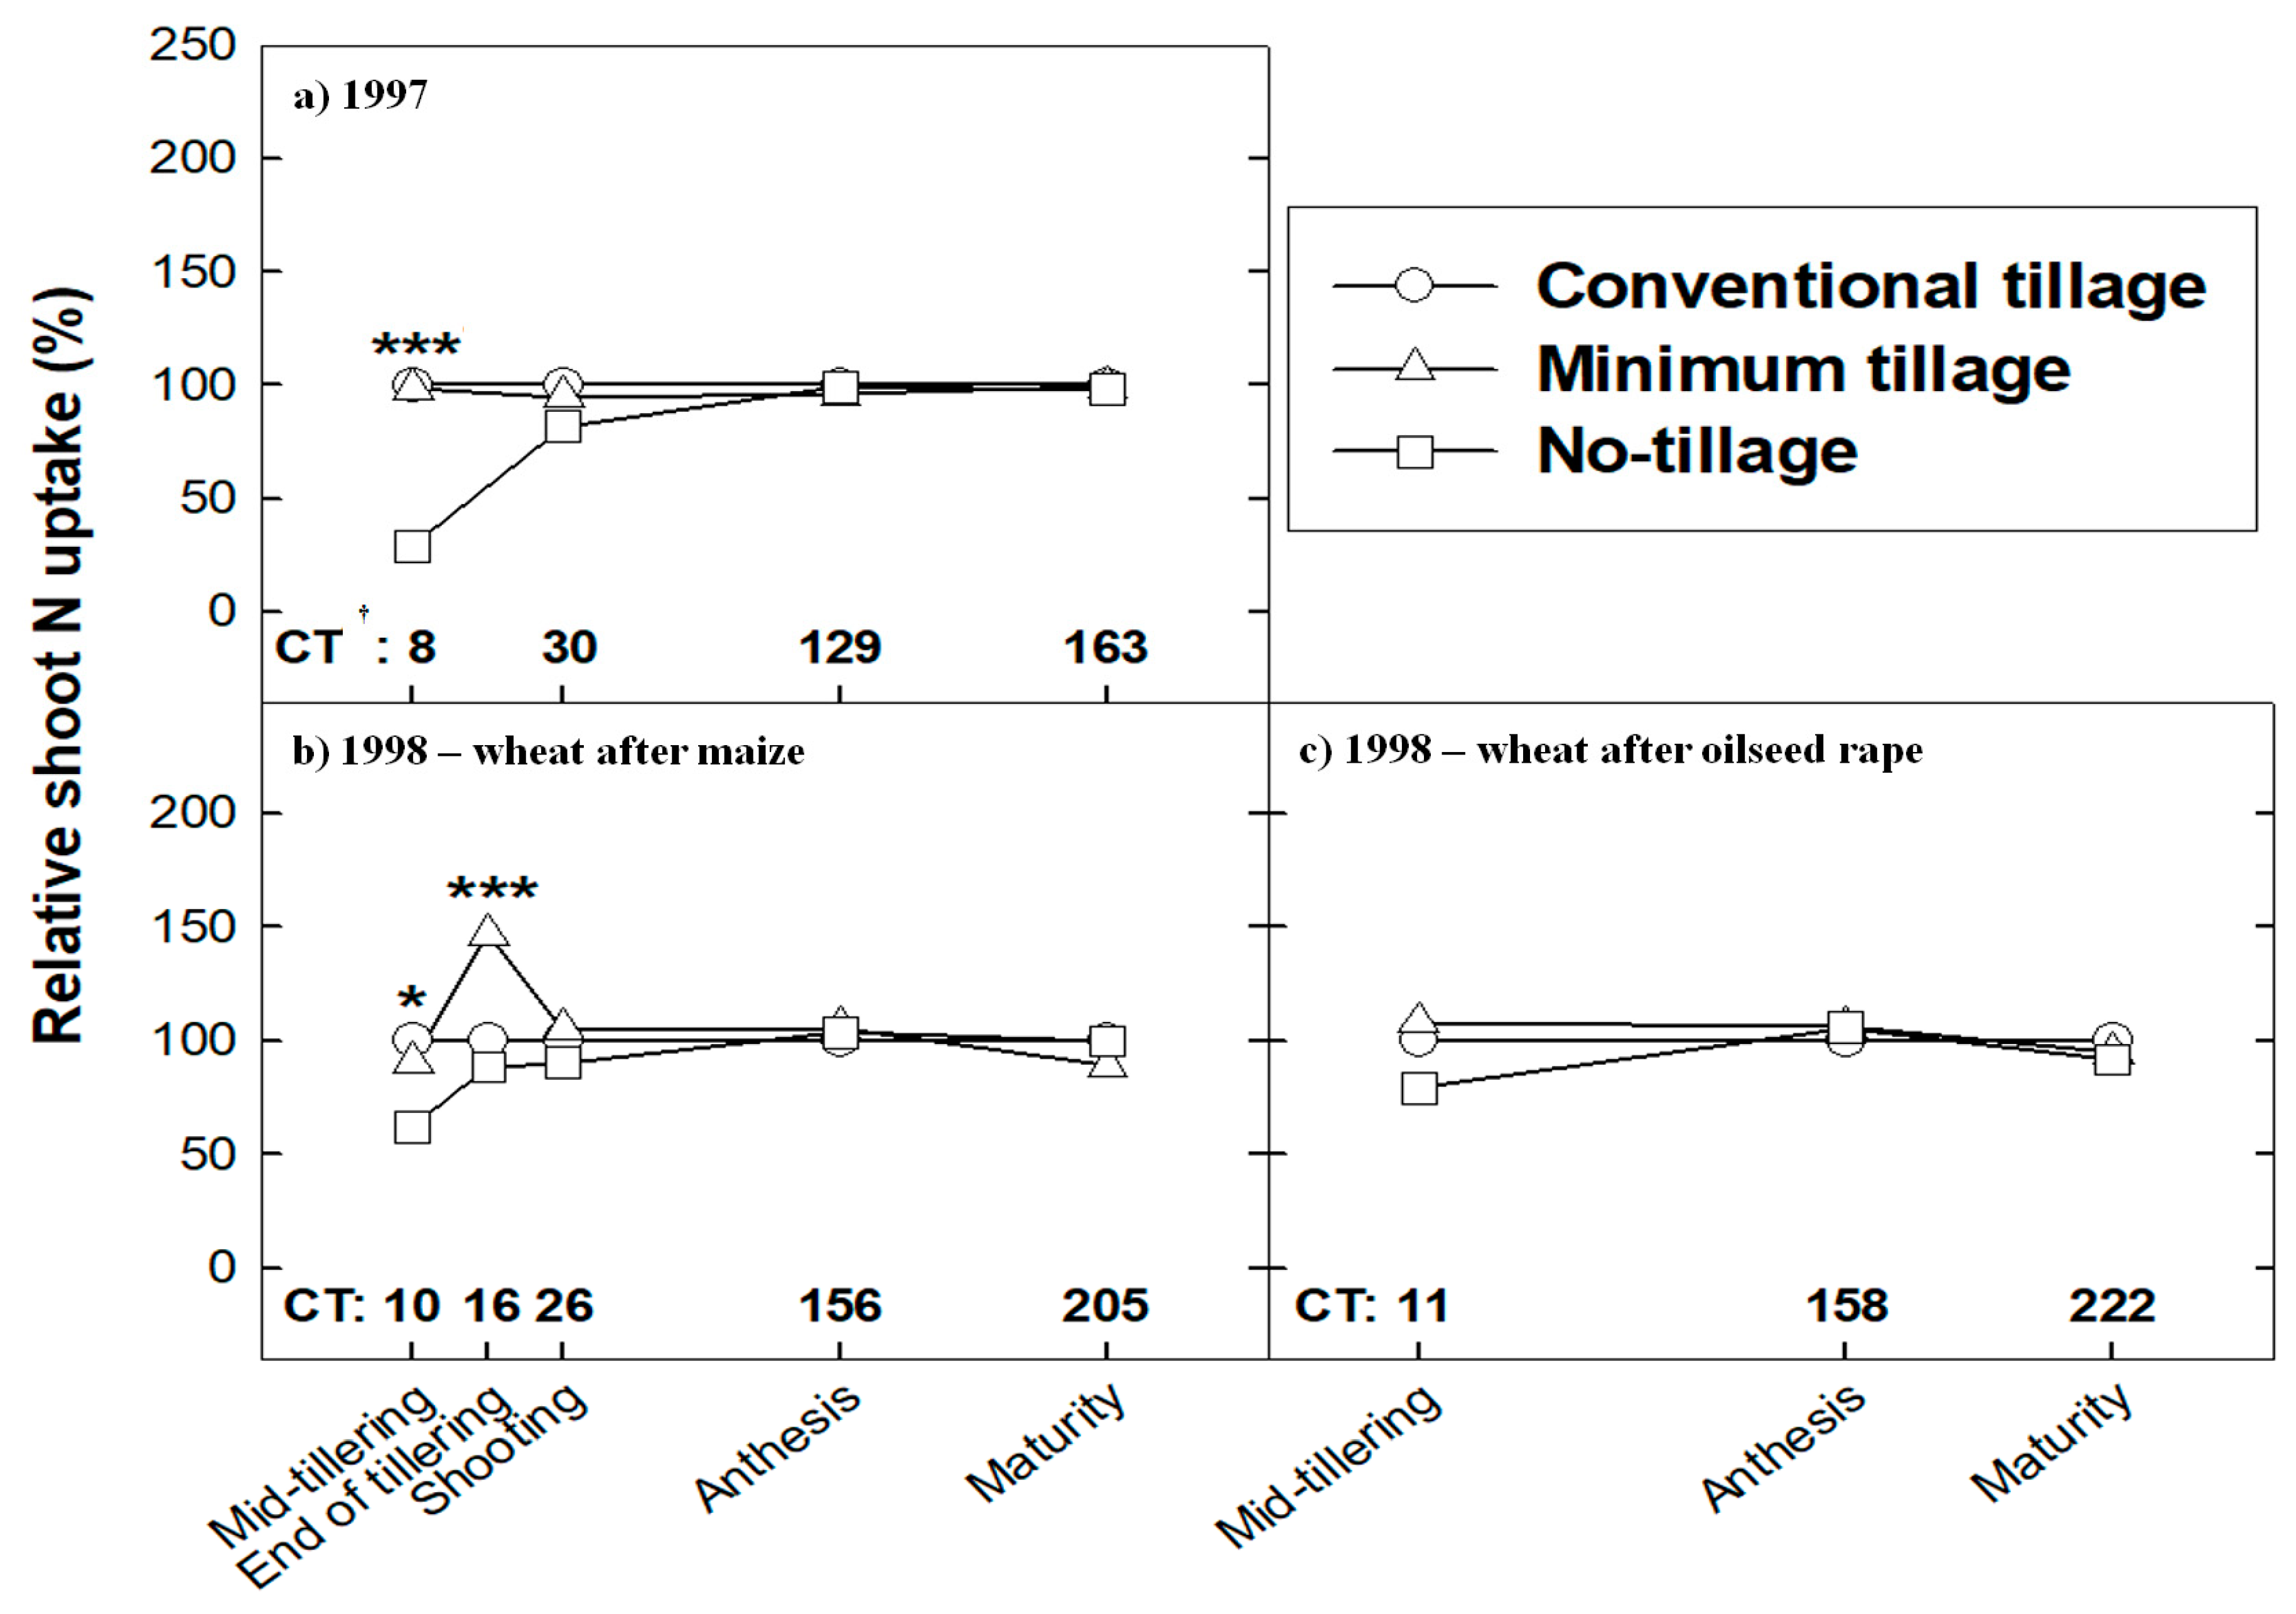
Shoot N uptake at the early vegetative stages was the highest under CT or MT, while values under NT were 25% lower (Figure 3 and Figure 4). Wheat after oilseed rape had 25% higher shoot N uptake than wheat after maize and N uptake was relatively higher at Schafisheim than at Zollikofen (Table 2 and Table 3). Differences among environments were pronounced until the end of tillering, with generally lower rates of shoot N uptake at Zollikofen. At stem elongation, wheat under NT had the highest shoot N concentrations, followed by MT. Significant differences in the shoot N concentration were found among environments at this stage, mainly caused by higher N concentrations at Schafisheim than at Zollikofen (Figure 3 and Figure 4).
From stem elongation onwards, differences among tillage systems largely disappeared while differences between environments dominated. The shoot N concentration increased slightly until stem elongation and then decreased steadily until physiological maturity (Figure 3 and Figure 4). Shoot N uptake at the beginning of stem elongation was, on average, lower under NT than under CT. Shoot N uptake under MT was also slightly lower than under CT in most environments. However, these differences disappeared by anthesis (Figure 3 and Figure 4) and after grain filling, shoot N uptake was similar in all tested environments and under the three tested tillage treatments.
At maturity, differences in shoot N uptake due to preceding crop were often associated to differences in shoot biomass (Table 2 and Table 3). Wheat after oilseed rape produced a significantly higher shoot biomass than wheat after maize at nearly all the investigated growth stages (data not shown). This was reflected in shoot N uptake which was higher after oilseed rape than after maize, with the exception of plots under NT. At maturity, the shoot biomass was only slightly, but not significantly lower under NT than under CT and MT (Table 2 and Table 3). These effects were, however, different across environments. The shoot dry matter of wheat was 15% higher after oilseed rape than after maize and it was slightly lower at Zollikofen than at Schafisheim but not significantly different (Table 2 and Table 3).
3.3. 15N-Labelled Fertilizer Recovery
Labelled-15N fertilizer allows to trace the fate of N supplied as fertilizer and differentiate it from other N sources (Table 4). About 50% and 40% of the basal N application were recovered at physiological maturity in the shoot and grains, respectively. Recovery of 15N was significantly higher at Zollikofen (silty-loam soil) compared to Schafisheim (loamy soil) and in 1998 than in 1997. Differences between sites were higher than those between years for the same site (Table 4).
3.4. Grain Yield and Yield Components
In most environments, there were no significant differences in grain yield among tillage systems, with the exception of Zollikofen in 1998 and 1999 when oilseed rape was the preceding crop. On average, wheat’s grain yield was 8% higher after oilseed rape than after maize (Table 2 and Table 3).
There were only isolated effects of tillage system on yield components and often depended on the environment. Table 2 and Table 3 show selected yield components at Zollikofen and Schafisheim, respectively. When oilseed rape was the preceding crop, there were on average 10% more spikes m−2 than after maize. In the few cases that there were significant differences due to tillage on yield components (i.e., after maize in Zollikofen in 1998 and 1999, Table 3), compensations between yield components prevented these differences to be reflected on the grain yield. For example, spike density was significantly higher under MT than under NT while grains spike−1, were also significantly different, showing a reversed ranking (i.e., NT > MT). Although it was often not significant, thousand-kernel weight was consistently lower under NT than under CT and MT (Table 2 and Table 3) and this contributed to lower grain yields under NT compared to CT at Schafisheim (Table 3). Similarly, grain N content tended to be higher under CT and MT than under NT, however the differences were small and insignificant.
The lack of significant and consistent effects of tillage system and N supply on grain yield and grain yield components suggest that a dependence of tillage system on the rate of N fertilization can be excluded in the environments.
4. Discussion
Using soil, shoot and 15N-labelled fertilizer measurements, we did not find evidence of significant interactions between tillage system and N supply that would justify an increase of the N supply for NT cropping of wheat.
In general, the soil Nmin content at the beginning of the vegetation period varied in similar ranges of about 25 to 65 kg N ha−1 for the different tillage systems (Figure 1 and Figure 2). The soil Nmin contents were usually higher after oilseed rape than after maize, as was also found by other authors [50,51]. Similarly, less soil nitrate was released after different cereals than after oilseed rape and higher soil Nmin contents were found during spring when wheat followed oilseed rape than when it followed cereals [52,53]. This was presumably the consequence of: (i) a higher mineralization potential of soil N after the harvest of oilseed rape, (ii) the uptake of N by volunteers of oilseed rape competing with the succeeding crop, and (iii) a higher N release from decomposition of oilseed rape residues. Higher N release from residues of oilseed rape may be explained by a lower C/N ratio than cereals [54]. We did not observe the expected soil Nmin peak with CT [55] presumably due to N leaching. In spring, MT soils had on average the highest soil Nmin contents. Similarly, in experiments conducted by Hansen and Djurhuus [56], higher N mineralization in autumn resulted in a higher soil Nmin content in spring. The decrease in Nmin in the topsoil (0 to 30 cm) and the constant content in the subsoil (30 to 90 cm) that we observed during winter (Figure 1d,e and Figure 2b,c) suggests a significant amount of N lost by leaching or denitrification. Nmin in soil under MT seemed to have been the most susceptible to N leaching losses since it tended to have the highest mineral N contents in the subsoil before winter. The net decrease of soil Nmin during winter was higher for wheat after maize than after oilseed rape because average soil Nmin contents were higher before winter for wheat grown after maize. The soil Nmin content did not generally change between anthesis and maturity, suggesting that N mineralization and N uptake were counterbalanced at a level of 30 kg N ha−1 in all tillage systems during this period. Thus, a more intense N mineralization during later growth stages under NT as sometimes observed elsewhere [57,58] was not observed in our study. In any case, soil Nmin values obtained at different stages throughout the growing season of wheat do not suggest consistent N limitations in NT compared to the other tillage systems.
Wheat plant density in autumn increased with tillage intensity, as was also observed by other authors [59]. This may be attributed to suboptimal soil physical conditions for germination and emergence that were found under NT systems. To overcome this limitation and to increase germination and emergence ratios, Sunderman [60], recommended the use of wheat varieties with higher grain weights with NT systems. This justifies partly the choice of the cultivar ‘Runal’ in our experiments, since it had a thousand-kernel weight above average as compared to other wheat cultivars registered in the Swiss variety catalog. Accordingly, several other authors have recommended the cultivation of genotypes with early vigor traits under CA systems [61,62,63,64]. Similar to Rao and Dao [65] and Cornish and Lymbery [66], we observed a lower shoot N uptake at NT than at CT during the early stages (Figure 3 and Figure 4), but from stem elongation to physiological maturity and with the exception of wheat after oilseed rape at Zollikofen in 1998, significant tillage effects on shoot N uptake were no longer found. Despite the lower total shoot N uptake at tillering, from stem elongation to physiological maturity under NT, wheat showed an increased rate of shoot N uptake compared to other tillage systems. This suggests that an increased N mineralisation potential in the topsoil (0–30 cm) under NT, may have prevented limitations on N uptake due to a lower root length density in the same soil layers [67]. In addition, since the formation of tillers is positively correlated with N supply [68] and a higher number of fertile tillers were observed under NT, N availability seemed not to have been a limiting factor under NT. In the present experiment, differences in net N uptake between consecutive sampling dates among tillage systems were very small throughout the growing season. Thus, it seems unlikely that a severe decrease in N availability under NT occurred. This is supported by the observation that the N concentration in aboveground vegetative parts during the vegetation period was not lower under NT than under the other tillage systems. This result was consistent with what we found using a chlorophyll meter (SPAD) readings which were measured on the flag leafs of wheat (data not shown). Therefore, shoot N uptake also supports the finding that the N fertilisation strategy, which was developed for CT systems, was not detrimental to the N availability and, ultimately, to the productivity of wheat under NT.
The recommendation to apply greater amounts of N fertilizer to winter wheat under NT, as proposed by Francis and Knight [69] and Rasmussen and Douglas [70] is not supported by the results of 15N-labelled fertilizer. Recovery of 15N-labeled fertilizer at physiological maturity was on average 30 kg N ha−1 in the grains, which is about 40% of the applied N fertilizer. Thus, nearly a quarter of the total N in grains was derived from the first fertilizer application. Labelled-15N fertilizer recovery was almost always higher under CT than under NT. However, these differences were not significant, with the exception of the measurement taken at stem elongation at Zollikofen in 1998. This differs from the findings by Carefoot et al. [71] who observed a greater %Ndff in grains at NT than in the CT. The temporal pattern of 15N-fertilizer recovery from the basal N application (Table 4) was almost parallel to that of shoot N accumulation (Figure 3 and Figure 4). The slightly lower uptake of 15N-labeled fertilizer may be explained by the lower shoot development and consequently reduced N uptake under NT. Losses of 15N-labelled fertilizer (approximately 5 kg N ha−1) are in the same range of previous reports using similar N rates [72]. More fertilizer N may have been immobilized initially under NT; but this could have been only temporarily as almost the same amount of the initial fertilizer application was recovered in both tillage systems. In contrast, an increased N rate of fertilization under NT would have probably increased N losses above the already high 60% of the applied N.
The preceding crop had a remarkable effect on grain yield despite identical sowing dates. In a continental climate, modifications in grain yield by NT were probably due to differences in water retention by preceding crops [73,74]. In the climatic conditions of this study, higher soil Nmin contents were more likely when wheat followed oilseed rape than maize. In addition, oilseed rape, with deep and dense root systems [75], leaves a good soil structure, an ideal condition for the following crop as shown in experiments in Germany [76]. Thus, the amount and C/N ratio of the residues of the preceding crop [77] are critical factors to consider while designing the N fertilization management of a CA system.
Tillage systems did not affected consistently grain yield and its components, with the exception of thousand-kernel weight. Differences among tillage systems were not highly pronounced in most environments. Similar findings with regard to tillage effects on grain yield were reported for wheat in temperate climates [58,78,79]. However, in some cases, significantly lower grain yields, under reduced or NT, were found in Scotland [80], where winter barley was grown on a clay soil, and in Germany for several cereals [81]. To attain the same grain yield as with CT, N fertilization was increased with reduced tillage in the latter two cases. In contrast, only a small overall decrease in grain yield was found in NT compared with CT and MT without N fertilization [27,82]. This may explain the missing interaction effect between N supply and tillage intensity in our environments. Reduced grain weight is a known symptom of Fusarium infection [83]. NT wheat showed the highest incidence of infection, followed by MT, whereas infection of CT wheat was negligible (data not shown). Fusarium infections are a severe problem in reduced tillage systems [84] because the survival of the pathogen is facilitated by the presence of cereals’ residues [85]. Thus, crop rotations with cereals followed by cereals are problematic. We also did not find an effect of tillage system on grain N content, similar to the findings of Ditsch and Grove [86] and contrary to those of Carter et al. [87]. The lack of effect occurred at both studied N supply levels. Therefore, the results on wheat quality also do not suggest the need to increase N supply because of NT. In contrast, our results suggest that a diagnose of N availability after winter and the use of suitable crop rotations allows for utilizing N fertilizers more efficiently under CA in a cool and humid climate.
5. Conclusions
With crop residues left on the field and suitable rotations, GY, yield components, N uptake, N fertilizer recovery and soil Nmin availability of wheat under NT were comparable to those under MT or CT in a cool and humid climate. We did not find evidence of interactions between tillage system and N supply that would justify an increase of the N supply for CA.
Oilseed rape as a preceding crop improved the productivity of the subsequent wheat compared to growing maize as a pre-crop of wheat. As wheat without N fertilization under NT showed similar decreases in grain and biomass yields compared to CT or MT, it can be assumed that N was not a limiting factor for the productivity of wheat under NT. This is supported by the similar soil Nmin contents in all the tillage systems throughout the growing season and the similar recovery of 15N-fertilizer. With regard to product quality, the N content of the grains was not negatively affected by reduced tillage. In addition, the generally strong influence of the environments, composed by sites, years and preceding crops, on the expression of differences between tillage systems may explain why results between different published experiments often differ drastically.
Author Contributions
Conceptualization, P.S., C.N. and R.Q.; methodology, J.M.H., C.N. and R.Q.; statistical analysis, J.M.H.; data curation, J.M.H.; writing—original draft preparation, J.M.H., C.N., P.S., L.L.-H., D.P. and R.Q.; writing—review and editing, J.M.H., C.N., P.S., L.L.-H., D.P. and R.Q.; supervision, P.S.; project administration, P.S.; funding acquisition, P.S. All authors have read and agreed to the published version of the manuscript.
Funding
This research received no external funding.
Acknowledgments
We acknowledge Stephanie Rieger for taking measurements and conducting experiments.
Conflicts of Interest
The authors declare no conflict of interest.
References
- Montgomery, D.R. Soil erosion and agricultural sustainability. Proc. Natl. Acad. Sci. USA 2007, 104, 13268–13272. [Google Scholar] [CrossRef] [Green Version]
- Dendooven, L.; Gutiérrez-Oliva, V.F.; Patiño-Zúñiga, L.; Ramírez-Villanueva, D.A.; Verhulst, N.; Luna-Guido, M.; Marsch, R.; Montes-Molina, J.; Gutiérrez-Miceli, F.A.; Vásquez-Murrieta, S.; et al. Greenhouse gas emissions under conservation agriculture compared to traditional cultivation of maize in the central highlands of Mexico. Sci. Total Environ. 2012, 431, 237–244. [Google Scholar] [CrossRef]
- Lal, R. Sequestering carbon and increasing productivity by conservation agriculture. J. Soil Water Conserv. 2015, 70, 55A–62A. [Google Scholar] [CrossRef] [Green Version]
- Paustian, K.; Lehmann, J.; Ogle, S.; Reay, D.; Robertson, G.P.; Smith, P. Climate-smart soils. Nature 2016, 532, 49. [Google Scholar] [CrossRef] [Green Version]
- Hobbs, P.R.; Sayre, K.; Gupta, R. The role of conservation agriculture in sustainable agriculture. Philos. Trans. R. Soc. B Biol. Sci. 2008, 363, 543–555. [Google Scholar] [CrossRef]
- Lal, R. Soil erosion impact on agronomic productivity and environment quality. Crit. Rev. Plant Sci. 1998, 17, 319–464. [Google Scholar] [CrossRef]
- Singh, B.; Malhi, S.S. Response of soil physical properties to tillage and residue management on two soils in a cool temperate environment. Soil Tillage Res. 2006, 85, 143–153. [Google Scholar] [CrossRef]
- Kassam, A.; Friedrich, T.; Derpsch, R.; Kienzle, J. Overview of the worldwide spread of conservation agriculture. Field Actions Sci. Rep. 2015, 8, 1–12. [Google Scholar]
- Basch, G.; Friedrich, T.; Kassam, A.; Gonzalez-Sanchez, E. Conservation agriculture in Europe. In Conservation Agriculture; Springer: Cham, Switzerland, 2015; pp. 357–389. [Google Scholar] [CrossRef]
- Friedrich, T.; Derpsch, R.; Kassam, A. Overview of the global spread of Conservation Agriculture. Field Actions Sci. Rep. 2012, 6, 1–32. [Google Scholar]
- Lundy, M.E.; Pittelkow, C.M.; Linquist, B.A.; Liang, X.; van Groenigen, K.J.; Lee, J.; Six, J.; Venterea, R.T.; van Kessel, C. Nitrogen fertilization reduces yield declines following no-till adoption. Field Crops Res. 2015, 183, 204–210. [Google Scholar] [CrossRef] [Green Version]
- Pittelkow, C.M.; Liang, X.; Linquist, B.A.; Groenigen, L.J.V.; Lee, J.; Lundy, M.E.; Gestel, N.V.; Six, J.; Venterea, R.T.; Kessel, C.V. Productivity limits and potentials of the principles of conservation agriculture. Nature 2015, 517, 365–368. [Google Scholar] [CrossRef] [PubMed]
- Pittelkow, C.M.; Linquist, B.A.; Lundy, M.E.; Liang, X.; van Groenigen, K.J.; Lee, J.; van Gestel, N.; Six, J.; Venterea, R.T.; van Kessel, C. When does no-till yield more? A global meta-analysis. Field Crops Res. 2015, 183, 156–168. [Google Scholar] [CrossRef] [Green Version]
- Sommer, R.; Thierfelder, C.; Tittonell, P.; Hove, L.; Mureithi, J.; Mkomwa, S. Fertilizer use should not be a fourth principle to define conservation agriculture. Response to the opinion paper of Vanlauwe et al. (2014) ‘A fourth principle is required to define conservation agriculture in sub-Saharan Africa: The appropriate use of fertilizer to enhance crop productivity’. Field Crops Res. 2014, 169, 145–148. [Google Scholar] [CrossRef]
- Vanlauwe, B.; Wendt, J.; Giller, K.E.; Corbeels, M.; Gerard, B. Response to Sommer et al. (2014) “Fertilizer use is not required as a fourth principle to define conservation agriculture”. Field Crops Res. 2014, 169, 149. [Google Scholar] [CrossRef]
- Vanlauwe, B.; Wendt, J.; Giller, K.E.; Corbeels, M.; Gerard, B. Response to Sommer et al. (2014) Fertiliser use is not required as a fourth principle to define conservation agriculture. Field Crops Res. 2014, 167, 159. [Google Scholar] [CrossRef]
- Vanlauwe, B.; Wendt, J.; Giller, K.E.; Corbeels, M.; Gerard, B.; Nolte, C. A fourth principle is required to define Conservation Agriculture in sub-Saharan Africa: The appropriate use of fertilizer to enhance crop productivity. Field Crops Res. 2014, 155, 10–13. [Google Scholar] [CrossRef]
- Carefoot, J.M.; Lindwall, C.W.; Nyborg, M. Differential fertilizer N immobilization in two tillage systems influences grain N concentration. Can. J. Soil Sci. 1990, 70, 215–225. [Google Scholar] [CrossRef]
- Dowdell, R.J.; Cannell, R.Q. Effect of ploughing and direct drilling on soil nitrate content. J. Soil Sci. 1975, 26, 53–61. [Google Scholar] [CrossRef]
- McCarty, G.W.; Meisinger, J.J.; Jenniskens, F.M.M. Relationships between total-N, biomass-N and active-N in soil under different tillage and N fertilizer treatments. Soil Biol. Biochem. 1995, 27, 1245–1250. [Google Scholar] [CrossRef]
- Six, J.; Ogle, S.M.; Breidt, F.J.; Conant, R.T.; Mosiers, A.R.; Paustian, K. The potential to mitigate global warming with no-tillage management is only realized when practised in the long term. Glob. Chang. Biol. 2004, 10, 155–160. [Google Scholar] [CrossRef] [Green Version]
- Chien, S.H.; Prochnow, L.I.; Cantarella, H. Chapter 8 Recent Developments of Fertilizer Production and Use to Improve Nutrient Efficiency and Minimize Environmental Impacts. Adv. Agron. 2009, 102, 267. [Google Scholar]
- Chien, S.H.; Teixeira, L.A.; Cantarella, H.; Rehm, G.W.; Grant, C.A.; Gearhart, M.M. Agronomic Effectiveness of Granular Nitrogen/Phosphorus Fertilizers Containing Elemental Sulfur with and without Ammonium Sulfate: A Review. Agron. J. 2016, 108, 1203–1213. [Google Scholar] [CrossRef] [Green Version]
- Malhi, S.S.; Grant, C.A.; Johnston, A.M.; Gill, K.S. Nitrogen fertilization management for no-till cereal production in the Canadian Great Plains: A review. Soil Tillage Res. 2001, 60, 101–122. [Google Scholar] [CrossRef]
- Sharma, L.K.; Bali, S.K. A review of methods to improve nitrogen use efficiency in agriculture. Sustainability 2018, 10, 51. [Google Scholar] [CrossRef] [Green Version]
- IPNI. 4R Nutrient Stewardship. Available online: http://www.ipni.net/4r (accessed on 4 October 2018).
- Rasmussen, P.E.; Douglas, C.L. The influence of tillage and cropping-intensity on cereal response to nitrogen, sulfur, and phosphorus. Fertil. Res. 1992, 31, 15–19. [Google Scholar] [CrossRef]
- Gastal, F.; Lemaire, G. N uptake and distribution in crops: An agronomical and ecophysiological perspective. J. Exp. Bot. 2002, 53, 789–799. [Google Scholar] [CrossRef] [Green Version]
- Thorup-Kristensen, K. The Effect of Nitrogen Catch Crops on the Nitrogen Nutrition of a Succeeding Crop I. Effects through Mineralization and Pre-Emptive Competition. Acta Agric. Scand. B Soil Plant Sci. 1993, 43, 74–81. [Google Scholar] [CrossRef]
- Thorup-Kristensen, K. The effect of nitrogen catch crop species on the nitrogen nutrition of succeeding crops. Fertil. Res. 1994, 37, 227–234. [Google Scholar] [CrossRef]
- Fraser, P.M.; Curtin, D.; Harrison-Kirk, T.; Meenken, E.D.; Beare, M.H.; Tabley, F.; Gillespie, R.N.; Francis, G.S. Winter Nitrate Leaching under Different Tillage and Winter Cover Crop Management Practices. Soil Sci. Soc. Am. J. 2013, 77, 1391–1401. [Google Scholar] [CrossRef]
- Ketterings, Q.M.; Swink, S.N.; Duiker, S.W.; Czymmek, K.J.; Beegle, D.B.; Cox, W.J. Integrating Cover Crops for Nitrogen Management in Corn Systems on Northeastern US Dairies. Agron. J. 2015, 107, 1365–1376. [Google Scholar] [CrossRef] [Green Version]
- Miller, I.H. Soil Degradation in Eastern Canada: Its Extent and Impact. Can. J. Agric. Econ. 1985, 33, 7–18. [Google Scholar] [CrossRef]
- Ranaivoson, L.; Naudin, K.; Ripoche, A.; Affholder, F.; Rabeharisoa, L.; Corbeels, M. Agro-ecological functions of crop residues under conservation agriculture. A review. Agron. Sustain. Dev. 2017, 37, 26. [Google Scholar] [CrossRef] [Green Version]
- Siemens, M.C.; Wilkins, D.E. Effect of residue management methods on no-till drill performance. Appl. Eng. Agric. 2006, 22, 51–60. [Google Scholar] [CrossRef]
- IUSS W IUSS Working Group WRB. World Reference Base for Soil Resources; World Soil Resources Reports No. 106; FAO: Rome, Italy, 2015; ISBN 978-92-5-108369-7. [Google Scholar]
- Gee, G.W.; Bauder, J.W. Particle-size analysis. In Methods of Soil Analysis: Part. 1–Physical and Mineralogical Methods; Soil Society of America: Madison, WI, USA, 1986; pp. 383–411. [Google Scholar]
- McLean, E.O. Soil pH and lime requirement. In Methods of Soil Analysis: Part 2–Chemical and Microbiological Properties; America Society Agronomy: Madison, WI, USA, 1982; pp. 199–224. [Google Scholar]
- Nelson, D.; Sommers, L. Total carbon, organic carbon and organic matter. In Methods of Soil Analysis: Part 2—Chemical and Microbiological Properties; Soil Society of America: Madison, WI, USA, 1982; pp. 539–579. [Google Scholar]
- Bremner, J.M.; Mulvaney, C. Nitrogen-total. In Methods of Soil Analysis: Part 2—Chemical and Microbiological Properties; America Society Agronomy: Madison, WI, USA, 1982; pp. 595–624. [Google Scholar]
- Olsen, S.; Sommers, L. Determination of available phosphorus. In Methods of Soil Analysis: Part 2—Chemical and Microbiological Properties; American Society of Agronomy, Soil Science Society of America: Madison, WI, USA, 1982; pp. 403–430. [Google Scholar]
- Thomas, G.W. Exchangeable cations. In Methods of Soil Analysis: Part 2—Chemical and Microbiological Properties; American Society of Agronomy, Soil Science Society of America: Madison, WI, USA, 1982; pp. 159–165. [Google Scholar]
- Courvoisier, N.; Häner, L.L.; Bertossa, M.; Thévoz, E.; Anders, M.; Stoll, P.; Weisflog, T.; Dugon, J.; Graf, B.; Hofer, M. Liste der empfohlenen getreidesorten für die ernte 2018. Agrarforsch. Schweiz 2017, 8, 1–8. [Google Scholar]
- Lancashire, P.D.; Bleiholder, H.; Vandenboom, T.; Langeluddeke, P.; Stauss, R.; Weber, E.; Witzenberger, A. A uniform decimal code for growth-stages of crops and weeds. Ann. Appl. Biol. 1991, 119, 561–601. [Google Scholar] [CrossRef]
- Justes, E.; Mary, B.; Meynard, J.-M.; Machet, J.-M.; Thelier-Huche, L. Determination of a critical nitrogen dilution curve for winter wheat crops. Ann. Bot. 1994, 74, 397–407. [Google Scholar] [CrossRef]
- Follett, R.F. Innovative 15N microplot research techniques to study nitrogen use efficiency under different ecosystems. Commun. Soil Sci. Plan. 2001, 32, 951–979. [Google Scholar] [CrossRef] [Green Version]
- Powlson, D.S.; Pruden, G.; Johnston, A.E.; Jenkinson, D.S. The nitrogen cycle in the Broadbalk Wheat Experiment: Recovery and losses of15N-labelled fertilizer applied in spring and inputs of nitrogen from the atmosphere. J. Agric. Sci. 1986, 107, 591–609. [Google Scholar] [CrossRef]
- Hauck, R.; Bremner, J. Use of tracers for soil and fertilizer nitrogen research. Adv. Agron. 1976, 28, 219. [Google Scholar]
- SAS Institute. SAS® v6.12. Available online: https://www.sas.com/en_us/home.html (accessed on 10 May 2020).
- Durst, L.; Kahnt, G.; Kübler, E. Vorfruchtwirkungen verschiedener Blattfrüchte auf Winterweizen und Einfluß von Anbaumaßnahmen. J. Agron. Crop Sci. 1988, 160, 239–249. [Google Scholar] [CrossRef]
- Goss, M.J.; Howse, K.R.; Lane, P.W.; Christian, D.G.; Harris, G.L. Losses of nitrate-nitrogen in water draining from under autumn-sown crops established by direct drilling or mouldboard ploughing. J. Soil Sci. 1993, 44, 35–48. [Google Scholar] [CrossRef]
- Angus, J.F.; Kirkegaard, J.A.; Hunt, J.R.; Ryan, M.H.; Ohlander, L.; Peoples, M.B. Break crops and rotations for wheat. Crop Pasture Sci. 2015, 66, 523–552. [Google Scholar] [CrossRef]
- Milford, G.F.J.; Pennny, A.; Prew, R.D.; Darby, R.J.; Todd, A.D. Effects of previous crop, sowing date, and winter and spring applications of nitrogen on the growth, nitrogen uptake and yield of winter wheat. J. Agric. Sci. 1993, 121, 1–12. [Google Scholar] [CrossRef]
- Shepherd, M.A.; Sylvester-Bradley, R. Effect of nitrogen fertilizer applied to winter oilseed rape (Brassica napus) on soil mineral nitrogen after harvest and on the response of a succeeding crop of winter wheat to nitrogen fertilizer. J. Agric. Sci. 1996, 126, 63–74. [Google Scholar] [CrossRef]
- Stenberg, M.; Aronsson, H.; Lindén, B.; Rydberg, T.; Gustafson, A. Soil mineral nitrogen and nitrate leaching losses in soil tillage systems combined with a catch crop. Soil Tillage Res. 1999, 50, 115–125. [Google Scholar] [CrossRef]
- Hansen, E.M.; Djurhuus, J. Nitrate leaching as influenced by soil tillage and catch crop. Soil Tillage Res. 1997, 41, 203–219. [Google Scholar] [CrossRef]
- Chen, X.; Zhang, F.; Römheld, V.; Horlacher, D.; Schulz, R.; Böning-Zilkens, M.; Wang, P.; Claupein, W. Synchronizing N supply from soil and fertilizer and N demand of winter wheat by an improved Nmin method. Nutr. Cycl. Agroecosyst. 2006, 74, 91–98. [Google Scholar] [CrossRef]
- Gruber, S.; Möhring, J.; Claupein, W. On the way towards conservation tillage-soil moisture and mineral nitrogen in a long-term field experiment in Germany. Soil Tillage Res. 2011, 115–116, 80–87. [Google Scholar] [CrossRef]
- Weisz, R.; Bowman, D.T. Influence of tillage system on soft red winter wheat cultivar selection. J. Prod. Agric. 1999, 12, 415–418. [Google Scholar] [CrossRef]
- Sunderman, H.D. Response of hard red winter wheat to seed density and seeding rate in no-till. J. Prod. Agric. 1999, 12, 100–104. [Google Scholar] [CrossRef]
- Hall, E.F.; Cholick, F.A. Cultivar × Tillage Interaction of Hard Red Spring Wheat Cultivars. Agron. J. 1989, 81, 789–792. [Google Scholar] [CrossRef]
- Kharub, A.S.; Chatrath, R.; Shoran, J. Performance of wheat (Triticum aestivum) genotypes in alternate tillage environments. Indian J. Agric. Sci. 2008, 78, 884–886. [Google Scholar]
- Richards, R.A.; Lukacs, Z. Seedling vigour in wheat - Sources of variation for genetic and agronomic improvement. Aust. J. Agric. Res. 2002, 53, 41–50. [Google Scholar] [CrossRef]
- Trethowan, R.M.; Reynolds, M.; Sayre, K.; Ortiz-Monasterio, I. Adapting wheat cultivars to resource conserving farming practices and human nutritional needs. Ann. Appl. Biol. 2005, 146, 405–413. [Google Scholar] [CrossRef]
- Rao, S.C.; Dao, T.H. Nitrogen placement and tillage effects on dry matter and nitrogen accumulation and redistribution in winter wheat. Agron. J. 1996, 88, 365–371. [Google Scholar] [CrossRef]
- Cornish, P.; Lymbery, J. Reduced early growth of direct drilled wheat in southern New South Wales: Causes and consequences. Aust. J. Exp. Agric. 1987, 27, 869–880. [Google Scholar] [CrossRef]
- Qin, R.; Stamp, P.; Richner, W. Impact of tillage on root systems of winter wheat. Agron. J. 2004, 96, 1523–1530. [Google Scholar] [CrossRef]
- Power, J.F.; Alessi, J. Tiller development and yield of standard and semidwarf spring wheat varieties as affected by nitrogen fertilizer. J. Agric. Sci. 1978, 90, 97–108. [Google Scholar] [CrossRef]
- Francis, G.S.; Knight, T.L. Long-term effects of conventional and no-tillage on selected soil properties and crop yields in Canterbury, New Zealand. Soil Tillage Res. 1993, 26, 193–210. [Google Scholar] [CrossRef]
- Rasmussen, P.E. Surface residue and nitrogen fertilization effects on no-till wheat. In Plant Nutrition—From Genetic Engineering to Field Practice; Barrow, N.J., Ed.; Springer: Dordrecht, The Netherlands, 1993. [Google Scholar]
- Carefoot, J.M.; Nyborg, M.; Lindwall, C.W. Tillage-induced soil changes and related grain yield in a semi-arid region. Can. J. Soil Sci. 1990, 70, 203–214. [Google Scholar] [CrossRef]
- Matzel, W.; Lippold, H. N application to winter wheat at tillering and shooting: N balance at different growth stages. Fertil. Res. 1990, 26, 139–144. [Google Scholar] [CrossRef]
- Lafond, G.P.; Clayton, G.W.; Johnston, A.M.; May, W.E.; Derksen, D.A.; Stevenson, F.C. Nitrogen management systems to optimize spring wheat under no-till: Effects on plant development. Can. J. Plant Sci. 2006, 86, 443–451. [Google Scholar] [CrossRef] [Green Version]
- Lafond, G.P.; May, W.E.; Stevenson, F.C.; Derksen, D.A. Effects of tillage systems and rotations on crop production for a thin Black Chernozem in the Canadian Prairies. Soil Tillage Res. 2006, 89, 232–245. [Google Scholar] [CrossRef]
- White, C.A.; Sylvester-Bradley, R.; Berry, P.M. Root length densities of UK wheat and oilseed rape crops with implications for water capture and yield. J. Exp. Bot. 2015, 66, 2293–2303. [Google Scholar] [CrossRef] [PubMed] [Green Version]
- Weiser, C.; Fuß, R.; Kage, H.; Flessa, H. Do farmers in Germany exploit the potential yield and nitrogen benefits from preceding oilseed rape in winter wheat cultivation? Arch. Agron. Soil Sci. 2018, 64, 25–37. [Google Scholar] [CrossRef]
- Justes, E.; Mary, B.; Nicolardot, B. Quantifying and modelling C and N mineralization kinetics of catch crop residues in soil: Parameterization of the residue decomposition module of STICS model for mature and non mature residues. Plant Soil 2009, 325, 171–185. [Google Scholar] [CrossRef]
- Christian, D.G.; Bacon, E.T.G. A long-term comparison of ploughing, tine cultivation and direct drilling on the growth and yield of winter cereals and oilseed rape on clayey and silty soils. Soil Tillage Res. 1990, 18, 311–331. [Google Scholar] [CrossRef]
- Tebrügge, F.; Düring, R.A. Reducing tillage intensity - A review of results from a long-term study in Germany. Soil Tillage Res. 1999, 53, 15–28. [Google Scholar] [CrossRef]
- Ball, B.C.; Lang, R.W.; Robertson, E.A.G.; Franklin, M.F. Crop performance and soil conditions on imperfectly drained loams after 20-25 years of conventional tillage or direct drilling. Soil Tillage Res. 1994, 31, 97–118. [Google Scholar] [CrossRef]
- Maidl, F.X.; Fischbeck, G. Auswirkungen differenzierter Bodenbearbeitung auf Ertragsbildung und Stickstoffaufnahme von Zuckerrüben bei viehstarker und viehloser Wirtschaftsweise. J. Agron. Crop Sci. 1988, 160, 29–37. [Google Scholar] [CrossRef]
- Rieger, S.; Richner, W.; Streit, B.; Frossard, E.; Liedgens, M. Growth, yield, and yield components of winter wheat and the effects of tillage intensity, preceding crops, and N fertilisation. Eur. J. Agron. 2008, 28, 405–411. [Google Scholar] [CrossRef]
- Parry, D.W.; Jenkinson, P.; McLeod, L. Fusarium ear blight (scab) in small grain cereals—A review. Plant Pathol. 1995, 44, 207–238. [Google Scholar] [CrossRef]
- David Miller, J.; Culley, J.; Fraser, K.; Hubbard, S.; Meloche, F.; Ouellet, T.; Lloyd Seaman, W.; Seifert, K.A.; Turkington, K.; Voldeng, H. Effect of tillage practice on fusarium head blight of wheat. Can. J. Plant Pathol. 1998, 20, 95–103. [Google Scholar] [CrossRef]
- Dill-Macky, R.; Jones, R.K. The effect of previous crop residues and tillage on fusarium head blight of wheat. Plant Dis. 2000, 84, 71–76. [Google Scholar] [CrossRef] [Green Version]
- Ditsch, D.C.; Grove, J.H. Influence of tillage on plant populations, disease incidence, and grain yield of two soft red winter wheat cultivars. J. Prod. Agric. 1991, 4, 360–365. [Google Scholar] [CrossRef]
- Carter, M.R.; Johnston, H.W.; Kimpinski, J. Direct drilling and soil loosening for spring cereals on a fine sandy loam in Atlantic Canada. Soil Tillage Res. 1988, 12, 365–384. [Google Scholar] [CrossRef]
Figure 1.
Effects of conventional tillage (CT), minimum tillage (MT), and no-tillage (NT) on soil Nmin content in five environments at Zollikofen. Symbols *, **, and *** indicate significant differences in Nmin (0 to 90 cm) among tillage systems at the 0.05, 0.01, and 0.001 probability levels, respectively. Bars for each sampling are always presented in the same following order: CT, MT, and NT.

Figure 2.
Effects of conventional tillage (CT), minimum tillage (MT), and no-tillage (NT) on soil Nmin content (0 to 90 cm) in three environments at Schafisheim. Symbol ** indicate significant differences in Nmin among tillage systems at the 0.01 probability level. Bars for each sampling are always presented in the same following order: CT, MT, and NT.

Figure 3.
Effects of conventional tillage (CT), minimum tillage (MT), and no-tillage (NT) on shoot N uptake of wheat in five environments at Zollikofen. Values are expressed as a percentage of those measured under the conventional tillage system. Symbols *, **, and *** indicate significant differences in shoot N uptake among tillage systems at the 0.05, 0.01, and 0.001 probability levels, respectively. † Absolute values of shoot N uptake under CT, kg N ha−1.

Figure 4.
Effects of conventional tillage (CT), minimum tillage (MT), and no-tillage (NT) on shoot N uptake of wheat in three environments at Schafisheim. Dry matter values are expressed as a percentage of that measured under the conventional tillage system. Symbols * and *** indicate significant differences in shoot N uptake among tillage systems at the 0.05, and 0.001 probability levels, respectively. † Absolute values of shoot N uptake under CT, kg N ha−1.


Table 1.
Soil characteristics at Zollikofen and Schafisheim.
| Site | Soil Depth (cm) | Zollikofen | Schafisheim |
|---|---|---|---|
| Soil classification 1 | 0–90 | Gleyic Cambisol | Orthic Luvisol |
| Soil texture | Silt-loam | loam | |
| Particle size distribution 1 (sand-silt-clay), % | 0–30 | 35/51/14 | 50/35/15 |
| pH (H2O) 2 | 0–30 | 5.6 | 6.3 |
| Organic matter (g kg−1) 3 | 0–30 | 27 | 33 |
| Ntot (g kg−1) 4 | 0–30 | 1.3 | 1.8 |
| C/N | 0–30 | 12.0 | 10.6 |
| P (g kg−1) 5 | 0–30 | 0.31 | 1.17 |
| K (g kg−1) 6 | 0–30 | 2.15 | 6.84 |
| Soil bulk density (Mg m−3) 7 | 0–10 | 1.26 | 1.21 |
| 10–20 | 1.41 | 1.29 | |
| 20–30 | 1.37 | 1.29 | |
| 30–60 | 1.55 | 1.43 | |
| 60–90 | 1.52 | 1.48 |
Table 2.
Effects of conventional tillage (CT), minimum tillage (MT), and no-tillage (NT) on grain yield of winter wheat, selected yield components, shoot N uptake and grain N content at physiological maturity in seven environments at Zollikofen.
Table 2.
Effects of conventional tillage (CT), minimum tillage (MT), and no-tillage (NT) on grain yield of winter wheat, selected yield components, shoot N uptake and grain N content at physiological maturity in seven environments at Zollikofen.
| Environment | Tillage | Shoot Biomass | Spike Density | Grains Spike−1 | TKW † | Shoot N Uptake | Grain N Content | Grain Yield | |
|---|---|---|---|---|---|---|---|---|---|
| Year | Preceding Crop | Mg ha−1 | m−2 | g | kg ha−1 | kg ha−1 | Mg ha−1 | ||
| 1996 | oats | CT | 14.65 | 533 | 27.4 | 50.3 | 205 | 163 | 7.33 |
| MT | 15.02 | 559 | 27.7 | 49.4 | 217 | 172 | 7.62 | ||
| NT | 15.57 | 625 | 24.2 | 49.2 | 217 | 169 | 7.40 | ||
| 1997 | maize | CT | 11.48 | 523 | 20.5 | 43.8 | 149 | 108 | 4.70 |
| MT | 10.82 | 433 | 25.0 | 42.5 | 148 | 111 | 4.57 | ||
| NT | 11.73 | 476 | 24.6 | 42.6 | 165 | 116 | 4.88 | ||
| oilseed rape | CT | 13.17 | 631 | 18.3 | 44.1 | 182 | 114 | 4.94 | |
| MT | 12.21 | 560 | 20.1 | 43.2 | 179 | 114 | 4.80 | ||
| NT | 12.44 | 535 | 21.3 | 42.7 | 174 | 109 | 4.74 | ||
| 1998 | maize | CT | 10.16 | 431 | 26.2 | 42.7 | 136 | 109 | 4.35 |
| MT | 10.79 | 456 | 24.5 | 42.7 | 140 | 121 | 4.77 | ||
| NT | 10.49 | 399 | 28.6 | 42.2 | 151 | 127 | 4.80 | ||
| oilseed rape | CT | 13.19 | 542 | 25.5 | 43.1 | 193 a †† | 153 a | 5.68 a | |
| MT | 11.36 | 449 | 27.3 | 42.3 | 165 ab | 136 b | 5.00 b | ||
| NT | 11.34 | 482 | 22.9 | 41.7 | 147 b | 118 c | 4.87 b | ||
| 1999 | maize | CT | 10.77 b | 396 | 28.2 | 38.5 b | 141 | 112 | 4.42 |
| MT | 13.42 a | 465 | 24.0 | 42.1 a | 166 | 111 | 4.78 | ||
| NT | 11.15 b | 437 | 25.7 | 39.6 b | 133 | 107 | 4.46 | ||
| oilseed rape | CT | 14.62 a | 512 | 24.2 | 42.4 | 208 a | 148 a | 5.15 b | |
| MT | 15.81 a | 576 | 24.1 | 42.0 | 216 a | 158 a | 5.66 a | ||
| NT | 12.98 b | 488 | 25.0 | 41.8 | 170 b | 125 b | 5.04 b | ||
† TKW: Thousand kernel weight; †† Letters indicate significant differences among tillage systems in single environments (p < 0.05).
Table 3.
Effects of conventional tillage (CT), minimum tillage (MT), and no-tillage (NT) on grain yield of winter wheat, selected yield components, shoot N uptake, and grain N content at physiological maturity in seven environments at Schafisheim. Environments are combinations of year and preceding crop.
| Environment | Tillage | Shoot Biomass | Spike Density | Grains Spike−1 | TKW † | Shoot N Uptake | Grain N Content | GrainYield | |
|---|---|---|---|---|---|---|---|---|---|
| Year | Preceding Crop | Mg ha−1 | m−2 | g | kg ha−1 | kg ha−1 | Mg ha−1 | ||
| 1997 | wheat | CT | 11.95 | 557 | 17.8 | 43.0 a †† | 163 | 110 | 4.19 |
| MT | 11.87 | 573 | 16.8 | 41.9 a | 162 | 105 | 4.03 | ||
| NT | 11.17 | 510 | 18.1 | 39.9 b | 160 | 97 | 3.70 | ||
| 1998 | maize | CT | 12.48 | 494 ab | 25.4 ab | 43.8 | 205 | 160 | 5.41 |
| MT | 11.48 | 569 a | 20.8 b | 42.4 | 183 | 147 | 5.20 | ||
| NT | 12.74 | 423 b | 30.9 a | 42.1 | 205 | 152 | 5.27 | ||
| oilseed rape | CT | 12.97 | 442 | 29.1 | 43.2 | 222 | 154 | 5.52 | |
| MT | 13.11 | 565 | 22.1 | 43.0 | 210 | 157 | 5.43 | ||
| NT | 13.04 | 482 | 24.8 | 43.9 | 204 | 148 | 5.33 | ||
| 1999 | maize | CT | 13.03 | 425 | 31.2 ab | 40.5 a | 156 | 121 | 5.21 |
| MT | 11.00 | 395 | 34.5 a | 38.6 b | 143 | 110 | 4.81 | ||
| NT | 12.22 | 495 | 25.3 b | 37.7 b | 142 | 107 | 4.70 | ||
| oilseed rape | CT | 14.29 | 447 | 31.6 | 37.3 | 209 | 143 | 5.25 | |
| MT | 14.28 | 401 | 37.0 | 37.8 | 203 | 145 | 5.47 | ||
| NT | 14.70 | 454 | 31.1 | 37.9 | 213 | 142 | 5.23 | ||
| 2000 | maize | CT | 12.11 | 477 | 24.4 | 45.6 | 180 | 136b | 5.27 |
| MT | 11.55 | 481 | 23.0 | 45.6 | 178 | 138ab | 5.05 | ||
| NT | 12.11 | 470 | 23.9 | 44.6 | 186 | 144a | 5.03 | ||
| oilseed rape | CT | 15.03 | 511 | 27.0 | 45.7 | 236 | 171 | 6.29 | |
| MT | 14.68 | 490 | 26.5 | 45.6 | 220 | 161 | 5.92 | ||
| NT | 15.06 | 510 | 26.6 | 45.9 | 226 | 164 | 6.24 | ||
† TKW: Thousand kernel weight; †† Letters indicate significant differences among tillage systems in single environments (p < 0.05).
Table 4.
Effects of conventional (CT) and no-tillage (NT) on the percentage of nitrogen in plants derived from labelled-15N from the basal N application (Ndff) and labelled fertilizer-N recovery (NR) in plants (kg ha−1) at four growth stages of wheat and four environments.
Table 4.
Effects of conventional (CT) and no-tillage (NT) on the percentage of nitrogen in plants derived from labelled-15N from the basal N application (Ndff) and labelled fertilizer-N recovery (NR) in plants (kg ha−1) at four growth stages of wheat and four environments.
| Environment | Tillage | End of Tillering | Begin of Stem Elongation | Anthesis | Physiological Maturity | |||||
|---|---|---|---|---|---|---|---|---|---|---|
| Site | Year | Ndff | NR | Ndff | NR | Ndff | NR | Ndff | NR | |
| % | kg ha−1 | % | kg ha−1 | % | kg ha−1 | % | kg ha−1 | |||
| Zollikofen | 1997 | CT | NA | NA | 54.6 a † | 18.4 | 35.6 | 50.3 | 25.9 | 46.7 |
| NT | NA | NA | 47.5 b | 15.1 | 31.5 | 57.5 | 22.9 | 41.5 | ||
| 1998 | CT | 0.16 | 0.01 | 67.1 | 17.2 a | 29.4 | 39.1 | 27.6 | 49.2 | |
| NT | 0.15 | 0.01 | 64.7 | 12.1 b | 23.7 | 29.8 | 27.3 | 47.5 | ||
| Schafisheim | 1997 | CT | NA | NA | 46.9 b | 13.2 | 32.2 | 52.5 | 22.9 | 34.4 |
| NT | NA | NA | 56.9 a | 9.4 | 31.8 | 39.5 | 22.4 | 35.0 | ||
| 1998 | CT | 0.31 | 0.04 | 46.8 b | 12.8 | 28.1 | 46.4 | 20.2 | 39.9 | |
| NT | 0.31 | 0.03 | 52.7 a | 11.2 | 25.2 | 39.6 | 19.1 | 38.6 | ||
† Letters indicate significant differences among tillage systems in single environments (p < 0.05). NA: not available.
© 2020 by the authors. Licensee MDPI, Basel, Switzerland. This article is an open access article distributed under the terms and conditions of the Creative Commons Attribution (CC BY) license (http://creativecommons.org/licenses/by/4.0/).
Share and Cite
MDPI and ACS Style
Herrera, J.M.; Noulas, C.; Stamp, P.; Levy-Häner, L.; Pellet, D.; Qin, R. Nitrogen Rate Increase Not Required for No-Till Wheat in Cool and Humid Conditions. Agronomy 2020, 10, 430. https://doi.org/10.3390/agronomy10030430
AMA Style
Herrera JM, Noulas C, Stamp P, Levy-Häner L, Pellet D, Qin R. Nitrogen Rate Increase Not Required for No-Till Wheat in Cool and Humid Conditions. Agronomy. 2020; 10(3):430. https://doi.org/10.3390/agronomy10030430
Chicago/Turabian StyleHerrera, Juan Manuel, Christos Noulas, Peter Stamp, Lilia Levy-Häner, Didier Pellet, and Ruijun Qin. 2020. "Nitrogen Rate Increase Not Required for No-Till Wheat in Cool and Humid Conditions" Agronomy 10, no. 3: 430. https://doi.org/10.3390/agronomy10030430
Note that from the first issue of 2016, this journal uses article numbers instead of page numbers. See further details here.