Article Text

Abstract
Background Biomarker-based tests for diagnosing TB currently rely on detecting Mycobacterium tuberculosis (Mtb) antigen-specific cellular responses. While this approach can detect Mtb infection, it is not efficient in diagnosing TB, especially for patients who lack aetiological evidence of the disease.
Methods We prospectively enrolled three cohorts for our study for a total of 630 subjects, including 160 individuals to screen protein biomarkers of TB, 368 individuals to establish and test the predictive model and 102 individuals for biomarker validation. Whole blood cultures were stimulated with pooled Mtb-peptides or mitogen, and 640 proteins within the culture supernatant were analysed simultaneously using an antibody-based array. Sixteen candidate biomarkers of TB identified during screening were then developed into a custom multiplexed antibody array for biomarker validation.
Results A two-round screening strategy identified eight-protein biomarkers of TB: I-TAC, I-309, MIG, Granulysin, FAP, MEP1B, Furin and LYVE-1. The sensitivity and specificity of the eight-protein biosignature in diagnosing TB were determined for the training (n=276), test (n=92) and prediction (n=102) cohorts. The training cohort had a 100% specificity (95% CI 98% to 100%) and 100% sensitivity (95% CI 96% to 100%) using a random forest algorithm approach by cross-validation. In the test cohort, the specificity and sensitivity were 83% (95% CI 71% to 91%) and 76% (95% CI 56% to 90%), respectively. In the prediction cohort, the specificity was 84% (95% CI 74% to 92%) and the sensitivity was 75% (95% CI 57% to 89%).
Conclusions An eight-protein biosignature to diagnose TB in a high-burden TB clinical setting was identified.
- Mycobacterium tuberculosis
- antibody array
- protein array
- diagnosis
- biomarker
This is an open access article distributed in accordance with the Creative Commons Attribution Non Commercial (CC BY-NC 4.0) license, which permits others to distribute, remix, adapt, build upon this work non-commercially, and license their derivative works on different terms, provided the original work is properly cited, appropriate credit is given, any changes made indicated, and the use is non-commercial. See: http://creativecommons.org/licenses/by-nc/4.0/.
Statistics from Altmetric.com
Key messages
What is the key question?
Can a protein biosignature to accurately diagnose TB be identified using a high throughput antibody array?
What is the bottom line?
An eight-protein biosignature was identified using high throughput antibody arrays following a two-round screening strategy capable of distinguishing active TB from healthy control, latent TB infection and non-TB pneumonia in a high-burden TB clinical setting.
Why read on?
The eight-protein biosignature, including four proteins have not been previously reported as potential biomarkers for TB, could be useful for diagnosis of TB in a real clinical setting. The training cohort had 100% specificity and 100% sensitivity, whereas the test cohort had 83% specificity and 76% sensitivity. The prediction cohort comprised prospectively obtained samples in a clinical setting had 84% specificity and 75% sensitivity.
Introduction
TB is a global public health problem, with an estimated 10 million newly diagnosed cases and 1.5 million deaths in 2018.1 Accurate and in-time diagnosis of TB is critical for both effective treatment and prevention of TB transmission. Unfortunately, the current diagnostic tools for TB in the lab have low sensitivity or are time consuming, including sputum smear microscopy and culturing of Mycobacterium tuberculosis (Mtb). Detection of Mtb DNA using Gene Xpert MTB/RIF is more sensitive and provides quicker results than Mtb culture,1 2 yet as many as 50% of TB cases cannot be bacteriologically confirmed even when the Mtb DNA test is combined with other microbiological tests.3 This is in part because a high number of patients are unable to provide sputum.
The development of a blood sample-based test for diagnosing TB has been recognised as an ideal alternative solution.4 5 ELISAs or enzyme-linked immunosorbent spots were designed to detect Mtb antigen-specific interferon (IFN)-γ responses in blood.6 7 Although these IFN-γ release assays (IGRAs) were initially developed to diagnose Mtb infection. However, it cannot efficiently distinguish TB from latent tuberculosis infection (LTBI).8 9 Nevertheless, IGRAs provide a platform to screen new host biomarkers alternative to IFN-γ for diagnosing TB. Several proteins have been identified in the supernatant of the QuantiFERON-TB Gold In-Tube (QFT-GIT) assay, a low throughput IGRA platform using Luminex technology.10–13 Unfortunately, the candidate proteins identified by the QFT-GIT assay have not been validated due to its limited throughput. Thus, a high throughput screening method is needed to identify multiple biomarkers for accurate TB diagnosis.
In this study, 640 proteins were first measured in the culture supernatant of Mtb-stimulated whole blood using a high throughput antibody array. Potential TB-related proteins were then analysed across three different patient cohorts comprised healthy control (HC), LTBI, non-TB pneumonia (PN) and TB to evaluate how the biomarkers performed in diagnosing TB in the real clinical setting. The data reveal an eight-protein biosignature for the diagnosis of TB.
Material and methods
Study subjects
Three cohorts of participants were recruited in this study. The first cohort consisted of 160 subjects, including 40 HC, 40 TB (definite TB), 40 LTBI and 40 PN. In the second cohort, we prospectively recruited 403 individuals. After exclusion of 35 cases, the remaining 368 individuals were subjected for further analysis, including 84 HC, 116 TB, 84 LTBI and 84 PN. In the third cohort, 111 individuals were prospectively recruited. Nine cases were excluded. A total of 102 individuals (19 HC, 32 TB, 27 LTBI and 24 PN) remained for further analysis (figure 1, table 1).

Study design and classification of study participants. In model establishment and test cohort, a total of 403 individuals were prospectively evaluated. Thirty-five individuals were excluded due to invalid culture or lack of clinical data. Of the 368 subjects, 276 (87 TB, 68 HC, 54 LTBI and 67 PN) were used as a training set to establish the diagnostic model and 92 subjects (29 TB, 16 HC, 30 LTBI and 17 PN) were used as a test set to validate the diagnostic model. In prediction cohort, 111 individuals were prospectively recruited. Nine cases were excluded and 102 individuals (32 TB, 19 HC, 27 LTBI and 24 PN) thus remained for further analysis. CXR, chest X-ray; HC, healthy control; IGRAs, interferon-γ release assays; LTBI, latent tuberculosis infection; PN, pneumonia; ROC, receiver operator characteristic.
Demographic characteristics of study populations
All subjects were enrolled at the Shenzhen Third People’s Hospital from January 2014 to December 2018. HC and LTBI patients had regular physical examinations at the hospital, and did not have pneumonia, HIV or other diseases. The patients provided a full medical history, participated in regular physical examinations and underwent routine investigations, including HIV serology, chest radiography, IGRAs and microbiological sputum examination, where possible. All TB in this study were pulmonary TB and excluded HIV infection.
Case definitions
All participants were classified as HC, LTBI, PN or TB (table 2). PN cases referred to upper or lower respiratory tract infections attributed to viral or non-Mtb bacterial pathogens, although no attempts to identify the organisms by bacterial or viral cultures were made. In the first cohort of this study, 40 TB were classified as definite TB. When assessing the accuracy of the eight-protein biosignature in diagnosing TB, all the definite and probable TB cases were classified as ‘TB’, unless otherwise indicated.
Definitions used in classifying study participants
Sample collection and preparation
Whole blood (250 µL) collected from participants using an EDTA anticoagulation tube was cultured in serum-free medium (DKW34-EHK0100, DAKEWE) in the absence or presence of 2.5 µg/mL phytohemagglutinin (PHA, L8754, Sigma) or 10 µg/mL Mtb-antigen peptide pool for 24 hours at 37°C, 5% CO2, and then the supernatant was collected. The Mtb-antigen peptide pool consisted of peptide pool A and peptide pool B, which was described previously.14
For quality control of whole blood culture, IFN-γ was measured by ELISA. Cultures with a ratio of IFN-γ >1 when comparing PHA stimulated with the non-stimulated (‘media only’) negative control were qualified as infected with Mtb and included in this study. Cultures with a ratio ≤1, were considered as invalid and excluded. The data provided in this study reflect the protein expression levels of Mtb-antigen stimulation only. Parallel blood culture supernatants from 51 participants chosen randomly from the training and test cohorts were analysed with the QuantiFERON-TB Gold (QFT-GIT; QIAGEN) assay according to the manufacturer’s instructions and to 16-protein array analysis. All laboratory procedures were blinded to patient and sample type.
Protein array assay and data preparation
For the first screening of candidate biomarkers, the supernatant was analysed a glass-based and sandwich-based antibody microarray comprised 16 non-overlapping arrays to measure 640 human proteins quantitatively (QAH-CAA-640, RayBiotech, Peachtree Corners, Georgia, USA). For the second round of screening, a custom glass-based antibody array targeting the 16 proteins-of-interest was built (RayBiotech, Peachtree Corners, Georgia, USA). Each protein was analysed in quadruplicate per array. Array processing was according to the manufacturer’s instructions.
Briefly, 100 µL of twofold diluted culture supernatant was added to each well, incubated overnight at 4°C and extensively washed. A biotin-labelled detection antibody was added for 2 hours, and then AlexaFluor 555-conjugated streptavidin was applied for 1 hour at room temperature. The slides were analysed with 532 nm excitation and 635 nm emission using an InnoScan 300 Scanner (Innopsys, Carbonne, France).
Raw data from the array scanner were provided as image files (.tif files) and spot intensities (tab-delimited.txt file) through Mapix 7.3.1 Software. Data visualisation was performed using Q-Analyzer Software (RayBiotech, Peachtree Corners, Georgia, USA). Median pixel intensities of the local background were subtracted from the median pixel intensities of individual array spots. The average spot intensity across quadruplicate spots was calculated. Interslide and intraslide signals were normalised using positive control spots. Spots with a signal intensity <5% above background were defined as non-detectable. Interslide normalisation was calculated using the third diluted standard (‘Standard 3’) and internal controls. For protein quantification, standard curves were generated using purified proteins representing the proteins-of-interest. Proteins were excluded from analyses if they had concentrations below the detection limit for over 50% of samples, resulting in a total of 590 quantifiable proteins. All the raw data were log2-transformed for statistical analysis, including supervised and bioinformatics analyses.
Data processing and figure generation
All data processing and statistical testing were performed in open source R (R Foundation for Statistical Computing, Vienna, Austria) and RStudio Software (RStudio, Boston, Massachusetts, USA). The figures were generated directly in RStudio and then arranged for publishing using Photoshop CS5 (Adobe, San Diego, California, USA).
Differentially expressed protein analysis and feature selection
Differences in log2-transformed protein expression levels for every protein between TB and non-TB were determined using the Wilcoxon rank sum test. Then the p value was adjusted based on the false discovery rate (FDR).15 Differentially expressed proteins (DEPs) were defined as those with an FDR <0.05 and a p value <0.001.
Recursive feature elimination (RFE) was performed with R package ‘caret’ to select DEPsfor diagnostic model using 14 proteins with 10-fold cross-validation.16 The performance was evaluated with area under the curve (AUC) analysis to identify which combination of proteins contributed the most to predicting TB.
Supervised diagnosis model building
A supervised prediction analysis employing a series of mathematical models, including random forest algorithm (RF), linear discrimination analysis (LDA) and support vector machine (SVM), was performed using the R package caret”.17 In the second study arm, the data were randomly split into two subsets at a ratio of 3:1. The larger (75%) subset was used to train the model while the smaller subset (25%) was used to test the model (figure 1). The parameters in RF model for the eight-protein biosignature were: mtry=2, trees=500 and nodes=109. For the cross-validation, a fivefold cross-validation and five-time repeat were performed with a p=0.75. The preprocessing options (preProcOptions) included a threshold (thresh)=0.96, ICAcomp=3, k=5, freqCut=9, uniqueCut=10 and cut-off=0.9. A detailed description ofRF model building was provided in online supplementary file. Model performance was evaluated using accuracy values from the cross-validation model training and AUC analysis. Each observation was assigned a probability ranging from 0 to 1. The cut-off values were then adjusted to get the optimal sensitivity and specificity based on the Youden’s index. One of the decision trees used in our RF model is displayed in online supplementary figure S1.
Supplemental material
Results
Identification of 16 candidate protein markers of TB
To identify potential protein markers of TB, high throughput antibody-based protein microarrays were employed to measure 640 human proteins in cultured supernatant from 160 subjects. Protein levels in the TB cohort and non-TB cohort were compared, with 17 proteins (MIG, Furin, I-309, IL-1 F7, EGF R, I-TAC, MEP1B, Granulysin, MDGA1, FAP, FOLR2, PDGF-CC, IGFBP-5, LYVE-1, CRIM1, CHI3L1 and CNTFR alpha) having an FDR <0.05 and p value <0.001. CNTFR alpha was excluded because its linear range was narrow and the protein was not detected in many samples. The remaining 16 proteins are listed in table 3.
Expression levels of 16 proteins differentially expressed between TB and non-TB
Identification of an eight-protein biosignature for TB diagnosis with an antibody array
To further refine candidate biomarkers for diagnosing TB, the performance of 16 proteins initially identified in the prospective cohort was evaluated using a custom antibody array targeting the 16 proteins with cultured blood samples from 368 individuals. Two proteins, IGFBP-5 and IL-1 F7, were excluded in the following analyses since the proteins were undetectable in ≥50% of the samples. Next, RFE method was applied to explore all possible subsets of the proteins. In a comparison of the diagnostic accuracy of TB with different protein subsets, we found that the AUC of 8 proteins (I-TAC, I-309, MIG, FAP, Granulysis, MEP1B, Furin and LYVE-1) was the highest, which was 0.8145 with 47.42% specificity and 93.26% sensitivity (see online supplementary table S1).
A diagnostic model was built based on the eight-protein signature using a training cohort comprised 276 randomly selected samples from the 368 subjects, including 87 TB and 189 non-TB. A series of mathematical models were applied to the eight proteins, with RF modelling identified as the best diagnostic model compared with LDA and SVM due to its superior AUC, specificity and sensitivity (see online supplementary table S2). The mean decrease in Gini index for the eight proteins was calculated (figure 2A). Among them, I-TAC, I-309 and MIG had the highest differential expression in TB with Gini indices of 24.54, 18.47 and 16.78, respectively.
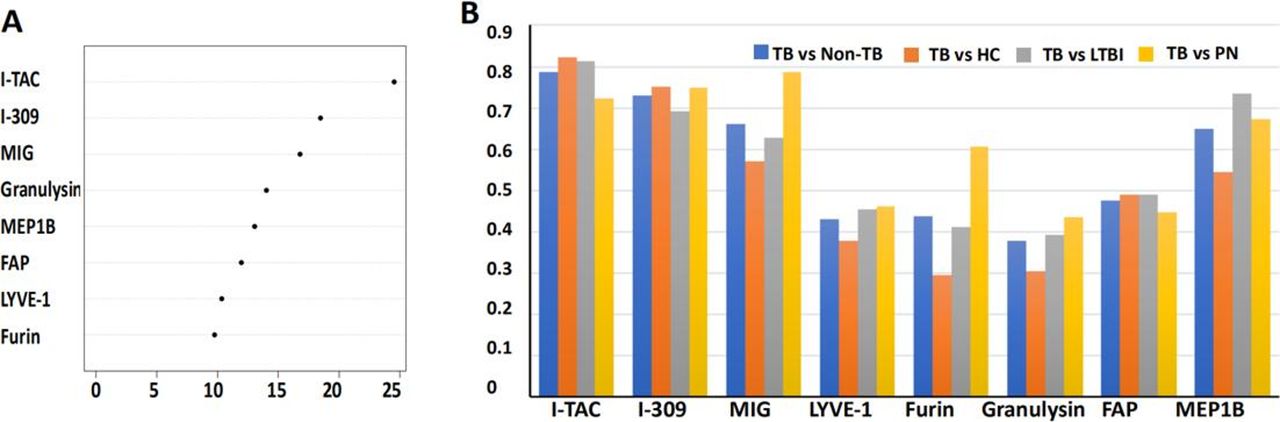
Inclusion of different analytes into eight proteins for the diagnosis of TB disease. (A) Overall importance index of the proteins in the eight-protein biosignature to the RF model, where a higher number reflects higher importance. (B) AUC values obtained from receiver operator characteristic curve analysis of each of the proteins in the eight-protein biosignature distinguishing definite TB (n=53) from non-TB (n=252), HC (n=84), LTBI (n=84) and PN (n=84), respectively. FAP, fibroblast activation protein; HC, healthy control; I-TAC, interferon-inducible T-cell alpha chemoattractant (also called CXLC11); I-309, also called CCL1/TCA3; LTBI, latent tuberculosis infection; LYVE-1, lymphatic vessel endothelial hyaluronan receptor 1; MEP1B, meprin A subunit beta; MIG, monokine induced by gamma interferon (also called CXCL9); PN, pneumonia; RF, random forest algorithm
In the second cohort, 53 of the 116 TB were classified as definite TB by aetiological evidence. Using receiver operator characteristic curve analysis, the AUC values to diagnose definite TB disease using the eight proteins were 0.38–0.78 (see online supplementary table S3). Although I-TAC had the highest AUC value for distinguishing definite TB from non-TB (AUC=0.79), its performance for discriminating definite TB from HC was moderate (AUC=0.82). These data suggest that a multiprotein signature is necessary to accurately distinguish active TB from non-TB, including HC, LTBI and PN (figure 2B, online supplementary table S3).
Utility of eight-protein biosignature in diagnosing TB with RF modelRF modelling
The combination of the eight proteins provided excellent accuracy (AUC=1) for distinguishing TB from non-TB in the training cohort using the RF model at an optimal threshold of 0.4 (figure 3A). The RF model classified TB and non-TB with 100% specificity (95% CI 98% to 100%) and 100% sensitivity (95% CI 96% to 100%) when compared with the clinical diagnosis using the RF model (table 4). To test the RF model, we used a test cohort consisting of 29 TB and 63 non-TB (figure 1), achieving an AUC of 0.802 (95% CI 69.6% to 90.9%), diagnostic specificity of 83% (95% CI 71% to 91%) and sensitivity of 76% (95% CI 56% to 90%) (figure 3B, table 4).

Receiver operator characteristic (ROC) curve analyses of individual cohorts. ROC curves produced from the training cohort (A), test cohort (B) and prediction cohort (C) using the RF model. AUCs in different cohorts are shown. AUC, area under curve; RF, random forest algorithm.
Diagnostic accuracy of the eight-protein biosignature in diagnosing TB
To verify the accuracy of the eight-protein model to distinguish TB from non-TB, an independent ‘prediction’ sample cohort consisting of 102 individuals was employed. More specifically, 32 of the volunteers had TB while 70 did not (19 HC, 27 LTBI and 24 PN). The AUC in differentiating TB from non-TB was 0.915 (95% CI 86.3% to 96.7%), with 84% specificity (95% CI 74% to 92%) and 75% sensitivity (95% CI 57% to 89%) (figure 3C, table 4).
Notably, to ensure that the inclusion of probable TB data did not impair the diagnostic accuracy of the eight-protein signature, we reanalysed the sensitivity and specificity of the biosignature using probable or definite TB (see online supplementary table S4). In the test cohort, the specificity and sensitivity were 84.13% (95% CI 73% to 92%) and 73.33% (95% CI 41% to 87%) in differentiating probable TB from non-TB, and 84.13% (95% CI 73% to 92%) and 78.57% (95% CI 59% to 100%) in differentiating definiteTB from non-TB. Similar data were obtained with the prediction cohort (see online supplementary table S4). The comparable sensitivities and specificities indicate that pooling the probable and definite TB cases into one group (ie, ‘TB’) did not decrease the model performance.
In order to compare the diagnostic accuracy of the eight-protein biosignature between different groups (HC, LTBI or PN). In the test cohort, the specificity and sensitivity were 81.25% (95% CI 54% to 96%) and 75.86% (95% CI 56% to 90%) in differentiating TB from HC and the specificity, and 89.47% (95% CI 67% to 99%) and 75% (95% CI 57% to 89%) in the prediction cohort. For differentiating TB from LTBI, the specificity and sensitivity of the test cohort were 80% (95% CI 61% to 92%) and 75.86% (95% CI 56% to 90%). The specificity was higher in the prediction cohort at 88.89% (95% CI 71% to 98%). TB were differentiated from PN with a specificity of 94.12% (95% CI 71% to 100%) in the test cohort and a 75% (95% CI 53% to 90%) in the prediction cohort (see online supplementary table S5). These data indicate that our eight-protein biosignature model might be useful in diagnosing TB.
Comparison of in-house culture and the QFT-GIT assay in diagnosing TB
To validate the reliability of our laboratory culture system, we performed whole blood culture in parallel using the QFT-GIT assay for 51 samples including 16 TB, 14 HC, 17 LTBI and 4 PN. The proteins in our eight-protein signature were detected using an antibody array. Analysis of the 8-protein biosignature in the QFT-GIT supernatant for diagnosing TB revealed an AUC of 0.92 (95% CI 84.7% to 99.4%), with 60% specificity (95% CI 42% to 76%) and 100% sensitivity (95% CI 79% to 100%) (see online supplementary figure S2A). When the eight-protein signature of our in-house culture system was tested in its ability to diagnose TB accurately, it had an AUC of 1 (95% CI 100%), with 100% specificity (95% CI 79% to 100%) and 100% sensitivity (95% CI 90% to 100%) (see online supplementary figure S2B). Thus, our in-house culture system performed better than the QFT-GIT assay.
Discussion
Here, an eight-protein biosignature for diagnosing TB from stimulated whole blood culture was identified after screening 640 human proteins. Using RF classification, the eight-protein biosignature efficiently discriminated TB from non-TB, including HC, LTBI and PN. The eight-protein biosignature’s sensitivity and specificity of 75% and 84%, were then confirmed in an independent prospective cohort in a clinical setting. This is the first biosignature consisting of host proteins that can discriminate TB from HC, LTBI and PN.
The diagnostic accuracy of our prediction dataset was not as high as the training model. However, this is not unusual since a model is trained by maximising its accuracy with the training set. For example, all three different principle machine learning algorithms (SVM, LDA and RF) that we applied performed better with the training set than the prediction set. Overfitting of the training cohort may be one reason why the model was not as accurate with the validation cohort. We tried to minimise overfitting of the training set by tuning the parameters, architectures and data preprocessing. We also selected the RF model, which seldom overfits the data in practice since the generalisation ‘test set’ error does not increase as the model gets more complex (ie, as the number of trees goes to infinity).18 This can be further ensured by having the appropriate amount of trees and tree depth.19 The second reason why different accuracies were observed between the training and test/prediction sets in our study might be due to the known molecular heterogeneity of TB. Whereas most patients infected with Mtb will remain in a clinically asymptomatic, contained state termed LTBI, less than 10% of patients will eventually develop clinical manifestations of TB. There is also a spectrum of varying symptoms, microbiologies, immune responses and pathologies between TB and LTBI. For example, active TB can have different patterns of lung involvement. Some LTBI with higher burden latent infection share a similar molecular transcriptional signature with active TB.20 The limited sample size may be the third possible reason. Therefore, the accuracy of our biomarkers will likely improve with further stratification of the disease as well as an increase in participants. Moreover, the RF model can be optimised by changing the RF architecture (eg, number of trees, depths of the individual trees, parameter tuning).
Direct detection of Mtb and its antigens provide evidence of TB, yet few reports are currently available. This is likely because Mtb is not a blood-borne pathogen and, as such, Mtb antigen concentration in the circulation is extremely low.21 22 One technology that has shown promise in diagnosing TB is a nano-dish based technology that detects Mtb antigen-derived peptides in plasma; however, it has not been validated in a larger cohort TB.23 Expensive technology platforms that require extensive training to operate (eg, mass spectrometry) might restrict its clinical application, particularly in rural areas. Since Mtb infection elicits strong host responses, it has been generally accepted that host proteins might be useful, alternative markers for TB diagnosis.24 Several groups have identified host-derived biomarkers of TB with the Luminex platform using blood culture supernatant (ie, QuantiFERON).25 26 This platform is limited to analysing ≤50 proteins at a time, which may impede biomarker discovery studies. Only one sample can be analysed at a time as well. Thus, the analysis of unstimulated and stimulated Mtb factors for TB diagnosis will decrease the throughput in clinical applications.25
In this study, a high throughput antibody array enabled the screening of 640 host proteins in Mtb antigen-stimulated whole blood culture, which resulted in the identification of an eight-protein biosignature for TB. Among them, MIG in blood culture supernatant has been previously reported as a candidate biomarker for Mtb infection,27 whereas serological I-TAC, MIG and I-309 have been implicated as biomarkers of TB.28–30 The concentration of Granulysin in serum is inversely correlated with increased IFN-γ levels in culture supernatant, and has also been suggested as biomarker of Mtb infection.31 Notably, our study identified several host proteins, such as FAP, Furin, LYVE-1 and MEP1B, which have not been previously reported as potential TB biomarkers. FAP is a member of the S9B prolyl oligopeptidase subfamily, which is believed to control fibroblast growth or epithelial-mesenchymal interactions during development, tissue repair and epithelial carcinogenesis.32 Interestingly, another member of the S9B subfamily, DPPIV, is enriched in pleural fluid and is useful for diagnosing tuberculous pleurisy.33 LYVE-1 is a marker of lymphatic vessels and its mRNA was highly expressed in lymph nodes from macaque infected with Mtb.34 Furin is a proprotein convertase that cleaves proteins downstream of a basic amino acid target sequence.35 In addition to processing cellular precursor proteins, Furin is also utilised by a number of pathogens, such as HIV and the influenza virus.36 Although the role of Furin in TB pathogenesis is unknown, expression of Furin in T-cells is required for the maintenance of peripheral immune tolerance. We hypothesise that decreased Furin expression in TB contributes to excessive T cell activation, which results in tissue damage.
A comparison of our in-house culture system with the QFT-IT assay to simulate the whole blood showed that our culture system has better sensitivity and specificity than the QFT-IT assay. The improved accuracy with our in-house culture system may be due to a biassed diagnostic model, which was built using data collected from our culture system that may have different antigens than the QFT-IT assay.
Patients infected with HIV were excluded from this study because HIV infections increase the risk of TB. However, it would be interesting to evaluate the performance of the eight-protein biosignature in a prospective HIV-positive TB cohort since HIV infection may affect the host protein response to Mtb infection.
In summary, an eight-protein biosignature capable of diagnosing TB from HC, LTBI and PN in a high-burden TB clinic setting was identified using a two-round screening strategy.
Acknowledgments
The authors would like to thank Dr Jessica Tamanini (Shenzhen University Health Science Center, ETediting) and Dr Brianne Petritis (RayBiotech Life, Parkway Lane, Peachtree Corners, Georgia, USA) for editing the manuscript prior to submission.
References
Footnotes
Contributors R-PH, XC and QY designed the research and drafted the manuscript. QY, HZ and YY managed the database and statistical analyses. GD, TY, QD and GL collected the samples and clinical data. QC, MZ, YC, FY, JZ and QY performed the experiment. All authors were involved in critically revising and providing final manuscript approval.
Funding Financial supports for this work were provided by the National Science and Technology Major Project (2017ZX10201301-001-001, 2017ZX10201301-001-002) and by the Natural Science Foundation of China (81525016, 81671984), Guangdong Provincial Science and Technology Programme (2019B030301009). Science and Technology Project of Shenzhen (JCYJ20160427184123851, JCYJ20170412101048337) and Jin Qi team of Sanming Project of Medicine in Shenzhen (SZSM201412001).
Competing interests HZ, YY and R-PH are employees of RayBiotech Life, a company producing commercial antibody arrays, including the antibody array targeting 640 human proteins that was used in this study. The custom antibody array targeting 16 proteins was also produced by RayBiotech.
Patient consent for publication Not required.
Ethics approval The study was approved by the Institutional Review Board of Shenzhen Third People’s Hospital.
Provenance and peer review Not commissioned; externally peer reviewed.
Data availability statement Data are available in a public, open access repository. All protein data were uploaded to the GEO repository (No. GSE 133249, GSE141848).