Article

Genetic Basis Dissection for Eating and Cooking Qualities of Japonica Rice in Northeast China

State Key Laboratory of Rice Biology, China National Rice Research Institute, 310006, China
*
Author to whom correspondence should be addressed.
Authors who contributed equally to this work.
Agronomy 2020, 10(3), 423; https://doi.org/10.3390/agronomy10030423
Submission received: 19 January 2020 / Revised: 28 February 2020 / Accepted: 16 March 2020 / Published: 20 March 2020
(This article belongs to the Special Issue Analysis of Crop Genetic and Germplasm Diversity)

Abstract

:
The japonica rice in Northeast China is famous because of its high quality. Eating and cooking qualities (ECQs) are the most important factors that determine cooked rice quality. However, the genetic basis of ECQ of japonica varieties in Northeast China needs further study. In this study, 200 japonica varieties that are widely distributed in Northeast China were collected to evaluate the physicochemical indices of grain ECQs. The distribution of each trait was concentrated without large variations. Correlation analysis indicated that gel consistency (GC) had a significantly negative correlation with gelatinization temperature (GT). By integrating various analyses including kinship calculation, principal component analysis (PCA), linkage disequilibrium (LD) analysis, and original parent investigation, we found that the japonica varieties in Northeast China exhibited a narrow genetic basis. An association study for grain ECQs was performed and eight quantitative trait loci (QTLs) were detected. ALK was the major locus that regulated GT and also significantly affecting GC. Through the linkage disequilibrium (LD) and expression pattern analysis, one possible candidate gene (LOC_Os02g29980) was predicted and required further research for validation. Additionally, a different allele of Wx was identified in the variety CH4126, and ALK was not fixed in these japonica varieties. These results further elucidate the genetic basis of ECQs of japonica varieties in Northeast China and provide local breeders some assistance for improving ECQs of rice grain in rice breeding.

1. Introduction

Rice (Oryza sativa L.) is a staple food and feeds more than half of the world’s population [1]. In China, rice production has increased almost every year. Because of the increasing rice yield and living standard for customers, more and more rice breeders and consumers have been focusing on rice grain quality, which includes grain milling, appearance, eating and cooking qualities, and nutritional quality. Eating and cooking qualities (ECQs) are the most important factors that determine cooked rice quality. Amylose content (AC), gel consistency (GC), and gelatinization temperature (GT) are the key physicochemical properties of ECQs.
Starch is the major component of rice grain which usually contains two types of starch, i.e., amylose and amylopectin [2]. AC is considered to be the most important factor among rice ECQ. The rice grains with high AC are usually dry, separate, and firm when cooked, whereas rice grains with low AC are soft, glossy, and cohesive [3]. Rice grains with diverse AC meet various demands of consumers [4]. GC is the measure of rice starch gel strength and is another property that reflects firmness and stickiness of cooled cooked rice. Therefore, it has been used as a key character to determine the texture property of cooked rice [5]. It has been demonstrated that cooked rice with high GC is softer than that with low GC. Alternatively, GT is the temperature at which the starch surface changes into a soluble state, and it is partly responsible for the rice cooking time [6]. GT is usually estimated using the alkali spreading value (ASV). Rice grains with low ASV require a short cooking time, which is a good indicator of rice grain quality.
Many studies about ECQs have been previously reported, and ECQs are considered to be the most complex quantitative traits in rice. Waxy gene (Wx) was the first gene identified, which is responsible for controlling AC [7]. Wx encodes a granule-bound starch synthase and has also been reported to be the main controller of GC and a minor controller of GT [8,9,10]. Generally, AC in japonica rice grain is lower than that in indica rice grain, due to the two Wx alleles, Wxa and Wxb, respectively [11]. The Wxa allele is widely distributed in most indica rice, whereas the Wxb allele is found in japonica rice. ALK, encoding the soluble starch synthase II (SSSII), is currently the only major gene known to be associated with GT [12]. ALK also has a minor effect on GC, which is similar to Wx [8]. Actually, there are close relationships among these three physiochemical properties. Tian et al. [13] found that AC negatively correlated with GC and GT, and GC positively correlated with GT. In addition, other genes, especially the starch synthesis-related genes, had minor effects on rice ECQ [14].
To facilitate rice breeding with high ECQ, genetic dissection of rice grain ECQ is essential. Quantitative trait locus (QTL) mapping is an effective method for clarifying the molecular and genetic basis of rice grain ECQ. Sun et al. [15] detected eight major QTLs and 27 epistatic QTL pairs for AC, GC, GT, and protein content. Eight physiochemical properties related to ECQs were studied using 190 RILs population with the parents of japonica Tainung 78 and indica Taichung Sen 17. As a result, 24 QTLs were detected and most of them overlapped the starch synthesis-related genes [16]. Guo et al. [17] used the doubled haploid population derived from a cross between two japonica varieties to analyze the grain cooking and nutrient qualities and found 20 QTLs for AC, GC, GT, and protein content. Additionally, Leng et al. [18] also used the DH population derived from a japonica/indica cross and detected 18 QTLs for ECQ-related traits.
Recently, with the development of association mapping and the reduced cost of genotyping, it has become easy to obtain the high-density single nucleotide polymorphism (SNP) markers by using next-generation sequencing or SNP chip methods. Many associated mapping studies have previously reported on rice yield, disease resistant, rice quality, and plant architecture [19,20]. Xu et al. [21] used resequencing data and performed an associated study for 10 ECQs-related traits. Many loci were detected and some of them were close to the starch synthesis-related genes. Wang et al. [22] used 258 accessions selected from the 3K Rice Genome Project and included measurements of their physicochemical quality traits to study the genetic mechanism of rice ECQs. The results showed that 19 QTLs were detected for rice ECQs, and some new genes were predicted using gene-based association mapping.
The rice grown in Northeast China is famous for its high quality. Previous reports have shown that high rice quality benefited from the excellent light and temperature conditions in Northeast China [23]. In addition to the environmental factors, the genetic basis of these varieties is also crucial for determining rice quality. However, the genetic basis of the japonica varieties in Northeast China is poorly understood. In this study, 200 japonica varieties widely distributed in Northeast China were collected to evaluate the physicochemical indices of grain ECQs. We performed an association study, in Northeast China, on grain ECQs to characterize the genetic basis of high grain quality and provide breeders, in the area, some assistance for rice breeding.

2. Methods

2.1. Plant Materials

The population comprised of 200 japonica varieties which are widely distributed in Northeast China was used in this study (Supplementary Table S1). All of these varieties were conserved in the China National mid-term Genebank for rice and previously described by Ye et al. [24].The rice varieties were planted at the experimental farm of Shenyang Agricultural University. Every variety of the population was planted in four rows with six plants in each row, and the planting destiny was 20 × 20 cm. At harvest time, the seeds were obtained from each line for further phenotypic identification.

2.2. AC, GC, and GT Evaluation in Rice Grain

The rice grains were harvested, dried, and stored at room temperature for at least three months before milling. The rice grains of each variety were dehulled using an electrical dehuller (Xinfeng JLGJ4.5, China), and then milled using the sample miller (Model JB-20, China). A total of 24 hulled grains was selected for the alkali spreading value (ASV) measurement, as in the previous study [12]. Approximately 30 g of grains were ground to flour in order to evaluate the AC and GC, as previously described in [18]. The measurements of AC and GC were performed with three biological replicates, respectively.

2.3. Genotyping, Kinship, and LD Decay Analysis

All 200 japonica rice varieties were genotyped for 90K SNPs using a high-density rice array [24]. Only 21,308 SNPs were selected for further study due to the following filter criterion: missing data ratio (MDR) <0.2 and markers with frequency of minor allele (MAF) >0.05 (Supplementary Table S2). The kinship matrix was calculated using TASSEL software [25]. The linkage disequilibrium (LD) coefficient was calculated using the PLINK software and the LD decay plot was drawn using Microsoft Excel software.

2.4. Genome-Wide Associated Mapping

The genome-wide associated study (GWAS) was performed to detect the association between phenotype and genotype using TASSEL software [25]. A mixed linear model was used for the associated mapping. Kinship and principal components analysis (PCA) were used to correct the GWAS results. Among these, the PCA was calculated using EIGENSOFT [26]. To obtain independent association signals, multiple SNPs passing the threshold on the same chromosome were clustered as one association locus, and the SNP with the minimum P-value in a cluster was considered as the lead SNP. The threshold value was determined as follows:
Pthreshold = 1/N
where N indicates the number of SNPs used in GWAS and Pthreshold indicates the threshold of the P-value.
In our study, to simplicity, the –log10(P) = 4 was used for the threshold value Equation (1).

2.5. Candidate Gene Analysis

According to the GWAS results, we calculated the LD decay to discover the candidate regions of the significant loci using the Haploview software (Broad Institute of MIT and Harvard, Cambridge, Massachusetts, USA) [27]. The expression pattern of the genes in the candidate region was obtained from the RNA-seq database in the Rice Genome Annotation Project (http://rice.plantbiology.msu.edu/).

3. Results

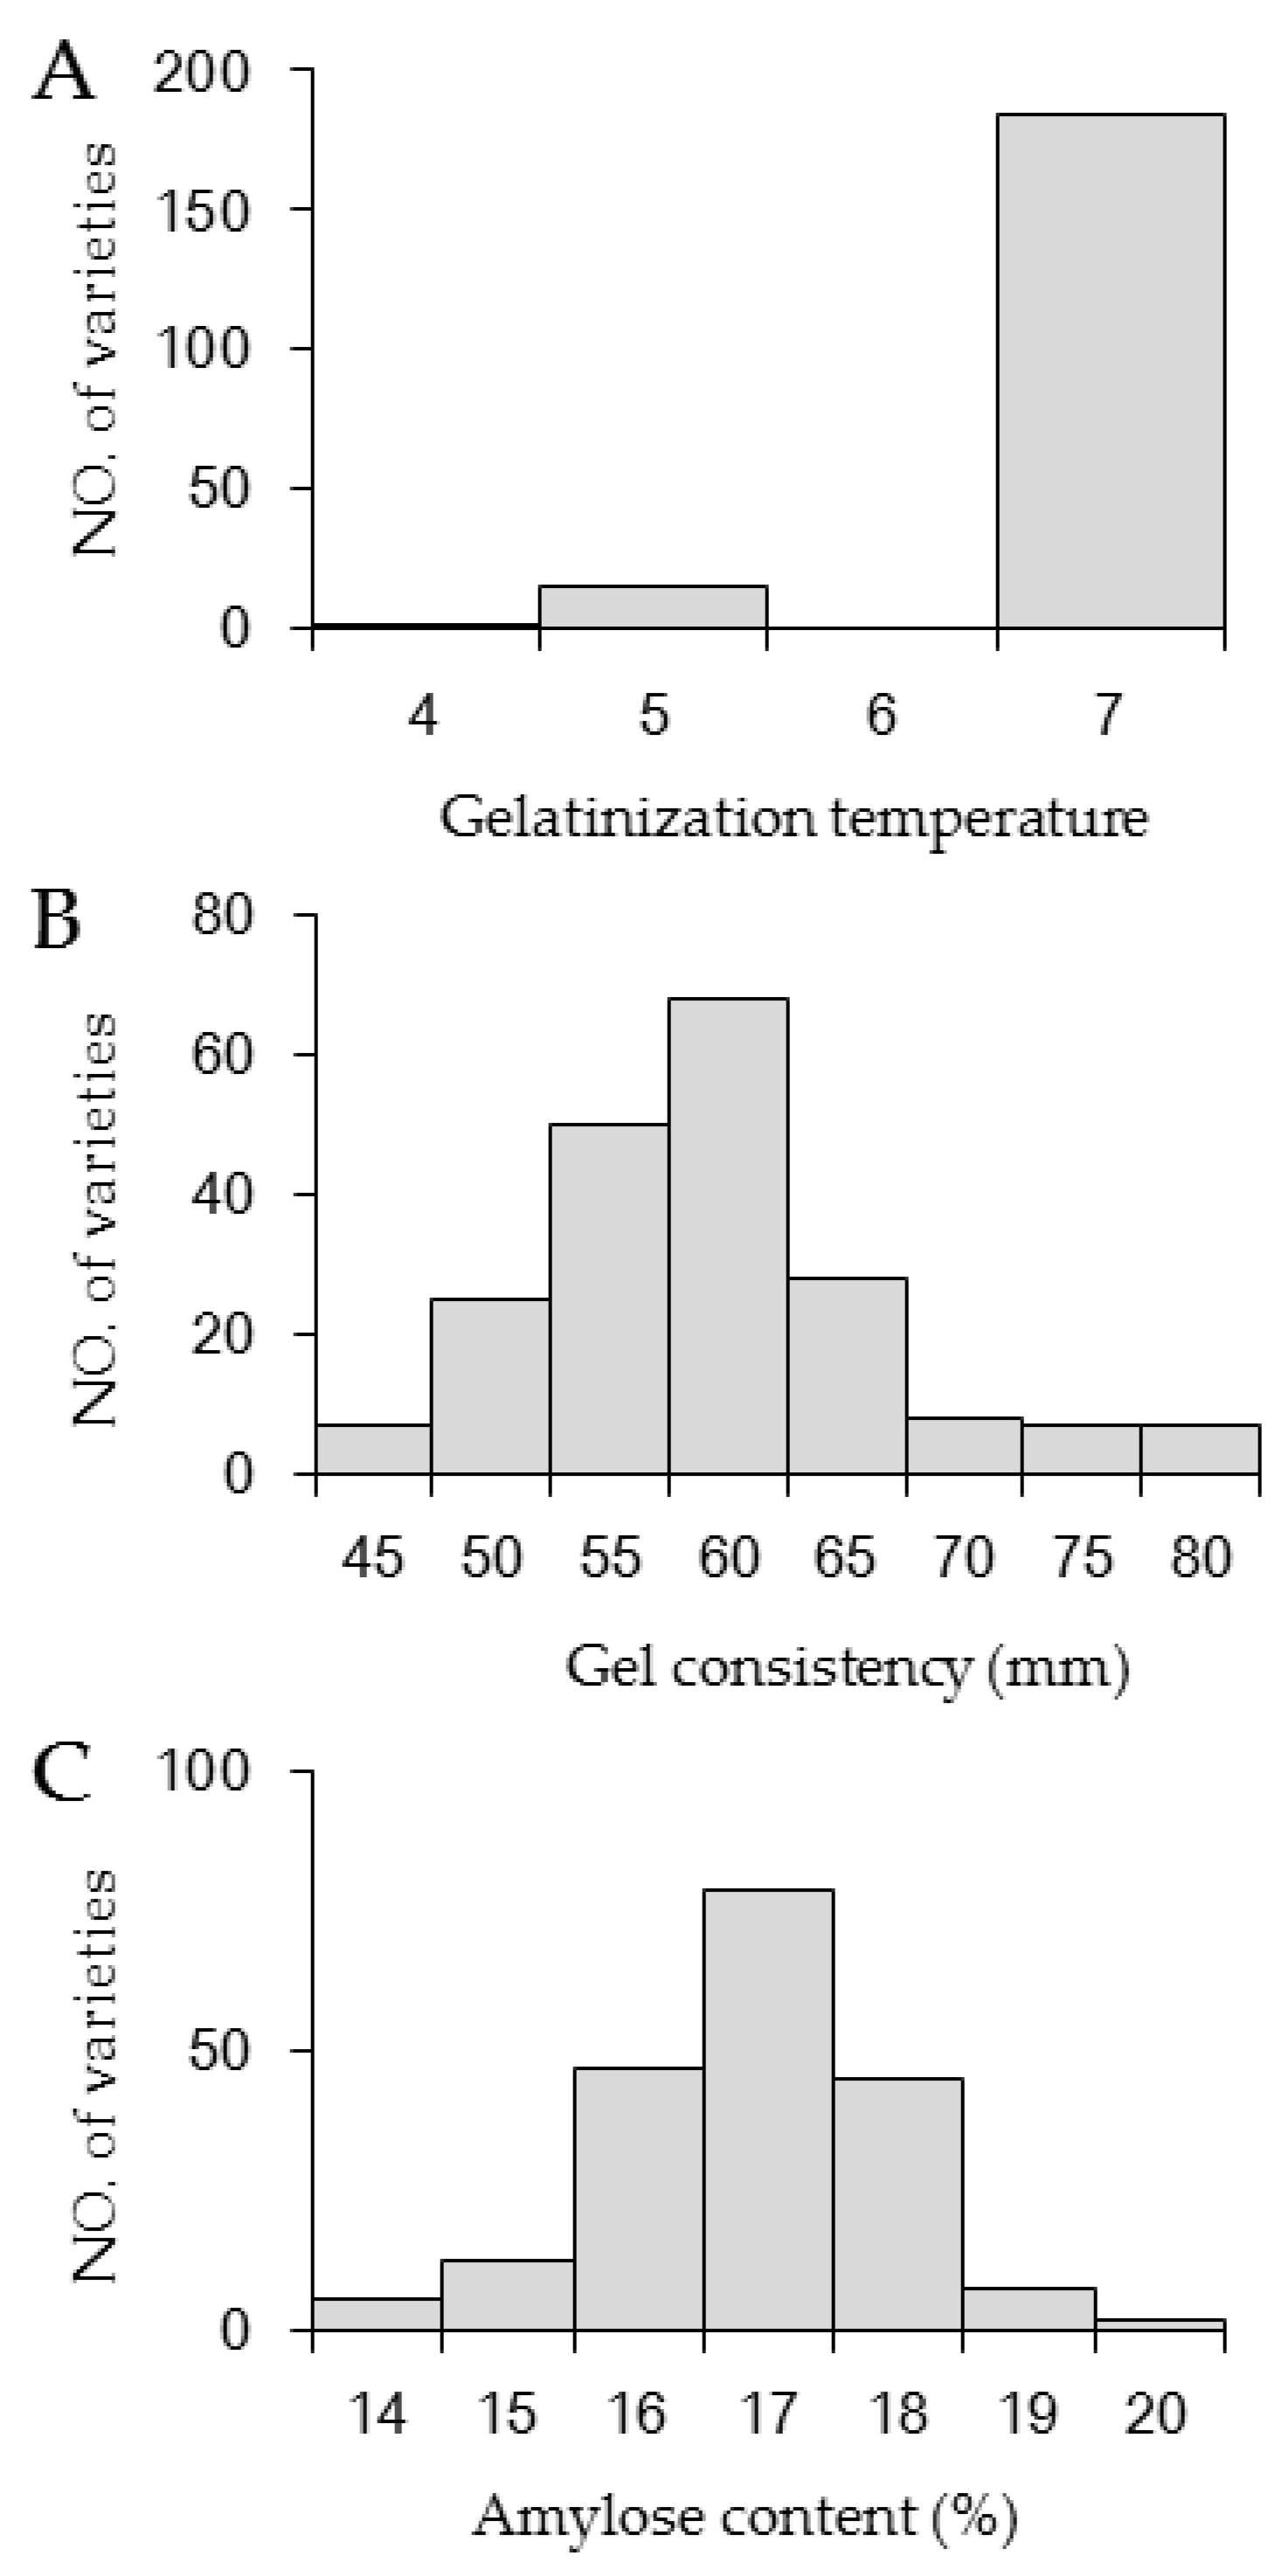
3.1. Distributions of AC, GC, and GT in the Japonica Population

Except for GT, all traits showed continuous distributions and large variations in the japonica population (Figure 1). For GC, the value of every variety ranged from 45 to 80 mm, and mostly focused on the length between 50 and 65 mm (Figure 1B). The AC ranged from 14% to 20% and more than half of varieties harbored the AC of 16%~18% (Figure 1C). Therefore, most of the varieties exhibited low AC (12% to 20%) and medium GC (41 to 60 mm). In addition, the distribution of GT was discontinuous. The value of GT was focused on the degree 4~5 and 6~7, with the largest portion focused on degree 6~7 (Figure 1A).

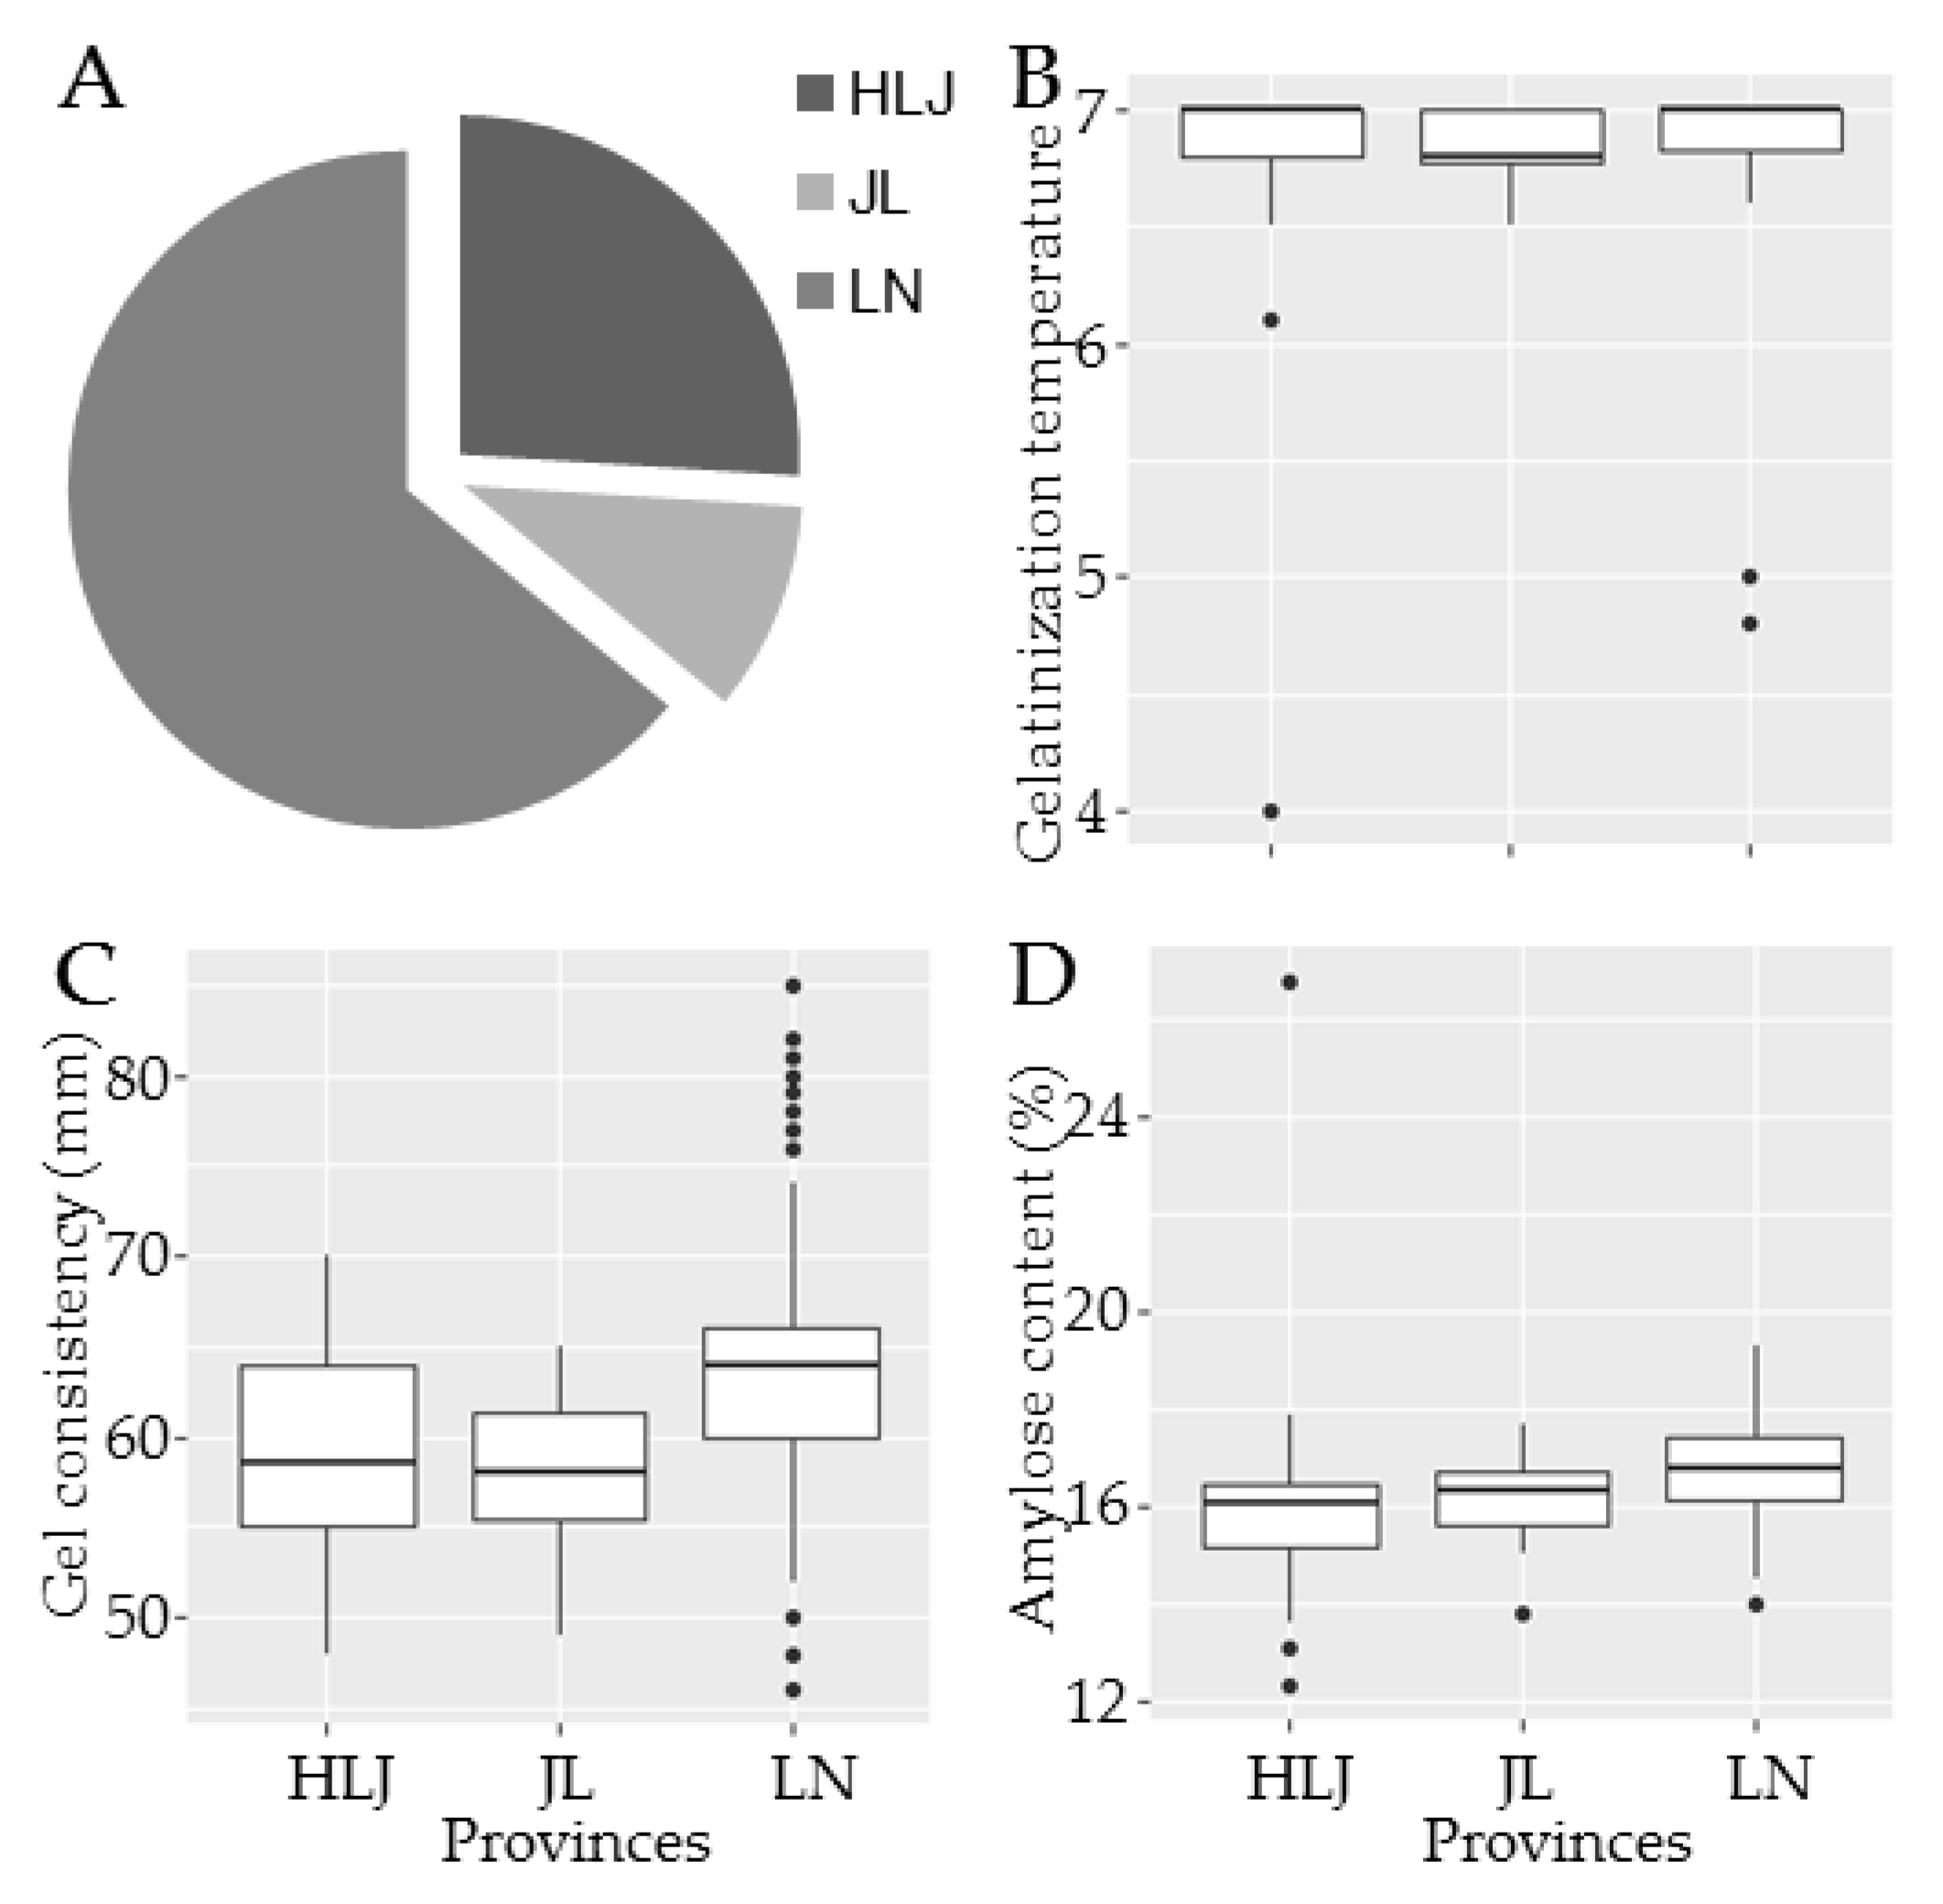
3.2. Geographical Distributions of Rice Varieties

We found that more than half of the varieties were from Liaoning province (LN), whereas only 52 and 20 varieties were from Heilongjiang province (HLJ) and Jilin province (JL), respectively (Figure 2A). To investigate the regional differences of these traits, we compared every trait among the three provinces and found that the AC in the varieties planted in the north was lower than that of those varieties grown in the south. Moreover, the GC of the varieties from LN was softer than that of those varieties from HLJ and JL. In addition, there was no regularity in the GT (Figure 2B–D).

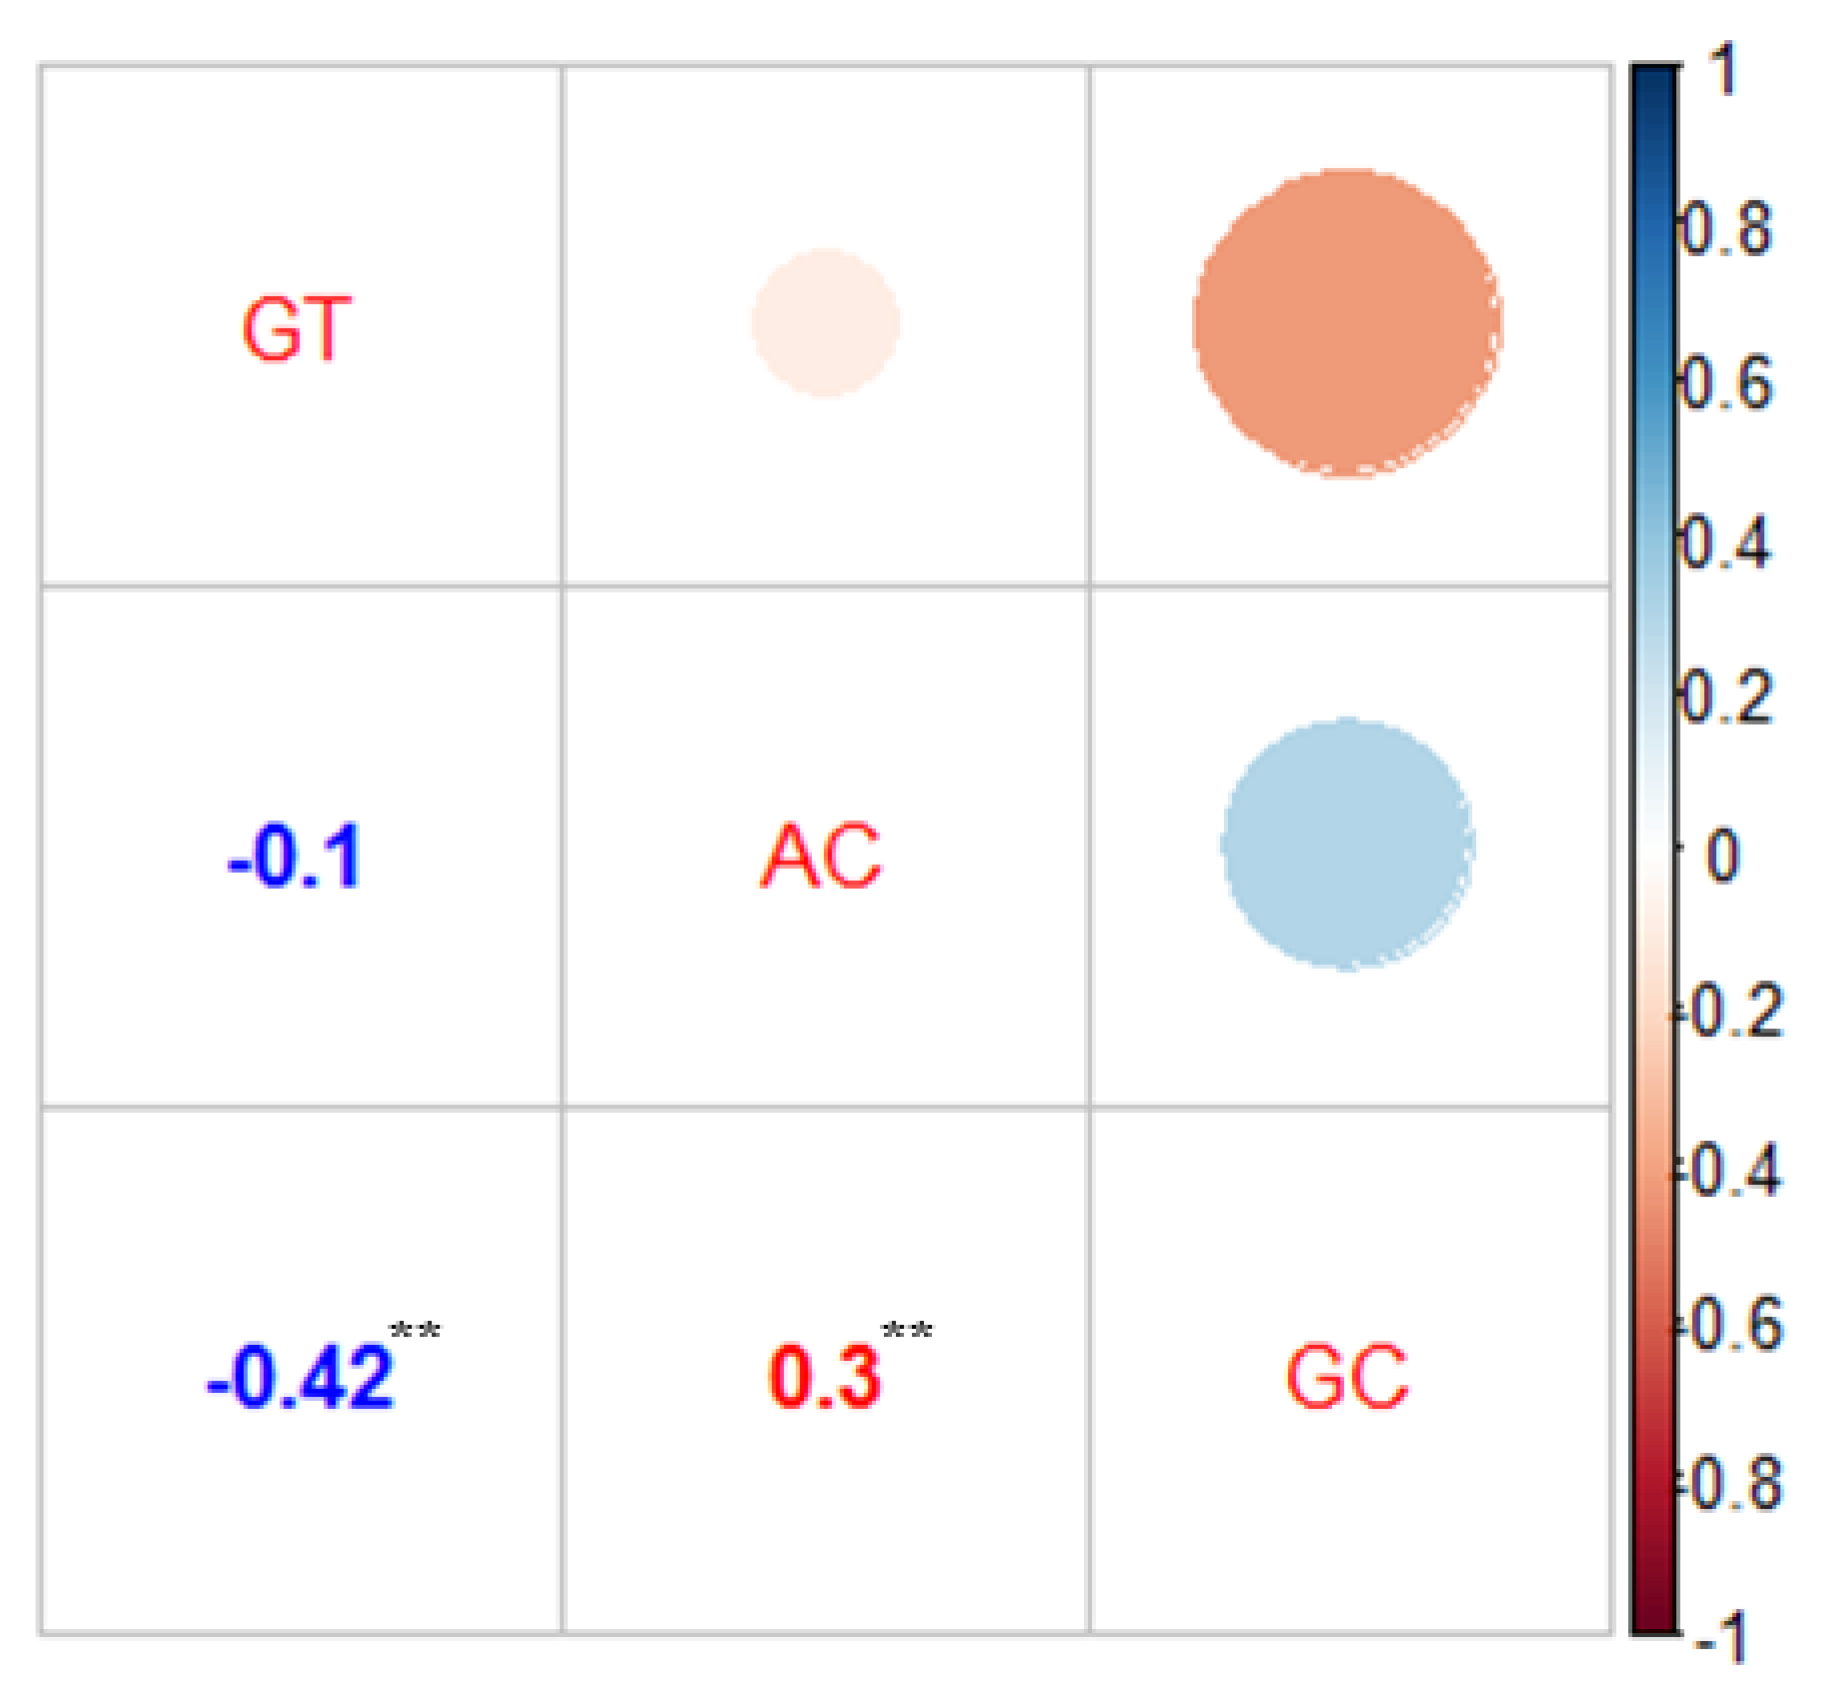
3.3. Correlation Analysis of AC, GC, and GT

AC, GC, and GT collectively affect the ECQ in rice grain. The correlation analysis showed that AC exhibited a significant positive correlation to GC with the correlation coefficient of 0.3. The highest negative correlation was observed between GT and GC, and the correlation coefficient reached up to -0.42. In addition, there was no significant correlation between GT and AC, and the correlation coefficient was -0.1 (Figure 3).

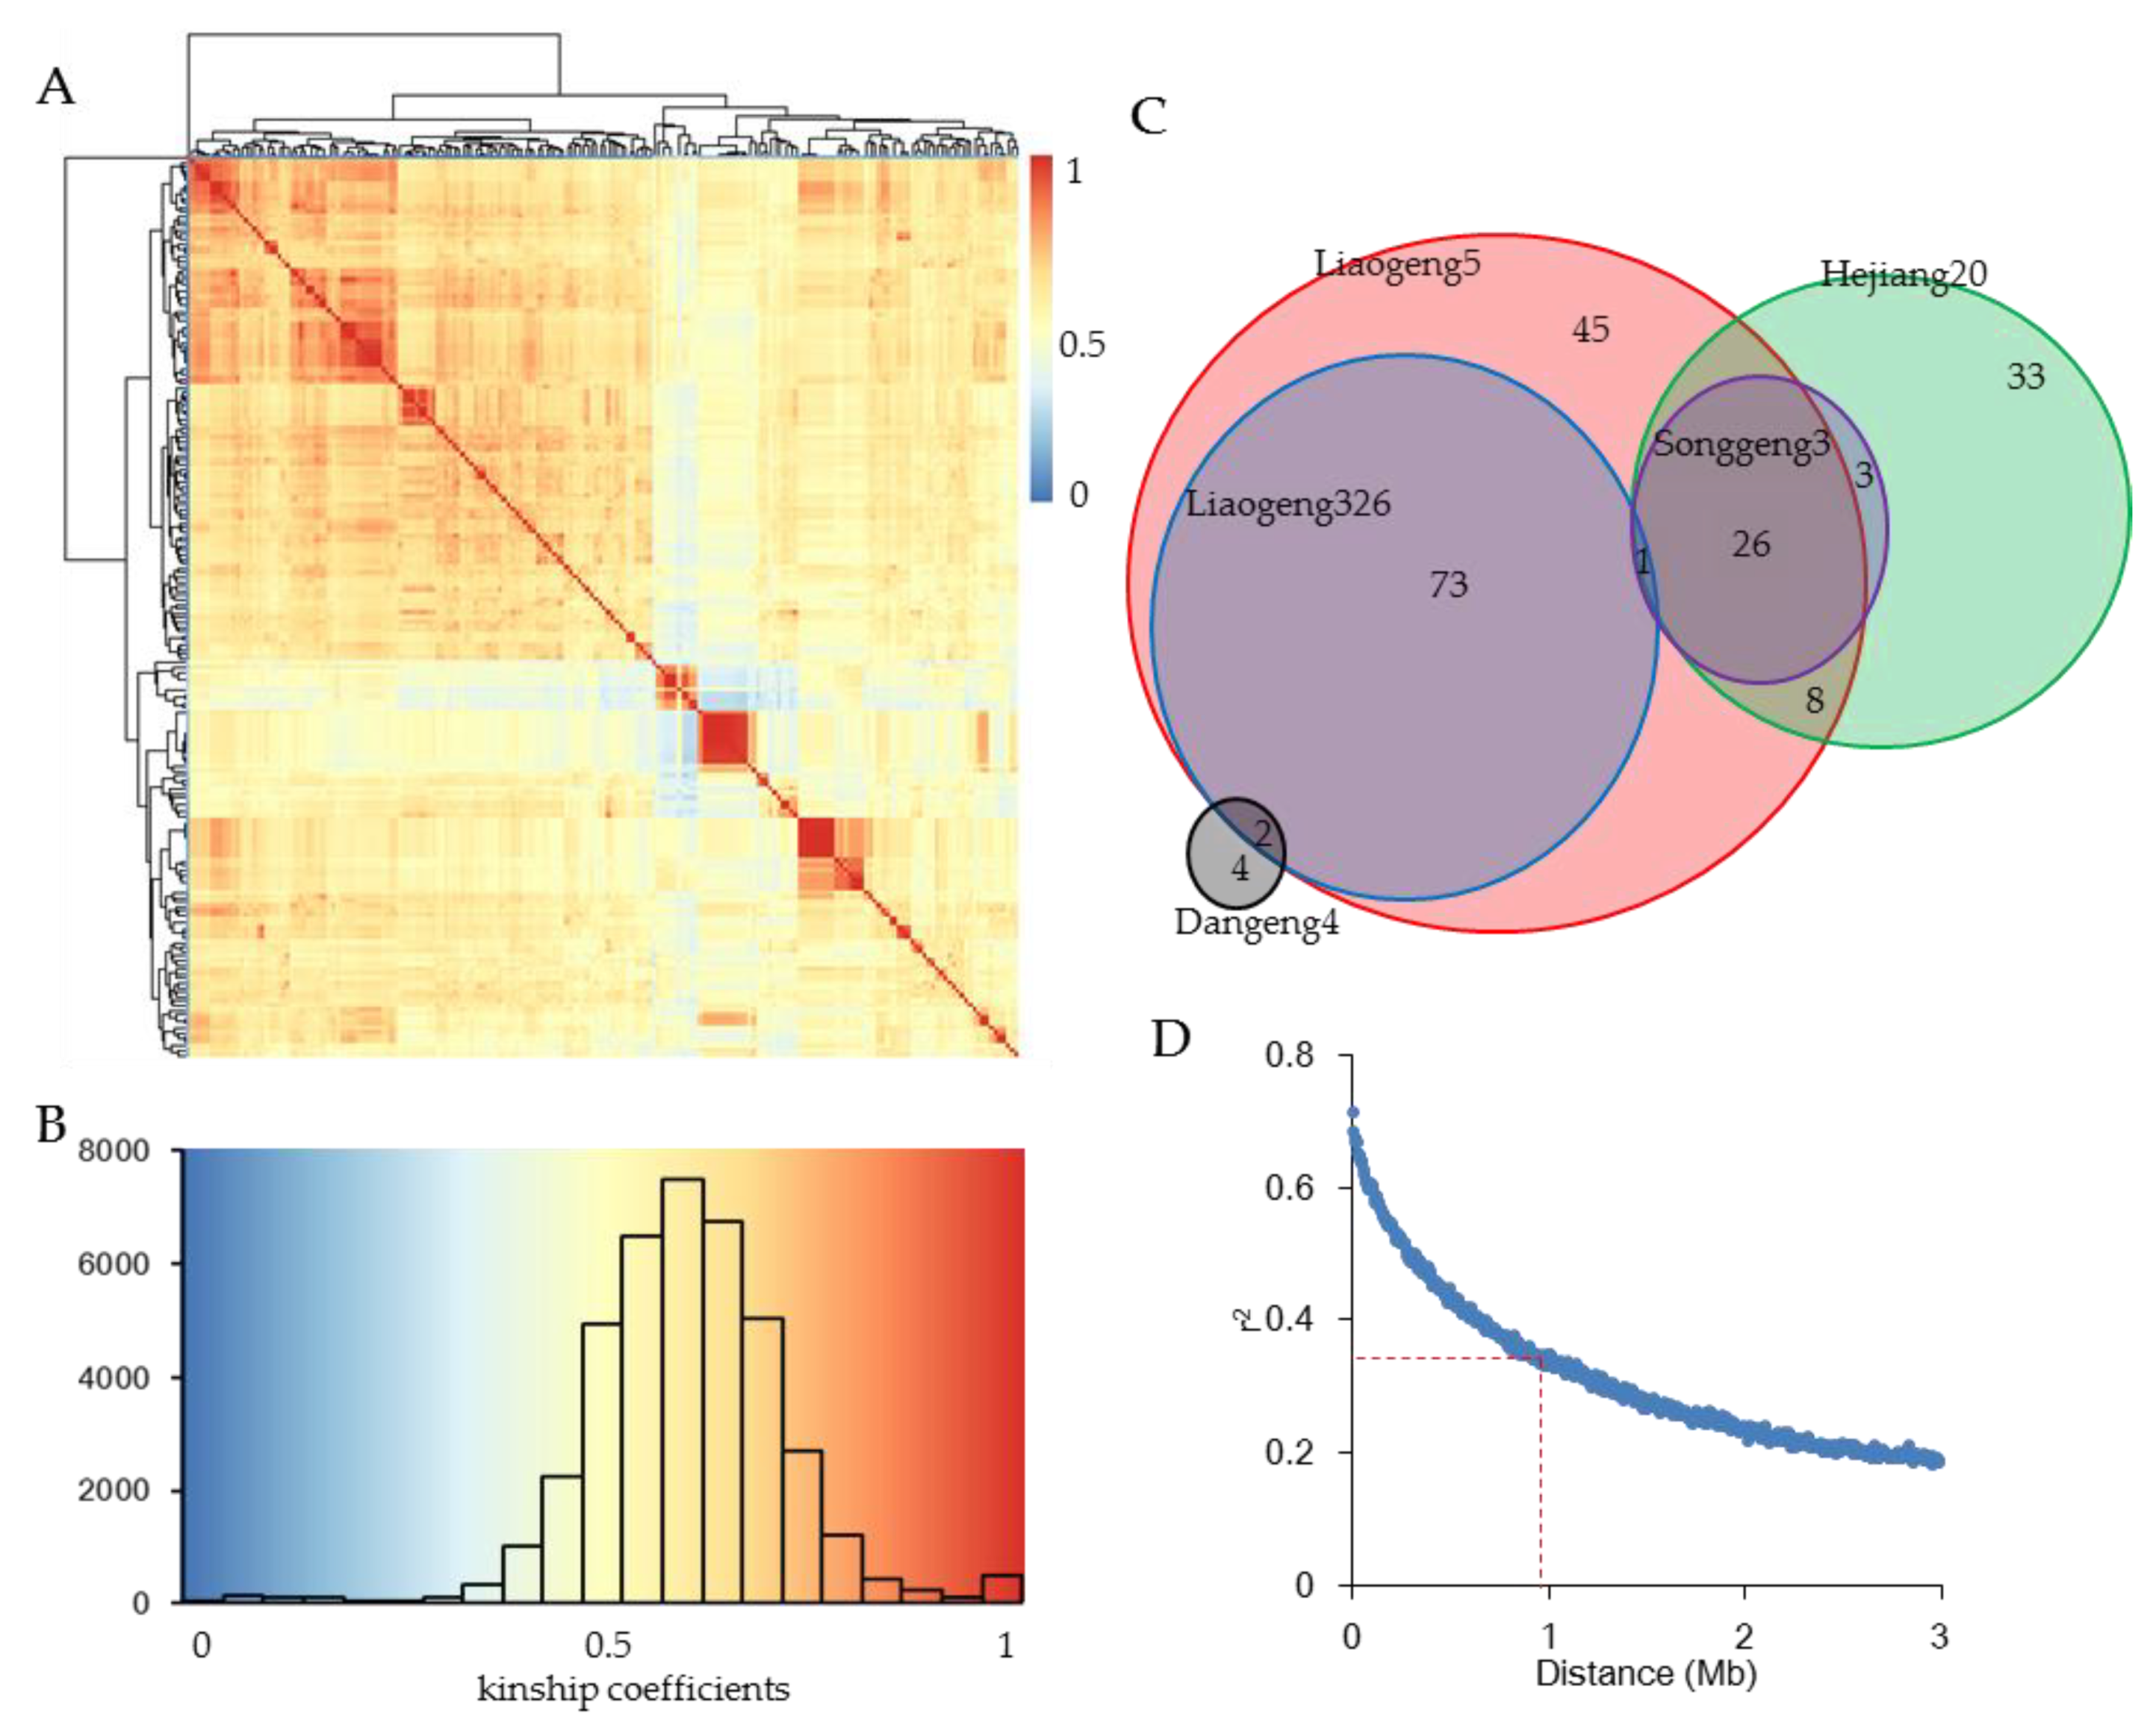
3.4. The Japonica Varieties in Northeast China Displayed Narrow Genetic Basis

On the basis of the genotype of the total 200 varieties, the pairwise relative kinship value was analyzed (Figure 4A). Only 0.6% of the values were less than 0.1, and 22.1% of the values ranged from 0.1 to 0.5. Moreover, 77.3% of the values were larger than 0.5 (Figure 4B). Together, these results suggest that there was high relatedness among the japonica varieties in Northeast China. Thus, we consequently investigated the genealogy of all varieties, and the original parent of these varieties focused on four varieties which included Liaogeng5, Liaogeng326, Songgeng3, and Hejiang20 (Figure 4C). Furthermore, Liaogeng5 was widely used as a parent for 79% of all the varieties, which was the possible reason for the high kinship between each of the two varieties. In addition, the linkage disequilibrium (LD), for all the japonica varieties, was then analyzed. The LD decay rate was measured as the chromosomal distance at which the average pairwise correlation coefficient dropped to half the value of the maximum r2 (Figure 4D). The result showed that the genome-wide LD decay rate was approximately estimated at 1 Mb where the r2 dropped to 0.34. The PCA analysis was also performed to study the population structure. We were not able to divide the population into some obvious subgroups with the different distributions along the two eigenvectors. PC1 and PC2 accounted for 10.3% and 10.0% of the genetic variation, respectively. The top ten PCs only represented 48.9% of the genetic variation (Supplementary Figure S1). In total, it indicated that the japonica varieties in Northeast China displayed a narrow genetic basis and resulted in long-range LD and high relatedness.

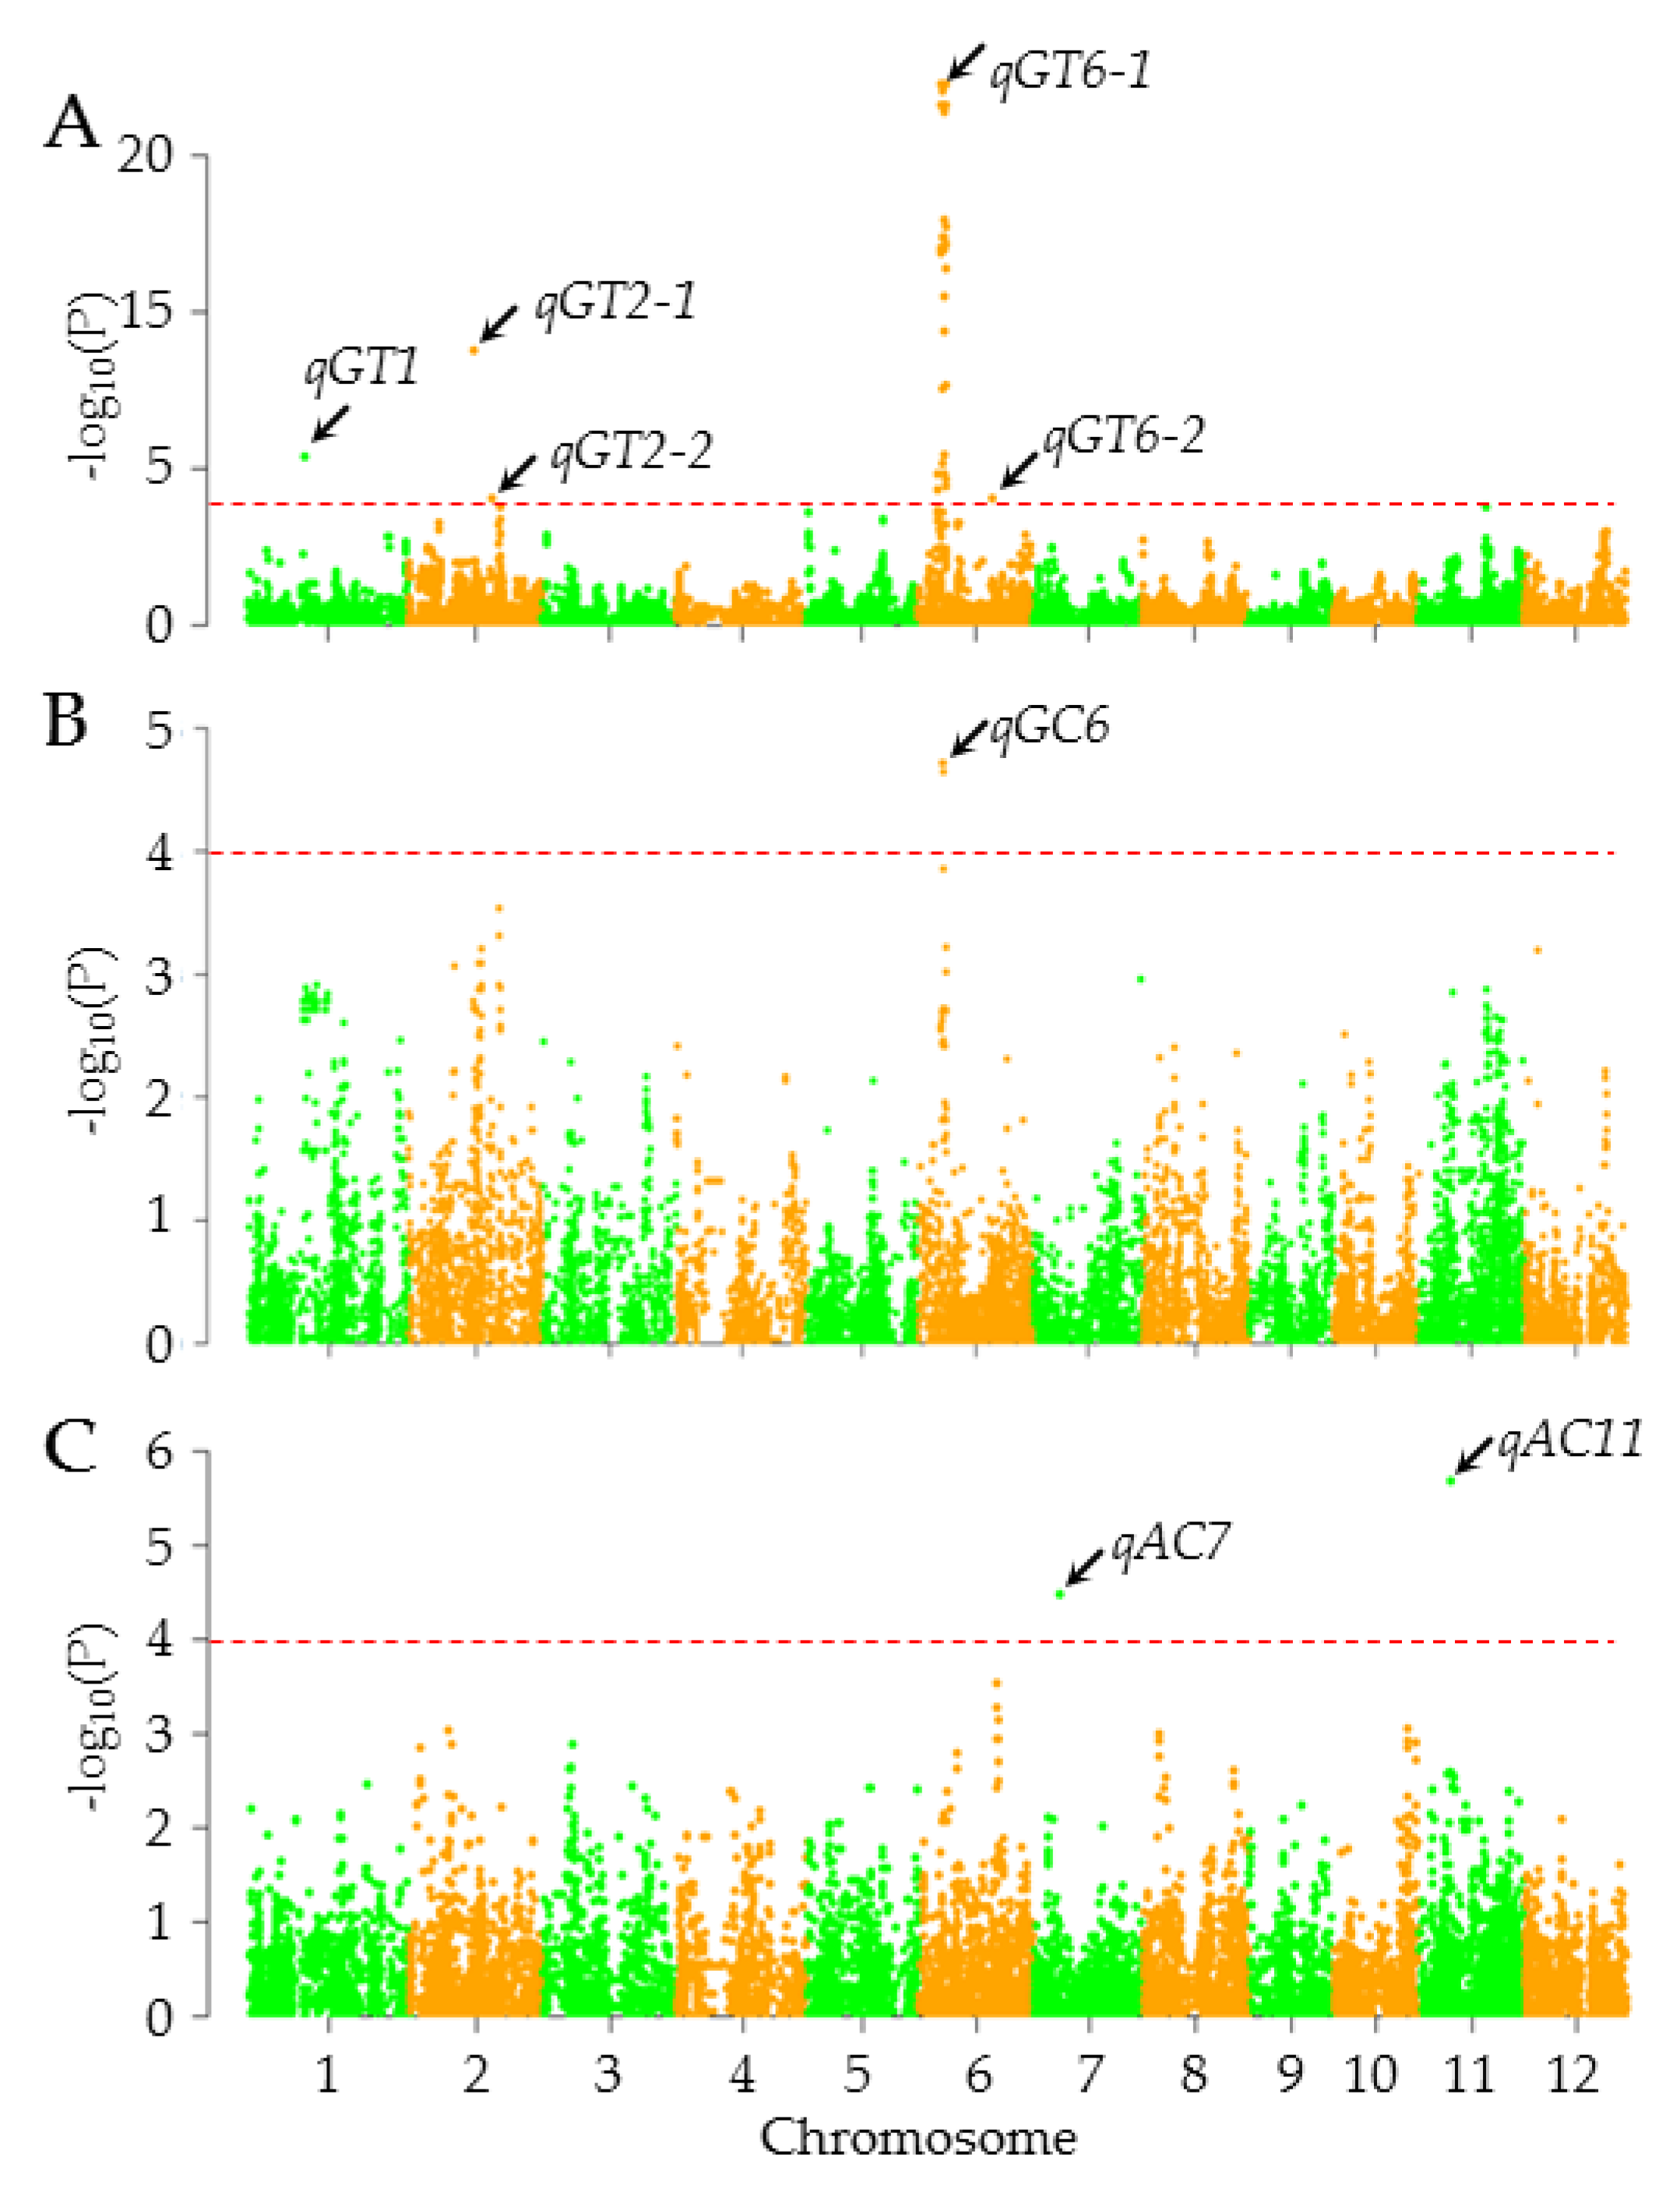
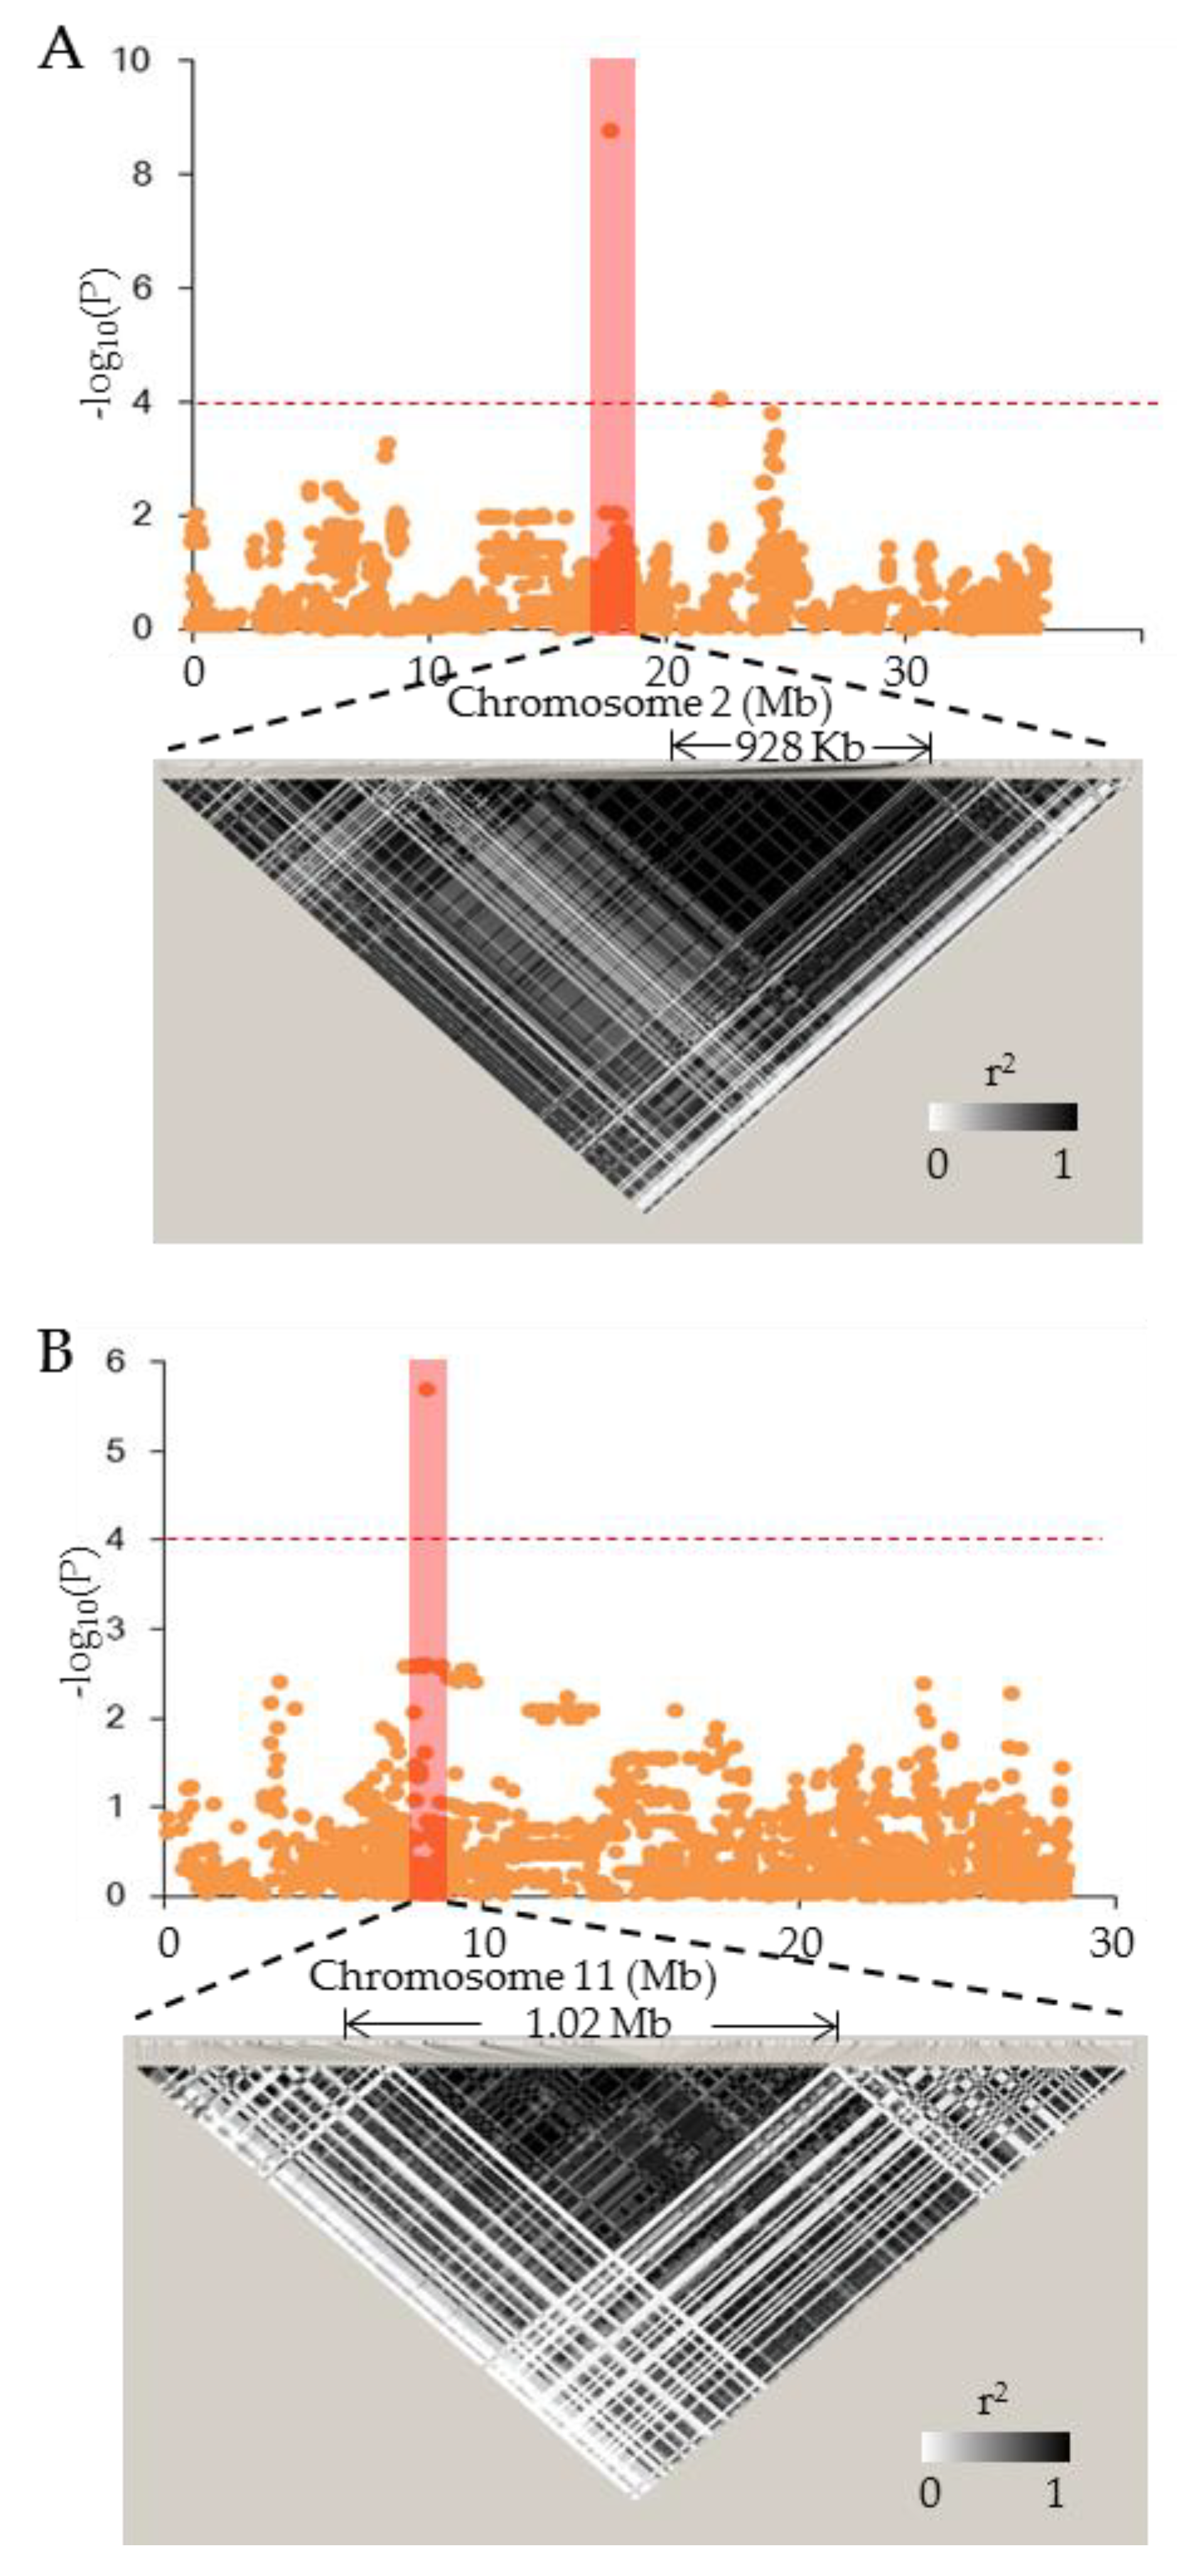
3.5. GWAS for AC, GC, and GT

Association mapping was performed under a mixed linear model with the kinship matrix and the top three PCs as covariates. In total, 130 significant SNPs containing only eight regions associated with the three traits were detected at the threshold of four across all 12 chromosomes (Figure 5 and Table 1). For GC, eight SNP loci were detected on chromosome 6. These eight loci were close to each other, therefore, only one region, named qGC6, was found near the position 6.7 Mb, in the associated analysis for GC, which accounted for 21% of the phenotypic variance (Figure 5B). Two significant SNPs for AC were found at the position of 8.30 Mb on chromosome 11 and 6.84 Mb on chromosome 7, respectively. The two SNP loci, namely qAC11 and qAC7, accounted for 7.38% and 12.9% of the phenotypic variance, respectively (Figure 5C). In addition, 120 significant SNPs were detected in the association mapping for GT. Most SNPs were clustered together and only five regions, namely qGT1, qGT2-1, qGT2-2, qGT6-1, and qGT6-2, were obtained. qGT1, located on chromosome 1 at the position of 15.2 Mb, accounted for 13.7% of the phenotypic variance with the –log10(P) value of 5.38. qGT2-1 and qGT2-2 were the two loci on chromosome 2, which explained 18.9% and 9.7% of the phenotypic variance with the –log10(P) value of 8.77 and 4.03, respectively. qGT6-2 was at the position of 20.1 Mb on chromosome 6 with the lower value in the associated mapping for GT, explaining 9% of the phenotypic variance. qGT6-1, which had a highest-peak SNP, located on chromosome 6 near the position 6.7 Mb, explained 29.7% of the phenotypic variance (Figure 5A). Interestingly, qGT6-1 was overlapped with the region of qGC6.
We compared the significant SNP loci detected in this study with the quantitative trait loci (QTLs)/genes reported previously (Table 1). Wx was the major QTL for AC, but in our study, it was not detected in the GWAS for AC. However, ALK, the major gene for gelatinization temperature, overlapped the region of qGC6/qGT6-1, which regulated both the GC and GT in rice grain. In the intervals of the other QTLs, there was no overlap as compared with the QTLs previously reported to be associated with rice ECQs.

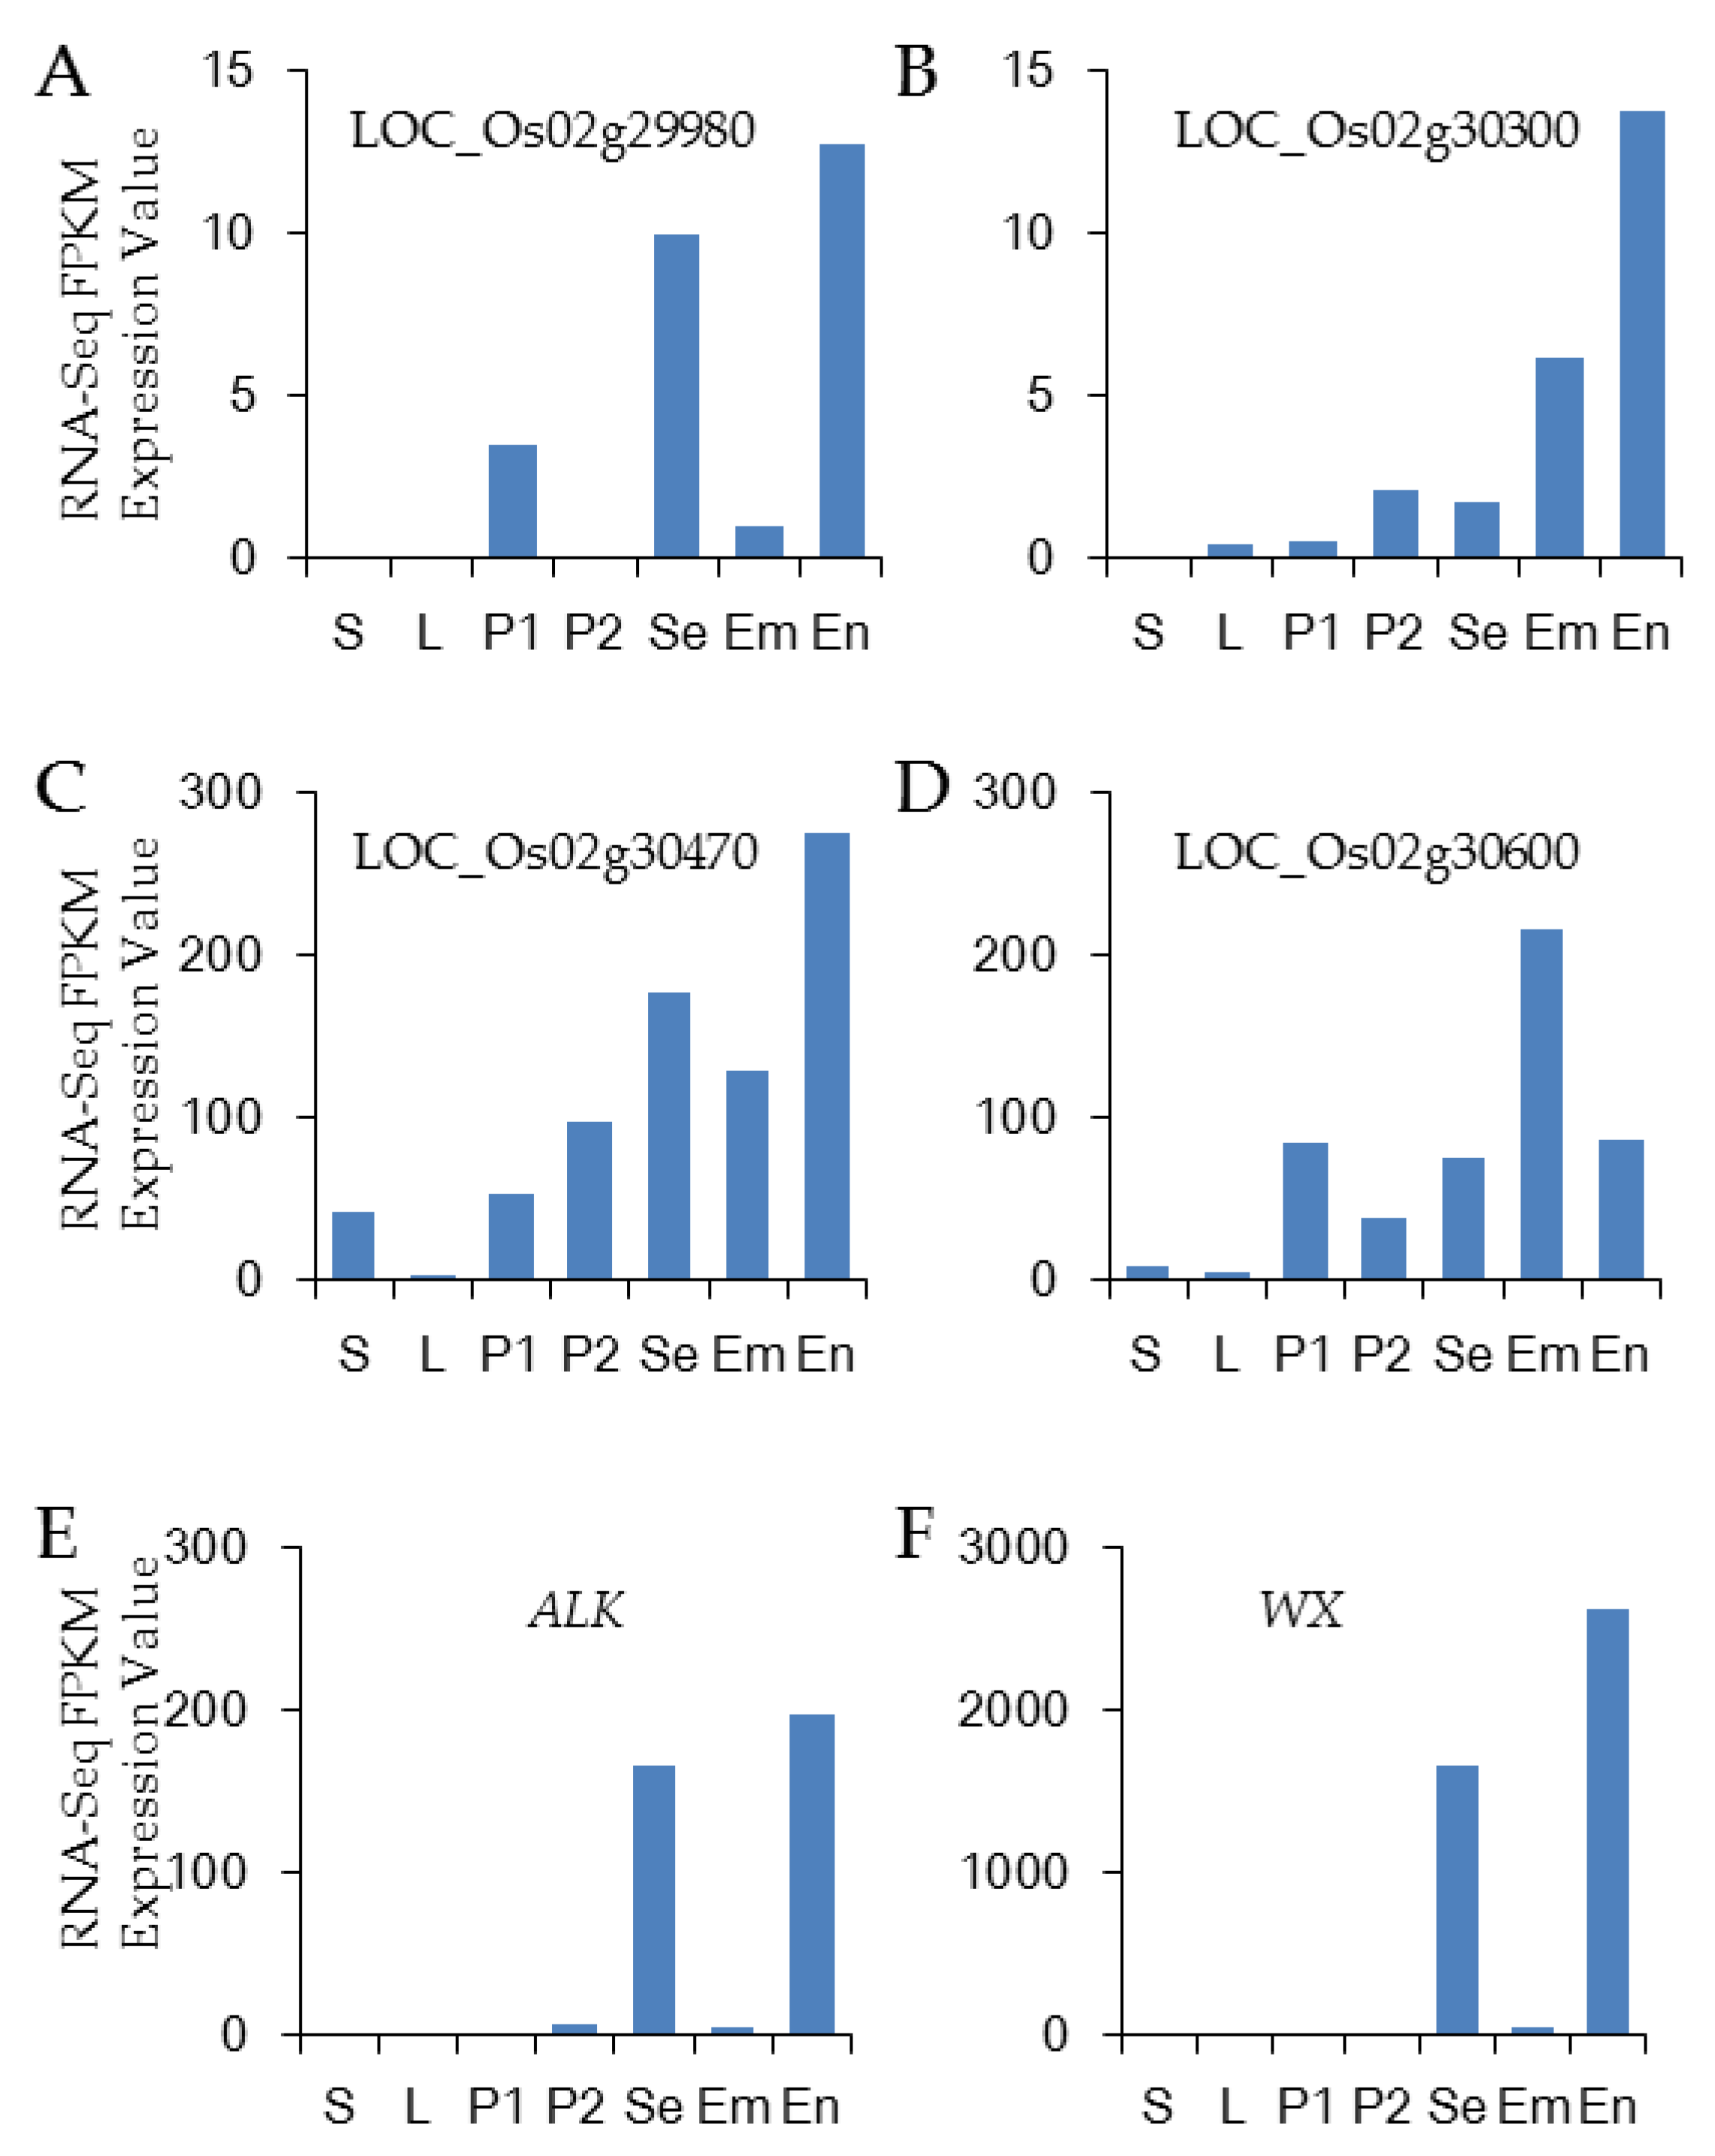
3.6. Candidate Gene Analysis

In our study, only eight QTLs were detected, and candidate gene analysis was performed on the two major important QTLs, qAC11 and qGT2-1 (Figure 6). For the region of qAC11, according to the LD decay analysis, a total 1.02 Mb region ranging from 7.78 to 8.80 Mb on chromosome 11 (Figure 6B) was identified as the candidate region which contained more than 150 genes. It seems that it is difficult to determine which genes are useful from the large number of genes in the candidate region. A similar result was found for qGT2-1 in the region of 17.51 to 18.44 Mb on chromosome 2, and an approximately 928 kb region was considered to be a candidate region using the LD decay analysis (Figure 6A).
Mostly, the genes regulate the ECQ in rice grain which is always highly expressed in rice endosperm, such as Wx and ALK (Figure 7E–F). We screened all of the genes located in the candidate regions using the RNA-seq data published by the Rice Genome Annotation Project and selected 33 genes that were expressed in rice endosperm (Supplementary Table S3). On the basis of the expression pattern analysis, four genes including LOC_Os02g29980, LOC_Os02g30300, LOC_Os02g30470, and LOC_Os02g30600 were relatively higher expressed in rice seed and endosperm and lower expressed in shoots and leaf (Figure 7A–D). However, there was no possible gene selected in the candidate region for qAC11. Except for LOC_Os02g30600, the other three genes harbored the highest expression in rice grain endosperm. Additionally, according to the gene function annotation, both LOC_Os02g30470, and LOC_Os02g30600 encode the expressed proteins with unknown function, LOC_Os02g29980 encodes an X8 domain containing protein, and LOC_Os02g30300 encodes a MYND finger family protein. Further analysis of sequences of the four genes using BLAST, revealed that the amino acid sequence of LOC_Os02g29980 was highly similar to the 1,3-beta-glucosidase, which could affect the starch synthesis, and LOC_Os02g30300 was homologous to F-box protein. Previous reports have demonstrated that the F-box protein was involved in various physiological and biochemical pathways including panicle and flower development, heading data, plant hormone, and abiotic stress [28]; however, none were directly related to the starch synthesis and rice quality. Additionally, the expression pattern of LOC_Os02g29980 was most similar to those of Wx and ALK. Therefore, it is possible that LOC_Os02g29980 can regulate GT in rice, but further research is required for validation.

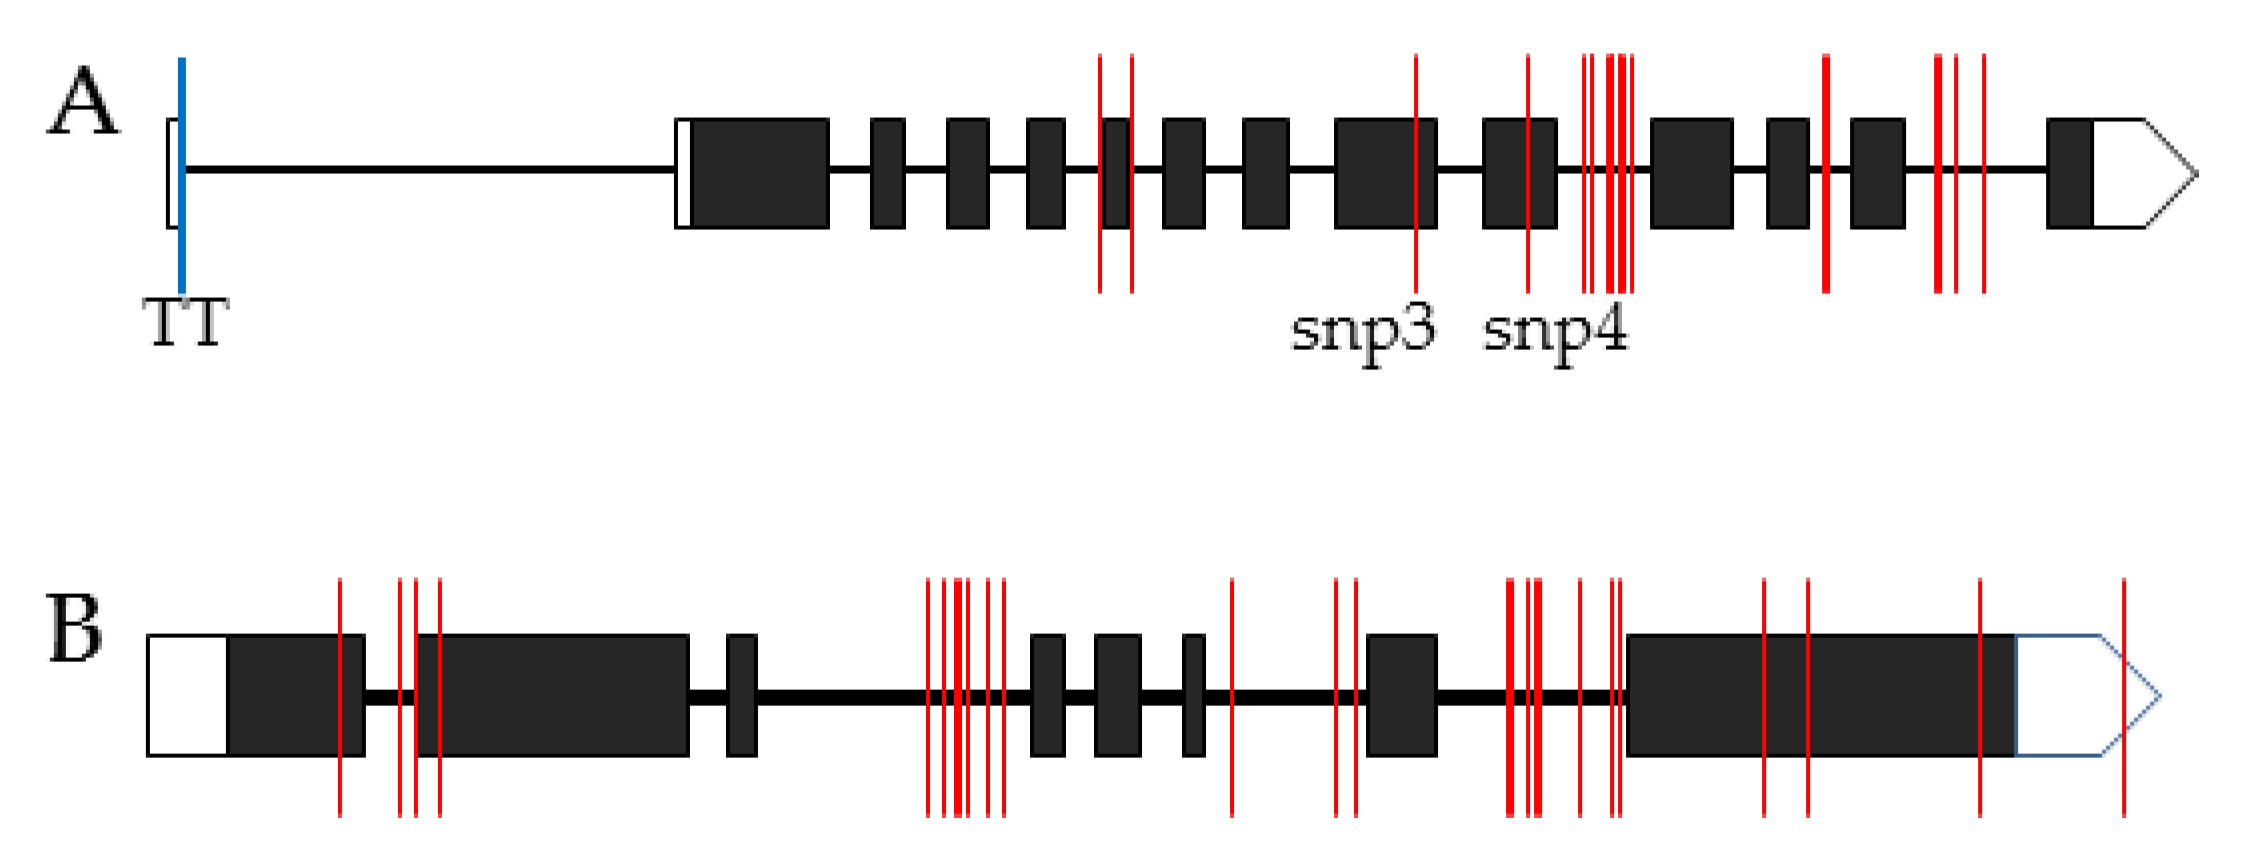
3.7. Analysis of ALK and Wx in the Japonica Varieties

According to our GWAS results, the major gene for AC, Wx, was not detected. It was abnormal and strange in the QTL analysis or GWAS for AC, on the basis of many previous reports. Twenty varieties with highest AC and lower AC were selected, respectively, and their Wx gene was sequenced using the primer in Supplementary Table S4. The results showed that all varieties, except CH4126, exhibited the same sequence in Wx gene. And the sequence analysis revealed that the Wx gene in all sequenced varieties, including CH4126, harbored the allele of Wxb [29]. Interestingly, the variety CH4126 had the largest AC value which reached up to 26.8%, whereas the values of AC in all other varieties were less than 20%. The sequencing analysis in CH4126 showed that it had 21 variations in the Wx as compared with other sequenced varieties (Figure 8A, Supplementary Table S5). Among these variations, only two variations (snp3 and snp4) were located on the exon. Snp4 was a nonsynonymous mutation at the position of 3377 bp that resulted in amino acid change from proline to serine, which could be the reason for the high AC in CH4126.
qGT6-1/qGC6 was the largest significant locus in our GWAS results, overlapping the previously reported gene, ALK, which was the major gene controlling the gelatinization temperature. Sequencing analysis demonstrated that there were many variations between varieties with high GT and low GT (Figure 8B, Supplementary Table S6). Five variations were located on the exon of ALK, and three of them could lead to the protein change. These variations in ALK were similar to a previous study. Together with the results of GWAS and the sequencing analysis of ALK, it suggested that the gelatinization temperature of japonica varieties in Northeast China was mainly controlled by ALK.

4. Discussion

The Northeast Plain is the largest plain in China, and the rice grown in this area accounts for a significant portion of the total rice production in China [30]. High-quality rice is conducive to the commercialization of rice. Hence, with increasing rice yield, excellent rice quality has been one of the aims of breeders in Northeast China. Moreover, breeding is the process of artificial selection, which leads to low genetic diversity in the varieties planted in one region. Generally, ECQs are invisible characters and not easily selected as compared with other visible traits. In our study, we statistically analyzed the AC, GC, and GT of the 200 varieties in Northeast China. The distribution of these traits showed that the values of each trait assembled in a narrow range without a large variation. Among these traits, GC relatively displayed the largest variation in the 200 japonica varieties. We suggest that GC is potentially difficult to select in Northern China which could be due to the deficiency of the major control gene. In addition, a modern breeding program always involves genetically improving the elite varieties used before. In total, 98% of the varieties used one or more of the four varieties including Liaogeng5, Liaogeng326, Songgeng3, and Hejiang20 as their original parents. Because of this, it is easy to explain the close kinship and long-range LD among these varieties. Therefore, the genetic basis of the varieties in Northeast China is narrow, which could be the reason for the production bottleneck in rice breeding. In order to resolve this bottleneck, we suggest introducing other excellent genetic germplasm and broadening the genetic basis of the japonica varieties in Northeast China.
A previous study showed that japonica had the Wxb allele, which is consistent with our results [29]. Wx was the only major effect gene in the rice germplasm controlling the AC in rice grain. It leads to the similar AC in most of the varieties. Similar to Wx, ALK is the only major effect gene regulating GT. In our study, about 11% of the varieties exhibited low GT, which means that ALK was not fixed in the japonica varieties in Northeast China. The process of indica-japonica differentiation could result in differentiation of Wx in japonica and indica, while ALK had no obvious difference between the two subspecies. Thus, ALK was subjected to human selection for rice breeding in Northeast China, due to the high GT in most japonica varieties there.
Fortunately, we found that the variety CH4126 had the highest AC of 26.8%. By sequencing Wx, we discovered that the functional locus of the Wxb allele still existed. In addition, many other variations, including a nonsynonymous mutation, were detected. Interestingly, the nonsynonymous mutation in CH4126 was the rare allele of Wx and it had been reported that the mutation was not significantly associate with AC [31]. However, in our study, the variation in Wx could be the main reason for the high AC in CH4126. Of course, the results need further research for validation. These results could provide a new genetic resource to dissect the genetic mechanism of Wx regulating the AC in rice grain.
The GWAS results detected eight QTLs of ECQs; only one QTL for GC that overlapped with qGT6-1 was detected, the functional gene in the region was ALK. Thus, ALK is an important gene regulating the GC in the japonica varieties in Northeast China. Correlation analysis showed that the highest correlation was detected between GC and GT, which verified the pleiotropism of ALK to some extent. The result was different from a previous report [8], which found that ALK had a minor effect on GC. In our study, ALK had a significant effect on GC, possibly due to the different genetic population. Except for ALK, other QTLs were new and did not overlap with the previously reported genes and QTLs. Due to the minor effects of these QTLs and long-range of LD, it was difficult to find the candidate gene. However, the genes regulating the ECQs are often highly expressed in endosperm, such as Wx and ALK, and the number of these genes is not very high. Therefore, screening the expression pattern of all genes in the candidate region is a good way for candidate gene determination.
GWAS is useful for genetic dissection of complex traits in rice and has been widely proven by many studies [19,32,33]. Furthermore, many novel genes have been identified using GWAS [34,35,36]. However, GWAS still has some deficiencies. Population structure is a very important factor that affects GWAS results and can produce false positive results. Its influence can be weakened by using the mixed linear model method in GWAS. In our study, 200 japonica varieties were collected from Northeast China. These collections exhibited a low-level population structure which was suitable for GWAS and reduced false positive results, but the close kinship among the population lead to long range LD, which made it difficult to determine the key genes.
The results in our study should be helpful not only for understanding the genetic basis of japonica varieties in Northeast China, but also for providing a theoretical basis of ECQs. This is a benefit to ECQ improvement for rice breeding in Northeast China.

5. Conclusions

In our study, 200 japonica varieties widely distributed in Northeast China were collected to evaluate the physicochemical indices of grain ECQs. We found that the japonica varieties displayed a narrow genetic basis in Northeast China. Through the association study, we found that ALK was the major locus that regulating GT, and also significantly affecting GC, which was consistent with the results in the correlation analysis. In addition, one possible candidate gene (LOC_Os02g29980) was finally predicted. Additionally, two major genes for rice ECQs (ALK and Wx) in the japonica population were also studied. These results further contribute to the understanding of the genetic basis of ECQs of japonica varieties in Northeast China and provide breeders, in the area, some assistance for improving ECQs of rice grain in rice breeding.

Supplementary Materials

The following are available online https://www.mdpi.com/2073-4395/10/3/423/s1, Table S1: Information for 200 japonica varieties from Northeast China, Table S2: The genotype of 200 japonica varieties in Northeast China, Table S3: Presentation of the candidate genes that expressed in rice endosperm, Table S4: Primers for sequencing in this study, Table S5: Gene diversity in Wx between CH4126 and other sequenced varieties, Table S6: Gene diversity in ALK between low and high GT varieties, Figure S1: Principal component analysis of 200 japonica varieties.

Author Contributions

Y.Y. and X.W. conceived and designed research; Y.Y. and X.X. conducted experiments; M.Z., Q.X., Y.F., and X.Y. performed the phenotypic identification; Y.Y., H.Y., and Y.W. analyzed the data; Y.Y. and X.X. wrote the manuscript; X.W. and M.Z. helped to revise the manuscript. All authors have read and agreed to the published version of the manuscript.

Funding

We sincerely thank all the participants. The present investigation is financially supported by the National Key Research and Development Program of China (2016YFD0100902-07), the National Natural Science Foundation of China (31600999), and the Chinese Academy of Agricultural Sciences (CAAS-ASTIP-201X-CNRRI).

Conflicts of Interest

Authors declare no conflict of interest.

References

  1. Delseny, M.; Salses, J.; Cooke, R.; Sallaud, C.; Regad, F.; Lagoda, P.; Guiderdoni, E.; Ventelon, M.; Brugidou, C.; Ghesquiere, A. Rice genomics: Present and future. Plant Physiol. Bioch. 2001, 39, 323–334. [Google Scholar] [CrossRef]
  2. Preiss, J. Biology and molecular biology of starch synthesis and its regulation. Plant Mol.Cell. biol. 1991, 7, 5880–5883. [Google Scholar]
  3. Bao, J.S.; Shen, S.Q.; Sun, M.; Corke, H. Analysis of genotypic diversity in the starch physicochemical properties of nonwaxy rice: Apparent amylose content, pasting viscosity and gel texture. Starch-Starke 2006, 58, 259–267. [Google Scholar] [CrossRef]
  4. Hu, P.S.; Zhao, H.J.; Duan, Z.Y.; Zhang, L.L.; Wu, D.X. Starch digestibility and the estimated glycemic score of different types of rice differing in amylose contents. J. Cereal Sci. 2004, 40, 231–237. [Google Scholar] [CrossRef]
  5. Tang, S.X.; Khush, G.S.; Juliano, B.O. Genetics of gel consistency in rice ( Oryza sativa L.). J. Genet. 1991, 70, 69–78. [Google Scholar] [CrossRef]
  6. Khush, G.S.; Paule, C.M.; De, L.; Cruz, N.M. Rice grain quality evaluation and improvement at IRRI. In the Workshop on Chemical Aspects of Rice Grain Quality; IRRI (ed. Brady NC), the Philippines: Laguna, Los Banos, 1979; pp. 20–31. [Google Scholar]
  7. Wang, Z.Y.; Zheng, F.Q.; Shen, G.Z.; Gao, J.P.; Snustad, D.P.; Li, M.G.; Zhang, J.L.; Hong, M.M. The Amylose Content In Rice Endosperm Is Related To the Posttranscriptional Regulation Of the Waxy Gene. Plant J. 1995, 7, 613–622. [Google Scholar] [CrossRef]
  8. Fan, C.C.; Yu, X.Q.; Xing, Y.Z.; Xu, C.G.; Luo, L.J.; Zhang, Q.F. The main effects, epistatic effects and environmental interactions of QTLs on the cooking and eating quality of rice in a doubled-Haploid line population. Theor. Appl. Genet. 2005, 110, 1445–1452. [Google Scholar] [CrossRef]
  9. Su, Y.; Rao, Y.C.; Hu, S.K.; Yang, Y.L.; Gao, Z.Y.; Zhang, G.H.; Liu, J.; Hu, J.; Yan, M.X.; Dong, G.J.; et al. Map-Based cloning proves qGC-6, a major QTL for gel consistency of japonica/indica cross, responds by Waxy in rice (Oryza sativa L.). Theor. Appl. Genet. 2011, 123, 859–867. [Google Scholar] [CrossRef]
  10. Tan, Y.F.; Li, J.X.; Yu, S.B.; Xing, Y.Z.; Xu, C.G.; Zhang, Q. The three important traits for cooking and eating quality of rice grains are controlled by a single locus in an elite rice hybrid, Shanyou 63. Theor. Appl. Genet. 1999, 99, 642–648. [Google Scholar] [CrossRef]
  11. Isshiki, M.; Morino, K.; Nakajima, M.; Okagaki, R.J.; Wessler, S.R.; Izawa, T.; Shimamoto, K. A naturally occurring functional allele of the rice waxy locus has a GT to TT mutation at the 5′ splice site of the first intron. Plant J. 1998, 15, 133–138. [Google Scholar] [CrossRef] [Green Version]
  12. Gao, Z.Y.; Zeng, D.L.; Cui, X.; Zhou, Y.H.; Yan, M.X.; Huang, D.N.; Li, J.Y.; Qian, Q. Map-Based cloning of the ALK gene, which controls the gelatinization temperature of rice. Sci. China Ser. C 2003, 46, 661–668. [Google Scholar] [CrossRef] [PubMed]
  13. Tian, Z.X.; Qian, Q.; Liu, Q.Q.; Yan, M.X.; Liu, X.F.; Yan, C.J.; Liu, G.F.; Gao, Z.Y.; Tang, S.Z.; Zeng, D.L.; et al. Allelic diversities in rice starch biosynthesis lead to a diverse array of rice eating and cooking qualities. Proc. Natl. Acad. Sci. USA 2009, 106, 21760–21765. [Google Scholar] [CrossRef] [PubMed] [Green Version]
  14. He, Y.; Han, Y.P.; Jiang, L.; Xu, C.W.; Lu, J.F.; Xu, M.L. Functional analysis of starch-synthesis genes in determining rice eating and cooking qualities. Mol. Breed. 2006, 18, 277–290. [Google Scholar] [CrossRef]
  15. Sun, S.Y.; Wei, H.; Lin, H.X. Identification of QTLs for Cooking and Eating Quality of Rice Grain. Rice Sci. 2006, 13, 161–169. [Google Scholar]
  16. Hsu, Y.C.; Tseng, M.C.; Wu, Y.P.; Lin, M.Y.; Wei, F.J.; Hwu, K.K.; Hsing, Y.I.; Lin, Y.R. Genetic factors responsible for eating and cooking qualities of rice grains in a recombinant inbred population of an inter-subspecific cross. Mol. Breed. 2014, 34, 655–673. [Google Scholar] [CrossRef] [PubMed] [Green Version]
  17. Guo, Y.M.; Mu, P.; Liu, J.F.; Lu, Y.X.; Li, Z.C. QTL mapping and QxE interactions of grain cooking and nutrient qualities in rice under upland and lowland environments. J. Genet. Genom. 2007, 34, 420–428. [Google Scholar] [CrossRef]
  18. Leng, Y.J.; Xue, D.W.; Yang, Y.L.; Hu, S.K.; Su, Y.; Huang, L.C.; Wang, L.; Zheng, T.T.; Zhang, G.H.; Hu, J.; et al. Mapping of QTLs for eating and cooking quality-Related traits in rice (Oryza sativa L.). Euphytica 2014, 197, 99–108. [Google Scholar] [CrossRef]
  19. Huang, X.H.; Wei, X.H.; Sang, T.; Zhao, Q.; Feng, Q.; Zhao, Y.; Li, C.Y.; Zhu, C.R.; Lu, T.T.; Zhang, Z.W.; et al. Genome-Wide association studies of 14 agronomic traits in rice landraces. Nat. Genet. 2010, 42, 961–967. [Google Scholar] [CrossRef]
  20. Wang, C.H.; Yang, Y.L.; Yuan, X.P.; Xu, Q.; Feng, Y.; Yu, H.Y.; Wang, Y.P.; Wei, X.H. Genome-Wide association study of blast resistance in indica rice. BMC Plant Biol. 2014, 14, 311. [Google Scholar] [CrossRef] [Green Version]
  21. Xu, F.F.; Bao, J.S.; He, Q.; Park, Y.J. Genome-Wide association study of eating and cooking qualities in different subpopulations of rice (Oryza sativa L.). BMC Genom. 2016, 17, 663. [Google Scholar] [CrossRef] [Green Version]
  22. Wang, X.Q.; Pang, Y.L.; Zhang, J.; Wu, Z.C.; Chen, K.; Ali, J.; Ye, G.Y.; Xu, J.L.; Li, Z.K. Genome-Wide and gene-Based association mapping for rice eating and cooking characteristics and protein content. Sci. Rep. 2017, 7, 17203. [Google Scholar] [CrossRef] [PubMed] [Green Version]
  23. Cheng, F.M.; Zhong, L.J. Variation of rice quality traits under different climate conditions and its main affected factors. Chin. J. Rice Sci. 2001, 15, 187–191. [Google Scholar]
  24. Ye, J.; Niu, X.J.; Yang, Y.L.; Wang, S.; Xu, Q.; Yuan, X.P.; Yu, H.Y.; Wang, Y.P.; Wang, S.; Feng, Y.; et al. Divergent Hd1, Ghd7, and DTH7 Alleles Control Heading Date and Yield Potential of Japonica Rice in Northeast China. Front. Plant Sci. 2018, 9, 35. [Google Scholar] [CrossRef] [PubMed]
  25. Bradbury, P.J.; Zhang, Z.; Kroon, D.E.; Casstevens, T.M.; Ramdoss, Y.; Buckler, E.S. TASSEL: Software for association mapping of complex traits in diverse samples. Bioinformatics 2007, 23, 2633–2635. [Google Scholar] [CrossRef] [PubMed]
  26. Patterson, N.; Price, A.L.; Reich, D. Population structure and eigenanalysis. PLoS Genet. 2006, 2, e190. [Google Scholar] [CrossRef] [PubMed]
  27. Barrett, J.C. Haploview: Visualization and analysis of SNP genotype data. Cold Spring Harb. Protoc. 2009, 2009. [Google Scholar] [CrossRef]
  28. Jain, M.; Nijhawan, A.; Arora, R.; Agarwal, P.; Ray, S.; Sharma, P.; Kapoor, S.; Tyagi, A.K.; Khurana, J.P. F-Box Proteins in Rice. Genome-Wide Analysis, Classification, Temporal and Spatial Gene Expression during Panicle and Seed Development, and Regulation by Light and Abiotic Stress. Plant Physiol. 2007, 143, 1467–1483. [Google Scholar] [CrossRef] [Green Version]
  29. Hirano, H.Y.; Eiguchi, M.; Sano, Y. A single base change altered the regulation of the Waxy gene at the posttranscriptional level during the domestication of rice. Mol. Biol. Evol. 1998, 15, 978–987. [Google Scholar] [CrossRef] [Green Version]
  30. Zhang, H.; Zhou, G.S.; Liu, D.L.; Wang, B.; Xiao, D.P.; He, L. Climate-Associated rice yield change in the Northeast China Plain: A simulation analysis based on CMIP5 multi-Model ensemble projection. Sci. Total Environ. 2019, 666, 126–138. [Google Scholar] [CrossRef]
  31. Biselli, C.; Cavalluzzo, D.; Perrini, R.; Gianinetti, A.; Bagnaresi, P.; Urso, S.; Orasen, G.; Desiderio, F.; Lupotto, E.; Cattivelli, L.; et al. Improvement of marker-Based predictability of Apparent Amylose Content in japonica rice through GBSSI allele mining. Rice 2014, 7, 1. [Google Scholar] [CrossRef] [Green Version]
  32. Huang, X.H.; Yang, S.H.; Gong, J.Y.; Zhao, Q.; Feng, Q.; Zhan, Q.L.; Zhao, Y.; Li, W.J.; Cheng, B.Y.; Xia, J.H.; et al. Genomic architecture of heterosis for yield traits in rice. Nature 2016, 537, 629–633. [Google Scholar] [CrossRef] [PubMed]
  33. Lu, Q.; Zhang, M.C.; Niu, X.J.; Wang, S.; Xu, Q.; Feng, Y.; Wang, C.H.; Deng, H.Z.; Yuan, X.P.; Yu, H.Y.; et al. Genetic variation and association mapping for 12 agronomic traits in indica rice. BMC Genom. 2015, 16, 1067. [Google Scholar] [CrossRef] [PubMed] [Green Version]
  34. Duan, P.G.; Xu, J.S.; Zeng, D.L.; Zhang, B.L.; Geng, M.F.; Zhang, G.Z.; Huang, K.; Huang, L.J.; Xu, R.; Ge, S.; et al. Natural Variation in the Promoter of GSE5 Contributes to Grain Size Diversity in Rice. Mol. Plant 2017, 10, 685–694. [Google Scholar] [CrossRef] [PubMed] [Green Version]
  35. Si, L.Z.; Chen, J.Y.; Huang, X.H.; Gong, H.; Luo, J.H.; Hou, Q.Q.; Zhou, T.Y.; Lu, T.T.; Zhu, J.J.; Shangguan, Y.Y.; et al. OsSPL13 controls grain size in cultivated rice. Nat. Genet. 2016, 48, 447–456. [Google Scholar] [CrossRef] [PubMed]
  36. Yano, K.; Yamamoto, E.; Aya, K.; Takeuchi, H.; Lo, P.C.; Hu, L.; Yamasaki, M.; Yoshida, S.; Kitano, H.; Hirano, K.; et al. Genome-Wide association study using whole-Genome sequencing rapidly identifies new genes influencing agronomic traits in rice. Nat. Genet. 2016, 48, 927–934. [Google Scholar] [CrossRef] [PubMed]
Figure 1. Distribution of eating and cooking qualities (ECQs) in japonica varieties of Northeast China. (A) Gelatinization temperature (GT); (B) Gel consistency (GC); (C) Amylose content (AC).
Agronomy 10 00423 g001
Figure 2. Geographical distributions of rice varieties. (A) Number of varieties in the three provinces; (B) Boxplot of GT in different province; (C) Boxplot of GC in different province; (D) Boxplot of AC in different province.
Agronomy 10 00423 g002
Figure 3. Correlation analysis of AC, GC, and GT. The color and areas of the circle represent the value of the correlation coefficient. Red and blue indicate negative and positive correlations, respectively. ** Represents significant difference at 1% level.
Agronomy 10 00423 g003
Figure 4. Genetic basis analyses of japonica varieties in Northeast China. (A) Pairwise relative kinship analysis of japonica varieties; (B) The distribution of kinship coefficients; (C) Common original parent analysis; (D) Genome-wide average linkage disequilibrium (LD) decay estimated from the japonica varieties.
Agronomy 10 00423 g004
Figure 5. Genome-wide association studies of ECQs. (A) GT; (B) GC; (C) AC the arrow represents the position of the peak single nucleotide polymorphism (SNP). The red dotted line represents the threshold of –log10(P) value; green and orange represents the different chromosome.
Agronomy 10 00423 g005
Figure 6. Candidate region estimation of major QTL for GT and AC. (A) Candidate region estimation of qGT2-1 on chromosome 2 and (B) Candidate region estimation of qAC11 on chromosome 11.
Agronomy 10 00423 g006
Figure 7. Expression patterns of the candidate genes. (A) LOC_Os02g29980; (B) LOC_Os02g30300; (C) LOC_Os02g30470; (D) LOC_Os02g30600; (E) ALK; and (F) Wx. S, shoots; L, leaves; P1, pre-emergence inflorescence; P2, post-emergence inflorescence; Se, seed; Em, embryo; En, endosperm.
Agronomy 10 00423 g007
Figure 8. Sequence analysis of Wx and ALK. (A) Wx; (B) ALK. Solid box and empty box indicate the exon and untranslated region, respectively, the red lines indicate the differences, the blue line indicates the functional locus of Wxb.
Agronomy 10 00423 g008
Table 1. Summary of the significant SNPs detected by GWAS and the overlapped QTLs reported previously.
TraitsNamePeak SNPsChrPositionP-Value−log10PR2Reported gene/QTL
GTqGT1seq1_152613691152613694.13E-065.380.14
qGT2-1seq2_176713862176713861.68E-098.78−0.19
qGT2-2seq2_223141592223141599.33E-054.030.10
qGT6-1seq6_6726252667262525.25E-1817.280.30ALK
qGT6-2seq6_201517866201517868.94E-054.050.09
GCqGC6seq6_6720486667204861.90E-054.72−0.21ALK
ACqAC7seq7_6847358768473583.36E-054.47−0.20
qAC11seq11_83006771183006772.04E-065.690.07

