
Abstract
Recombination shapes the evolutionary trajectory of populations and plays an important role in the faithful transmission of chromosomes during meiosis. Levels of sexual reproduction and recombination are important properties of host–pathogen interactions because the speed of antagonistic co-evolution depends on the ability of hosts and pathogens to generate genetic variation. However, our understanding of the importance of recombination is limited because large taxonomic groups remain poorly investigated. Here, we analyze recombination rate variation in the basidiomycete fungus Armillaria ostoyae, which is an aggressive pathogen on a broad range of conifers and other trees. We analyzed a previously constructed, dense genetic map based on 198 single basidiospore progeny from a cross. Progeny were genotyped at a genome-wide set of single-nucleotide polymorphism (SNP) markers using double digest restriction site associated DNA sequencing. Based on a linkage map of on 11,700 SNPs spanning 1007.5 cM, we assembled genomic scaffolds into 11 putative chromosomes of a total genome size of 56.6 Mb. We identified 1984 crossover events among all progeny and found that recombination rates were highly variable along chromosomes. Recombination hotspots tended to be in regions close to the telomeres and were more gene-poor than the genomic background. Genes in proximity to recombination hotspots were encoding on average shorter proteins and were enriched for pectin degrading enzymes. Our analyses enable more powerful population and genome-scale studies of a major tree pathogen.
Introduction
Recombination shapes the evolution of chromosomes and the evolutionary trajectory of populations (Haenel et al. 2018; Otto and Lenormand 2002). Crossovers enable the pairing and proper disjunction of homologous chromosomes during meiosis and are essential for the long-term maintenance of chromosomal integrity (Fledel-Alon et al. 2009; Hassold and Hunt 2001). Loss of recombination on chromosomes is often associated with degenerative sequence evolution including accumulation of mutations, gene loss, deleterious rearrangements, and aneuploidy (Alves et al. 2017; Charlesworth and Charlesworth 2000; Muller 1964). For example, the consequences of recombination cessation largely shaped the evolution of sex chromosomes and mating-type regions in animal, plants, and fungi (Charlesworth and Charlesworth 2000; Wilson and Makova 2009). Recombination also has a fundamental impact on the organization of genetic variation within populations. Recombination breaks up linkage between alleles at different loci, thereby generating novel combinations across loci that can be exposed to selection. Decreased linkage between loci increases the efficacy of selection and, hence, promotes adaptation (Hill and Robertson 2009; Otto and Barton 1997; Otto and Lenormand 2002). However, recombination can also break up linkage between co-adapted alleles across loci, thereby creating a potential evolutionary conflict (Barton and Charlesworth 1998; Charlesworth and Barton 1996).
The study of the role of sex and levels of recombination is particularly important for our understanding of coevolutionary arms races in host–pathogen interactions. Host populations are thought to be under strong selection to maintain sexual reproduction to escape co-evolving pathogens by generating novel genotypes (Hamilton 1980; Lively 2010; Morran et al. 2011). Similarly, pathogens are under strong selection pressure to adapt to resistant hosts. In addition to mutation rates, the level of recombination is likely under selection in pathogen populations (Croll et al. 2015; Möller and Stukenbrock 2017; Sánchez-Vallet et al. 2018). Notable cases of pathogen emergence driven by recombination include epidemic influenza viruses (Nelson and Holmes 2007), typhoid fever caused by Salmonella enterica (Didelot et al. 2007; Holt et al. 2008), and toxoplasmosis caused by outcrossing Toxoplasma gondii strains (Wendte et al. 2010). Sexual reproduction is also prevalent in many fungal plant pathogens playing an important role in adaptive evolution (Möller and Stukenbrock 2017). In particular in crop pathogens, the level of recombination was proposed as a predictor for the speed at which the pathogen will overcome host resistance (McDonald and Linde 2002; Stukenbrock and McDonald 2008). In plants, recombination at resistance loci may generate adaptive genetic variation for the defense against pathogens (e.g., Choi et al. 2016) While pathogens of crops received significant attention to elucidate the organization of genetic variation and the impact of recombination on genome evolution (Croll et al. 2015; Stukenbrock and Dutheil 2018), the role of recombination in the evolution of tree pathogens or saprophytes is still largely unknown.
An important group of fungal tree pathogens and saprophytes is represented by the basidiomycete genus Armillaria. The numerous fungi of this genus play an important role in the dynamics of forest ecosystems worldwide (Heinzelmann et al. 2019; Shaw III and Kile 1991). With their ability to degrade all structural components of dead wood causing a white-rot, Armillaria species contribute significantly to nutrient cycling in forest ecosystems (Hood et al. 1991). Moreover, Armillaria species act as facultative pathogens infecting the root systems of healthy or weakened trees, and eventually cause tree mortality (Guillaumin et al. 2005). In timber plantations, the presence of Armillaria root disease causes substantial economic losses (Laflamme and Guillaumin 2005), whereas in natural forest ecosystems the disease impacts forest succession, structure, and composition (Bendel et al. 2006b; Hood et al. 1991; McLaughlin 2001). In the Northern Hemisphere, Armillaria ostoyae is of special importance. It is widely distributed in North America and Eurasia and recognized as an aggressive pathogen on a broad range of conifers and other trees (Anderson and Ullrich 1979; Guillaumin et al. 1993; Morrison et al. 1985; Ota et al. 1998; Qin et al. 2007). A. ostoyae challenges current containment strategies and the search for new control strategies is ongoing (Heinzelmann et al. 2019). During the predominant vegetative stage, A. ostoyae is diploid and spreads either via rhizomorphs (root-like mycelial structures) through soil or through mycelial transfer from infected tissue to healthy roots (Rishbeth 1985). By the means of vegetative spread, A. ostoyae individuals can reach a considerable size and age (Bendel et al. 2006a; Ferguson et al. 2003). Sexual basidiospores are only released during a short time period in fall. Under favorable conditions compatible haploid mycelia may mate and form new diploid individuals (Legrand et al. 1996). Like most other Armillaria species, A. ostoyae has a heterothallic tetrapolar (bifactorial) mating system, which favors outcrossing (Baumgartner et al. 2011). At the landscape scale, A. ostoyae populations are showing little genetic differentiation indicating frequent gene flow (Prospero et al. 2008).
Armillaria spp. have relatively large and recently expanded genomes (Aylward et al. 2017; Sipos et al. 2017). Recently, the genomes of a European and a North American A. ostoyae strain were published (Sipos et al. 2017). The genome assembly of the European strain (SBI C18/9) is of 60.1 Mb and split into 106 scaffolds. The genome assembly for the North American strain (28-4) is similar in length (58.0 Mb) but considerably more fragmented. However, none of the to date published Armillaria genomes is yet assembled to chromosome-scale sequences (Collins et al. 2013; Sipos et al. 2017; Wingfield et al. 2016). Expanded gene families in Armillaria include pathogenicity-related genes, enzymes involved in lignocellulose degradation, and Armillaria-specific genes with mostly unknown functions (Sipos et al. 2017). Interestingly, in comparison with other white-rot fungi, Armillaria shows an underrepresentation of ligninolytic gene families and an overrepresentation of pectinolytic gene families (Sipos et al. 2017). A. ostoyae is outcrossing and progeny populations were successfully used to construct a dense genetic map and identify the genetic basis of a major colony morphology mutant phenotype (Heinzelmann et al. 2017). However, further insights into genome evolution of Armillaria and the genetic basis of phenotypic traits are hampered by a lack of knowledge of the detailed recombination landscape and a fully finished reference genome.
In this study, we first aimed to establish a chromosome-scale assembly for A. ostoyae using a dense recombination map. Second, we aimed to test for variation in recombination rates within and among chromosomes to identify putative recombination hotspots. Finally, we analyzed genomic correlates of recombination rate variation including GC content, gene density, and content of transposable elements.
Material and methods
Mapping population, construction of genetic map, and comparison with reference genome
The mapping population used in this study was described in Heinzelmann et al. (2017). In brief, the mapping population consisted of 198 single basidiospore progeny of the diploid A. ostoyae strain C15 (WSL Phytopathology culture collection number: M4408). This strain was collected in its diploid stage from a Scots pine (Pinus sylvestris) situated in a forest stand in the Swiss Plateau (Prospero et al. 2004). The haploid progeny were obtained from a single basidiocarp obtained in vitro as described previously (Heinzelmann et al. 2017). As detailed in Heinzelmann et al. (2017), the haploid progeny and the diploid parent were genotyped at a genome-wide set of single-nucleotide polymorphism (SNP) markers making use of double digest restriction site associated DNA sequencing. The raw SNPs were thoroughly filtered (Heinzelmann et al. 2017). We genotyped the diploid parent in triplicate and maintained variants only if these were found to be heterozygous in all three replicates of the parental strain but not in the haploid progeny. No haplotype phasing was performed prior to genetic map estimation.
As outlined in Heinzelmann et al. (2017) a de novo genetic map was constructed using R/ASMap version 0.4-4 (Taylor and Butler 2017), which is based on the MSTmap algorithm of Wu et al. (2008). The significance threshold of the algorithm was set to P = 10−5 and the Kosambi distance function was used to calculate genetic distances in centimorgan (cM). The final genetic map included 11,700 high-quality SNPs segregating in the mapping population (Heinzelmann et al. 2017). The genetic map was compared with the genome assembly available for the haploid A. ostoyae strain SBI C18/9 (assembly version 2, May 2016, Sipos et al. 2017). Strain SBI C18/9 (WSL Phytopathology culture collection number: M9390) originates from Switzerland but is unrelated to strain C15. As described in Sipos et al. (2017), the genome of A. ostoyae strain C18/9 was sequenced using PacBio and Illumina sequencing technologies. The PacBio reads were assembled into scaffolds and polished using Illumina reads (Sipos et al. 2017).
Construction of chromosome-scale sequences
The scaffolds of the reference genome were assembled into near chromosome-scale sequences, hereafter termed pseudochromosomes, based on the order of scaffolds within linkage groups. Scaffolds, which were split by the genetic map into fragments mapping to different linkage groups or well separated regions of a linkage group, were broken up into fragments. Sequences were split immediately next to the markers at the origin of the split. Sequences between the markers flanking the split were removed. Scaffolds (or fragments thereof) that were joined into pseudochromosomes were separated by gaps of 10 kb (chosen arbitrarily). Scaffolds and scaffold fragments, which were not oriented by the genetic map, were orientated randomly. The completeness of both the original genome assembly and the pseudochromosomes and the corresponding gene annotations were compared with BUSCO version 3.1.0 (Simão et al. 2015) using the Basidiomycota dataset (library basidiomycota_odb9).
Count and distribution of crossover events
The number of crossover events per progeny and pseudochromosome was extracted from the genetic map using the countXO function of the R/qtl package, version 1.40-8 (Broman et al. 2003). We used locateXO (R/qtl) to approximate the positions of crossover events by extracting the chromosomal positions of the flanking markers. The accuracy of crossover localization was assessed by the physical distance between the flanking markers. To check for the presence of potential noncrossover (=nonreciprocal recombination events), the distance of two consecutive crossover events on a pseudochromosome was calculated. We assessed the minimal distance of crossover events as the physical distance between the first marker following a crossover and the last marker before the next crossover.
Recombination rate variation along pseudochromosomes
For each pseudochromosome, the recombination rate was estimated in nonoverlapping 20 kb segments as follows. First, genetic positions were linearly interpolated every 20 kb based on genetic and physical positions of markers using the approx function of the of the R package “stats,” version 3.4.0 (R Development Core Team 2017). Next, the genetic distance per segment was calculated as the difference in genetic distance of the end and start point of the segment. Finally, the recombination rate per segment was obtained by dividing the interpolated genetic distance by the segment size. A segment size of 20 kb was considered appropriate because the physical distance between consecutive markers (excluding marker pairs with a distance of ≤400 bp to avoid spurious marker resolution through markers associated with the same restriction site) was less than 10 kb for ~50% of marker pairs, and less than 20 kb for ~75% of the marker pairs (Fig. 1). We tested for heterogeneity of recombination rate along the pseudochromosomes by comparing the observed distribution of recombination rate per segment with a Poisson distribution using Fisher’s exact test. For this, the 20 kb segments were binned into categories with a genetic distance of 0–15 cM. A Poisson distribution with lambda equaling the average genetic distance per segment was used as the expected distribution. P values for the observed distribution were estimated by Monte Carlo simulations with 106 replicates. This test was conducted for each pseudochromosome independently and all pseudochromosomes together.

a Physical distance between consecutive markers (marker pairs associated with the same restriction site excluded, see “Materials and methods”) on pseudochromosomes LG 1 to LG 11. b Physical distance of consecutive crossover events. The shortest distance recorded is 0.17 Mb. Because a major part of the left chromosome arm of pseudochromosome LG 11 may be missing, this pseudochromosome was excluded from this analysis. c Physical distance of the two markers flanking a crossover. All pseudochromosomes were included.
Identification and characterization of recombination hotspots
We identified recombination hotspots in the genome by searching for 20 kb segments with unusually high recombination rates. We defined the strongest recombination hotspot as having ≥200 cM/Mb to focus on the most important regions only. To account for the uncertainty in the identification of exact crossover locations, 20 kb segments with recombination rates ≥200 cM/Mb were conservatively extended by 15 kb on each side to define 50 kb recombination hotspot windows. In cases where two adjacent 20 kb segments had recombination rates ≥200 cM/Mb, one 50 kb hotspot centered on the two segments was created. Hotspots overlapping with assembly gaps were excluded. We assessed the correlation of GC content, as well as gene and transposable element density with recombination hotspots. For this, the pseudochromosomes were divided into nonoverlapping 50 kb segments. Segments were analyzed for GC content and percentage of gene and transposable element coverage. Transposable elements were identified and annotated with RepeatModeler version 1.0.8 (A. F. A. Smit and R. Hubley, RepeatModeler Open-1.0 2008–2015; http://www.repeatmasker.org) and RepeatMasker version 4.0.5 (A. F. A. Smit, R. Hubley, and P. Green, RepeatMasker Open-4.0 2013–2015; http://www.repeatmasker.org).
In addition, we assessed the correlation of recombination hotspots with certain gene properties and functions. Genes were functionally annotated using InterProScan version 5.19-58.0 (Jones et al. 2014). Protein families (PFAM) domain and gene ontology terms were assigned using hidden Markov models (HMM). Secretion signals, transmembrane, cytoplasmic, and extracellular domains were predicted using SignalP version 4.1 (Petersen et al. 2011), Phobius version 1.01 (Käll et al. 2004), and TMHMM version 2.0 (Krogh et al. 2001). A protein was conservatively considered as secreted only if SignalP and Phobius both predicted a secretion signal and no transmembrane domain was identified by either Phobius or TMHMM. Small secreted proteins were defined as secreted proteins shorter than 300 amino acids. Detailed gene annotations are provided in Supplementary Table S1. For plant cell wall degrading enzymes, i.e., enzymes involved in pectin, cellulose and hemicellulose, and lignin degradation, we relied on the annotations and categorization of Sipos et al. (2017) (Supplementary Table S2). Similarly, we considered pathogenicity-related genes (including secondary metabolite genes) as identified by Sipos et al. (2017) (Supplementary Table S3).
Localization of telomeres
Telomeres were considered as being assembled and present on a pseudochromosome if we identified the telomere repeat motif (TTAGGG)n. First, repetitive sequences in the scaffold assembly were identified and annotated with RepeatModeler and RepeatMasker and any putative repeats of the telomere motif were extracted. Second, the scaffold assembly was manually searched with the telomere repeat motif (TTAGGG)3 and the reverse complement (CCCTAA)3. We considered a scaffold terminus as carrying the telomere if we found at least four complete and consecutive repeats.
Identification and localization of mating-type loci
Of the two unlinked mating-type loci (MAT-A and MAT-B), the MAT-A locus encodes homeodomain transcription factors identified by Sipos et al. (2017). The MAT-B locus is supposed to encode pheromones and pheromone receptors (Brown and Casselton 2001) and has not yet been located. To infer the putative genome location of the MAT-B locus, we searched all predicted gene models for homologs of STE3 class receptors, which are MAT-B associated. To confirm the predicted mating-type locations, we conducted pairing tests with a selected set of haploid progeny belonging to the mapping population.
Results
Anchoring of the genome assembly to near chromosome-scale sequences
The genome of A. ostoyae strain C18/9 comprises 106 scaffolds ranging from 5.0 kb to 6.4 Mb as described previously (Sipos et al. 2017). The total assembled genome size is 60.1 Mb. Here, we used a genetic map constructed for A. ostoyae strain C15 to assemble the genomic scaffolds into putative chromosomes (or pseudochromosomes). The genetic map contains 11 well supported linkage groups and has a total length of 1007.5 cM as described in Heinzelmann et al. (2017). We were able to anchor 61 of the 106 scaffolds, which corresponds to 93% of the total sequence length of the genome assembly. The remaining 45 scaffolds were relatively short (5.0–338.3 kb), had a high content of transposable elements (65.10 ± 26.5% (mean ± standard deviation) vs. 25.5 ± 13.9% for anchored scaffolds), or encoded rDNA. We have calculated the EcoRI restriction site density and marker density in 50 kb windows. We find that the two measures are correlated (rPearson = 0.19, P = 5.3 × 10⁻¹¹) as expected for a RADseq-based genotyping approach. We also inspected longer stretches without markers and found that these contain mostly transposable elements, which is also reflected by the negative correlation of marker density with transposable element content (rPearson = −0.32, P < 2.2 × 10⁻¹⁶).
Overall, we observed a very high colinearity of the marker order in the genetic map and the reference genome. Discrepancies were found in 13 scaffolds (scaffolds 1, 2, 4, 7, 9, 10, 12, 14, 16, 18, 27, 28, and 30). These scaffolds were split by the genetic map into two to four fragments that individually mapped either to different linkage groups or to well separated locations within the same linkage group (Supplementary Table S4). In our assembly, the neighboring SNPs at scaffold breakage sites were at least at a 650 kb distance. All scaffolds splits were supported by multiple markers from different restriction sites. In addition, we found that a part of scaffold 26 might be inverted or translocated in the genetic map relative to the reference genome.
Based on the genetic map, most of the anchored scaffolds (87.2%) could be oriented within pseudochromosomes (Table 1). Scaffolds (and fragments thereof), which could not be oriented (n = 10), were all short (44.1–246.7 kb). Each of the constructed pseudochromosomes was composed of four to ten scaffolds or scaffold fragments. The total length of pseudochromosomes ranged from 3.3 to 7.0 Mb. The assembly into pseudochromosomes anchored 19 scaffolds with terminal telomeric repeats, which were all located at the extremities of pseudochromosomes. An additional scaffold with terminal telomeric repeats could not be anchored. Overall, seven of the 11 pseudochromosomes had telomeres on both ends and the other four at one end, indicating that the pseudochromosomes represent in most cases nearly complete chromosomes (Table 1). In addition, we identified on each pseudochromosome a region with centromere-like characteristics (i.e., AT-richness, high transposable element density, low gene density, and absence of gene transcription) (Fig. 3). The two independent mating-type loci MAT-A and MAT-B were located on different pseudochromosomes as expected (Fig. 2). It is noteworthy that the shortest pseudochromosome (LG 11) is substantially shorter than the others and might be missing a substantial portion of a chromosomal arm.

Recombination rates were estimated in nonoverlapping 20 kb segments. Vertical gray bars indicate the location of recombination hotspots defined as 50 kb windows centered on one or two adjacent 20 kb segments with recombination rates ≥200 cM/Mb. A potential recombination hotspot on LG 1 at 6 Mb was not considered a recombination hotspot because of an overlap with an assembly gap. A version of this figure with chromosomes scaled to length 1 is provided as Supplementary Fig. S3.
Frequency and distribution of crossover events
In total, we identified 1984 crossover events among all 198 progeny and 11 pseudochromosomes. The precision of crossover localization, as determined by the physical distance of the two markers flanking a crossover, was below 20 kb for 33.6% and below 50 kb for 68.6% of crossover events (Fig. 1). Consecutive crossover events on a chromosome were usually at a considerable distance (Fig. 1 and Supplementary Fig. S1). On average, the distance between consecutive crossover events was at least 3.7 Mb with the closest two events being 0.17 Mb and the most distant 6.8 Mb apart. The large distance between crossover events indicates that most represent true crossovers, as noncrossovers are expected at much shorter distances (Mancera et al. 2008). The possibly incomplete pseudochromosome LG 11 was discarded from the above analysis. The total number of crossover events observed per pseudochromosome varied from 115 (LG 11) to 214 (LG 1) (Table 2). The number of crossover events per progeny and chromosome varied from 0 to 3 with a median count of 1 (Table 2 and Supplementary Fig. S2). Observing three crossovers on a chromosome was rare. We found no progeny with three crossovers on LG 2, LG 10, and LG 11 and a maximum of seven progeny with three crossovers on LG 3. Pseudochromosome LG 11 had a very low mean crossover count compared with the other pseudochromosomes (0.58 vs. 0.80–1.08). On LG 11, only 4.5% of progeny were showing ≥2 crossover events compared with the other pseudochromosomes where 16–30% of progeny were showing two or three crossover events. This suggests that LG 11 is possibly missing a major part of a chromosomal arm without evidence what sequence constitutes the missing chromosomal fragment.
Heterogeneity of recombination rate along pseudochromosomes
The recombination rates estimated in nonoverlapping 20 kb segments along pseudochromosomes were highly heterogeneous and varied from 0 to 737 cM/Mb (Fig. 2 and Supplementary Fig. S3). The median recombination rate was 2.5 cM/Mb. We tested whether the heterogeneity in recombination rates along pseudochromosomes was deviating from a Poisson distribution. When all pseudochromosomes (except pseudochromosome LG 11) were tested together, the recombination rate distribution was significantly different than a Poisson distribution (Fisher’s exact test, P < 10−6, lambda of simulated distribution = 0.29). When tested individually, the recombination rate heterogeneity was significantly different than expected under a Poisson distribution on all but three pseudochromosomes (Table 3). In general, the highest recombination rates were observed toward the telomeres (Fig. 2 and Supplementary Fig. S3). We observed an inverse relationship of pseudochromosome length and recombination rate (rPearson = −0.77, P = 0.009, pseudochromosome LG 11 excluded).
Recombination hotspots
We defined recombination hotspots as narrow chromosomal tracts with the highest recombination rates. For this, we selected tracts of 20 kb chromosomal segments with recombination rates ≥200 cM/Mb. Both, the average and median recombination rate per 20 kb segment were with values of 17.6 and 2.5 cM/Mb, respectively, substantially lower. The probability to observe a 20 kb segment with a recombination rate of ≥200 cM/Mb by chance was P = 4.8 × 10⁻⁴ (Poisson distribution with lambda = 0.35 cM, which equals the average genetic distance per segment). In total, we identified 30 segments of 20 kb with recombination rates ≥200 cM/Mb. These segments represent only 1.1% of the analyzed genome sequence, but they accounted for 20.6% of the cumulative recombination rate. Overall, we found 19 distinct recombination hotspots on LG 1 to LG 10 (Fig. 2). While pseudochromosome LG 11 was excluded from the above analyses, including LG 11 did not meaningfully affect the outcome of the above analyses (data not shown). On LG 11, we also identified two recombination hotspots (Fig. 2).
Association of recombination hotspots with sequence characteristics and gene content
A. ostoyae has a gene dense genome composed of 45.6% coding sequences (both when analyzing the complete scaffold assembly and the pseudochromosomes). The pseudochromosomes contained slightly less genes (21350 vs. 22705) compared with the complete scaffold assembly. The reduction in BUSCO completeness was reduced from 95.6% in the complete scaffold assembly to 95.2% in the pseudochromosomes. The genome of A. ostoyae has a moderate content of transposable elements in the genome (18.7% in the complete scaffold assembly and 14.5% in pseudochromosomes) (King et al. 2015; Peter et al. 2016). Transposable element density in the A. ostoyae genome is significantly negatively correlated with GC content (rPearson = −0.42, P < 2.2 × 10⁻¹⁶) and coding sequence density (rPearson = −0.38, P < 2.2 × 10⁻¹⁶) indicating that transposable elements tend to cluster in genome compartments with reduced GC content and coding sequence density (Fig. 3) (Sánchez-Vallet et al. 2018).
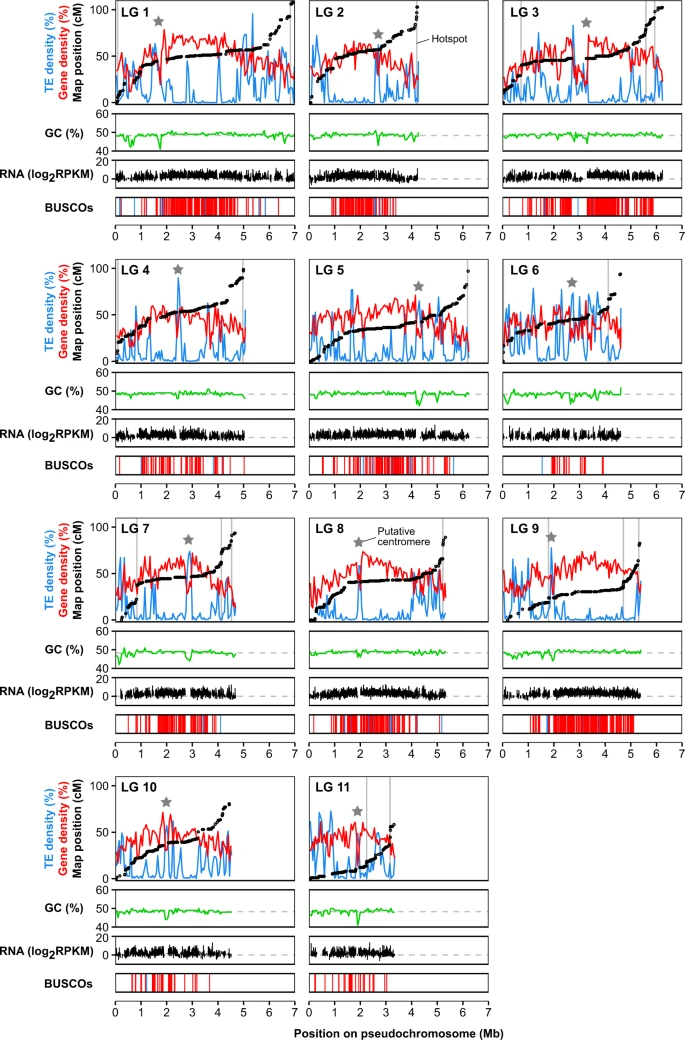
For each pseudochromosome, the first panel shows the genetic map position vs. the physical position of SNP markers (black dots). Gene density is shown in red and the density of transposable elements (TEs) is shown in blue. The position of recombination hotspots is indicated by gray vertical bars. Stars indicate approximate location of putative centromere regions. The second panel shows the GC content in green. The gray dashed line indicates the average GC content across all pseudochromosomes. Gene density, TE density, and GC content were all estimated in nonoverlapping 50 kb windows. The third panel shows gene expression levels in the cap of a fruiting body of the diploid A. ostoyae strain C18, which is the parental strain of the sequenced monosporous strain. Average gene expression among three biological replicates is shown. Expression data are retrieved from Sipos et al. (2017). RPKM: reads per kilobase of transcript per million mapped reads. The fourth panel shows the position of BUSCO genes. Complete single copy BUSCO genes are shown in red and duplicated BUSCO genes are shown in blue.
We found that recombination hotspots (defined as 50 kb windows centered on identified hotspots) had a significantly lower density in coding sequences compared with the genomic background (32.4 ± 10.5% vs. 45.7 ± 13.4%; Mann–Whitney U test, W = 4482, P = 2.9 × 10⁻⁵) (Fig. 4). The density of transposable elements in recombination hotspots was not significantly different to the genomic background (8.0 ± 8.1% vs. 14.2 ± 18.6%; Mann–Whitney U test, W = 9826, P = 0.798) (Fig. 4). Transposable element densities varied widely among windows. The median hotspot window had a transposable element density of 4.8% compared with the 5.4% in the genomic background. GC content was nearly identical in recombination hotspots and the genomic background (48.3 ± 0.8% vs. 48.4 ± 1.2%; Mann–Whitney U test, W = 8337, P = 0.145) (Fig. 4).

a GC content, b coding sequence density, c density of transposable elements (TEs), d protein length, e percentage of genes with conserved domains (i.e., with PFAM annotation), and f percentage of plant cell wall degrading genes (including pectin, cellulose, hemicellulose, and lignin degrading genes) and pathogenicity-related genes. a–c were estimated for the genomic background in nonoverlapping 50 kb windows. a–d n.s. not significant at P < 0.05, ***P < 0.001, Mann–Whitney U test.
We found a total of 335 genes overlapping with recombination hotspots (excluding LG 11 hotspots) (Supplementary Table S5). Genes located within recombination hotspots were encoding on average shorter proteins (Mann–Whitney U test, W = 2752400, P = 9.6 × 10⁻⁸) (Fig. 4). Protein length averaged 322.8 ± 268.1 amino acids in recombination hotspots and 406.1 ± 339.4 amino acids in the genomic background. Proteins encoded in recombination hotspots were less likely to contain conserved PFAM domains (Fisher’s exact test, P = 8.2 × 10⁻⁵) compared with the genomic background (34.9% vs. 45.7%) (Fig. 4). The organization of genes and transposable elements in the top four recombination hotspots is illustrated in Supplementary Fig. S4. In the chromosomal context, we noted a lower density of genes with conserved PFAM domains at chromosome peripheries compared with chromosome centers (Fig. 5). The frequency of genes encoding secreted proteins as well as small secreted proteins (<300 aa) was found to be similar between recombination hotspots and the genomic background (Supplementary Table S6). Next, we analyzed plant cell wall degrading enzymes. Genes encoding pectin degrading enzymes were significantly overrepresented in recombination hotspots compared with the genomic background (Fisher’s exact test, P = 0.007), whereas genes encoding cellulose, hemicellulose, and lignin degrading enzymes were similarly distributed among hotspots and the genomic background (Fig. 4 and Supplementary Table S6). Pathogenicity-related genes (Sipos et al. 2017) tended to be more frequent in hotspots vs. non-hotspot regions, but the difference was not statistically significant (Supplementary Table S6). Overall, pathogenicity-related genes showed mostly a scattered distribution among all pseudochromosomes except for LG 6 where a large cluster of pathogenicity-related genes was observed (Fig. 5). While pseudochromosome LG 11 was excluded from the above analyses, including LG 11 did not meaningfully affect the outcome of the above analyses (data not shown). The recombination hotspots on LG 11 were overlapping with 36 genes (Supplementary Table S5).

The following categories of plant cell wall degrading enzyme are distinguished: pectin degrading enzymes (blue), cellulose and hemicellulose degrading enzymes (red), and lignin degrading enzymes (black). Of the pathogenicity-related proteins, the three most frequent categories are highlighted: NRPS-like synthases (black), hydrophobins (dark brown), and carboxylesterases (medium brown). All other types of pathogenicity-related proteins are colored in light brown. Short secreted proteins (<300 aa) are indicated in green, whereas all other secreted proteins are indicated in black. The density of genes with conserved domains is highest in dark areas and lowest in brighter areas. The locations of recombination hotspots are indicated by vertical gray bars spanning the horizontal bars.
Mating-type loci and associated recombination patterns
The mating-type MAT-A locus of A. ostoyae is composed of four homeodomain transcription factors (ARMOST_09543, ARMOST_09544, ARMOST_09546, ARMOST_09547) and shows a high level of synteny with the MAT-A locus of related species as shown by Sipos et al. (2017). We located the MAT-A locus close to the center of pseudochromosome LG 1 in a region with low recombination (Fig. 2). The search for STE3 class receptor homologs associated with the MAT-B locus revealed six genes located on three different chromosomes (ARMOST_14825 on LG 4; ARMOST_10298, ARMOST_17820, ARMOST_17822, and ARMOST_17828 on LG 6; ARMOST_00630 on LG 8). However, only the genotypes in the vicinity of ARMOST_17820, ARMOST_17822, and ARMOST_17828 on LG 6 fully cosegregated with the experimentally determined mating types. Based on this evidence, the MAT-B locus is most likely located toward the end of LG 6 (Fig. 2) and includes three pheromone receptors located in proximity from each other.
Discussion
We constructed a dense genetic map for A. ostoyae that enabled assembling a chromosome-scale reference genome. The presence of telomeric repeats on all but four pseudochromosomal ends indicates that nearly all chromosomes are completely assembled. Recombination rates increased from central regions toward the pseudochromosomal ends (i.e., telomeres). This further confirms the reliability of the chromosomal assembly. In addition, we identified on all chromosomes a region resembling fungal centromeres (Fig. 3). Those putative centromere regions were located within chromosomal regions with low recombination (Laurent et al. 2018; Mancera et al. 2008; Müller et al. 2019). However, the exact location and length of centromere regions needs to be confirmed using chromatin immunoprecipitation sequencing as applied in other basidiomycetes (Yadav et al. 2018). Many centromeres cannot be predicted from sequence characteristics alone (Smith et al. 2012).
The previous assembly of the A. ostoyae genome into subchromosomal scaffolds was highly complete as assessed by BUSCO (Sipos et al. 2017). Even though we were unable to place ~7% of the total scaffold sequences, the unplaced scaffolds contain mostly repetitive sequences. This was evident from the fact that our chromosome-scale assembly had only a very slightly reduced assembly completeness (95.2 vs. 95.6% of BUSCO genes). The transposable element content of our assembly is indeed quite lower compared with the scaffold-level assembly (14.5 vs. 18.7%) and unplaced scaffolds were clearly enriched in transposable elements (65.10 ± 26.5 vs. 25.5 ± 13.9%) or contained repeats of rDNA. The placement of some small, repeat-rich scaffolds was difficult to assess. We also identified a small number of discrepancies between the assembled scaffolds and the corresponding genetic map. These discrepancies were in all cases disjunctions of scaffolds and may be due to genetic differences between the sequenced strain (SBI C18/9) and the parental strain used for genetic mapping (C15). Some discrepancies may also stem from scaffold assembly errors. To fully resolve the causes for these discrepancies additional long-read sequencing is necessary. The pseudochromosome LG 11 is less complete and likely misses a substantial part of a chromosomal arm. This was evident from the short genetic map length and the markedly reduced number of progeny with at least two crossover events compared with the other pseudochromosomes (4.5 vs. 16–30%, Supplementary Fig. S2). The missing sequence may contain the rDNA cluster, which is challenging to assemble even with long-read sequencing and may constitute a substantial fraction of a fungal chromosome (Sonnenberg et al. 2016; Van Kan et al. 2017). The scaffold assembly of A. ostoyae contains a scaffold (AROS_scaffold082) with three units of the rDNA repeat. However, we were unable to place this scaffold supporting the idea that our LG 11 assembly lacks the rDNA repeat. Alternatively, the missing chromosomal fragment may represent a major structural variation segregating between the strains SBI C18/9 and C15.
The identification of 11 pseudochromosomes (or linkage groups) provides the first estimate of the haploid chromosome number for an Armillaria species. Other species form the order Agaricales were found to have similar chromosome numbers, e.g., Agaricus bisporus (n = 13, Sonnenberg et al. 1996), Coprinopsis cinerea (n = 13, Muraguchi et al. 2003), Pleurotus ostreatus (n = 11, Larraya et al. 1999), or Laccaria montana (n = 9, Mueller et al. 1993). Given that our genetic map reached marker saturation and covers 93% of the scaffold-level assembly, the presence of additional chromosomes is highly unlikely. Karyotyping (e.g., by pulsed field gel electrophoresis) and high-density optical mapping would provide further confirmation of chromosome numbers and sizes, and likely resolve the placement of the unanchored scaffolds. In particular, an optical map may help to resolve the size and position of the highly repetitive rDNA cluster (Van Kan et al. 2017).
The total size of the genetic map for A. ostoyae was 1007.5 cM and falls into the range of genetic map sizes observed for other basidiomycetes (Foulongne-Oriol 2012). However, the total genetic map size depends on chromosome numbers and chromosomal recombination rates, which both vary substantially among fungal species. All the A. ostoyae chromosomes had a map length of 80.6–108.6 cM (with the exception of LG 11). This represents approximately two crossover events per bivalent and meiosis, which is consistent with the number of progeny observed with 0 (~25%), or 1 (~50%), or 2 (~25%) crossovers per chromosome. Chromosomal crossover counts vary considerably among fungal species. For example, in A. bisporus there is on average just one obligate crossover per bivalent for all chromosomes (Sonnenberg et al. 2016), whereas in Saccharomyces cerevisiae the average is approximately six crossovers per bivalent (Mancera et al. 2008). Interestingly, in some fungi there is a strong positive correlation between chromosomes size and the number of crossovers (Mancera et al. 2008; Roth et al. 2018), but we found no such apparent correlation in A. ostoyae.
The recombination landscape of A. ostoyae follows a canonical pattern, with increased recombination toward the peripheries of chromosomes and decreased recombination toward centromeres. The most striking deviations in these patterns are recombination hotspots. Such recombination hotspots are observed in many fungal species (Croll et al. 2015; Laurent et al. 2018; Müller et al. 2019; Roth et al. 2018; Van Kan et al. 2017), however their specific role in genome and gene evolution is still largely unknown. In the wheat pathogen Zymoseptoria tritic recombination hotspots may serve as ephemeral genome compartments favoring the emergence of fast-evolving virulence genes (Croll et al. 2015). Recombination hotspots in A. ostoyae were with two exceptions, all located at the peripheries of chromosomes, where gene densities are low and gene functions are less conserved. From an evolutionary perspective, placing recombination hotspots distal from conserved housekeeping genes should be favorable given the mutagenic potential of hotspots. Interestingly, we found that genes involved in pectin degradation were enriched in recombination hotspots compared with the genomic background. Pectin is a major component of the plant cell wall and pectinolytic enzymes are among the first enzymes secreted by plant pathogens during host infection (Herbert et al. 2003). More extensive analyses of recombination rate variation and loci encoding key pathogenicity functions are needed to identify potential causal relationships of recombination hotspots and the accelerated emergence of novelty.
Data availability
Progeny sequencing data are available on the NCBI SRA under the BioProject accession PRJNA380873. The chromosomal sequences are deposited in the European Nucleotide Archive under LR732075 to LR732085. The previous scaffold assembly can be retrieved from the European Nucleotide Archive under the accession FUEG01000000.
References
Alves I, Houle AA, Hussin JG, Awadalla P (2017) The impact of recombination on human mutation load and disease. Philos Trans R Soc Lond B Biol Sci 372:20160465
Anderson JB, Ullrich RC (1979) Biological species of Armillaria mellea in North America. Mycologia 71:402–414
Aylward J, Steenkamp ET, Dreyer LL, Roets F, Wingfield BD, Wingfield MJ (2017) A plant pathology perspective of fungal genome sequencing. IMA Fungus 8:1–15
Barton NH, Charlesworth B (1998) Why sex and recombination? Science 281:1986–1990
Baumgartner K, Coetzee MPA, Hoffmeister D (2011) Secrets of the subterranean pathosystem of Armillaria. Mol Plant Pathol 12:515–534
Bendel M, Kienast F, Rigling D (2006a) Genetic population structure of three Armillaria species at the landscape scale: a case study from Swiss Pinus mugo forests. Mycol Res 110:705–712
Bendel M, Kienast F, Rigling D, Bugmann H (2006b) Impact of root-rot pathogens on forest succession in unmanaged Pinus mugo stands in the Central Alps. Can J Res 36:2666–2674
Broman KW, Wu H, Sen, Churchill GA (2003) R/qtl: QTL mapping in experimental crosses. Bioinformatics 19:889–890
Brown AJ, Casselton LA (2001) Mating in mushrooms: increasing the chances but prolonging the affair. Trends Genet 17:393–400
Charlesworth B, Barton NH (1996) Recombination load associated with selection for increased recombination. Genet Res 67:27–41
Charlesworth B, Charlesworth D (2000) The degeneration of Y chromosomes. Philos Trans R Soc B 355:1563–1572
Choi K, Reinhard C, Serra H, Ziolkowski PA, Underwood CJ, Zhao X et al. (2016) Recombination rate heterogeneity within arabidopsis disease resistance genes. PLOS Genet 12:e1006179
Collins C, Keane TM, Turner DJ, O’Keeffe G, Fitzpatrick DA, Doyle S (2013) Genomic and proteomic dissection of the ubiquitous plant pathogen, Armillaria mellea: toward a new infection model system. J Proteome Res 12:2552–2570
Croll D, Lendenmann MH, Stewart E, McDonald BA (2015) The impact of recombination hotspots on genome evolution of a fungal plant pathogen. Genetics 201:1213–1228
Didelot X, Achtman M, Parkhill J, Thomson NR, Falush D (2007) A bimodal pattern of relatedness between the Salmonella Paratyphi A and Typhi genomes: convergence or divergence by homologous recombination? Genome Res 17:61–68
Ferguson BA, Dreisbach TA, Parks CG, Filip GM, Schmitt CL (2003) Coarse-scale population structure of pathogenic Armillaria species in a mixed-conifer forest in the Blue Mountains of northeast Oregon. Can J Res 33:612–623
Fledel-Alon A, Wilson DJ, Broman K, Wen X, Ober C, Coop G et al. (2009) Broad-scale recombination patterns underlying proper disjunction in humans. PLOS Genet 5:e1000658
Foulongne-Oriol M (2012) Genetic linkage mapping in fungi: current state, applications, and future trends. Appl Microbiol Biotechnol 95:891–904
Guillaumin JJ, Legrand P, Lung-Escarmant B, Botton B (eds) (2005) L’armillaire et le pourridié-agaric des végétaux ligneux. INRA: Paris, p 487
Guillaumin JJ, Mohammed C, Anselmi N, Courtecuisse R, Gregory SC, Holdenrieder O et al. (1993) Geographical distribution and ecology of the Armillaria species in western Europe. Eur J For Pathol 23:321–341
Haenel Q, Laurentino TG, Roesti M, Berner D (2018) Meta-analysis of chromosome-scale crossover rate variation in eukaryotes and its significance to evolutionary genomics. Mol Ecol 27:2477–2497
Hamilton WD (1980) Sex versus non-sex versus parasite. Oikos 35:282–290
Hassold T, Hunt P (2001) To err (meiotically) is human: the genesis of human aneuploidy. Nat Rev Genet 2:280–291
Heinzelmann R, Croll D, Zoller S, Sipos G, Münsterkötter M, Güldener U et al. (2017) High-density genetic mapping identifies the genetic basis of a natural colony morphology mutant in the root rot pathogen Armillaria ostoyae. Fungal Genet Biol 108:44–54
Heinzelmann R, Dutech C, Tsykun T, Labbé F, Soularue J-P, Prospero S (2019) Latest advances and future perspectives in Armillaria research. Can J Plant Pathol 41:1–23
Herbert C, Boudart G, Borel C, Jacquet C, Esquerre-Tugaye M, Dumas B (2003) Regulation and role of pectinases in phytopathogenic fungi. In: Voragen F, Schols H, Visser R (eds) Advances in pectin and pectinase research. Springer, Dordrecht, p 201–220
Hill WG, Robertson A (2009) The effect of linkage on limits to artificial selection. Genet Res 8:269–294
Holt KE, Parkhill J, Mazzoni CJ, Roumagnac P, Weill F-X, Goodhead I et al. (2008) High-throughput sequencing provides insights into genome variation and evolution in Salmonella typhi. Nat Genet 40:987
Hood IA, Redfern DB, Kile GA (1991) Armillaria in planted hosts. In: Shaw III CG, Kile GA (eds) Armillaria root disease. Agricultural handbook no. 691. USDA Forest Service, Washington D.C., p 122–149
Jones P, Binns D, Chang H-Y, Fraser M, Li W, McAnulla C et al. (2014) InterProScan 5: genome-scale protein function classification. Bioinformatics 30:1236–1240
Käll L, Krogh A, Sonnhammer ELL (2004) A combined transmembrane topology and signal peptide prediction method. J Mol Biol 338:1027–1036
King R, Urban M, Hammond-Kosack MCU, Hassani-Pak K, Hammond-Kosack KE (2015) The completed genome sequence of the pathogenic ascomycete fungus Fusarium graminearum. BMC Genom 16:544
Krogh A, Larsson B, von Heijne G, Sonnhammer ELL (2001) Predicting transmembrane protein topology with a hidden markov model: application to complete genomes. J Mol Biol 305:567–580
Laflamme G, Guillaumin JJ (2005) L’armillaire, agent pathogène mondial: répartition et dégâts. In: Guillaumin JJ, Legrand P, Lung-Escarmant B, Botton B (eds) L’ armillaire et la pourridié-agaric des végétaux ligneux. INRA, Paris, p 273–289
Larraya LM, Perez G, Penas MM, Baars JJP, Mikosch TSP, Pisabarro AG et al. (1999) Molecular karyotype of the white rot fungus Pleurotus ostreatus. Appl Environ Microbiol 65:3413–3417
Laurent B, Palaiokostas C, Spataro C, Moinard M, Zehraoui E, Houston RD et al. (2018) High-resolution mapping of the recombination landscape of the phytopathogen Fusarium graminearum suggests two-speed genome evolution. Mol Plant Pathol 19:341–354
Legrand P, Ghahari S, Guillaumin J-J (1996) Occurrence of genets of Armillaria spp. in four mountain forests in Central France: the colonization strategy of Armillaria ostoyae. N Phytol 133:321–332
Lively CM (2010) A review of red queen models for the persistence of obligate sexual reproduction. J Hered 101:S13–S20
Mancera E, Bourgon R, Brozzi A, Huber W, Steinmetz LM (2008) High-resolution mapping of meiotic crossovers and non-crossovers in yeast. Nature 454:479–485
McDonald BA, Linde C (2002) Pathogen population genetics, evolutionary potential, and durable resistance. Annu Rev Phytopathol 40:349–379
McLaughlin JA (2001) Impact of Armillaria root disease on succession in red pine plantations in southern Ontario. For Chron 77:519–524
Möller M, Stukenbrock EH (2017) Evolution and genome architecture in fungal plant pathogens. Nat Rev Micro 15:756
Morran LT, Schmidt OG, Gelarden IA, Parrish RC, Lively CM (2011) Running with the red queen: Host-parasite coevolution selects for biparental sex. Science 333:216–218
Morrison DJ, Chu D, Johnson ALS (1985) Species of Armillaria in British-Columbia. Can J Plant Pathol 7:242–246
Mueller GJ, Mueller GM, Shih L-H, Ammirati JF (1993) Cytological studies in Laccaria (Agaricales) I. Meiosis and postmeiotic mitosis. Am J Bot 80:316–321
Muller HJ (1964) The relation of recombination to mutational advance. Mutat Res/Fundam Mol Mech Mutagen 1:2–9
Müller MC, Praz CR, Sotiropoulos AG, Menardo F, Kunz L, Schudel S et al. (2019) A chromosome-scale genome assembly reveals a highly dynamic effector repertoire of wheat powdery mildew. N Phytol 221:2176–2189
Muraguchi H, Ito Y, Kamada T, Yanagi SO (2003) A linkage map of the basidiomycete Coprinus cinereus based on random amplified polymorphic DNAs and restriction fragment length polymorphisms. Fungal Genet Biol 40:93–102
Nelson MI, Holmes EC (2007) The evolution of epidemic influenza. Nat Rev Genet 8:196
Ota Y, Matsushita N, Nagasawa E, Terashita T, Fukuda K, Suzuki K (1998) Biological species of Armillaria in Japan. Plant Dis 82:537–543
Otto SP, Barton NH (1997) The evolution of recombination: removing the limits to natural selection. Genetics 147:879–906
Otto SP, Lenormand T (2002) Resolving the paradox of sex and recombination. Nat Rev Genet 3:252–261
Peter M, Kohler A, Ohm RA, Kuo A, Krützmann J, Morin E et al. (2016) Ectomycorrhizal ecology is imprinted in the genome of the dominant symbiotic fungus Cenococcum geophilum. Nat Commun 7:12662
Petersen TN, Brunak S, von Heijne G, Nielsen H (2011) SignalP 4.0: discriminating signal peptides from transmembrane regions. Nat Methods 8:785–786
Prospero S, Holdenrieder O, Rigling D (2004) Comparison of the virulence of Armillaria cepistipes and Armillaria ostoyae on four Norway spruce provenances. For Pathol 34:1–14
Prospero S, Lung-Escarmant B, Dutech C (2008) Genetic structure of an expanding Armillaria root rot fungus (Armillaria ostoyae) population in a managed pine forest in southwestern France. Mol Ecol 17:3366–3378
Qin GF, Zhao J, Korhonen K (2007) A study on intersterility groups of Armillaria in China. Mycologia 99:430–441
R Development Core Team (2017) R: a language and environment for statistical computing. R Foundation for Statistical Computing, Vienna, Austria
Rishbeth J (1985) Infection cycle of Armillaria and host response. Eur J For Pathol 15:332–341
Roth C, Sun S, Billmyre RB, Heitman J, Magwene PM (2018) A high-resolution map of meiotic recombination in Cryptococcus deneoformans demonstrates decreased recombination in unisexual reproduction. Genetics 209:567–578
Sánchez-Vallet A, Fouché S, Fudal I, Hartmann FE, Soyer JL, Tellier A et al. (2018) The genome biology of effector gene evolution in filamentous plant pathogens. Annu Rev Phytopathol 56:21–40
Shaw III CG, Kile GA (eds) (1991) Armillaria root disease. Agricultural handbook no. 691. USDA Forest Service, Washington D.C., p 233
Simão FA, Waterhouse RM, Ioannidis P, Kriventseva EV, Zdobnov EM (2015) BUSCO: assessing genome assembly and annotation completeness with single-copy orthologs. Bioinformatics 31:3210–3212
Sipos G, Prasanna AN, Walter MC, O’Connor E, Bálint B, Krizsán K et al. (2017) Genome expansion and lineage-specific genetic innovations in the forest pathogenic fungi Armillaria. Nat Ecol Evol 1:1931–1941
Smith KM, Galazka JM, Phatale PA, Connolly LR, Freitag M (2012) Centromeres of filamentous fungi. Chromosome Res 20:635–656
Sonnenberg ASM, de Groot PW, Schaap PJ, Baars JJP, Visser J, Van Griensven LJ (1996) Isolation of expressed sequence tags of Agaricus bisporus and their assignment to chromosomes. Appl Environ Microbiol 62:4542–4547
Sonnenberg ASM, Gao W, Lavrijssen B, Hendrickx P, Sedaghat-Tellgerd N, Foulongne-Oriol M et al. (2016) A detailed analysis of the recombination landscape of the button mushroom Agaricus bisporus var. bisporus. Fungal Genet Biol 93:35–45
Stukenbrock EH, Dutheil JY (2018) Fine-scale recombination maps of fungal plant pathogens reveal dynamic recombination landscapes and intragenic hotspots. Genetics 208:1209–1229
Stukenbrock EH, McDonald BA (2008) The origins of plant pathogens in agro-ecosystems. Annu Rev Phytopathol 46:75–100
Taylor J, Butler D (2017) R Package ASMap: efficient genetic linkage map construction and diagnosis. J Stat Softw 79:1–29
Van Kan JAL, Stassen JHM, Mosbach A, Van Der Lee TAJ, Faino L, Farmer AD et al. (2017) A gapless genome sequence of the fungus Botrytis cinerea. Mol Plant Pathol 18:75–89
Wendte JM, Miller MA, Lambourn DM, Magargal SL, Jessup DA, Grigg ME (2010) Self-mating in the definitive host potentiates clonal outbreaks of the apicomplexan parasites Sarcocystis neurona and Toxoplasma gondii. PLOS Genet 6:e1001261
Wilson MA, Makova KD (2009) Genomic analyses of sex chromosome evolution. Annu Rev Genom Hum G 10:333–354
Wingfield BD, Ambler JM, Coetzee MPA, de Beer ZW, Duong TA, Joubert F et al. (2016) Draft genome sequences of Armillaria fuscipes, Ceratocystiopsis minuta, Ceratocystis adiposa, Endoconidiophora laricicola, E. polonica and Penicillium freii DAOMC 242723. IMA Fungus 7:217–227
Wu YH, Bhat PR, Close TJ, Lonardi S (2008) Efficient and accurate construction of genetic linkage maps from the minimum spanning tree of a graph. PLOS Genet 4:e1000212
Yadav V, Sun S, Billmyre RB, Thimmappa BC, Shea T, Lintner R et al. (2018) RNAi is a critical determinant of centromere evolution in closely related fungi. Proc Natl Acad Sci USA 115:3108–3113
Acknowledgements
Sequencing libraries were generated in collaboration with the Genetic Diversity Center of ETH Zurich and sequenced by the Quantitative Genomics Facility of the Department of Biosystems Science and Engineering of ETH Zurich in Basel. The A. ostoyae genome project was funded by the European Union in the framework of the Széchenyi 2020 Program (GINOP-2.3.2-15-2016-00052) to GS and MM and by the WSL to GS.
Author information
Authors and Affiliations
Contributions
RH and DC conceived the study; RH analyzed the data; DR, GS, and MM provided datasets; RH and DC wrote the manuscript.
Corresponding author
Ethics declarations
Conflict of interest
The authors declare that they have no conflict of interest.
Additional information
Publisher’s note Springer Nature remains neutral with regard to jurisdictional claims in published maps and institutional affiliations.
Associate editor: Aurora Ruiz-Herrera
Rights and permissions
About this article

Cite this article
Heinzelmann, R., Rigling, D., Sipos, G. et al. Chromosomal assembly and analyses of genome-wide recombination rates in the forest pathogenic fungus Armillaria ostoyae. Heredity 124, 699–713 (2020). https://doi.org/10.1038/s41437-020-0306-z
Received:
Revised:
Accepted:
Published:
Issue Date:
DOI: https://doi.org/10.1038/s41437-020-0306-z
This article is cited by
-
A systematic screen for co-option of transposable elements across the fungal kingdom
Mobile DNA (2024)
-
A genetic linkage map and improved genome assembly of the termite symbiont Termitomyces cryptogamus
BMC Genomics (2023)
-
IMA genome‑F17
IMA Fungus (2022)
-
On how to generalize species-specific conceptual schemes to generate a species-independent Conceptual Schema of the Genome
BMC Bioinformatics (2021)
-
Macrosynteny analysis between Lentinula edodes and Lentinula novae-zelandiae reveals signals of domestication in Lentinula edodes
Scientific Reports (2021)
