Metabolic Phenotypes of Hypoxic-Ischemic Encephalopathy with Normal vs. Pathologic Magnetic Resonance Imaging Outcomes

 , , ,
, , ,  , , and
Abstract
: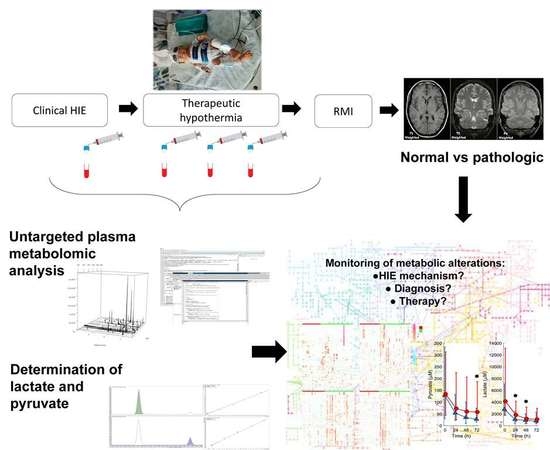
1. Introduction
2. Results
2.1. Patient Characteristics
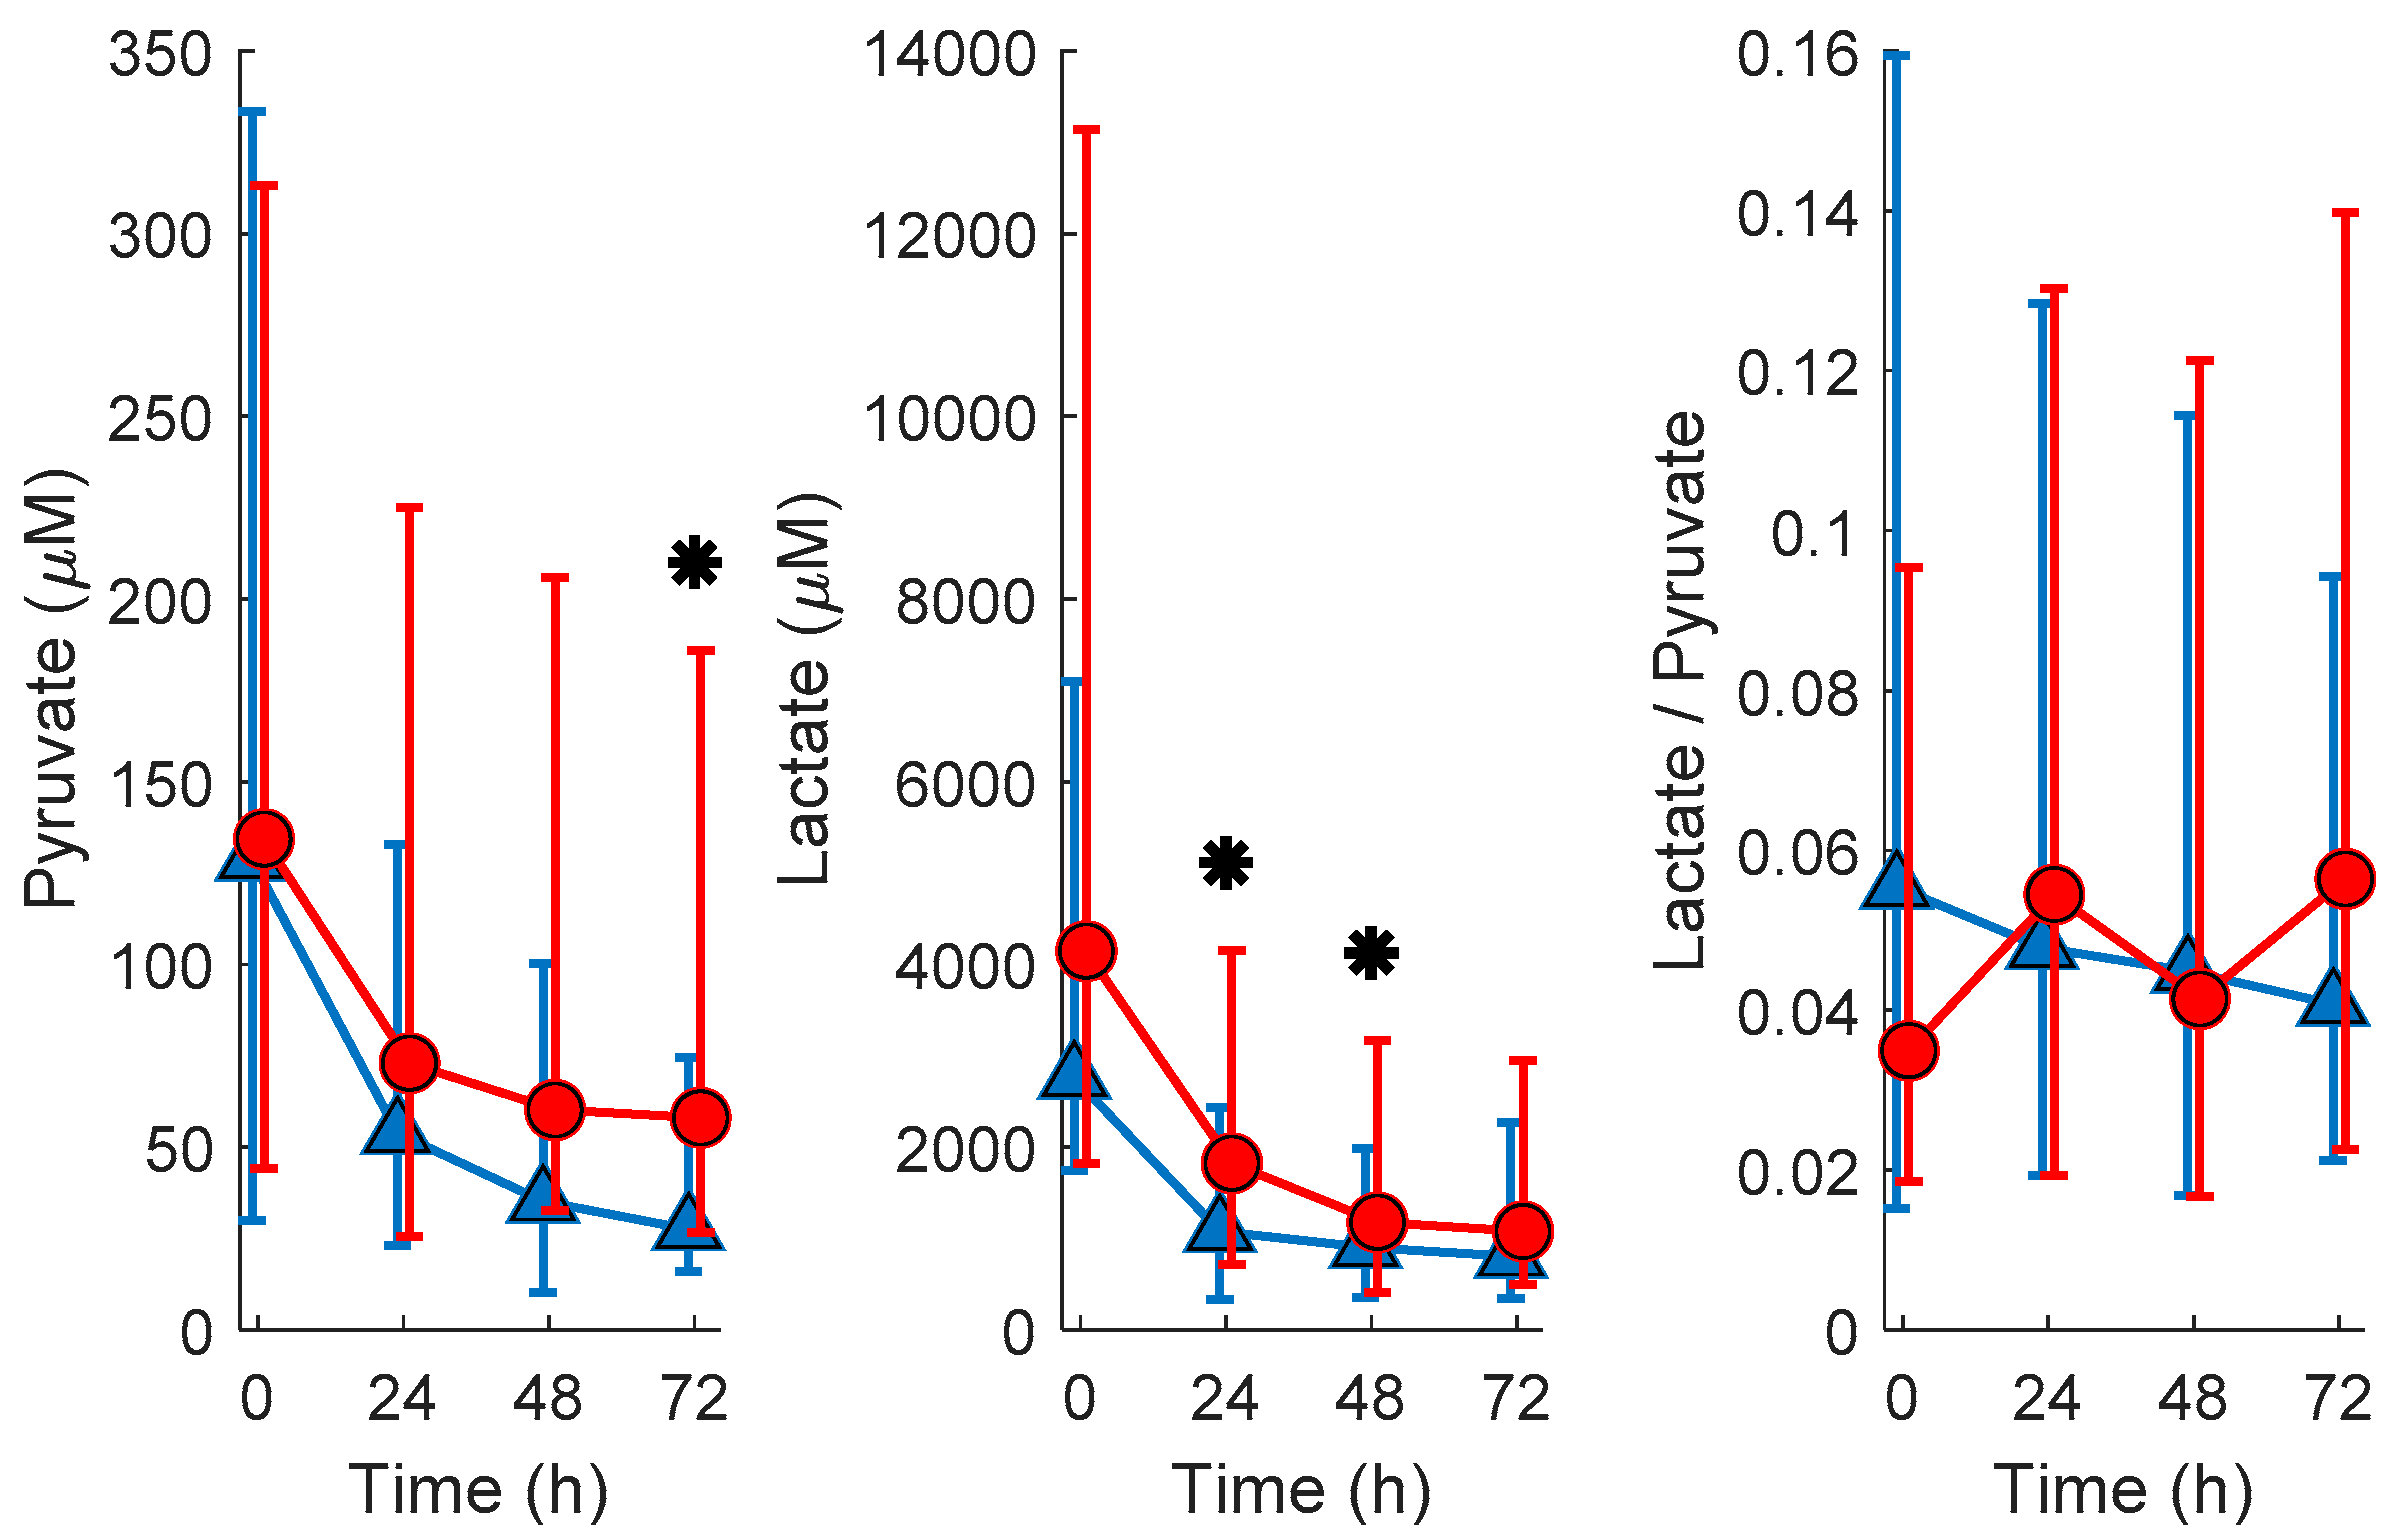
2.2. Plasma Lactate and Pyruvate Levels
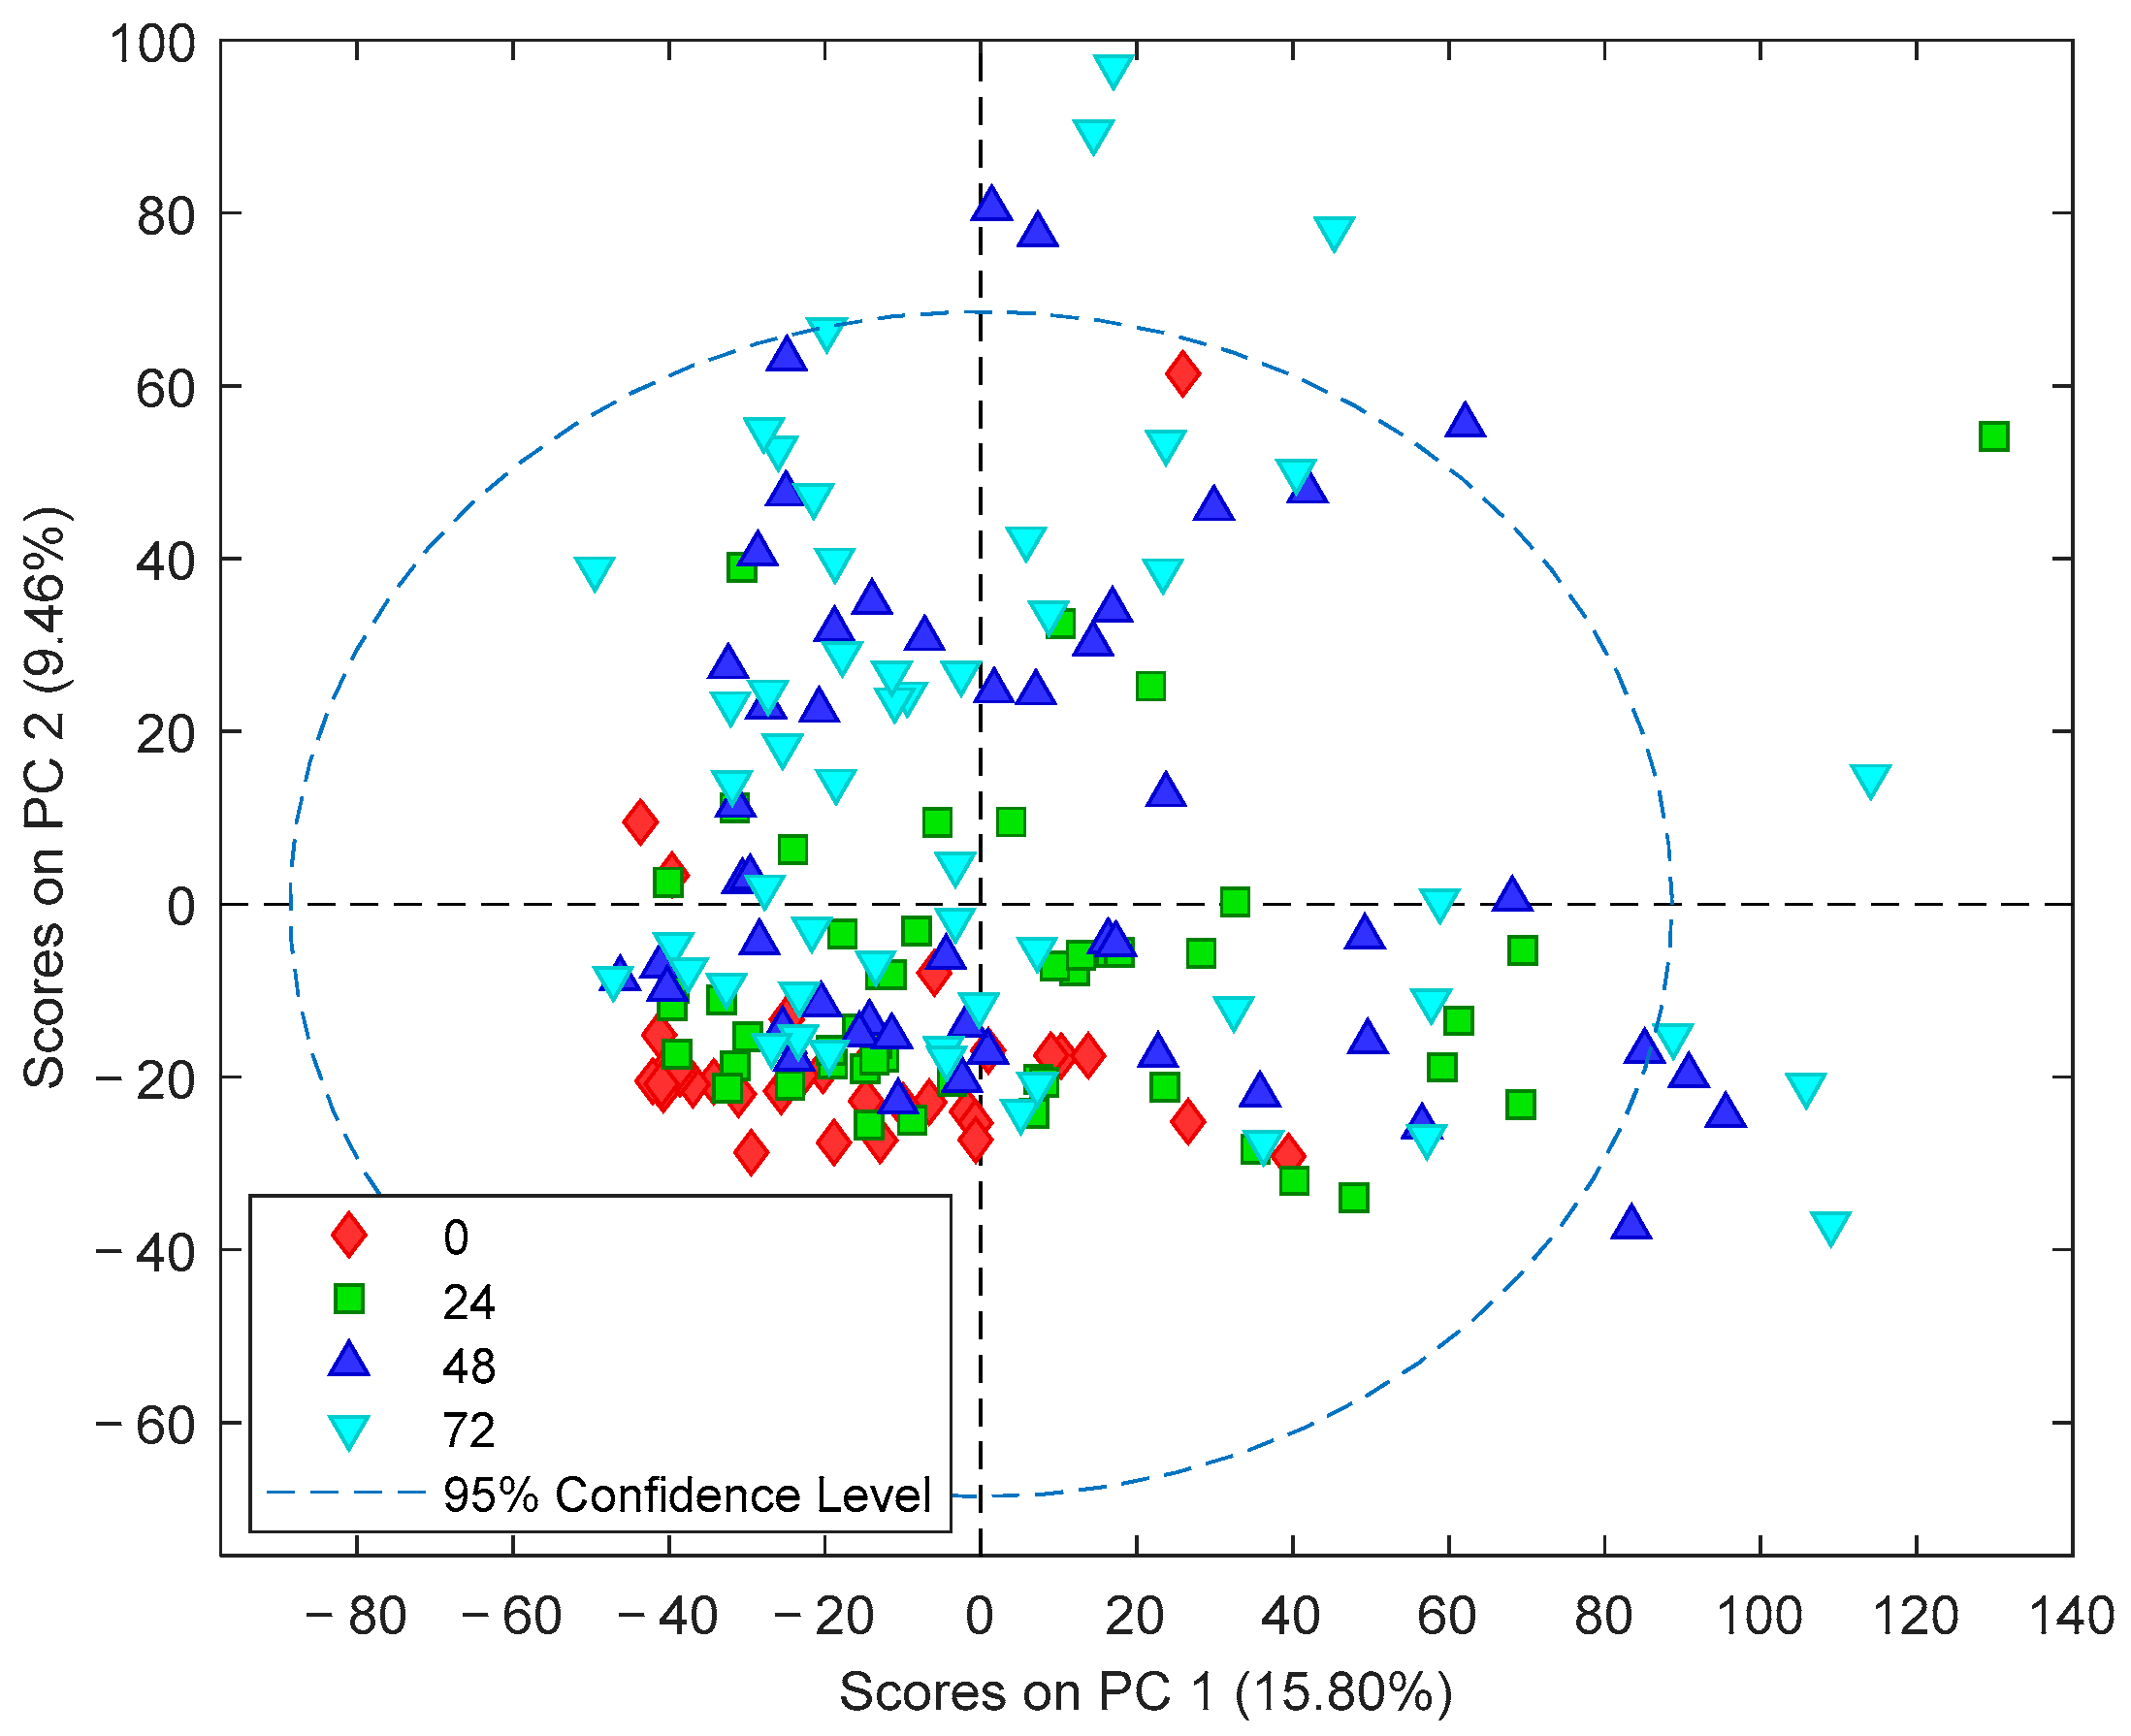
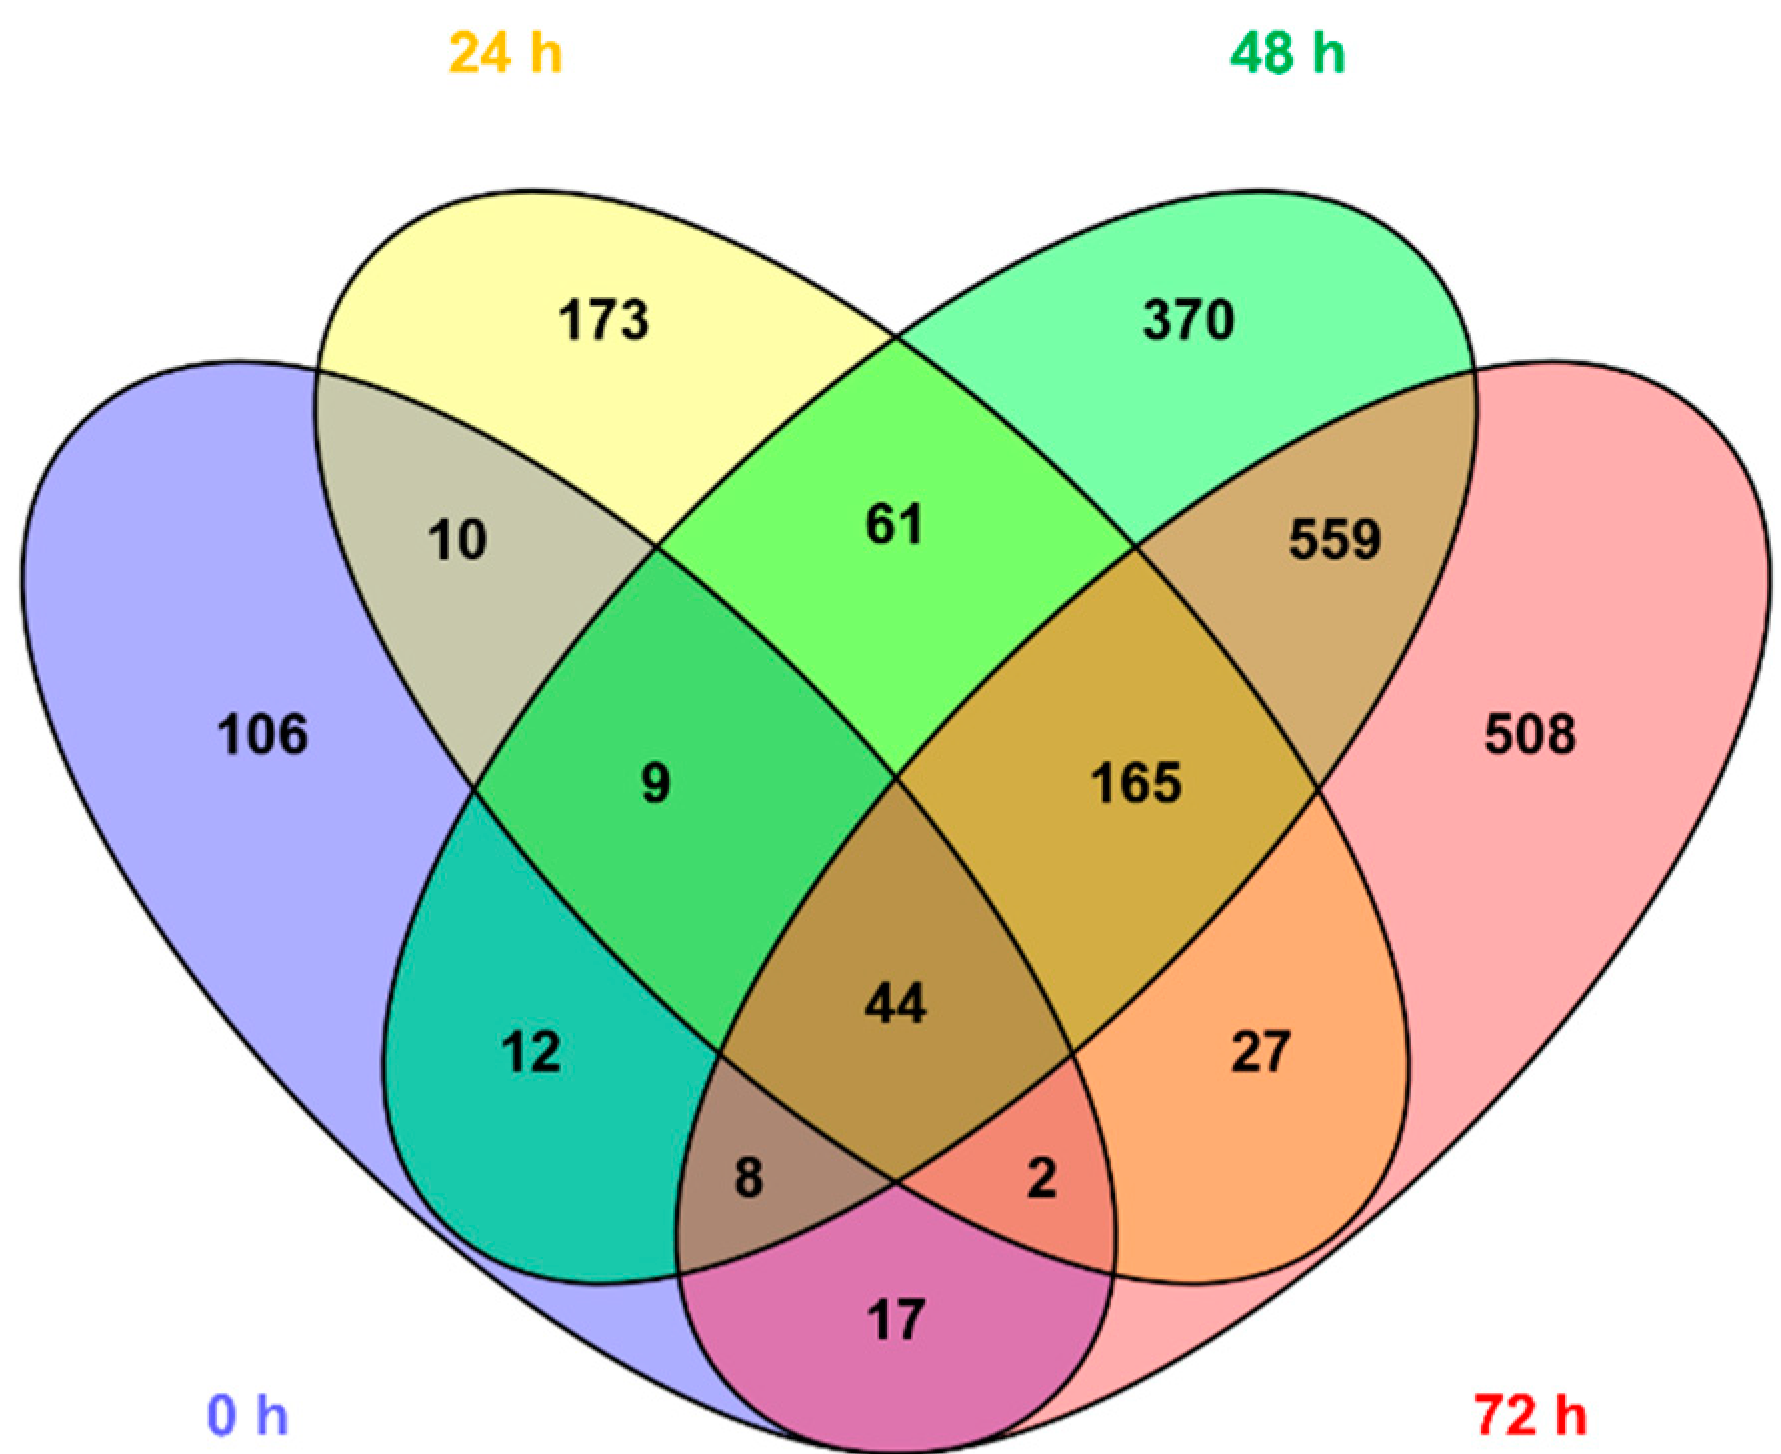
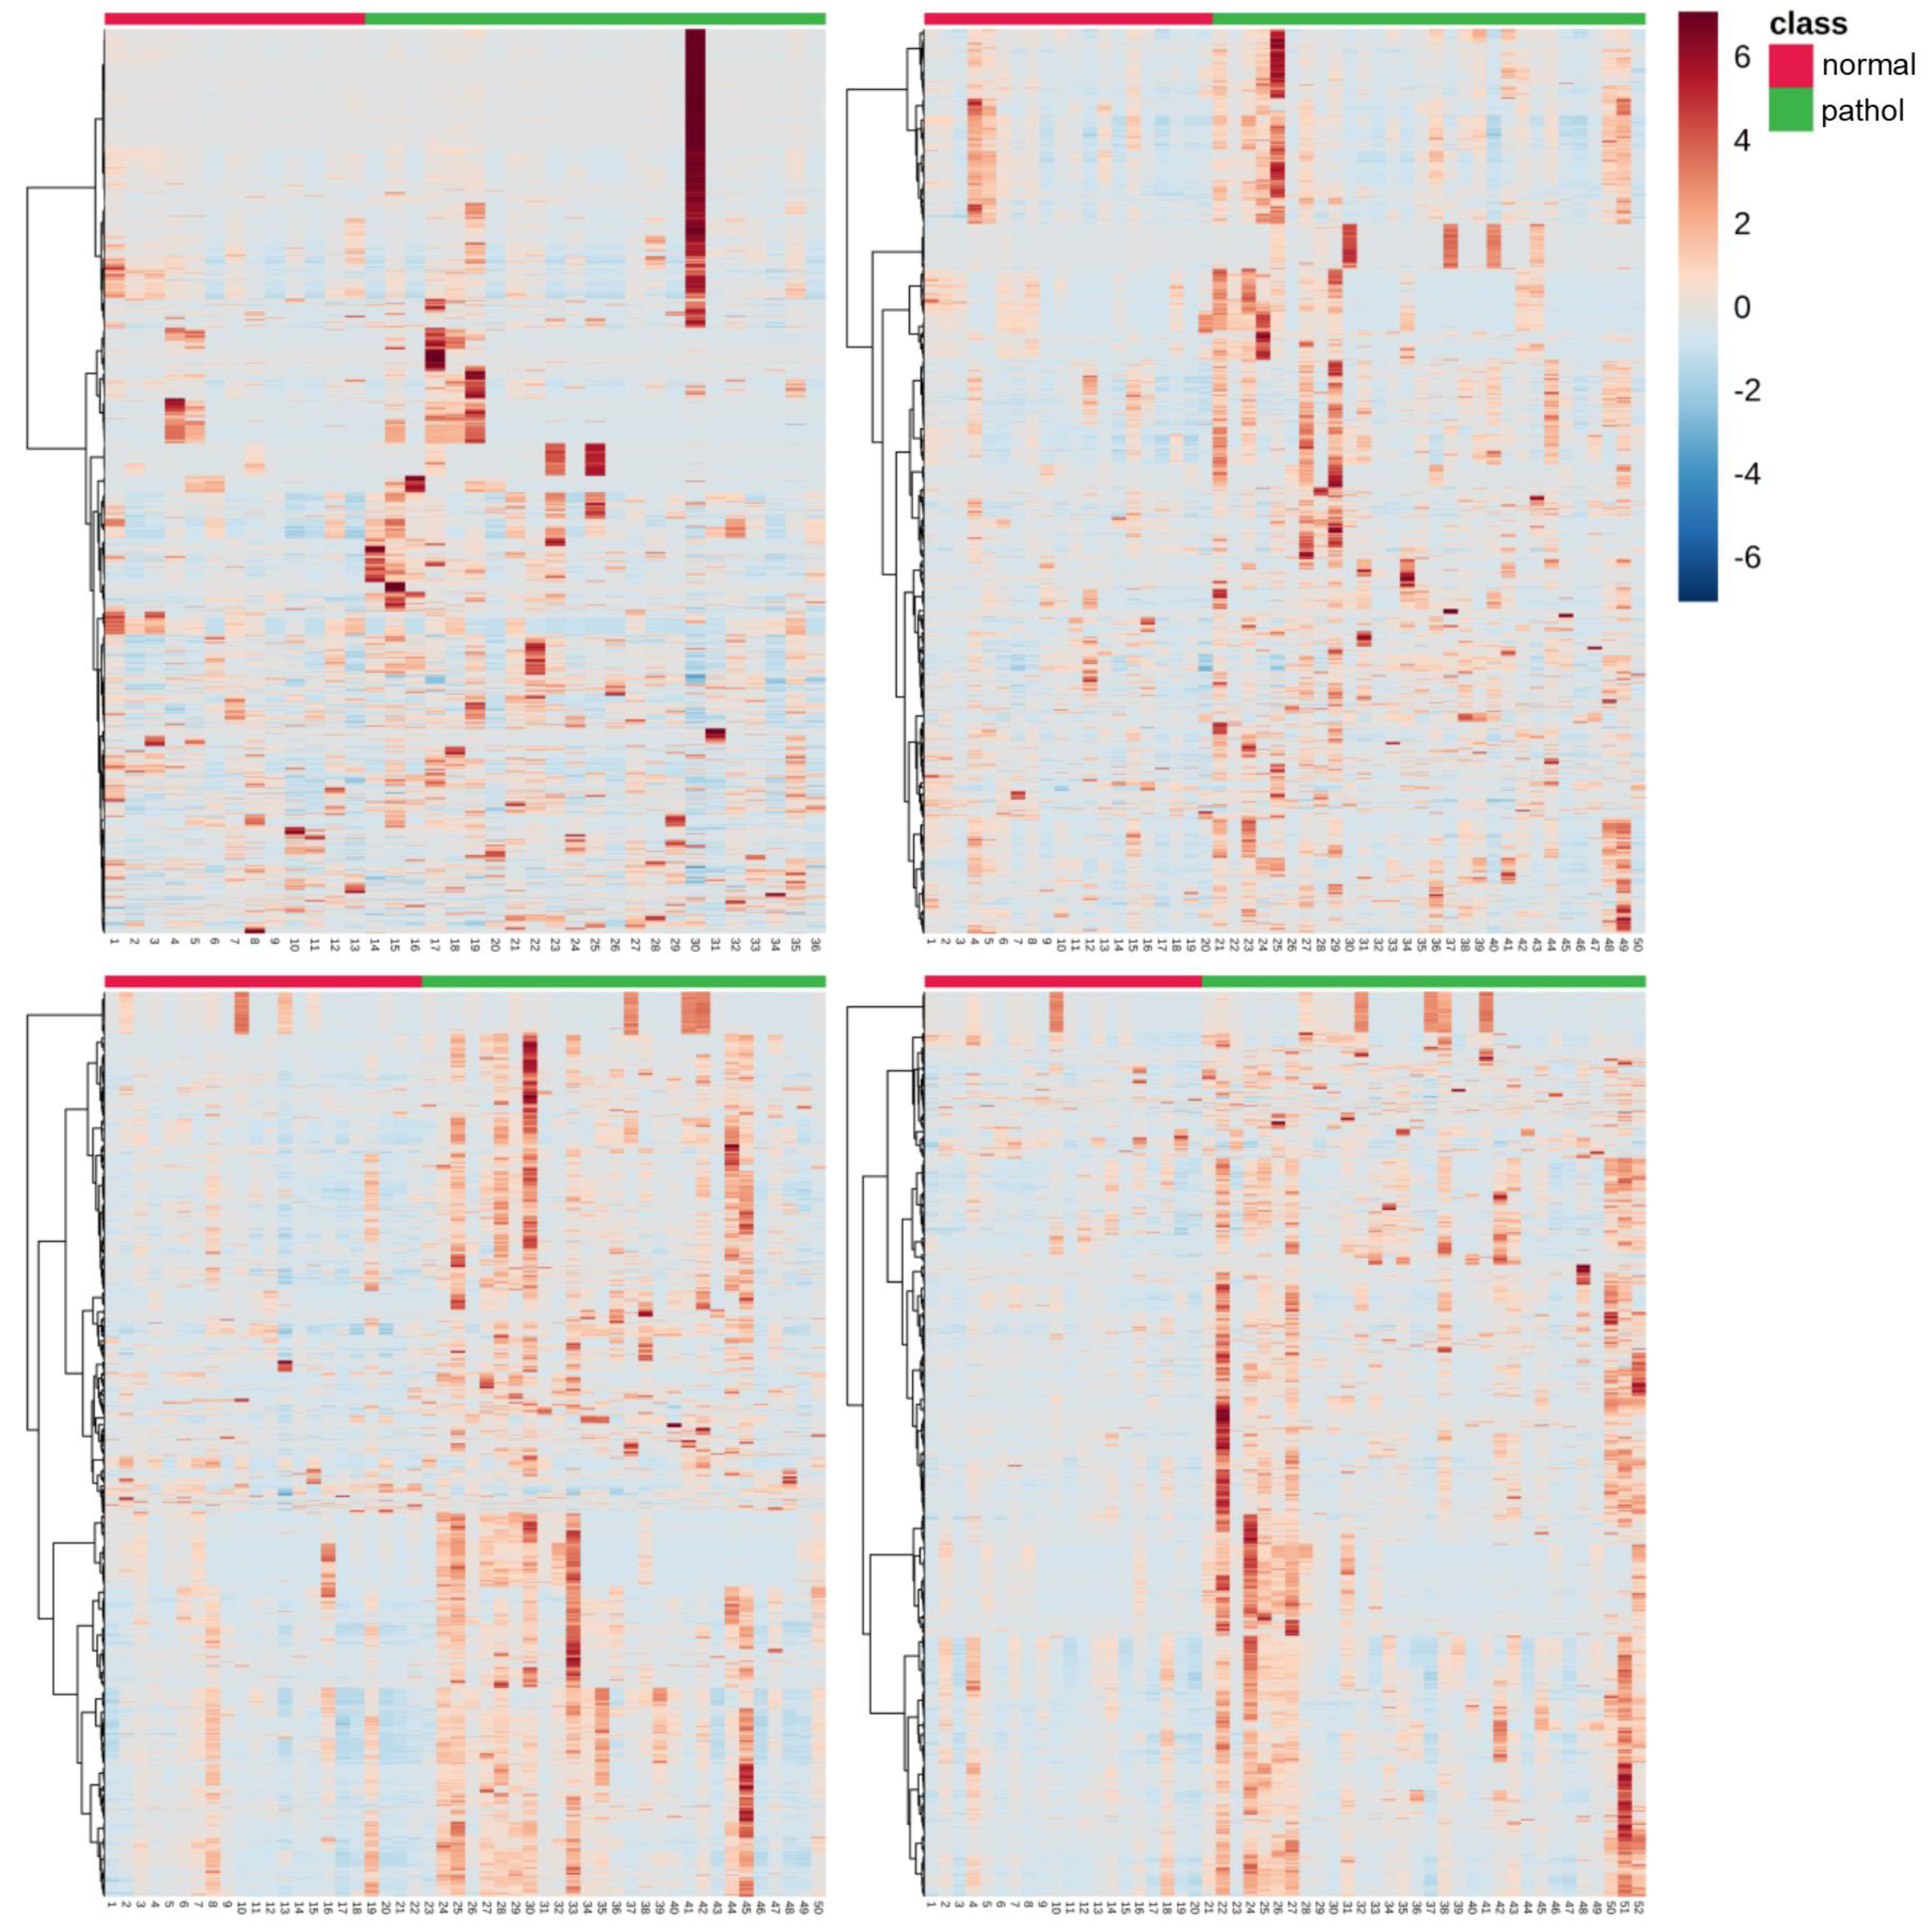
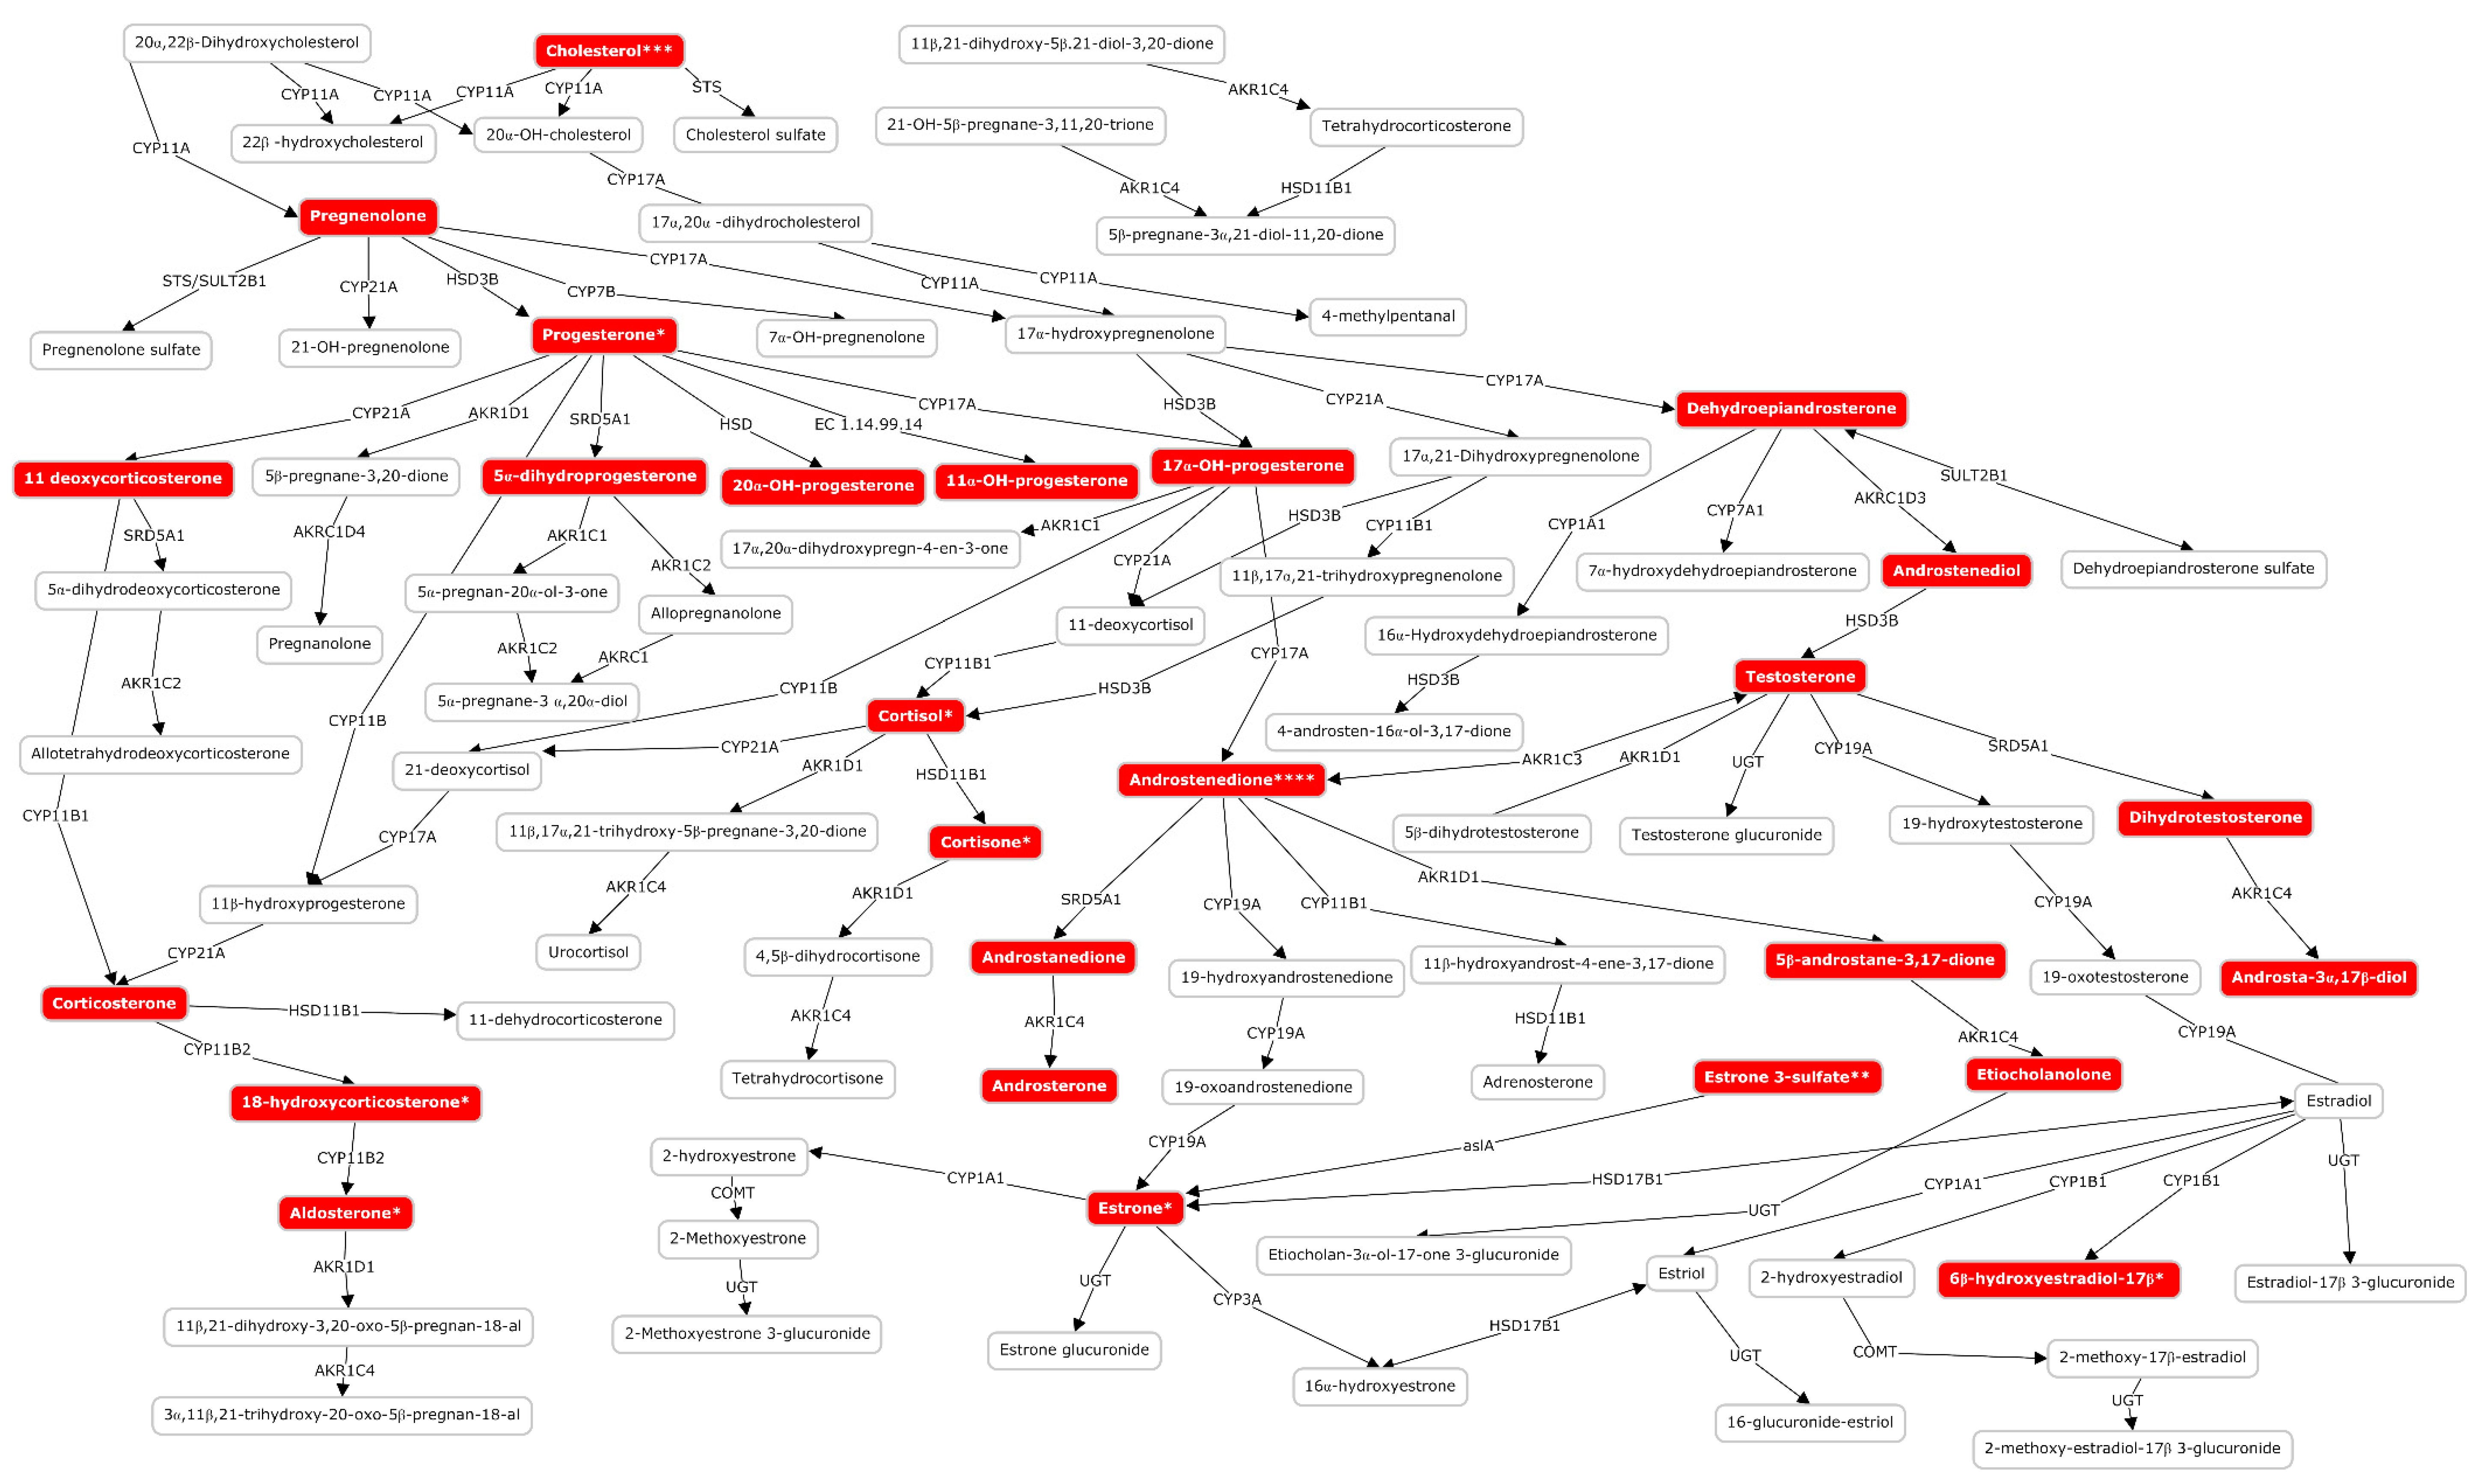
2.3. Untargeted Metabolomic Analysis
3. Discussion
4. Materials and Methods
4.1. Study Approval
4.2. Population
4.3. Magnetic Resonance Imaging
4.4. Blood Sampling, Processing and Storing
4.5. Analytical Methods
4.5.1. Determination of Lactate and Pyruvate
4.5.2. Untargeted Metabolomic Analysis
4.5.3. Statistics
Supplementary Materials
Author Contributions
Funding
Acknowledgments
Conflicts of Interest
Appendix A
References
- Kurinczuk, J.J.; Barralet, J.H.; Redshaw, M.; Brocklehurst, P. Report to the Patient Safety Research Programme (Policy Research Programme of the Department Of Health). 2005. Available online: https://www.npeu.ox.ac.uk/downloads/files/reports/coNsEnsus-Monitoring-NE-Report.pdf (accessed on 14 March 2020).
- Douglas-Escobar, M.; Weiss, M.D. Hypoxic-ischemic encephalopathy: A review for the clinician. JAMA Pediatr. 2015, 169, 397–403. [Google Scholar] [CrossRef] [PubMed]
- Lee, A.C.C.; Kozuki, N.; Blencowe, H.; Vos, T.; Bahalim, A.; Darmstadt, G.L.; Niermeyer, S.; Ellis, M.; Robertson, N.J.; Cousens, S.; et al. Intrapartum-related neonatal encephalopathy incidence and impairment at regional and global levels for 2010 with trends from 1990. Pediatr. Res. 2013, 74, 50–72. [Google Scholar] [CrossRef] [PubMed]
- Wassink, G.; Davidson, J.O.; Dhillon, S.K.; Zhou, K.; Bennet, L.; Thoresen, M.; Gunn, A.J. Therapeutic Hypothermia in Neonatal Hypoxic-Ischemic Encephalopathy. Curr. Neurol. Neurosci. Rep. 2019, 19, 2. [Google Scholar] [CrossRef] [PubMed] [Green Version]
- Sarnat, H.B.; Sarnat, M.S. Neonatal encephalopathy following fetal distress. A clinical and electroencephalographic study. Arch. Neurol. 1976, 33, 696–705. [Google Scholar] [CrossRef] [PubMed]
- Merchant, N.; Azzopardi, D. Early predictors of outcome in infants treated with hypothermia for hypoxic-ischaemic encephalopathy. Dev. Med. Child Neurol. 2015, 57, 8–16. [Google Scholar] [CrossRef] [Green Version]
- Groenendaal, F.; de Vries, L.S. Fifty years of brain imaging in neonatal encephalopathy following perinatal asphyxia. Pediatr. Res. 2017, 81, 150–155. [Google Scholar] [CrossRef] [Green Version]
- Shibasaki, J.; Aida, N.; Morisaki, N.; Tomiyasu, M.; Nishi, Y.; Toyoshima, K. Changes in Brain Metabolite Concentrations after Neonatal Hypoxic-ischemic Encephalopathy. Radiology 2018, 288, 840–848. [Google Scholar] [CrossRef] [Green Version]
- Lee, W.L.A.; Michael-Titus, A.T.; Shah, D.K. Hypoxic-Ischaemic Encephalopathy and the Blood-Brain Barrier in Neonates. Dev. Neurosci. 2017, 39, 49–58. [Google Scholar] [CrossRef]
- Bennet, L.; Booth, L.; Gunn, A.J. Potential biomarkers for hypoxic-ischemic encephalopathy. Semin. Fetal Neonatal Med. 2010, 15, 253–260. [Google Scholar] [CrossRef] [Green Version]
- Sánchez-Illana, Á.; Piñeiro-Ramos, J.D.; Kuligowski, J. Small molecule biomarkers for neonatal hypoxic ischemic encephalopathy. Semin. Fetal Neonatal Med. 2020, 101084. (In Press) [Google Scholar]
- Wu, T.-W.; Tamrazi, B.; Hsu, K.-H.; Ho, E.; Reitman, A.J.; Borzage, M.; Blüml, S.; Wisnowski, J.L. Cerebral Lactate Concentration in Neonatal Hypoxic-Ischemic Encephalopathy: In Relation to Time, Characteristic of Injury, and Serum Lactate Concentration. Front. Neurol. 2018, 9, 293. [Google Scholar] [CrossRef] [PubMed]
- Vannucci, R.C.; Brucklacher, R.M.; Vannucci, S.J. Glycolysis and Perinatal Hypoxic-Ischemic Brain Damage. Dev. Neurosci. 2005, 27, 185–190. [Google Scholar] [CrossRef] [PubMed]
- Efstathiou, N.; Theodoridis, G.; Sarafidis, K. Understanding neonatal hypoxic-ischemic encephalopathy with metabolomics. Hippokratia 2017, 21, 115–123. [Google Scholar] [PubMed]
- Reinke, S.N.; Walsh, B.H.; Boylan, G.B.; Sykes, B.D.; Kenny, L.C.; Murray, D.M.; Broadhurst, D.I. 1H NMR derived metabolomic profile of neonatal asphyxia in umbilical cord serum: Implications for hypoxic ischemic encephalopathy. J. Proteome Res. 2013, 12, 4230–4239. [Google Scholar] [CrossRef] [PubMed]
- Ahearne, C.E.; Denihan, N.M.; Walsh, B.H.; Reinke, S.N.; Kenny, L.C.; Boylan, G.B.; Broadhurst, D.I.; Murray, D.M. Early Cord Metabolite Index and Outcome in Perinatal Asphyxia and Hypoxic-Ischaemic Encephalopathy. Neonatology 2016, 110, 296–302. [Google Scholar] [CrossRef]
- Denihan, N.M.; Kirwan, J.A.; Walsh, B.H.; Dunn, W.B.; Broadhurst, D.I.; Boylan, G.B.; Murray, D.M. Untargeted metabolomic analysis and pathway discovery in perinatal asphyxia and hypoxic-ischaemic encephalopathy. J. Cereb. Blood Flow Metab. 2017, 37, 147–162. [Google Scholar] [CrossRef]
- Sarafidis, K.; Efstathiou, N.; Begou, O.; Soubasi, V.; Agakidou, E.; Gika, E.; Theodoridis, G.; Drossou, V. Urine metabolomic profile in neonates with hypoxic-ischemic encephalopa-thy. Hippokratia 2017, 21, 80–84. [Google Scholar]
- Yum, S.K.; Moon, C.-J.; Youn, Y.-A.; Sung, I.K. Changes in lactate dehydrogenase are associated with central gray matter lesions in newborns with hypoxic-ischemic encephalopathy. J. Matern. Fetal Neonatal Med. 2017, 30, 1177–1181. [Google Scholar] [CrossRef]
- Sánchez-Illana, Á.; Núñez-Ramiro, A.; Cernada, M.; Parra-Llorca, A.; Valverde, E.; Blanco, D.; Moral-Pumarega, M.T.; Cabañas, F.; Boix, H.; Pavon, A.; et al. Evolution of Energy Related Metabolites in Plasma from Newborns with Hypoxic-Ischemic Encephalopathy during Hypothermia Treatment. Sci. Rep. 2017, 7, 17039. [Google Scholar] [CrossRef]
- Chiang, M.-C.; Lien, R.; Chu, S.-M.; Yang, P.-H.; Lin, J.-J.; Hsu, J.-F.; Fu, R.-H.; Lin, K.-L. Serum Lactate, Brain Magnetic Resonance Imaging and Outcome of Neonatal Hypoxic Ischemic Encephalopathy after Therapeutic Hypothermia. Pediatr. Neonatol. 2016, 57, 35–40. [Google Scholar] [CrossRef] [Green Version]
- Shah, S.; Tracy, M.; Smyth, J. Postnatal lactate as an early predictor of short-term outcome after intrapartum asphyxia. J. Perinatol. 2004, 24, 16–20. [Google Scholar] [CrossRef] [PubMed] [Green Version]
- Murray, D.M.; Boylan, G.B.; Fitzgerald, A.P.; Ryan, C.A.; Murphy, B.P.; Connolly, S. Persistent lactic acidosis in neonatal hypoxic-ischaemic encephalopathy correlates with EEG grade and electrographic seizure burden. Arch. Dis. Child. Fetal Neonatal Ed. 2008, 93, F183–F186. [Google Scholar] [CrossRef] [PubMed]
- Beckstrom, A.C.; Tanya, P.; Humston, E.M.; Snyder, L.R.; Synovec, R.E.; Juul, S.E. The perinatal transition of the circulating metabolome in a nonhuman primate. Pediatr. Res. 2012, 71, 338–344. [Google Scholar] [CrossRef] [PubMed] [Green Version]
- Kuligowski, J.; Solberg, R.; Sánchez-Illana, Á.; Pankratov, L.; Parra-Llorca, A.; Quintás, G.; Saugstad, O.D.; Vento, M. Plasma metabolite score correlates with Hypoxia time in a newly born piglet model for asphyxia. Redox Biol. 2017, 12, 1–7. [Google Scholar] [CrossRef]
- Anandi, V.S.; Shaila, B. Evaluation of factors associated with elevated newborn 17-hydroxyprogesterone levels. J. Pediatr. Endocrinol. Metab. 2017, 30, 677–681. [Google Scholar] [CrossRef] [PubMed]
- Concepcion, K.R.; Zhang, L. Corticosteroids and perinatal hypoxic-ischemic brain injury. Drug Discov. Today 2018, 23, 1718–1732. [Google Scholar] [CrossRef]
- Dong, S.; Zhang, Q.; Kong, D.; Zhou, C.; Zhou, J.; Han, J.; Zhou, Y.; Jin, G.; Hua, X.; Wang, J.; et al. Gender difference in the effect of progesterone on neonatal hypoxic/ischemic brain injury in mouse. Exp. Neurol. 2018, 306, 190–198. [Google Scholar] [CrossRef]
- Walsh, B.H.; Broadhurst, D.I.; Mandal, R.; Wishart, D.S.; Boylan, G.B.; Kenny, L.C.; Murray, D.M. The Metabolomic Profile of Umbilical Cord Blood in Neonatal Hypoxic Ischaemic Encephalopathy. PLoS ONE 2012, 7, e50520. [Google Scholar] [CrossRef] [Green Version]
- Kariholu, U.; Montaldo, P.; Markati, T.; Lally, P.J.; Pryce, R.; Teiserskas, J.; Liow, N.; Oliveira, V.; Soe, A.; Shankaran, S.; et al. Therapeutic hypothermia for mild neonatal encephalopathy: A systematic review and meta-analysis. Arch. Dis. Child. Fetal Neonatal Ed. 2020, 105, 225–228. [Google Scholar] [CrossRef]
- Nuñez-Ramiro, A.; Benavente-Fernández, I.; Valverde, E.; Cordeiro, M.; Blanco, D.; Boix, H.; Cabañas, F.; Chaffanel, M.; Fernández-Colomer, B.; Fernández-Lorenzo, J.R.; et al. Topiramate plus Cooling for Hypoxic-Ischemic Encephalopathy: A Randomized, Controlled, Multicenter, Double-Blinded Trial. Neonatology 2019, 116, 76–84. [Google Scholar] [CrossRef]
- Barkovich, A.J.; Hajnal, B.L.; Vigneron, D.; Sola, A.; Partridge, J.C.; Allen, F.; Ferriero, D.M. Prediction of neuromotor outcome in perinatal asphyxia: Evaluation of MR scoring systems. AJNR Am. J. Neuroradiol. 1998, 19, 143–149. [Google Scholar] [PubMed]
- Rutherford, M.; Ramenghi, L.A.; Edwards, A.D.; Brocklehurst, P.; Halliday, H.; Levene, M.; Strohm, B.; Thoresen, M.; Whitelaw, A.; Azzopardi, D. Assessment of brain tissue injury after moderate hypothermia in neonates with hypoxic-ischaemic encephalopathy: A nested substudy of a randomised controlled trial. Lancet Neurol. 2010, 9, 39–45. [Google Scholar] [CrossRef] [Green Version]
- Broadhurst, D.; Goodacre, R.; Reinke, S.N.; Kuligowski, J.; Wilson, I.D.; Lewis, M.R.; Dunn, W.B. Guidelines and considerations for the use of system suitability and quality control samples in mass spectrometry assays applied in untargeted clinical metabolomic studies. Metabolomics 2018, 14, 72. [Google Scholar] [CrossRef] [PubMed] [Green Version]
- ProteoWizard. Available online: http://proteowizard.sourceforge.net (accessed on 14 March 2020).
- MetaboLights. Available online: https://www.ebi.ac.uk/metabolights/MTBLS1041 (accessed on 14 March 2020).
- LC-MS and GC-MS Data Analysis. Available online: https://bioconductor.org/packages/release/bioc/html/xcms.html (accessed on 14 March 2020).
- Kuhl, C.; Tautenhahn, R.; Böttcher, C.; Larson, T.R.; Neumann, S. CAMERA: An Integrated Strategy for Compound Spectra Extraction and Annotation of Liquid Chromatography/Mass Spectrometry Data Sets. Anal. Chem. 2012, 84, 283–289. [Google Scholar] [CrossRef] [PubMed] [Green Version]
- Kuligowski, J.; Sánchez-Illana, Á.; Sanjuán-Herráez, D.; Vento, M.; Quintás, G. Intra-batch effect correction in liquid chromatography-mass spectrometry using quality control samples and support vector regression (QC-SVRC). Analyst 2015, 140, 7810–7817. [Google Scholar] [CrossRef] [PubMed]
- Chang, C.-C.; Lin, C.-J. LIBSVM: A Library for Support Vector Machines. ACM Trans. Intell. Syst. Technol. 2011, 2, 1–27. [Google Scholar] [CrossRef]
- HMDB Version 4.0. Available online: http://www.hmdb.ca (accessed on 14 March 2020).
- Chong, J.; Soufan, O.; Li, C.; Caraus, I.; Li, S.; Bourque, G.; Wishart, D.S.; Xia, J. MetaboAnalyst 4.0: Towards more transparent and integrative metabolomics analysis. Nucleic Acids Res. 2018, 46, W486–W494. [Google Scholar] [CrossRef] [Green Version]
- Sumner, L.W.; Amberg, A.; Barrett, D.; Beale, M.H.; Beger, R.; Daykin, C.A.; Fan, T.W.-M.; Fiehn, O.; Goodacre, R.; Griffin, J.L.; et al. Proposed minimum reporting standards for chemical analysis Chemical Analysis Working Group (CAWG) Metabolomics Standards Initiative (MSI). Metabolomics 2007, 3, 211–221. [Google Scholar] [CrossRef] [Green Version]


| Parameter | Normal (N = 22) | Pathologic (N = 33) | p-Value |
|---|---|---|---|
| Inborn | 3 (14%) | 8 (24%) | 0.5 |
| Maternal age (years) | 34 (5) | 33 (6) | 0.4 |
| Gestational age (weeks) | 38.4 (37.3, 40.6) | 39.0 (38.0, 40.6) | 0.3 |
| Gender (male, %) | 13 (59%) | 14 (42%) | 0.3 |
| Birth weight (g) | 3265 (552) | 3295 (697) | 0.4 |
| Length (cm) | 51 (3) | 51 (3) | 0.4 |
| Head circumference (cm) | 34 (2) | 34 (2) | 0.3 |
| Delivery mode (C-section) | 9 (41%) | 21 (64%) | 0.2 |
| Apgar score 1 min | 2 (1, 4) | 1 (1, 3) | 0.6 |
| Apgar score 5 min | 4 (2, 5) | 3 (1, 5) | 0.3 |
| Apgar score 10 min | 5 (4, 6) | 5 (4, 6) | 1.0 |
| Sarnat 2/Sarnat 3 | 19/3 | 19/14 | 0.05 |
| pH UC | 7.06 (0.27) | 6.97 (0.17) | 0.09 |
| BE UC | −13 (10) | −16 (7) | 0.2 |
| pCO2 (mmHg) UC | 71 (33) | 59 (33) | 0.2 |
| HCO3 UC | 15 (6) | 13 (6) | 0.2 |
| Topiramate treatment (yes, %) | 10 (45%) | 17 (52%) | 0.7 |
| MR (days) | 7 (5, 10) | 7 (7, 10) | 0.4 |
| Pathway | Total # of Metabolites | Hits (Total) | T0 | T24 | T48 | T72 | ||||
|---|---|---|---|---|---|---|---|---|---|---|
| Hits (Sig) | Fisher’s p-Value | Hits (Sig) | Fisher’s p-Value | Hits (Sig) | Fisher’s p-Value | Hits (Sig) | Fisher’s p-Value | |||
| Alanine, aspartate, and glutamate metabolism | 24 | 19 | 6 | 0.14 | 5 | 0.9 | 13 | 0.4 | 16 | 0.04 |
| Arginine and proline metabolism | 77 | 50 | 10 | 0.5 | 21 | 0.4 | 41 | 0.002 | 41 | 0.003 |
| Caffeine metabolism | 21 | 2 | 2 | 0.04 | 2 | 0.2 | 2 | 0.4 | 2 | 0.4 |
| D-Glutamine and D-glutamate metabolism | 11 | 7 | 1 | 0.8 | 3 | 0.6 | 7 | 0.03 | 7 | 0.04 |
| Limonene and pinene degradation | 59 | 7 | 2 | 0.4 | 1 | 1.0 | 4 | 0.7 | 7 | 0.04 |
| Lysine biosynthesis | 32 | 20 | 3 | 0.8 | 11 | 0.10 | 17 | 0.02 | 19 | 0.0013 |
| Lysine degradation | 47 | 32 | 7 | 0.4 | 17 | 0.07 | 21 | 0.4 | 28 | 0.002 |
| Nitrogen metabolism | 39 | 16 | 4 | 0.4 | 7 | 0.4 | 11 | 0.4 | 14 | 0.03 |
| Phenylalanine metabolism | 45 | 25 | 5 | 0.5 | 15 | 0.02 | 24 | 0.00009 | 21 | 0.02 |
| Seleno amino acid metabolism | 22 | 2 | 2 | 0.04 | 1 | 0.6 | 2 | 0.4 | 2 | 0.4 |
| Steroid hormone biosynthesis | 99 | 29 | 11 | 0.01 | 23 | 0.000009 | 25 | 0.004 | 25 | 0.006 |
© 2020 by the authors. Licensee MDPI, Basel, Switzerland. This article is an open access article distributed under the terms and conditions of the Creative Commons Attribution (CC BY) license (http://creativecommons.org/licenses/by/4.0/).
Share and Cite
Piñeiro-Ramos, J.D.; Núñez-Ramiro, A.; Llorens-Salvador, R.; Parra-Llorca, A.; Sánchez-Illana, Á.; Quintás, G.; Boronat-González, N.; Martínez-Rodilla, J.; Kuligowski, J.; Vento, M.; et al. Metabolic Phenotypes of Hypoxic-Ischemic Encephalopathy with Normal vs. Pathologic Magnetic Resonance Imaging Outcomes. Metabolites 2020, 10, 109. https://doi.org/10.3390/metabo10030109
Piñeiro-Ramos JD, Núñez-Ramiro A, Llorens-Salvador R, Parra-Llorca A, Sánchez-Illana Á, Quintás G, Boronat-González N, Martínez-Rodilla J, Kuligowski J, Vento M, et al. Metabolic Phenotypes of Hypoxic-Ischemic Encephalopathy with Normal vs. Pathologic Magnetic Resonance Imaging Outcomes. Metabolites. 2020; 10(3):109. https://doi.org/10.3390/metabo10030109
Chicago/Turabian StylePiñeiro-Ramos, José David, Antonio Núñez-Ramiro, Roberto Llorens-Salvador, Anna Parra-Llorca, Ángel Sánchez-Illana, Guillermo Quintás, Nuria Boronat-González, Juan Martínez-Rodilla, Julia Kuligowski, Máximo Vento, and et al. 2020. "Metabolic Phenotypes of Hypoxic-Ischemic Encephalopathy with Normal vs. Pathologic Magnetic Resonance Imaging Outcomes" Metabolites 10, no. 3: 109. https://doi.org/10.3390/metabo10030109