
Abstract
As space-based Earth observations are delivering a growing amount and variety of data, the potential of this information to better support disaster risk management is coming into increased scrutiny. Disaster risk management actions are commonly divided into the different steps of the disaster management cycle, which include: prevention, to minimize future losses; preparedness and crisis management, often focused on saving lives; and post-crisis management aiming at re-establishing services supporting human activities. Based on a literature review and examples of studies in the area of coastal, hydro-meteorological and geohazards, this review examines how space-based Earth observations have addressed the needs for information in the area of disaster risk management so far. We show that efforts have essentially focused on hazard assessments or supporting crisis management, whereas a number of needs still remain partly fulfilled for vulnerability and exposure mapping, as well as adaptation planning. A promising way forward to maximize the impact of Earth observations includes multi-risk approaches, which mutualize the collection of time-evolving vulnerability and exposure data across different hazards. Opportunities exist as programmes such as the Copernicus Sentinels are now delivering Earth observations of an unprecedented quality, quantity and repetitiveness, as well as initiatives from the disaster risk science communities such as the development of observatories. We argue that, as a complement to this, more systematic efforts to (1) build capacity and (2) evaluate where space-based Earth observations can support disaster risk management would be useful to maximize its societal benefits.
1 Introduction
As early as the 1960s, data from the TIROS-1 satellite delivered meteorological forecasts for the first time. This major breakthrough in Earth Observation opened a new era for disaster risk management, whereby meteorological hazards can be better monitored, understood and ultimately anticipated (Manna 1985). The remarkable integration of space-based observations in the computations of meteorologists raises an obvious question: to what extent can this success be replicated for other coastal, hydro-meteorological and geohazards? Several initiatives and programmes have addressed this issue for a number of hazards such as soil and coastal erosion, coastal, groundwater and inland flooding, subsidence (Lopez et al. this issue; Melet et al. this issue), landslides (Lissak et al. this issue), earthquakes and volcanic eruptions (Elliot et al. this issue), tsunamis (Hébert et al. this issue) or wildfires (Pettinari et al. this issue). These include the IGOS (Integrated Global Observing Strategy) established in 1998, the Group on Earth Observations (GEO) and its Geohazard Supersites and Natural Laboratories (GSNL) since 2003, the European “Copernicus” programme (formerly known as GMES, Global Monitoring for Environment and Security) and its Sentinel missions that have been deployed since 2014, the Japanese supported “Sentinel-Asia”, or the “Natural Laboratories” in the USA (Aschbacher et al. 2014; Aschbacher and Milagro-Perez 2012; Kaku 2019; Koike et al. 2010; Plag et al. 2010; Salichon et al. 2007). The common vision of these various initiatives and projects involves constellations of satellites for monitoring key observable determinants of risks, informing users through a global data and modelling infrastructure, and ultimately benefiting population at risks from disasters. While there is evidence that satellite-based remote sensing applications are indeed increasingly used for disaster risk management (Tralli et al. 2005), the simple fact that these projects and initiatives have existed for decades demonstrates that making this vision real remains a major challenge (Denis et al. 2016). Hence, the following question remains timely: how can space-based Earth observations best support disaster risks management?
The terminology of disaster risk management is complex, not only due to the numerous different hazards to be considered, but also because disaster risk management is a cross-cutting issue that intersects several different policies, which all have their own languages. These policies include economic development, land-use planning, building codes and regulation as well as climate change adaptation (see Romieu et al. (2010) for a discussion of coastal risk prevention and adaptation). Here we rely on the terminology of the United Nation Office for Disaster Risks Reduction (UNDRR, https://www.undrr.org/publication/2009-unisdr-terminology-disaster-risk-reduction), which defines disaster risk management as “the organization, planning and application of measures preparing for, responding to and recovering from disasters”. Note that the International Panel on Climate Change uses a rather similar definition (IPCC 2018), whereby disaster risk management is the process “for designing, implementing, and evaluating strategies, policies, and measures to improve the understanding of disaster risk, foster disaster risk reduction and transfer, and promote continuous improvement in disaster preparedness, response, and recovery practices (…)”. The latter definition gives more emphasis on the governance and institutional dimensions of disaster risk management, institutions being understood in their broad sense here of “habitualized behavior” and rules and norms that govern society” (Adger 2000). In both cases, disaster risk management refers to all actions and decisions that aim at minimizing losses from disasters.
Earth observations refer to the “gathering of information about planet Earth’s physical, chemical and biological systems” (Group on Earth Observations; https://www.earthobservations.org/index.php). Therefore, it is not limited to satellite remote sensing but also includes all in situ and aerial monitoring instruments and networks such as GNSS or seismometer networks, unmanned aerial vehicles or field observations (Antoine et al. this issue; Balsamo et al. 2018; Salichon et al. 2007). We focus here on space-based observations because space agencies have played a prominent role in organizing the community of Earth observations over the last decades (Bally 2012; Desnos et al. 2014, 2016). Furthermore, space observations are explicitly recognized as important contributions in the disaster risk reductions strategies of both the Hyogo and Sendai frameworks for the United Nations ( 2005, 2015). For example, the Sendai Framework includes priorities for actions such as “understanding disaster risks”, “investing in disaster reduction for resilience” and “enhancing disaster preparedness”, which all can be supported by improved Earth observations. However, in many cases, neither space-based nor in situ and aerial observations are directly supporting disaster risk management: instead, they are realizing an intermediate layer of analysis, which in turn informs users regarding risk (Salichon et al. 2007). For example, in the area of Earthquake risks, field and satellite observations are first included within a risk model, whose results are transferred to those informing disaster risk management (Sedan et al. 2013). Hence, users of Earth Observations are usually not directly those in charge of disaster risk management, but rather they are service providers. The existence of these multiple layers may explain why the full potential of Earth Observations has not been exploited yet.
Previous reports and papers have extensively discussed the technical and scientific challenges required to maximize the benefits from space-based observations in the area of disaster risk management (Bello and Aina 2014; Guo 2010; Joyce et al. 2009). Here, we evaluate to what extent space-based Earth observations being delivered actually meet the decision frameworks of disaster risk management (Plag et al. 2010; Taubenbock et al. 2008). Our starting point differs from the common approach towards users of Earth observation as we do not start from formalized requirements of users, but from decisions and workflows within disaster risk management. Some users have already expressed their requirements to the Earth Observation sector (Smolka and Siebert 2013). However, adopting an approach centred on decisions and workflows may help maximize the benefits of Earth Observation. The perspective taken in this paper is not new and has been investigated both at the theoretical and practical levels in a number of research domains (Hinkel et al. 2019; Steen et al. 2007). However, despite the recommendations of the IGOS Geohazards initiative (Plag et al. 2010), this perspective remains not well established in the area of space-based Earth observations for disaster risk management, as previous papers that adopted this perspective have focused only on specific hazards, such as tropical cyclones (Hoque et al. 2017).
This paper fills this gap by first presenting the disaster risk management cycle, which holds as the reference framework for classifying disaster risk management actions (Sect. 2), then by assessing how space-based Earth Observation fits within disaster risk management workflows as in prevention in Sect. 3 and preparedness, crisis management and post-disaster response in Sect. 4. Finally, in Sect. 5, we review the current ways forward and challenges. The overall outline of this paper is summarized in Fig. 1, which highlights how different layers within the end-to-end chain of observation providers and users interact, and where this is reviewed in the present paper.

Space-based observation needs and challenges according to the different user decision frameworks and objectives relevant to disaster risk management
2 Users Decision Frameworks and Objectives
2.1 The Disaster Risk Management Cycle
Disaster risk management includes a wide range of actions, whose primary aim is to reduce the impacts of disasters. These actions are commonly divided according to the following steps of the disaster management cycle (Fig. 2):

Disaster management cycle
-
(1)
prevention, which includes all actions aiming at minimizing future losses;
-
(2)
preparedness, which aims at being prepared to a threat and managing disasters (Denis et al. 2016; Klomp 2016; Voigt et al. 2007);
-
(3)
crisis and post-crisis management, aiming at saving lives, minimizing impacts, and finally re-establishing services supporting human activities (Myint et al. 2008; Wang and Xie 2018).
2.2 Decision Levels Relevant to Disaster Risk Management
Disaster risk management stakeholders such as governments, municipalities, industries, large businesses, disaster management organizations, civil protection can act at different levels ranging from operational management to strategic planning. Therefore, there is a wide diversity of actions relevant to each component of the disaster risk management cycle. This can therefore be illustrated for actions belonging to prevention, which include, for example:
-
regional to local authorities defining land-use policies in a way that minimizes exposure to hazards;
-
regional to local authorities defining and enforcing specific mitigation measures, such as reducing the vulnerability of buildings for flooding or earthquakes by means of structural interventions;
-
states and transnational organizations establishing regulations defining the principles and rules for operational disaster risk prevention;
-
states, ministries and adaptation funds ranking the severity of hazards and risks among countries or regions, in order to optimize investments and allocate resources for prevention;
-
the private or public reinsurance industry assessing the vulnerability of finance mechanisms covering post-disaster costs (Smolka and Siebert 2013);
-
international to national organizations (e.g., Delta Commission in the Netherlands after the 1953 flood, or the United Nation Office for Disaster Risk Reduction) strengthening the governance of risks, as recommended by the Sendai Framework for disaster risk reduction.
All the actions listed above belong to prevention and can therefore be placed in the disaster risk management cycle. Whatever the level considered, the disaster risk management cycle remains a common reference for classifying actions aiming at reducing the impacts of disasters.
2.3 Criticism to the Disaster Risk Management Cycle
The disaster risk management cycle framework has been criticized for being a too simplistic classification of disaster risk management actions, which ignores synergies among, e.g., post-crisis and prevention actions (Lavell et al. 2012). As a response to this criticism, recent improvements have recognized that risks evolve as the environment, human pressures and climate change over time. The resulting frameworks build upon the disaster risk management cycle by putting more emphasis on the process of reviewing and updating risk management actions (Jones et al. 2014; Stammer et al. 2019). Such new frameworks are recognized especially useful to address the specific problem of climate change, which involves a constant evolution of hazards, such as the more frequent and intense heatwaves, drought and storm surges (Alexander et al. 2006; Cazenave and Le Cozannet 2014; Meehl and Tebaldi 2004; Russo et al. 2013, 2014; Vousdoukas et al. 2018). As shown in Fig. 3, the resulting “disaster risk continuum” schemes can be considered complementary to the disaster risk management cycle, as it provides a framework to constantly improve disaster risk management.

Far from being limited to climate change adaptation, such evolving frameworks are useful as well for all risks that change over time. For example, even for earthquakes, changes in exposure, ground deformation pattern, the retrofitting of the structures and the slight damage after an event modify the behaviour and vulnerability of the built environment. Hence, frameworks such as those presented in Fig. 3 are potentially useful well beyond the sole issue of climate change and can be generalized to all types of risks that evolve due to urbanisation, ageing of building and infrastructure, changing human interventions, which collectively can be grouped together within the concept of “global change”.
2.4 Relevance to the Earth-Observation Sector
The previous subsection shows that the disaster risk management cycle is not the unique framework to classify decisions and actions pertaining to risk management. However, despite the known limitations discussed above, the disaster risk management cycle remains a common reference for many stakeholders concerned with disaster risk management. For the Space-based Earth Observation sector, the value of the disaster risk management framework is to identify where satellite data can be useful within the existing workflows of users. Figure 1 lists the main objectives of users during each phase of the disaster risk management cycle, and links user’s potential actions and decisions with the related services and observation needs. These actions and decisions can be grouped in two categories (Fig. 1):
-
Actions and decisions relevant to the prevention of disaster risks (Sect. 3): here, the main objective of users such as disaster risk prevention agencies is to minimize the impacts of future disasters, both in terms of human lives and costs. This overarching objective can be met in three ways: by reducing the hazard, where possible (Sect. 3.1), the vulnerability of exposed assets (Sect. 3.2) or the exposure itself (Sect. 3.3). To illustrate this concept, the risks induced by landslides can be reduced by various measures such as revegetating the slopes (reducing the hazard), reinforcing the infrastructure such as roads or building exposed to landslides (reducing vulnerability) or relocating exposed building (reducing exposure).
-
Actions and decisions relevant to preparedness, response and recovery of disaster risks (Sect. 4): here, the main objective of users such as civil protection agencies is to prepare for managing the crisis, which requires pre-disaster information (Sect. 3), to forecast disasters to deliver appropriate alerts (Sect. 4.1), to save lives and provide immediate assistance (Sect. 4.2), minimize the impacts and to progressively restore activities and services during and after the crisis, which requires damage mapping (Sect. 4.3) and pre-disaster information (Sect. 3). For example, these users will test their procedures against pre-defined disaster risk scenarios before crisis, which requires pre-disaster knowledge on the hazard, exposure and vulnerability. During the crisis, other information such as displacement and disaster damage maps is required. This illustrates that workflows within disaster risk management involve different procedures, constraints and needs depending on the positioning of each stakeholder with respect to the disaster management cycle. Specifically, the time constraint is critical during the preparedness, response and recovery phases, whereas prevention is less constrained by time but often more constrained by the limited amount of resources (Salichon et al. 2007).
The remainder of this paper explores further how Earth observations can support the prevention of disaster risks (Sect. 3), preparedness, response and recovery (Sect. 4) and ways forward to improve the current practices (Sect. 5).
3 Earth Observation in Support to Prevention of Disaster Risks
Stakeholders concerned with prevention primarily aim at minimizing future damage, whether affecting human lives, economic activities or environmental assets. Achieving this aim implies reducing one or several determinants of the risk, that is, the hazard itself, exposure to these hazards, or the vulnerability of the exposed assets.
3.1 Reducing the Hazard
The hazard is commonly defined as a threat with potentially adverse consequences for humans, the economy or the environment. Quantitatively, the hazard is the combination of the probability of occurrence and the intensity of an adverse phenomenon in a given location (UNDRR terminology; https://www.undrr.org/publication/2009-unisdr-terminology-disaster-risk-reduction). Prevention actions focused on the hazard include removing the hazards (for example by levelling landslide-prone slopes), mitigating the hazard (for example by restoring vegetation on dunes or unstable slopes) or changing the hazard (for example by building dikes and limiting flooding overflow), which sometimes leads to creating new hazards such as breaching of dikes (Ludy and Kondolf 2012). Reducing the hazard is not always possible: for example, earthquake or pyroclastic flow hazards generally cannot be reduced.
Removing, mitigating or changing the hazard typically requires hazard maps. Hazard maps may either consider a single hazard (e.g., river flooding), or combine multiple hazards (e.g., river flooding and landslides) (Gill and Malamud 2016). For example, volcanic hazard maps typically superimpose or combine multiple hazards such as lava and pyroclastic flows, ash falls, lahars, earthquakes, landslides (Felpeto et al. 2007; Neri et al. 2013; Thierry et al. 2008). Despite decades of research in quantitative hazard assessment and the related physical processes, a lack of full understanding of the hazards remains a critical knowledge gap today. Even for earthquakes where the knowledge of vulnerability is key for assessing potential damage, unknowns in the seismic activity (e.g., magnitude, occurrence, focal depth) can still remain the most important source of uncertainty in quantitative risk assessment (Rohmer et al. 2014). This raises the need for more hazard observations, whether in situ or space-based.
Space-based observations relevant for hazard assessment include observations of past events, of physical processes associated to the hazard, or of characteristics of the location of interest (i.e., settings). Observations of past events can directly or indirectly inform about the frequency or intensity of a hazard. For example, direct observations of subsidence caused by mining activities or groundwater pumping can be used to better estimate where, when and how much vertical ground motions may affect the urban or peri-urban environment (Foumelis et al. 2016; Raucoules et al. 2003, 2013). Indirect observations are extremely common as well, for example assessing drought intensity through observations of their impacts on vegetation (Kogan 1997). Space observations can also be used for monitoring physical processes associated to the hazard, such as thermal activity associated with volcanic eruptions (Vaughan et al. 2008) accumulation of strain along faults that may rupture and generate earthquakes (Barbot et al. 2013; de Michele et al. 2011; Hussain et al. 2016; Parcharidis et al. 2009), or rainfall causing flood hazard (Tote et al. 2015). Finally, typical characteristics of the location of interest that can be derived from Earth Observations include high-resolution digital surface models, which can be used for example to estimate the potential intensity and frequency of flooding, lahar or pyroclastic flows in volcanic areas (Kervyn et al. 2008; Neri et al. 2013). In the latter case, space-based Earth Observations do not appear prominently in the final product delivered to users, because they are integrated within physical models or geographic information system. However, the quality of these observations (e.g., resolution, precision and accuracy) remains essential for producing trustworthy information on the hazard processes.
For adaptation planning, characterizing changes of the hazards over multi-decadal timescales can be relevant (see Sect. 2.3), as exemplified for long-term sea-level rise aggravating coastal erosion and flooding (Melet et al. this issue). While precise needs for information have not completely yet been formalized, some scientists have proposed to focus on the detection of early signals of acceleration of changes in order to plan adaptation in a timely way (Haasnoot et al. 2018; Stephens et al. 2018).
3.2 Reducing the Vulnerability
The concept of vulnerability has been defined in many different ways by multiple scientific communities (Birkmann et al. 2013; Brooks et al. 2005; Kienberger et al. 2013; Romieu et al. 2010). In a disaster risk management context, vulnerability is defined as the physical, social and economic conditions that influence the susceptibility of humans or assets to the impacts of hazards (see https://www.undrr.org/publication/2009-unisdr-terminology-disaster-risk-reduction).
Structural measures aiming at reducing the physical vulnerability of buildings are typically extremely efficient in the context of prevention of earthquake risks, because most of the damage and casualties are due to the collapse of buildings. Users concerned with reducing the physical dimension of vulnerability typically require information that allows them to design vulnerability or fragility curves, which give the probability of damage for an event of a given intensity for various types of assets (e.g., wood, concrete or masonry buildings) and different types of hazards. Fragility curves have long been established for earthquake risk assessment (Rossetto and Elnashai 2003), but they are increasingly used as well for landslides, flooding, tsunamis, tephra load and other volcanic hazards (Fuchs et al. 2007; Garcin et al. 2008; Jenkins et al. 2014; Jongman et al. 2012; Papathoma-Kohle et al. 2012; Spence et al. 2005). The fact that the fragility curves approach is not equally adopted across all natural hazards is partly due to the characteristics of hazards themselves (Douglas 2007). For example, coastal cliffs erosion or pyroclastic flows commonly cause total collapse of buildings (Dawson et al. 2009; Gehl et al. 2013). However, this is also due to the focus of scientific communities, who tend to put more emphasis on the physical processes and hazards than on the characterization of physical vulnerability (Douglas 2007; Geiss and Taubenbock 2013).
The physical determinants of vulnerability can be obtained by direct observations (e.g., building’s shapes, materials, presence of chimneys) (Ehrlich and Tenerelli 2013), or by indirect observations, linking observable features of the built environment (e.g., shape and width of streets, size of buildings, colour of roofs) with the actual determinants of vulnerability (Geiss et al. 2014; Muck et al. 2013; Taubenbock et al. 2008). For example, the current practice of operational physical vulnerability assessment consists in collecting in situ proxies during field surveys, eventually complemented by a visual examination of remote sensing images (Sedan et al. 2013). The approach based on direct observations is limited by the fact that there remain numerous proxies that cannot be observed yet with remote sensing, and which are important drivers of the vulnerability, such as the internal structures of buildings. For example, the uncertainty in the average vulnerability of earthquakes cannot be reduced by more than 50% by direct methods (Le Cozannet et al. 2018). Combining both indirect and direct proxies delivers results that are accurate enough for rapid screening of the vulnerability (Geiss et al. 2014).
Social vulnerability, that is, the propensity for human well-being to be adversely affected, interacts with economic vulnerability that is, the propensity for financial damage or disruption of productive capacity. Observing social or economic vulnerability involves assessing the extent to which populations are able or unable to cope with exposure to hazards. Earth observation data provide such information indirectly. For example, nighttime lights are a straightforward indicator of urban services, which needs to be considered in vulnerability assessments (de Sherbinin et al. 2015). However, other features that can be identified almost automatically in remote sensing images can help retrieving proxies of economic and social vulnerability. For example, Jean et al. (2016) combined machine learning (convolutional neural network) with high-resolution satellite imagery to predict the spatial distribution in economic well-being (poverty and wealth) in five African countries, hence explaining up to 75% of local variations of economic outcomes (Jean et al. 2016).
3.3 Reducing the Exposure
The exposure is defined by UNDRR as “people, infrastructure, housing, production capacities and other tangible human assets located in hazard-prone areas”. A first aim of disaster risk reduction can be to avoid further exposure to natural hazards, for example by avoiding building in coastal wetlands exposed to storms or in areas subject to pyroclastic flows. A second aim can be to reduce exposure through relocation of assets.
Satellite-based Earth Observation has long demonstrated capacities to map elements at risk. Usually, the main elements retrieved from Earth observations include the distribution of human population, buildings and strategic infrastructure, and roads, but the mapping of crops and natural ecosystems can be considered as well (De Bono and Mora 2014; Van Westen 2013). The spatial distribution and amount of most of these features can be readily extracted from moderate to very high spatial resolution satellite image through supervised classification algorithms, using pixel or object-based approaches (Jozdani et al. 2019). Challenges remain in the classification of different types of elements based on their material (e.g. dirt road versus tarmac road; houses with different roof types) or the discrimination of individual elements in densely built area (e.g., segmentation of individual houses in densely built slumps; Mossoux et al. 2018). Today, satellite-based Earth observations are becoming increasingly integrated with other sources of information within national geo-data repository or volunteered geographic information systems such as OpenStreetMap (Mahabir et al. 2018). As a consequence, despite being an essential component of state-of-the art data repository used for exposure mapping, satellite-based Earth observations are becoming less apparent to users.
Population maps and density are generally obtained from national census, and available per administrative units, going from small census tracts to coarser municipality or district units. Censuses are expensive, labour intensive and time-consuming and, as such, are often only organized once every 10 years or less. Many developing countries currently lack accurate population data at a fine geographical scale. Remote sensing can be a cost-effective alternative for mapping of population distribution. While it is not expected to result in the same accuracy as a traditional census, it can be a useful surrogate in absence of up-to-date census data. Two different remote sensing approaches have been developed for population mapping:
-
top-down approaches using interpolation methods based on land cover maps and other spatial indicators to disaggregate census data to a finer spatial scale (e.g., WorldPop, LandScan, World Population Estimate, Global Human Settlement Layer-Population (GHS-POP), Global Rural Urban Mapping Project (GRUMP)) (Lung et al. 2013);
-
bottom-up approaches aiming at defining a statistical relationship between remote sensing derived variables (nighttime light, number or size of dwelling units, settlement area, type of buildings) and population numbers (Mossoux et al. 2018; Wu et al. 2005) (see Fig. 4).
Fig. 4 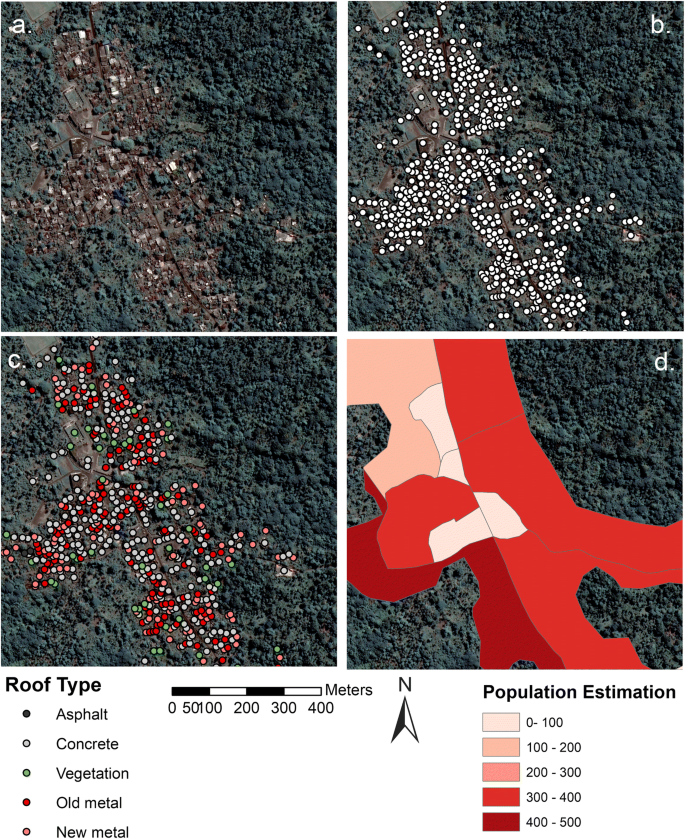
Example of exposure mapping in a remote area (Mitsoudje, Comoros, a volcanic archipelago off the East coast of Africa) using high-resolution Pléiades images (a) to identify (b), classify roof type of houses (c) and quantify the number of residents based on average number of residents per type of house extracted from field survey (d) (adapted from Mossoux et al. 2018)

For example, Lung et al. (2013) showed that population distribution at regional scale derived from object-based image analysis of very high-resolution satellite imagery compare well with information contained in census data in Kenya. As a further example, satellite derived observations of night lights have been related to the regional dynamics of population in China (Ma 2018). At coarser scales, imagery showing urban extent has been combined with nighttime light emissions, to assess population distribution at continental to global scales (Tan et al. 2018; Wu et al. 2005; Yu et al. 2018).
Exposure mapping is typically an area where automated processing of space-based Earth observations can substantially lower costs of information acquisition, because it is relevant across all hazards. This potential benefit of thinking beyond one single risk is one of the motivation for so-called “multi-risk” approaches, which attempt to address all components of risks across threats affecting a territory (Gallina et al. 2016; Grunthal et al. 2006; Marzocchi et al. 2012).
4 Earth Observation in Support to Crisis Management and Disaster Response
Needs relevant to preparedness, response and recovery include (Fig. 1):
-
disaster scenarios to simulate the impacts of crisis events and test emergency procedures: such scenarios primarily require information about vulnerability and exposure (see Sects. 3.2 and 3.3), in order to compute the potential impacts of adverse phenomena such as earthquakes or volcanic eruption (Gehl et al. 2013; Marrero et al. 2012; Sedan et al. 2013; Zuccaro et al. 2008). Information about the hazard is important as well in order to communicate the likelihood of each scenario to the bodies in charge of disaster management (see Sect. 3.1).
-
forecasts and early warning systems to plan for specific protection measures as a disaster is becoming more likely: this phase also requires pre-disaster information, but also forecasts and early warning systems, that require near-real-time observations of the ongoing event (e.g., cyclonic tracks, escalating volcanic unrest) in order to assess which scenarios are becoming more likely and which protection measures need to be taken (see Sect. 4.1).
-
information for delivering immediate assistance (see Sect. 4.2 )
-
damage mapping and information about the changes of hazards and risks to assess reconstruction costs and needs (see Sect. 4.3 ).
The list above shows that many of the satellite-based Earth Observation needs for hazard, exposure and vulnerability information discussed in Sect. 3 are relevant to preparedness and recovery. In the remaining of this section, we focus on the three aspects of crisis management that require more specific information and procedures: forecasts and early warning (Sect. 4.1), crisis management to deliver immediate assistance (Sect. 4.2) and damage mapping to assess reconstruction costs and needs (Sect. 4.3).
4.1 Forecasts and Early Warning Systems
The expected benefits from efficient early warning systems or forecasts are first to save lives, second to protect assets at risk. The meteorological forecasts are the most obvious example of satellite-based Earth Observations supporting early warning, for example in the case of storms or cyclones. During volcanic eruptions, early warning and forecasts can benefit from thermal hotspot, SO2 degassing and ground deformation satellite-based Earth observations, which in combination with in situ seismic monitoring have proven useful for forecasting and following ongoing crisis (Ernst et al. 2008; Smets et al. 2014; Surono et al. 2012). Overall, the potential of satellite-based Earth observations to inform forecasts of disasters is increasingly being explored for nearly 30 years (e.g., Tralli et al. 2005; Tronin 2010; Freund 2013).
New research may even offer more benefits in this area: for example, current early warning systems for Earthquakes take advantage that the first seismic waves propagate quicker than the most destructive ones, which allows immediate warning measures to save lives and avoid cascade events (Salichon et al. 2017). However, other non-seismic signals may suggest that an earthquake is about to happen, such groundwater temperature and/or chemistry changes (Claesson et al. 2004; Rigo 2010; King and Chia 2018 and references therein) and radon emissions (e.g., King 1986; Einarsson et al. 2008; Awais et al. 2017 and references therein). While such changes can be monitored in situ, satellite-based Earth Observation may also help monitoring these non-seismic signal changes in the ionospheric Total Electron Content (TEC) (e.g., Zakharenkova et al. 2008; Harrison et al. 2010; Kon et al. 2011; Zhang et al. 2014 and references therein), the surface temperature (e.g., Tronin 2000; Tramutoli et al. 2013; Barkat et al. 2018 and references therein), surface latent heat flux (Dey et al. 2004; Cervone et al. 2006; Qin et al. 2014) and Earthquake-cloud formation (e.g., Harrison et al. 2014 and references therein). While these partial examples confirm the variety of non-seismic signal that can be monitored, research is still required to improve the earthquake forecasting. In fact, several processes can create non-seismic signals that can be interpreted as early signals of an upcoming Earthquake.
4.2 Immediate Assistance
During and after a disaster, information is required to evaluate impacts of the disaster to humans and deliver immediate assistance (Boccardo and Tonolo 2015; Denis et al. 2016; Voigt et al. 2007, 2016). During this phase of crisis management, the priority is to save lives. Therefore, the information required relates to the likelihood of casualties and population displacements caused by the event. As an example of what Earth Observations can provide during this phase, nighttime lights from satellite images have been demonstrated useful to assess population size and dynamics during a 2010 humanitarian crisis caused by political conflict in Côte d’Ivoire (Bharti et al. 2015). They found increased brightness in neighbouring regions of Liberia where refugees had flown to, which they related to the number of refugees recorded by the United Nations simultaneously.
Traditionally, such needs are filled by conventional communication and aerial or in situ monitoring, but there is evidence that the space sector is increasingly informing operational crisis management and post-disaster response as well. For example, the decision to extend exclusion zones during the 2010 Merapi eruption was not only based on information from conventional geophysical data, but also from satellite images (Surono et al. 2012). Furthermore, a formal user feedback gathered after the Tohoku Earthquake and tsunami in 2011 in Japan suggests that space technologies delivered information that brought benefit to the definition, planning, implementation, monitoring and assessment of disaster relief operations (Kaku et al. 2015).
Several initiatives aim at delivering information in near real time to support crisis management and disaster response, including the European Copernicus Emergency Management Service (EMS) or Sentinel Asia (Kaku 2019; Lorenzo-Alonso et al. 2019). Here, international cooperation plays a key role because it allows each agency to benefit from third parties data potentially acquired earlier. The international charter for space and major disasters (https://disasterscharter.org/en/web/guest/home) is a worldwide collaboration, through which satellite data are made available for the benefit of crisis and post-disaster management. By combining Earth observations from different space agencies, the Charter allows resources and expertise to be coordinated for rapid response to major disaster situations, thereby helping civil protection authorities and the international humanitarian community at no cost for the user. It mobilizes agencies around the world and benefit from their know-how and their satellites through a single access point. As the Charter immediate response is key to success, this access point operates 24 h a day, 7 days a week.
The Charter has been founded in 1999 and declared operational as of November 2000, with 3 participating agencies: ESA, CNES and CSA. In two decades, it has been activated more than 600 times worldwide. The international charter now comprises 17 space agencies worldwide. The Charter is triggered for a large variety of disasters, either natural or related to human activity: earthquakes, fires, floods, ice jams, landslides, tsunamis, ocean storms, volcanic eruptions, oil spills and industrial accidents. It is functioning on the best efforts basis. Each agency is committed to provide space data resources and value-added processing as needed in the framework defined by the charter regulations. The so-called “Authorized Users” (AU) have a permanent access to the Charter access point in order to declare an emergency. There are currently 66 AU spread over 66 countries and this number is constantly increasing.
Once activated, the charter provides the local authorities in charge of the disaster management on site, with detailed value-added maps outlining the level of infrastructure destruction. Depending on the type of disaster and its location on Earth, the adequate sensors (medium and/or high-resolution optical images or all-weather capability radar images) of the flying-by satellites are used. Today, the current procedures allow the delivery of satellite products 48 h after the event, so that the request of users for a 6-8 h delivery cannot be met yet in many cases (Denis et al. 2016; Voigt et al. 2016). Here, constellations of satellites allowing for more frequent data acquisition could become a game changer over the coming decades (Denis et al. 2016). Already, many private companies (e.g., Planet Labs, ICEYE, UrtheCast) aim at providing daily or even hourly Earth Observation data coverage using both optical and Synthetic Aperture Radar (SAR) spaceborne sensors. It should be underlined that this involvement of the private sector comes as an encouraging step to the uptake of the market for such operational observations systems.
4.3 Damage Mapping
Once human lives have been saved, recovery actions can take place. These actions are essentially intended to restore infrastructure and economic and environmental services. Here, an assessment of reconstruction needs and the effects of post-disaster response is required. Two types of products based on satellite-based Earth observations can be schematically distinguished for these post-disaster phases:
-
Rapid damage mapping for an assessment of the needs for ongoing assistance (e.g., shelters for people whose buildings have collapsed)
-
Re-assessment of hazards and risks in order to reconstruct and restore services in a way that minimizes the impacts of future events.
While the two types of actions essentially require the same types of data, rapid mapping involves more severe time constraints but lower demands for accuracy than the full re-assessment of hazards and risks.
Damage mapping refers first to the identification of buildings or assets that have been entirely destroyed or cannot deliver essential services anymore. For example, satellite-based Earth observations have proven useful for mapping the destruction of settlements of ethnic minorities during armed conflicts (Bhattacharjee 2007; Levin et al. 2018). Changes to the land use or to the environment can be used as indicators for crisis-induced changes in population vulnerability, as exemplified in Northern Iraq where crops changed to grassland during the conflict (Mubareka and Ehrlich 2010). Furthermore, assessing the damage to the vegetation can be considered a goal per se, as in the case of the mining accident of Norilsk that caused degradation of the boreal forest (Zubareva et al. 2003) or to assess potential impacts for food security after volcanic ash-fallout events in densely populated areas (De Rose et al. 2011; De Schutter et al. 2015).
Damage mapping also refers to the quantification of vulnerability changes. After disasters, the vulnerability needs to be reassessed, because more fragile buildings, infrastructure or assets may represent a threat if another adverse event occurs. For example, differential subsidence or earthquakes may slightly damage the structure of buildings without causing their full collapse, and, ultimately, make them more vulnerable to a future seismic shock (Ehrlich and Tenerelli 2013). Here, following the work of Negulescu et al. (2014), Earth observations, whether in situ or space based, can be used to detect fragile structures, the result serving as information basis for identifying future vulnerable structures and areas in need of reconstruction.
After a disaster event, the hazard can change drastically. For example, volcanic eruption, lahars or landslides may change the elevation, slopes and landslide susceptibility (de Belizal et al. 2013; Joyce et al. 2009; Kerle et al. 2003), tsunamis and cyclones can modify shorelines and the vegetation (Paris et al. 2009), potentially favouring the propagation of surges inland if another coastal flood occurs. Hence, hazard ideally needs to be reassessed after disasters before planning for reconstruction. This especially update of available Digital Elevation Model and land cover maps, including for identifying changes in the exposure of elements at risk.
While the distinctions of actions according to the disaster management circle are convenient to understand where Earth observation can best support disaster risk reductions, there are linkages between pre- and post-disaster disaster management actions. Observation of damage after a disaster is commonly used to support crisis management and recovery (see Sect. 5). However, it can be used as well for designing and improving vulnerability curves, which can then be used to design scenarios useful for prevention and preparedness (Papathoma-Kohle et al. 2012).
5 Challenges, Opportunities and Ways Forward
5.1 Challenges
Overall, this review presents evidence that Earth Observation is already used in many ways to support disaster risk management. Current applications are sometimes not directly visible by the end-users, as space-based observations are used within complex approaches and workflows. Hence, what is finally visible to users is the most salient information (e.g., a hazard map) and not on the key datasets that allow to produce it (e.g., a very high-resolution digital elevation model).
We argue that the potential of Earth Observation for prevention is still underused. In fact, crisis management has received much attention from the Earth Observation community so far, as exemplified by the development of the International Charter and the Copernicus Emergency Management Service (EMS). On the other hand, prevention and some post-disaster phases aiming at increasing resilience have been less considered.
Studies focused on other phases of the disaster management cycle are not well balanced either, with usually a much stronger focus towards hazard assessment and less emphasis on vulnerability and exposure mapping. Surprisingly, this statement holds even for earthquake risk assessment, although quantifying vulnerability is a key in this area. A review of seismic risk assessment studies based on space-based Earth observations showed a strong emphasis on observations of the hazards and of post-disaster damage, but much less efforts for vulnerability mapping (Geiss and Taubenbock 2013).
Despite some promising research results (Ong et al. 2019; te Brake et al. 2013; Capes and Teeuw 2017), some phenomena with important impacts for the society still remain incompletely observed (e.g. shrinking and swelling of clays, groundwater induced flooding), and many needs of adaptation practitioners still need to be addressed. For example, the increasing occurrence and magnitude of heatwaves and droughts which is already being registered in the last decades (Russo et al. 2014; Russo and Sterl 2011) represents a potential important threat for human lives and well-being, for regional economies, and for natural ecosystems (Meehl and Tebaldi 2004). The challenge of better anticipating more frequent and intense heatwaves and droughts, or generally extreme natural phenomena, comes along with Earth Observation needs, which have not been systematically assessed yet. For example, adaptation to sea-level rise requires improved monitoring of shoreline changes and sediment transport (Benveniste et al. 2019), but the most urgent needs for such information comes from current risk management whereas adaptation at timescales relevant to sea-level rise (i.e., decades and centuries) is usually considered less urgent. For these sectors where no specific requirements have been formalized yet, we argue that a systematic review of user workflows and decisions is required to maximize the societal benefits of space-based Earth observations.
A final challenge will be to develop a sustainable market and adequate/tailored business models for the satellite-based Earth Observations supporting disaster risk management. Current estimates suggest that the financial investments that are planned today are relatively small, although funds for future Earth Observation missions, serving both scientific and commercial needs, have been increased. For example, the insurance market for the Earth Observation techniques supporting natural risks has been estimated at about 75 million euros per year in 2030 for Europe (Source: https://www.cvt-allenvi.fr/etudes/technologies-dobservation-environnementale-pour-lagriculture-et-les-risques-naturels/). For comparison, a single satellite typically represents a cost of 100 to 300 million Euros, which still remains much smaller than the economic damages from single disasters: for example, the 2010 Xynthia coastal storm in France and the costliest 2011 Tohoku Earthquake in Japan represented more than 2.5 billion Euros and 300 billion USD, respectively, notwithstanding casualties (Genovese and Przyluski 2013; Daniell et al. 2011). As long as the planned investments of the private sector remain so small in Earth observations, public investment will remain key to support the development of the sector.
5.2 The New Context of Satellite-Based Observations
There are today many opportunities to progress in using satellite-based Earth observations for disaster risk management. These opportunities are allowed by initiatives of the space sector, which has been developing an unprecedented Earth Observation infrastructure, in particular the Copernicus Sentinel constellation of satellites (Aschbacher et al. 2014). Although the Sentinel missions were initially envisaged to address the operational monitoring needs of Copernicus EMS, they have become a game changer not only for science but also to the space applications industry. Indeed, ensuring the systematic flow of Earth Observation data and the long-term sustainability of services is a prerequisite for commercial business models. This is apart from the actual contribution to science in terms of understanding and quantifying physical phenomena. Thus, further developments and innovative ideas should be expected in various domains, among which higher resolution soil moisture measurements, mapping of clay swelling, correcting tide gauge measurements and even monitoring of ground motion at nation-wide scale. Opportunities are not limited to hazard monitoring: as observations resources are becoming available through the Copernicus Land Service and other open historical archives (Koks et al. 2019), there is now an opportunity to better understand and how the vulnerability and exposure have evolved in the past, reached their current status and may evolve in the future (Duvat et al. 2017).
However, to allow the above-mentioned achievements dedicated dissemination and utilization strategies for such record amount of Earth Observation data should be considered. This is exactly where the support of space agencies arises, introducing concepts of moving algorithms and codes close to data, contrary to past practices that will soon become obsolete due to limited local storage and processing capacities. The Sentinels come along with web-based data dissemination mechanism (including collaborative ground segments etc.) like the Copernicus Open Access Hub (https://scihub.copernicus.eu), the Sentinel Product Exploitation Platform (PEPS) of CNES (https://peps.cnes.fr/rocket/#/home) as well as the development of processing platforms such as the ESA Geohazards Exploitation Platform (GEP, https://geohazards-tep.eu/), with numerous hosted processing services for geohazards applications (Foumelis et al. 2019). This constitutes a radical change in working procedures of Earth observations scientists and engineers, as less time is required to data management and processing, so that more efforts can be dedicated to the integration of different datasets, the interpretation of the observed phenomena, and the development of new algorithms to gather hazard-relevant information, as illustrated recently for shoreline changes (Mentaschi et al. 2018).
The conceptual model for such platform-based systems is relatively simple, having as a basis the infrastructure where Earth Observation data are stored and accessed from, followed by an upper layer of processing segments, represented in principal by several cloud service providers. Finally, at a higher end, dedicated web-based interfaces are the portals for user interaction with data and processing tools. Each of these layers is being developed separately by international and national initiatives, each at different level of maturity. The Data and Information Access Services (DIAS) platforms, funded by the European Commission (EC), are such example aiming to facilitate centralised and standardize access, manipulation and processing to Copernicus Sentinel data (https://www.copernicus.eu/en/access-data/dias).
Even though the evolution of these platforms cannot yet be easily projected into the future, since they are still heavily supported by space agencies, they count already several success stories in publishing scientific results (Galve et al. 2017; Papageorgiou et al. 2019), supporting geohazards related initiatives (ESA EO4SD project, https://www.eo4sd-drr.eu/news/government-indonesia%E2%80%99s-users-eo-products-disaster-risk-reduction) and providing rapid and valuable information in response to geohazards events (example of the 2019 M5 earthquake in mainland France, https://www.esa.int/Applications/Observing_the_Earth/Copernicus/Sentinel-1/French_earthquake_fault_mapped). Here again, it is clear that the role of the private sector will also be critical to ensure sustainability and support further enhanced processing and e-collaboration capabilities of platform-based solutions.
In this context, initiatives such as the Group on Earth Observations (GEO), the European Plate Observing System (EPOS) and the Geohazards Lab (http://ceos.org/ourwork/workinggroups/disasters/geohazards-lab) of the Committee of the Earth Observation Satellites (CEOS) are more useful than ever to foster the organization of the Earth Observation community concerned with disaster risks management.
5.3 Initiatives from the Disaster-Risk Management Community
Other opportunities result from initiatives from the community concerned with disaster risk reduction. Several scientific or operational observatories are focused on a particular system or territory. For example, this includes seismic networks, volcano or coastal observatories. Space agencies have long identified the prominent role of these observatories and linked with them, for example through initiatives such as the “Supersites” or the “Natural Laboratories”, through which they deliver all available data to stimulate scientific research for critical areas. These sites include, for example, the earthquake-prone San Andrea and Marmara region in California and Turkey, or the Virunga in the democratic republic of Congo, Vesuvius, Campi Flegrei and Etna volcanic areas in Italy (see a list of existing and candidate Supersites at https://geo-gsnl.org/). For many of these Supersites, there is not a single hazard threatening communities and human assets, but multiple natural and anthropogenic risks, which can be more efficiently observed if one takes advantage of synergies among observations relevant to these multiple risks. An obvious element here is the characterization of the built environment, which has long been considered in multi-risk approaches developed by the scientific community concerned with disaster risk reduction (Grunthal et al. 2006; Kappes et al. 2012; Thierry et al. 2008). As shown in Sect. 3, characteristics of the built environment can hardly be observed directly, but there are opportunities in valuing indirect proxies, such as local knowledge of building practices or nightlights for assessing post-disaster recovery. Overall, these efforts of the communities concerned by disaster risk reduction are supported by research in the area of geospatial information management (Wilkinson et al. 2016) that now allow for interoperable information systems and web services to share data relevant to disaster risks (Douglas et al. 2008; Le Cozannet et al. 2014; Tellez-Arenas et al. 2018). Finally, some major frameworks such as the Sendai Framework (https://www.unisdr.org/files/43291_sendaiframeworkfordrren.pdf) highlight on key priorities for reducing disaster risks, including improving the governance of risk management, supporting operational disaster risk management and long-term strategic planning. For the Earth Observation community concerned with disaster risks, the detail of these priorities is relevant to consider because they link to actions presenting the best potential to reduce risks.
5.4 Need for Mutual Exchange of Knowledge
From the perspective of space agencies and space-based Earth Observation providers, the challenge of improving the use of Earth observations techniques in everyday disaster risk management practices goes through proper training and increase of awareness of the capacity of Earth observations missions and techniques. We argue that a multi-directional mutual exchange of knowledge is required, which involves liaising the disaster risk reduction and the Earth observations research and practitioner communities. The usefulness of Earth observations can be demonstrated with successful showcases, but understanding workflows of practitioners and training them to the most appropriate tools plays also a significant role. Several space agencies have been investing towards the direction of training by organizing regular face-to-face as well as massive online training courses addressed mainly to academic students and members of scientific institutes, while other initiatives focus also on non-Earth observations experts, such as the Research and User Support (RUS) service of Copernicus (http://rus-copernicus.eu). Furthermore, capacity building activities, as organized by space agencies (e.g., ESA) together with other relevant funding organisms (e.g., World Bank and Asian Development Bank) are contributing likewise towards improved awareness. Tailored education of the population for realizing the potential positive impact of Earth observations to the disaster risk management is considered nowadays crucial for the successful acceptance of these technologies and proper utilization of the Earth observations assets. We argue that an equally ambitious agenda is required to inform the Earth observations data and service providers with needs, workflows, and practices of technicians, engineers and researchers working on disaster risk reduction.
6 Conclusions
This paper argues that user-centric approaches linking specific decisions schemes with information needs are useful to maximize the benefits of satellite-based Earth observations. This statement is obtained from a review of satellite-based Earth Observation inputs into the different phases of the disaster risk management cycle (Sect. 2), including prevention (Sect. 3), preparedness, crisis and post-crisis management (Sect. 4).This review shows that while satellite-based Earth Observation is useful in a number of cases, there are still opportunities to develop, in particular to support prevention of risks, to better monitor the vulnerability and exposure and to detect early changes in hazards caused by climate change.
Several opportunities exist, originating from both the space sector and the disaster risk scientific and management communities (Sect. 4). A straightforward way forward to take advantage of these opportunities will consist in linking these top-down and bottom-up approaches, for instance following successful experiences in hazard and risk observatories, “supersites” and natural laboratories. This requires appropriate capacity building and mutual exchange of knowledge of all communities concerned with disaster risk reduction. For the research community, this creates opportunities for trans-disciplinary research linking Earth observations and environmental science with decision making and social science.
References
Adger WN (2000) Social and ecological resilience: are they related? Prog Hum Geogr 24(3):347–364
Alexander LV, Zhang X, Peterson TC, Caesar J, Gleason B, Tank A, Haylock M, Collins D, Trewin B, Rahimzadeh F, Tagipour A, Kumar KR, Revadekar J, Griffiths G, Vincent L, Stephenson DB, Burn J, Aguilar E, Brunet M, Taylor M, New M, Zhai P, Rusticucci M, Vazquez-Aguirre JL (2006) Global observed changes in daily climate extremes of temperature and precipitation. J Geophys Res Atmos 111:D05109
Antoine R, Lissak C, Fauchard C, Tanguy M, Smet B, Gomez C (this issue) UAVs for geohazards. Surv Geophys (in review)
Aschbacher J, Milagro-Perez MP (2012) The European Earth monitoring (GMES) programme: status and perspectives. Remote Sens Environ 120:3–8
Aschbacher J, Beer T, Ciccolella A, Filippazzo G, Milagro M, Tassa A (2014) COPERNICUS Moving from development to operations. ESA Bull Eur Space Agency 157:30–37
Awais M, Barkat A, Ali A et al (2017) Satellite thermal IR and atmospheric radon anomalies associated with the Haripur earthquake (Oct 2010; Mw 5.2), Pakistan. Adv Space Res 60:2333–2344. https://doi.org/10.1016/j.asr.2017.08.034
Bally P (2012) (edt) Scientific and technical memorandum of the international forum on satellite EO and geohazards, 21–23 May 2012. Santorini, Greece, https://doi.org/10.5270/esa-geo-hzrd-2012. http://esamultimedia.esa.int/docs/EarthObservation/Geohazards/esa-geo-hzrd-2012.pdf
Balsamo G, Agusti-Parareda A, Albergel C, Arduini G, Beljaars A, Bidlot J, Bousserez N, Boussetta S, Brown A, Buizza R, Buontempo C, Chevallier F, Choulga M, Cloke H, Cronin MF, Dahoui M, De Rosnay P, Dirmeyer PA, Drusch M, Dutra E, Ek MB, Gentine P, Hewitt H, Keeley SPE, Kerr Y, Kumar S, Lupu C, Mahfouf JF, McNorton J, Mecklenburg S, Mogensen K, Munoz-Sabater J, Orth R, Rabier F, Reichle R, Ruston B, Pappenberger F, Sandu I, Seneviratne SI, Tietsche S, Trigo IF, Uijlenhoet R, Wedi N, Woolway RI, Zeng XB (2018) Satellite and in situ observations for advancing global earth surface modelling: a review. Remote Sens 10(12):72
Barbot S, Agram P, De Michele M (2013) Change of apparent segmentation of the San Andreas fault around Parkfield from space geodetic observations across multiple periods. J Geophys Res Solid Earth 118(12):6311–6327
Barkat A, Ali A, Rehman K et al (2018) Thermal IR satellite data application for earthquake research in Pakistan. J Geodyn 116:13–22. https://doi.org/10.1016/j.jog.2018.01.008
Bello OM, Aina YA (2014) Satellite remote sensing as a tool in disaster management and sustainable development: towards a synergistic approach. In: 3rd international geography symposium, Geomed2013, vol 120, pp 365–373
Benveniste J, Cazenave A, Vignudelli S, Fenoglio-Marc L, Shah R, Almar R, Andersen O, Birol F, Bonnefond P, Bouffard J, Calafat F, Cardellach E, Cipollini P, Le Cozannet G, Dufau C, Fernandes MJ, Frappart F, Garrison J, Gommenginger C, Han GQ, Hoyer JL, Kourafalou V, Leuliette E, Li ZJ, Loisel H, Madsen KS, Marcos M, Melet A, Meyssignac B, Pascual A, Passaro M, Ribo S, Scharroo R, Song YT, Speich S, Wilkin J, Woodworth P, Woppelmann G (2019) Requirements for a coastal hazards observing system. Front Mar Sci 6:348
Bharti N, Lu X, Bengtsson L, Wetter E, Tatem AJ (2015) Remotely measuring populations during a crisis by overlaying two data sources. Int Health 7(2):90–98
Bhattacharjee Y (2007) Human rights—Myanmar’s secret history exposed in satellite images. Science 318(5847):29
Birkmann J, Cardona OD, Carreno ML, Barbat AH, Pelling M, Schneiderbauer S, Kienberger S, Keiler M, Alexander D, Zeil P, Welle T (2013) Framing vulnerability, risk and societal responses: the MOVE framework. Nat Hazards 67(2):193–211
Boccardo P, Tonolo FG (2015) Remote sensing role in emergency mapping for disaster response. Engineering geology for society and territory, Vol 5: urban geology, sustainable planning and landscape exploitation, pp 17–24
Brooks N, Adger WN, Kelly PM (2005) The determinants of vulnerability and adaptive capacity at the national level and the implications for adaptation. Glob Environ Change Hum Policy Dimens 15(2):151–163
Capes R, Teeuw R (2017) On safe ground? Analysis of European urban geohazards using satellite radar interferometry. Int J Appl Earth Obs Geoinf 58:74–85. https://doi.org/10.1016/j.jag.2017.01.010
Cazenave A, Le Cozannet G (2014) Sea level rise and its coastal impacts. Earths Future 2(2):15–34
Cervone G, Maekawa S, Singh RP et al (2006) Surface latent heat flux and nighttime LF anomalies prior to the Mw = 8.3 Tokachi-Oki earthquake. Nat Hazards Earth Syst Sci 6:109–114
Claesson L, Skelton A, Graham C et al (2004) Hydrogeochemical changes before and after a major earthquake. Geology 32:641–644. https://doi.org/10.1130/G20542.1
Daniell JE, Khazai B, Wenzel F, Vervaeck A (2011) The CATDAT damaging earthquakes database. Nat Hazards Earth Syst Sci 11(8):2235
Dawson RJ, Dickson ME, Nicholls RJ, Hall JW, Walkden MJ, Stansby PK, Mokrech M, Richards J, Zhou J, Milligan J, Jordan A (2009) Integrated analysis of risks of coastal flooding and cliff erosion under scenarios of long term change. Clim Change 95(1–2):249–288
de Belizal E, Lavigne F, Hadmoko DS, Degeai JP, Dipayana GA, Mutaqin BW, Marfai MA, Coquet M, Le Mauff B, Robin AK, Vidal C, Cholik N, Aisyah N (2013) Rain-triggered lahars following the 2010 eruption of Merapi volcano, Indonesia: a major risk. J Volcanol Geoth Res 261:330–347
De Bono A, Mora MG (2014) A global exposure model for disaster risk assessment. Int J Disaster Risk Reduct 10:442–451
de Michele M, Raucoules D, Rolandone F, Briole P, Salichon J, Lemoine A, Aochi H (2011) Spatiotemporal evolution of surface creep in the Parkfield region of the San Andreas Fault (1993–2004) from synthetic aperture radar. Earth Planet Sci Lett 308(1–2):141–150
De Rose RC, Oguchi T, Morishima W, Collado M (2011) Land cover change on Mt. Pinatubo, the Philippines, monitored using ASTER VNIR. Int J Remote Sens 32(24):9279–9305
De Schutter A, Kervyn M, Canters F, Bosshard-Stadlin SA, Songo MAM, Mattsson HB (2015) Ash fall impact on vegetation: a remote sensing approach of the Oldoinyo Lengai 2007–08 eruption. J Appl Volcanol 4:15
de Sherbinin A, Chai-Onn T, Jaiteh M, Mara V, Pistolesi L, Schnarr E, Trzaska S (2015) Data integration for climate vulnerability mapping in West Africa. ISPRS Int J Geo-Inf 4(4):2561–2582
Denis G, de Boissezon H, Hosford S, Pasco X, Montfort B, Ranera F (2016) The evolution of Earth Observation satellites in Europe and its impact on the performance of emergency response services. Acta Astronaut 127:619–633
Desnos YL, Borgeaud M, Doherty M, Liebig V, Rast M (2014) The European space agency’s earth observation program. IEEE Geosci Remote Sens Mag 2(2):37–46
Desnos YL, Foumelis M, Engdahl M, Mathieu PP, Palazzo F, Ramoino F, Zmuda A, IEEE (2016) Scientific exploitation of sentinel-1 within esa’s seom programme element. In: 2016 IEEE international geoscience and remote sensing symposium (IGARSS), pp 3878–3881
Dey S, Sarkar S, Singh RP (2004) Anomalous changes in column water vapor after Gujarat earthquake. Adv Space Res 33:274–278. https://doi.org/10.1016/S0273-1177(03)00475-7
Douglas J (2007) Physical vulnerability modelling in natural hazard risk assessment. Nat Hazards Earth Syst Sci 7(2):283–288
Douglas J, Usländer T, Schimak G, Esteban JF, Denzer R (2008) An open distributed architecture for sensor networks for risk management. Sensors 8(3):1755–1773
Duvat VK, Magnan AK, Wise RM, Hay JE, Fazey I, Hinkel J et al (2017) Trajectories of exposure and vulnerability of small islands to climate change. Wiley Interdiscip Rev Clim Change 8(6):e478
Ehrlich D, Tenerelli P (2013) Optical satellite imagery for quantifying spatio-temporal dimension of physical exposure in disaster risk assessments. Nat Hazards 68(3):1271–1289
Einarsson P, Theodórsson P, Hjartardóttir ÁR, Guðjónsson GI (2008) Radon changes associated with the earthquake sequence in June 2000 in the South Iceland Seismic Zone. In: Pérez NM, Gurrieri S, King C-Y, Taran Y (eds) Terrestrial fluids, earthquakes and volcanoes: the Hiroshi Wakita, vol III. Birkhäuser Basel, Basel, pp 63–74
Elliot et al. (this issue) Measuring earthquake hazards with Earth Observation data. Surv Geophys (in review)
Ernst GGJ, Kervyn M, Teeuw RM (2008) Advances in remote sensing of volcanoes, their activity and hazards. Int J Remote Sens 29:6687–6723
Exploitation Platform., IEEE International Geoscience and Remote Sensing Symposium (IGARSS 2019), Yokohama, Japan
Felpeto A, Marti J, Ortiz R (2007) Automatic GIS-based system for volcanic hazard assessment. J Volcanol Geoth Res 166(2):106–116
Le Cozannet G, Raucoules D, de Michele M, Benaichouche A, Gehl P, Monfort D, Negulescu C, Rohmer J, Pierdicca N, Albano M, Giovinazzi S, Foumelis M, IEEE (2018) Potential of satellite remote sensing to monitor vulnerablity of buildings to earthquakes within a semi-empirical macroseismic approach. In: IGARSS 2018—2018 IEEE international geoscience and remote sensing symposium. IEEE international symposium on geoscience and remote sensing IGARSS, pp 2956–2959
Foumelis M, Papageorgiou E, Stamatopoulos C (2016) Episodic ground deformation signals in Thessaly Plain (Greece) revealed by data mining of SAR interferometry time series. Int J Remote Sens 37(16):3696–3711
Foumelis M, Papadopoulou T, Bally P, Pacini F, Provost P, Patruno J (2019) Monitoring geohazards using on-demand and systematic services on ESA’s geohazards. In: IGARSS 2019 - 2019 IEEE international geoscience and remote sensing symposium, Yokohama, Japan, pp 5457–5460
Freund F (2013) Earthquake forewarning—a multidisciplinary challenge from the ground up to space. Acta Geophys 61:775–807. https://doi.org/10.2478/s11600-013-0130-4
Fuchs S, Heiss K, Huebl J (2007) Towards an empirical vulnerability function for use in debris flow risk assessment. Nat Hazards Earth Syst Sci 7(5):495–506
Gallina V, Torresan S, Critto A, Sperotto A, Glade T, Marcomini A (2016) A review of multi-risk methodologies for natural hazards: consequences and challenges for a climate change impact assessment. J Environ Manag 168:123–132
Galve JP, Perez-Pena JV, Azanon JM, Closson D, Calo F, Reyes-Carmona C, Jabaloy A, Ruano P, Mateos RM, Notti D, Herrera G, Bejar-Pizarro M, Monserrat O, Bally P (2017) Evaluation of the SBAS InSAR service of the European Space Agency’s Geohazard exploitation platform (GEP). Remote Sens 9(12):1291
Garcin M, Desprats JF, Fontaine M, Pedreros R, Attanayake N, Fernando S, Siriwardana C, De Silva U, Poisson B (2008) Integrated approach for coastal hazards and risks in Sri Lanka. Nat Hazards Earth Syst Sci 8(3):577–586
Gehl P, Quinet C, Le Cozannet G, Kouokam E, Thierry P (2013) Potential and limitations of risk scenario tools in volcanic areas through an example at Mount Cameroon. Nat Hazards Earth Syst Sci 13(10):2409–2424
Geiss C, Taubenbock H (2013) Remote sensing contributing to assess earthquake risk: from a literature review towards a roadmap. Nat Hazards 68(1):7–48
Geiss C, Taubenbock H, Tyagunov S, Tisch A, Post J, Lakes T (2014) Assessment of seismic building vulnerability from space. Earthq Spectra 30(4):1553–1583
Genovese E, Przyluski V (2013) Storm surge disaster risk management: the Xynthia case study in France. J Risk Res 16(7):825–841
Gill JC, Malamud BD (2016) Hazard interactions and interaction networks (cascades) within multi-hazard methodologies. Earth Syst Dyn 7(3):659–679
Grunthal G, Thieken AH, Schwarz J, Radtke KS, Smolka A, Merz B (2006) Comparative risk assessments for the city of Cologne—Storms, floods, earthquakes. Nat Hazards 38(1–2):21–44
Guo HD (2010) Understanding global natural disasters and the role of earth observation. Int J Digital Earth 3(3):221–230
Haasnoot M, van ‘t Klooster S, van Alphen J (2018) Designing a monitoring system to detect signals to adapt to uncertain climate change. Glob Environ Change Hum Policy Dimens 52:273–285
Harrison RG, Aplin KL, Rycroft MJ (2010) Atmospheric electricity coupling between earthquake regions and the ionosphere. J Atmos Solar Terr Phys 72:376–381. https://doi.org/10.1016/j.jastp.2009.12.004
Harrison RG, Aplin KL, Rycroft MJ (2014) Brief communication: earthquake–cloud coupling through the global atmospheric electric circuit. Nat Hazards Earth Syst Sci 14:773–777
Hébert H, Gailler A, Gupta H, Monnier A, Lognonné P, Occhipinti G, Rolland L, Schindelé F (this issue) Contribution of space missions to a better tsunami science: observations, models and warning. Surv Geophys (in review)
Hinkel J, Church JA, Gregory JM, Lambert E, Le Cozannet G, Lowe J, McInnes KL, Nicholls RJ, van der Pol TD, van de Wal R (2019) Meeting user needs for sea level rise information: a decision analysis perspective. Earths Future 7(3):320–337
Hoque MAA, Phinn S, Roelfsema C, Childs I (2017) Tropical cyclone disaster management using remote sensing and spatial analysis: a review. Int J Disaster Risk Reduct 22:345–354
Hussain E, Hooper A, Wright TJ, Walters RJ, Bekaert DPS (2016) Interseismic strain accumulation across the central North Anatolian Fault from iteratively unwrapped InSAR measurements. J Geophys Res Solid Earth 121(12):9000–9019
IPCC (2018) Annex I: Glossary. In: Matthews JBR (ed) Global Warming of 1.5°C. An IPCC Special Report on the impacts of global warming of 1.5°C above pre-industrial levels and related global greenhouse gas emission pathways, in the context of strengthening the global response to the threat of climate change, sustainable development, and efforts to eradicate poverty
Jäggi A, Longuevergne L, Antoine R, Lopez T, Teatini P (this issue) Hydrological hazards. Surv Geophys (in review)
Jean N, Burke M, Xie M, Davis WM, Lobell DB, Ermon S (2016) Combining satellite imagery and machine learning to predict poverty. Science 353(6301):790–794
Jenkins SF, Spence RJS, Fonseca J, Solidum RU, Wilson TM (2014) Volcanic risk assessment: quantifying physical vulnerability in the built environment. J Volcanol Geoth Res 276:105–120
Jones RN, Patwardhan A, Cohen SJ, Dessai S, Lammel A, Lempert RJ, Mirza MMQ, von Storch H (2014) Foundations for decision making. In: Field CB, Barros VR, Dokken DJ, Mach KJ, Mastrandrea MD, Bilir TE, Chatterjee M, Ebi KL, Estrada YO, Genova RC, Girma B, Kissel ES, Levy AN, MacCracken S, Mastrandrea PR, White LL (eds) Climate change 2014: impacts, adaptation, and vulnerability. Part A: global and sectoral aspects. Contribution of working group II to the fifth assessment report of the intergovernmental panel on climate change. Cambridge University Press, Cambridge, pp 195–228
Jongman B, Kreibich H, Apel H, Barredo JI, Bates PD, Feyen L, Gericke A, Neal J, Aerts J, Ward PJ (2012) Comparative flood damage model assessment: towards a European approach. Nat Hazards Earth Syst Sci 12(12):3733–3752
Joyce KE, Belliss SE, Samsonov SV, McNeill SJ, Glassey PJ (2009) A review of the status of satellite remote sensing and image processing techniques for mapping natural hazards and disasters. Prog Phys Geogr 33(2):183–207
Jozdani SE, Johnson BA, Chen DM (2019) Comparing deep neural networks, ensemble classifiers, and support vector machine algorithms for object-based urban land use/land cover classification. Remote Sens 11(14):24
Kaku K (2019) Satellite remote sensing for disaster management support: a holistic and staged approach based on case studies in Sentinel Asia. Int J Disaster Risk Reduct 33:417–432
Kaku K, Aso N, Takiguchi F (2015) Space-based response to the 2011 Great East Japan Earthquake: lessons learnt from JAXA’s support using earth observation satellites. Int J Disaster Risk Reduct 12:134–153
Kappes MS, Keiler M, von Elverfeldt K, Glade T (2012) Challenges of analyzing multi-hazard risk: a review. Nat Hazards 64(2):1925–1958
Kerle N, Froger JL, Oppenheimer C, De Vries BV (2003) Remote sensing of the 1998 mudflow at Casita volcano, Nicaragua. Int J Remote Sens 24(23):4791–4816
Kervyn M, Ernst GGJ, Goossens R, Jacobs P (2008) Mapping volcano topography with remote sensing: ASTER vs. SRTM. Int J Remote Sens 29(22):6515–6538
Kienberger S, Blaschke T, Zaidi RZ (2013) A framework for spatio-temporal scales and concepts from different disciplines: the ‘vulnerability cube’. Nat Hazards 68(3):1343–1369
King C-Y (1986) Gas geochemistry applied to earthquake prediction: an overview. J Geophys Res Solid Earth 91:12269–12281. https://doi.org/10.1029/JB091iB12p12269
King C-Y, Chia Y (2018) Anomalous streamflow and groundwater-level changes before the 1999 M7.6 Chi-Chi Earthquake in Taiwan: possible mechanisms. Pure Appl Geophys 175:2435–2444. https://doi.org/10.1007/s00024-017-1737-1
Klomp J (2016) Economic development and natural disasters: a satellite data analysis. Global Environ Change Hum Policy Dimens 36:67–88
Kogan FN (1997) Global drought watch from space. Bull Am Meteor Soc 78(4):621–636
Koike T, Onoda M, Cripe D, Achache J (2010) The Global Earth Observation System of Systems (GEOSS): supporting the needs of decision making in societal benefit areas. Netw World Remote Sens 38:164–169
Koks EE, Rozenberg J, Zorn C, Tariverdi M, Vousdoukas M, Fraser SA, Hall JW, Hallegatte S (2019) A global multi-hazard risk analysis of road and railway infrastructure assets. Nat Commun 10(1):1–11
Kon S, Nishihashi M, Hattori K (2011) Ionospheric anomalies possibly associated with M⩾6.0 earthquakes in the Japan area during 1998–2010: case studies and statistical study. J Asian Earth Sci 41:410–420. https://doi.org/10.1016/j.jseaes.2010.10.005
Lavell A, Oppenheimer M, Diop C, Hess J, Lempert R, Li J, Muir-Wood R, Myeong S (2012) Climate change: new dimensions in disaster risk, exposure, vulnerability, and resilience. In: Field CB, Barros V, Stocker TF, Qin D, Dokken DJ, Mastrandrea MD, Mach KJ, Plattner G-K, Allen SK, Tignor M, Midgley PM (eds) Managing the risks of extreme events and disasters to advance climate change adaptation. A special report of working groups I and II of the intergovernmental panel on climate change (IPCC). Cambridge University Press, Cambridge, pp 25–64
Le Cozannet G, Bagni M, Thierry P, Aragno C, Kouokam E (2014) WebGIS as boundary tools between scientific geoinformation and disaster risk reduction action in volcanic areas. Nat Hazards Earth Syst Sci 14(6):1591
Levin N, Ali S, Crandall D (2018) Utilizing remote sensing and big data to quantify conflict intensity: the Arab Spring as a case study. Appl Geography 94:1–17
Lissak C, De Michele M, Bartsch A, Roulland T, Maquaire O, Gomez C (this issue) Remote sensing for mass movement assessment. Surv Geophys (in review)
Lorenzo-Alonso A, Utanda A, Aullo-Maestro ME, Palacios M (2019) Earth observation actionable information supporting disaster risk reduction efforts in a sustainable development framework. Remote Sens 11(1):49
Ludy J, Kondolf GM (2012) Flood risk perception in lands “protected” by 100-year levees. Nat Hazards 61:829–842. https://doi.org/10.1007/s11069-011-0072-6
Lung T, Lübker T, Ngochoch J, Schaab G (2013) Human population distribution modelling at regional level using very high resolution satellite imagery. Appl Geogr 41:36–45
Ma T (2018) Multi-level relationships between satellite-derived nighttime lighting signals and social media-derived human population dynamics. Remote Sens 10(7):1128
Mahabir R, Croitoru A, Crooks A, Agouris P, Stefanidis A (2018) News coverage, digital activism, and geographical saliency: a case study of refugee camps and volunteered geographical information. PLoS ONE 13(11):e0206825
Manna AJ (1985) 25 years of Tiros satellites. Bull Am Meteor Soc 66(4):421–423
Marrero JM, Garcia A, Llinares A, Rodriguez-Losada JA, Ortiz R (2012) A direct approach to estimating the number of potential fatalities from an eruption: application to the Central Volcanic Complex of Tenerife Island. J Volcanol Geoth Res 219:33–40
Marzocchi W, Garcia-Aristizabal A, Gasparini P, Mastellone ML, Di Ruocco A (2012) Basic principles of multi-risk assessment: a case study in Italy. Nat Hazards 62(2):551–573
Meehl GA, Tebaldi C (2004) More intense, more frequent, and longer lasting heat waves in the 21st century. Science 305(5686):994–997
Melet A, Bartsch A, Benveniste J, Conversi A, Jamet C, Le Cozannet G, Teatini P (this issue) Earth Observations for monitoring marine coastal hazards and their drivers. Surv Geophys (in review)
Mentaschi L, Vousdoukas MI, Pekel J-F, Voukouvalas E, Feyen L (2018) Global long-term observations of coastal erosion and accretion. Sci Rep 8(1):12876
Mossoux S, Kervyn M, Soule H, Canters F (2018) Mapping population distribution from high resolution remotely sensed imagery in a data poor setting. Remote Sens 10(9):1409
Mubareka S, Ehrlich D (2010) Identifying and modelling environmental indicators for assessing population vulnerability to conflict using ground and satellite data. Ecol Ind 10(2):493–503
Muck M, Taubenbock H, Post J, Wegscheider S, Strunz G, Sumaryono S, Ismail FA (2013) Assessing building vulnerability to earthquake and tsunami hazard using remotely sensed data. Nat Hazards 68(1):97–114
Myint SW, Yuan M, Cerveny RS, Giri C (2008) Categorizing natural disaster damage assessment using satellite-based geospatial techniques. Nat Hazards Earth Syst Sci 8(4):707–719
Negulescu C, Ulrich T, Baills A, Seyedi DM (2014) Fragility curves for masonry structures submitted to permanent ground displacements and earthquakes. Nat Hazards 74(3):1461–1474
Neri M, Le Cozannet G, Thierry P, Bignami C, Ruch J (2013) A method for multi-hazard mapping in poorly known volcanic areas: an example from Kanlaon (Philippines). Nat Hazards Earth Syst Sci 13(8):1929–1943
Ong C, Carrère V, Chabrillat S et al (2019) Imaging spectroscopy for the detection, assessment and monitoring of natural and anthropogenic hazards. Surv Geophys 40:431–470. https://doi.org/10.1007/s10712-019-09523-1
Papageorgiou E, Foumelis M, Trasatti E, Ventura G, Raucoules D, Mouratidis A (2019) Multi-sensor SAR geodetic imaging and modelling of santorini volcano post-unrest response. Remote Sens 11(3):259
Papathoma-Kohle M, Keiler M, Totschnig R, Glade T (2012) Improvement of vulnerability curves using data from extreme events: debris flow event in South Tyrol. Nat Hazards 64(3):2083–2105
Parcharidis I, Kokkalas S, Fountoulis I, Foumelis M (2009) Detection and monitoring of active faults in urban environments: time series interferometry on the cities of patras and pyrgos (Peloponnese, Greece). Remote Sens 1(4):676–696
Paris R, Wassmer P, Sartohadi J, Lavigne F, Barthomeuf B, Desgages E, Grancher D, Baumert P, Vautier F, Brunstein D, Gomez C (2009) Tsunamis as geomorphic crises: lessons from the December 26, 2004 tsunami in Lhok Nga, West Banda Aceh (Sumatra, Indonesia). Geomorphology 104(1–2):59–72
Pettinari ML, Chuvieco E, Aguado I, Salas J (this issue) Fires hazard from space. Surv Geophys (in review)
Plag HP, Amelung F, Lengert W, Marsh SH, Meertens C (2010) Supporting risk management and disaster reduction: the geohazards community of practice and the supersite initiative. Netw World Remote Sens 38:192–197
Qin K, Wu LX, Ouyang XY et al (2014) Surface latent heat flux anomalies quasi-synchronous with ionospheric disturbances before the 2007 Pu’er earthquake in China. Adv Space Res 53:266–271. https://doi.org/10.1016/j.asr.2013.11.004
Raucoules D, Maisons C, Camec C, Le Mouelic S, King C, Hosford S (2003) Monitoring of slow ground deformation by ERS radar interferometry on the Vauvert salt mine (France) - Comparison with ground-based measurement. Remote Sens Environ 88(4):468–478
Raucoules D, Le Cozannet G, Woppelmann G, de Michele M, Gravelle M, Daag A, Marcos M (2013) High nonlinear urban ground motion in Manila (Philippines) from 1993 to 2010 observed by DInSAR: implications for sea-level measurement. Remote Sens Environ 139:386–397
Rigo A (2010) Precursors and fluid flows in the case of the 1996, ML = 5.2 Saint-Paul-de-Fenouillet earthquake (Pyrenees, France): a complete pre-, co- and post-seismic scenario. Tectonophysics 480:109–118. https://doi.org/10.1016/j.tecto.2009.09.027
Rohmer J, Douglas J, Bertil D, Monfort D, Sedan O (2014) Weighing the importance of model uncertainty against parameter uncertainty in earthquake loss assessments. Soil Dyn Earthq Eng 58:1–9
Romieu E, Welle T, Schneiderbauer S, Pelling M, Vinchon C (2010) Vulnerability assessment within climate change and natural hazard contexts: revealing gaps and synergies through coastal applications. Sustain Sci 5(2):159–170
Rossetto T, Elnashai A (2003) Derivation of vulnerability functions for European-type RC structures based on observational data. Eng Struct 25(10):1241–1263
Russo S, Sterl A (2011) Global changes in indices describing moderate temperature extremes from the daily output of a climate model. J Geophys Res Atmos 116:D3
Russo S, Dosio A, Sterl A, Barbosa P, Vogt J (2013) Projection of occurrence of extreme dry-wet years and seasons in Europe with stationary and nonstationary standardized precipitation indices. J Geophys Res Atmos 118(14):7628–7639
Russo S, Dosio A, Graversen RG, Sillmann J, Carrao H, Dunbar MB, Singleton A, Montagna P, Barbola P, Vogt JV (2014) Magnitude of extreme heat waves in present climate and their projection in a warming world. J Geophys Res Atmos 119(22):12500–12512
Salichon J, Le Cozannet G, Modaressi H, Hosford S, Missotten R, McManus K, Marsh S, Paganini M, Ishida C, Plag HP, Labrecque J, Dobson C, Quick J, Giardini D, Takara K, Fukuoka H, Casagli N, Marzocchi W (2007) 2nd IGOS Geohazards Theme report, BRGM
Sedan O, Negulescu C, Terrier M, Roulle A, Winter T, Bertil D (2013) Armagedom—a tool for seismic risk assessment illustrated with applications. J Earthq Eng 17(2):253–281
Smets B, d’Oreye N, Kervyn F, Kervyn M, Albino F, Arellano SR, Bagalwa M, Balagizi C, Carn SA, Darrah TH, Fernandez J, Galle B, Gonzalez PJ, Head E, Karume K, Kavotha D, Lukaya F, Mashagiro N, Mavonga G, Norman P, Osodundu E, Pallero JLG, Prieto JF, Samsonov S, Syauswa M, Tedesco D, Tiampo K, Wauthier C, Yalire MM (2014) Detailed multidisciplinary monitoring reveals pre- and co-eruptive signals at Nyamulagira volcano (North Kivu, Democratic Republic of Congo). Bull Volcanol 76(1):787
Smolka A, Siebert A (2013) Remote sensing and earthquake risk: a (re) insurance perspective. Nat Hazards 68(1):211–212
Spence RJS, Kelman I, Baxter PJ, Zuccaro G, Petrazzuoli S (2005) Residential building and occupant vulnerability to tephra fall. Nat Hazards Earth Syst Sci 5(4):477–494
Stammer D, van de Wal RSW, Nicholls RJ, Church JA, Le Cozannet G, Lowe JA, Horton BP, White K, Behar D, Hinkel J (2019) Framework for high-end estimates of sea-level rise for stakeholder applications. Earths Future, 7:923–938
Steen M, Kuijt-Evers L, Klok J (2007) Early user involvement in research and design projects—a review of methods and practices. In: 23rd EGOS colloquium, pp 1–21
Stephens SA, Bell RG, Lawrence J (2018) Developing signals to trigger adaptation to sea-level rise. Environ Res Lett 13:104004
Surono, Jousset P, Pallister J, Boichu M, Buongiorno MF, Budisantoso A, Costa F, Andreastuti S, Prata F, Schneider D, Clarisse L, Humaida H, Sumarti S, Bignami C, Griswold J, Carn S, Oppenheimer C, Lavigne F (2012) The 2010 explosive eruption of Java’s Merapi volcano-A ‘100-year’ event. J Volcanol Geoth Res 241:121–135
Tan M, Li X, Li S, Xin L, Wang X, Li Q, Li W, Li Y, Xiang W (2018) Modeling population density based on nighttime light images and land use data in China. Appl Geogr 90:239–247
Taubenbock H, Post J, Roth A, Zosseder K, Strunz G, Dech S (2008) A conceptual vulnerability and risk framework as outline to identify capabilities of remote sensing. Nat Hazards Earth Syst Sci 8(3):409–420
te Brake B, Hanssen RF, van der Ploeg MJ, de Rooij GH (2013) Satellite-based radar interferometry to estimate large-scale soil water depletion from clay shrinkage: possibilities and limitations. Vadose Zone J. https://doi.org/10.2136/vzj2012.0098
Tellez-Arenas A, Quique R, Boulahya F, Le Cozannet G, Paris F, Le Roy S, Dupros F, Robida F (2018) Scalable interactive platform for geographic evaluation of sea-level rise impact combining high-performance computing and WebGIS Client. In: Serrao-Neumann S, Coudrain A, Coulter L (eds) Communicating climate change information for decision-making. Springer, Cham, pp 163–175
Thierry P, Stieltjes L, Kouokam E, Ngueya P, Salley PM (2008) Multi-hazard risk mapping and assessment on an active volcano: the GRINP project at Mount Cameroon. Nat Hazards 45(3):429–456
Tote C, Patricio D, Boogaard H, van der Wijngaart R, Tarnavsky E, Funk C (2015) Evaluation of satellite rainfall estimates for drought and flood monitoring in Mozambique. Remote Sens 7(2):1758–1776
Tralli DM, Blom RG, Zlotnicki V, Donnellan A, Evans DL (2005) Satellite remote sensing of earthquake, volcano, flood, landslide and coastal inundation hazards. ISPRS J Photogramm Remote Sens 59(4):185–198
Tramutoli V, Aliano C, Corrado R et al (2013) On the possible origin of thermal infrared radiation (TIR) anomalies in earthquake-prone areas observed using robust satellite techniques (RST). Chem Geol 339:157–168. https://doi.org/10.1016/j.chemgeo.2012.10.042
Tronin AA (2000) Thermal IR satellite sensor data application for earthquake research in China. Int J Remote Sens 21:3169–3177. https://doi.org/10.1080/01431160050145054
Tronin AA (2010) Satellite remote sensing in seismology. A Review. Remote Sens 2:124–150. https://doi.org/10.3390/rs2010124
United Nations (2005) Hyogo framework for action 2005–2015: building the resilience of nations and communities to disasters, world conference on disaster reduction, 18–22 January 2005, Kobe, Hyogo. https://www.unisdr.org/files/1037_hyogoframeworkforactionenglish.pdf. Accessed 1 Mar 2020
United Nations (2015) Sendai framework for disaster risk reduction 2015–2030, third United Nations world conference on disaster risk reduction, 14–18 March 2015, Sendai. https://www.preventionweb.net/files/43291_sendaiframeworkfordrren.pdf. Accessed 1 Mar 2020
Van Westen CJ (2013) Remote sensing and GIS for natural hazards assessment and disaster risk management. In: Schroder JF, Bishop MP (eds) Treatise in geomorphology. Academic Press, San Diego
Vaughan RG, Kervyn M, Realmuto V, Abrams M, Hook SJ (2008) Satellite measurements of recent volcanic activity at Oldoinyo Lengai, Tanzania. J Volcanol Geoth Res 173(3–4):196–206
Voigt S, Kemper T, Riedlinger T, Kiefl R, Scholte K, Mehl H (2007) Satellite image analysis for disaster and crisis-management support. IEEE Trans Geosci Remote Sens 45(6):1520–1528
Voigt S, Giulio-Tonolo F, Lyons J, Kucera J, Jones B, Schneiderhan T, Platzeck G, Kaku K, Hazarika MK, Czaran L, Li SJ, Pedersen W, James GK, Proy C, Muthike DM, Bequignon J, Guha-Sapir D (2016) Global trends in satellite-based emergency mapping. Science 353(6296):247–252
Vousdoukas MI, Mentaschi L, Voukouvalas E, Verlaan M, Jevrejeva S, Jackson LP, Feyen L (2018) Global probabilistic projections of extreme sea levels show intensification of coastal flood hazard. Nat Commun 9:2360
Wang XW, Xie HJ (2018) A review on applications of remote sensing and Geographic Information Systems (GIS) in water resources and flood risk management. Water 10(5):608
Wilkinson MD, Dumontier M, Aalbersberg IJ, Appleton G, Axton M, Baak A, Blomberg N, Boiten JW, da Silva Santos LB, Bourne PE, Bouwman J (2016) The FAIR Guiding Principles for scientific data management and stewardship. Sci Data 3:160018
Wu S, Qiu X, Wang L (2005) Population estimation methods in GIS and remote sensing: a review. GISci Remote Sens 42:80–96
Yu SS, Zhang ZX, Liu F (2018) Monitoring population evolution in china using time-series DMSP/OLS nightlight imagery. Remote Sens 10(2):194
Zakharenkova IE, Shagimuratov II, Tepenitzina NYu, Krankowski A (2008) Anomalous modification of the ionospheric total electron content prior to the 26 September 2005 Peru earthquake. J Atmos Solar Terr Phys 70:1919–1928. https://doi.org/10.1016/j.jastp.2008.06.003
Zhang X, Shen X, Zhao S et al (2014) The characteristics of quasistatic electric field perturbations observed by DEMETER satellite before large earthquakes. J Asian Earth Sci 79:42–52. https://doi.org/10.1016/j.jseaes.2013.08.026
Zubareva ON, Skripal’shchikova LN, Greshilova NV, Kharuk VI (2003) Zoning of landscapes exposed to technogenic emissions from the Norilsk Mining and Smelting Works. Russ J Ecol 34(6):375–380
Zuccaro G, Cacace F, Spence RJS, Baxter PJ (2008) Impact of explosive eruption scenarios at Vesuvius. J Volcanol Geoth Res 178(3):416–453
Acknowledgements
This paper arose from the international workshop on “Natural and man-made hazards monitoring by the Earth Observation missions: current status and scientific gaps” held at the International Space Science Institute (ISSI), Bern, Switzerland, on April 15-18 2019. GLC and MF are supported by the Geohazards Lab and ERA4CS INSeaPTION project (Grant 690462). The authors are grateful to the guest editors Anny Cazenave, Miora Mandea, Jérôme Benveniste, Stephen Belcher and Teodolina Lopez for inviting this paper in this special issue. We thank a number of colleagues who have participated to various geohazards initiatives, especially Daniel Raucoules, Marcello de Michele, Marc Paganini, Sophie Mossoux, Jérôme Salichon, Steven Hosford, John Labrecque and Claudie Carnec. We thank John Douglas and an anonymous reviewer for their constructive review that helped improving the paper significantly.
Author information
Authors and Affiliations
Corresponding author
Additional information
Publisher's Note
Springer Nature remains neutral with regard to jurisdictional claims in published maps and institutional affiliations.
Rights and permissions
Open Access This article is licensed under a Creative Commons Attribution 4.0 International License, which permits use, sharing, adaptation, distribution and reproduction in any medium or format, as long as you give appropriate credit to the original author(s) and the source, provide a link to the Creative Commons licence, and indicate if changes were made. The images or other third party material in this article are included in the article's Creative Commons licence, unless indicated otherwise in a credit line to the material. If material is not included in the article's Creative Commons licence and your intended use is not permitted by statutory regulation or exceeds the permitted use, you will need to obtain permission directly from the copyright holder. To view a copy of this licence, visit http://creativecommons.org/licenses/by/4.0/.
About this article

Cite this article
Le Cozannet, G., Kervyn, M., Russo, S. et al. Space-Based Earth Observations for Disaster Risk Management. Surv Geophys 41, 1209–1235 (2020). https://doi.org/10.1007/s10712-020-09586-5
Received:
Accepted:
Published:
Issue Date:
DOI: https://doi.org/10.1007/s10712-020-09586-5