
Abstract
To better understand pH-dependence of endogenous fluorescence of algae, we employed spectroscopy and microscopy methods, including advanced time-resolved fluorescence imaging microscopy (FLIM), using green algae Chlorella sp. as a model system. Absorption spectra confirmed two peaks, at 400–420 nm and 670 nm. Emission was maximal at 680 nm, with smaller peaks between 520 and 540 nm. Acidification led to a gradual decrease in the red fluorescence intensity with the maximum at 680 nm when excited by 450 nm laser. FLIM measurements, performed using 475 nm picoseconds excitation, uncovered that this effect is accompanied by a shortening of the tau1 fluorescence lifetime. Under severe acidification, we also noted an increase in the green fluorescence with a maximum between 520–540 nm and a shift toward 690–700 nm of the red fluorescence, accompanied by prolongation of the tau2 fluorescence lifetime. Gathered data increase our knowledge on the responsiveness of algae to acidification and indicate that endogenous fluorescence derived from chlorophylls can potentially serve as a biosensing tool for monitoring pH change in its natural environment.
Export citation and abstract BibTeX RIS

Original content from this work may be used under the terms of the Creative Commons Attribution 4.0 licence. Any further distribution of this work must maintain attribution to the author(s) and the title of the work, journal citation and DOI.
Introduction
Natural sensing of changes in variable environmental conditions can provide a very effective tool for monitoring of potential environmental risks, also including changes in the pH. Use of endogenous fluorophores requires no colouring and can easily be employed in living cells and organisms. However, while monitoring fluorescence intensity is often non-specific, fluorescence lifetimes were shown to respond well to changes in the fluorophore environment. For that reason, we opted to test the sensitivity of fluorescence lifetimes to environmental modifications in Chlorella sp. algae.
Algae are aquatic, plant-like organisms ranging from single-cell phytoplankton to large seaweeds that can be found in both freshwater and marine environment, even in snow, anywhere on Earth. The best known are green algae that produce about half of Earth's oxygen. Chlorella sp. belongs to green algae species. Changes in the acidic environment can significantly affect algae functioning. Namely, acid rain is becoming a rising concern, as the dissolution of carbon dioxide in water creates H2CO3 molecules, a weak acid that is causing the rain to be slightly acidic. Previous studies show that environmental pH is significantly affecting different algae [1]. Change in the external pH affects growth, photosynthesis, as well as photosynthetic electron transport [2]. pH has effects on the growth of Chlorella vulgaris [3] and also affects chloroplast photosynthesis [4]. The most of algae function in alkaline lakes and reach optimum growth and the photosynthetic rate at a neutral or alkaline pH. Only a limited number of algae species is acid-resistant [5]. pH variations were shown to induce significant changes in the chlorophyll state of the photosystem II (PSII) membrane [6]. Changes in pH also affect the chlorophyll quenching [7] and chlorophyll states [6]. During photosynthesis, algae employ various Light Harvesting Complexes (LHC) to capture photons from light and transfer energy to Photosystem I and II (reviewed in [8, 9]). LHC antennas bind chlorophylls. Under stress conditions, a sub-group of LHCs is expressed [10] and has been shown to trigger the process of nonphotochemical quenching of the chlorophyll fluorescence [11]. These proteins are mainly activated by high light exposure [12] to tackle the potential oxidative stress, but they were also proposed to sense pH changes in the thylakoid lumen and, at low pH [13–15], switching conformation to activate the quenching process.
Monitoring changes in pH by studying its effect on the algae endogenous fluorescence can provide useful information for natural biosensing. Chlorophyll a, the primary source of endogenous fluorescence, is responsible for photosynthesis [16]. There is a relationship between pH, CO2 and photosynthesis [17]. In sunlight, CO2 decreases and the water becomes more alkaline, while in the dark the opposite occurs [17]. Endogenous fluorescence of chlorophylls, emitted in red and far-red when excited by light, allows gathering information on the health state of the photosynthetic organisms. Sensing systems, based on non-invasive and often remote monitoring of chlorophyll fluorescence [18] can, therefore, provide helpful information about the effect of stress induced by the environmental factors, such as a change in the pH.
Time-resolved fluorescence imaging presents a novel tool for evaluation of the sensitivity of the endogenous fluorophores to their environment in living cells and thus brings potentially very useful information for the examination of changes in response to stress conditions [19, 20]. Mean fluorescence lifetime of chlorophyll was found between 0.22–0.32 ns in sorghum to 0.55–0.64 ns in maize [21], while two fluorescence lifetimes, 0.262 and 0.728 ns, were found in algae [22]. Fluorescence lifetimes for in vivo chlorophyll a using TCSPC were described to be almost monoexponential with 0.490 ns in dark-adapted chlorella, while chloroplast showed a two-component decay of 0.410 ns and at around 1.4 ns [23]. We have previously demonstrated the application of fluorescence spectroscopy and time-resolved microscopy tools to record endogenous fluorescence in the Chlorella sp. algae [24]. We also discussed the potential usability of the endogenous fluorescence as a biosensing tool for tracking algae responsiveness to modulators [25]. Recently, we have tested the cell response of marine algae Dunalliela tertiolecta to laboratory-induced stress with cadmium heavy metal [26].
In the present study, our goal was to evaluate the sensitivity of the endogenous fluorescence to pH using time- and spectrally-resolved microscopy methods in a model organism—the sweet water green algae Chlorella sp. Application of the measurement of endogenous fluorescence of algae combined with advanced spectral pattern-recognition approach [27] can help to create natural biosensors for environmental changes (as described in [25]). Employing time- and spectral resolution, we focused on identifying representative patterns of fluorescence lifetime and spectral changes in the conditions of environmental stress, rather than precisely understand the provenance of each of the resolved lifetime. This approach will be of utmost practical importance for potential in-field biosensing applications.
Material and methods
Samples
Chlorella sp. was gathered from the University of Ss. Cyril and Methodius in Trnava, Faculty of Natural Sciences collection of green algae. The green algae of genus Chlorella sp. were previously isolated from the main drinking water supply. Green algae were cultivated in the Hoagland cultivation medium [28], as described below.
Solutions
The medium was prepared according to [28]; all chemicals needed for the preparation of Hoagland cultivation medium were from Lachema (Czech Republic); the medium contained: NaNO3, CaCl2 . 2 H2O; MgSO4 . 7H2O; K2HPO4 . 3 H2O, KH2PO4, NaCl, H3BO3, FeSO4 . 7H2O, H2SO4, ZnSO4 . 7H2O, MnCl2 . 4H2O; (NH4)6Mo7O24 . 4H2O; CuSO4 . 5H2O, Co(NO3)2. 6H2O, EDTA, KOH.
Other chemicals included NaCl, H2O2 and urea - NH2CONH2 (all from Centralchem), citric acid, sodium bicarbonate - NaHCO3− and dimethylsufoxide - DMSO (all from Sigma-Aldrich).
Instrumentation
pH adjustment and measurement
The pH was verified by the pH meter (Mettler Toledo MP220, USA) and adjusted to different values between 2 and 9 using citric acid and/or sodium bicarbonate - NaHCO3. In control, algae reached between pH 7.8 and 8.8. At least 10 images were studied in each condition, with the summed number of cells in each condition ranging between 500 (low pH) and 1000 (high pH). Environmental modulators capable to change pH were employed, namely 10% H2O2 (pH 5.68, n = 12), 10 mM urea–NH2CONH2 (pH 7.95, n = 12), or 3.5 M NaCl (pH 8.20, n = 6). Using modulators, control cells were at pH 7.80 (n = 36), while citric acid was used to adjust pH 2.06 (n = 9) and NaHCO3 to pH 8.21 (n = 6). Before recording, cells were in solution with variable pH for 20–60 min. All experiments were done at the room temperature.
Absorption and emission spectrofluorimetry
Absorption and fluorescence spectra were recorded on Shimadzu UV-2100 and Horiba-Jobin Yvon SPEX Fluorolog 3–11 spectrometers respectively, with the system's wavelength response correction. The fluorescence spectra were corrected for the wavelength response of the system. Excitation at 375 nm, 488 nm and 633 nm, and emission at 560 nm and 670 nm was employed for measurement of emission and excitation spectra, respectively.
Confocal imaging
Confocal autofluorescence images were gathered with the laser scanning confocal microscope Axiovert 200 using a 16 channel LSM 510 META detector (Carl Zeiss, Germany) equipped with C-Apochromat 40×, 1.2 NA lens. Single cells were excited with the 450 nm single-mode laser diode (Kvant, Slovakia). Channel 1 recorded light with BP 500–550 nm bandpass filter with the pinhole opening of 2.28 AU, while channel 2 detection ranges were 650–710 nm with the pinhole opening of 1.02 AU. Maximal laser power density used for sample excitation was 1580 Wm−2 for 450 nm laser line.
Spectrally-resolved images were taken with 11 nm step between 499–573 nm for the green, 638–713 nm for the red spectral regions, and 477–633 nm for the complete spectrum. The spectra were evaluated in 5 randomly selected images of cells in each condition. Experiments were performed on glass coverslips after algae immobilisation with the polyethylenimine (Sigma-Aldrich, PEI) surfaces (0.2%).
Fluorescence Lifetime Imaging Microscopy (FLIM)
FLIM images were recorded using the time-correlated single-photon counting (TCSPC) technique [20]. In these experiments, a 475 nm picosecond laser diode (BDL-475, Becker&Hickl, Germany) was used. The laser beam was reflected in the sample through an epifluorescence path of the Axiovert 200 LSM 510 Meta (Zeiss, Germany) inverted microscope with C-Apochromat 40×, 1.2 NA lens. The emitted fluorescence was separated from laser excitation using LP 500 nm or BP 650–750 filter and detected by HPM 100–40 photomultiplier and SPC-830 TCSPC board (both Becker&Hickl, Germany). Mean power density at the sample of 475 nm laser used for FLIM experiments was 230 Wm−2, with 20 MHz repetition rate and approx. 60 ps pulse length with < 0.1 pJ/pulse energy.
Irradiation conditions
Illumination conditions were chosen to minimize the effect of laser-induced irradiation on algae. The CLSM experiments were done using the mean local power density of the lasers lower than the power density of solar radiation during daylight at visible wavelengths (400–500 Wm−2). Photon fluence in our conditions was 1.4 × 10¹⁹ photons m−2 s−1 for the blue (450 nm) laser running at 10% of its maximal power, which corresponds to 160 Wm−2 power density at the sample plane of 40×/1.2 objective.
We also studied the irradiation during imaging by laser-induced photobleaching (see supplementary material, figure S1(A) is available online at stacks.iop.org/MAF/8/024007/mmedia). The photobleaching was induced by consecutive scanning using 100% laser power (as opposed to 10% under classical experimental conditions). Following such irradiation, photobleaching induced a clear decrease in the red fluorescence after the 3rd scan (about 1.5 min of exposure). Longer scanning (for up to 10 min) led to an increase in the green fluorescence with longer (around 2 ns) lifetime (supplement figure S1(B)). To prevent such situation, we used the laser only at 10% of its maximal power and we did not perform more than 3 experimental protocols on the same sample. We were therefore convinced that there was a minimum of the effect of irradiation and thus photodamage in the presented results.
Mean power density of the 475 nm laser used in FLIM experiments was comparable to that of CLSM imaging, with corresponding mean photon fluence 2.2 × 10¹⁹ photons m−2 s−1 (5.2 × 10³ photons/pulse). Moreover, due to beam scanning in both CLSM and FLIM imaging regimes, one pixel of the sample was irradiated only for tens of microsecond long period per each second of the experiment. These precautions prevented artefacts related to the effect of irradiation. These results demonstrated that the light exposure under our experimental conditions is unlikely to induce significant irradiation artefacts.
Data analysis
Confocal data were visualized by ZEN 2011 software (Zeiss, Germany). Fluorescence intensity from confocal images was analysed using image segmentation method, where only fluorescence intensities recorded from fluorescing algae (without surrounding background), was measured.
FLIM images were processed using commercially available software package SPCImage (Becker&Hickl, Germany) or using a custom-made software. Results were visualized as a map and as a distribution of calculated fluorescence lifetimes. Intensities are presented as the mean and the standard error of the mean. Decay curves were fitted with a two-exponential fitting model with plausible χ2 using image segmentation and home-made lifetime analysis, as specified in the Result section.
Statistical comparison was done using one-way Anova, with p < 0.05 considered as significant.
Results
Our aim is to discern pattern behaviour of time- and spectrally-resolved characteristics of the endogenous fluorescence of algae to environmental stress to design, in the future, biosensors sensing environmental changes directly in living organisms. In this contribution, we specifically focus on the effect of acidification on behaviour of single cells of green algae Chlorella sp.
Absorption and emission properties of Chlorella sp. endogenous fluorescence
Evaluation of absorption properties, recorded between 300–700 nm revealed the main absorption at 400–450 nm, with a maximum between 400–420 nm and a second peak at 670 nm (figure 1(A) grey). Excitation spectrum was measured at emission 670 nm and recorded between 300–650 nm (figure 1(A) black). It confirmed the absorption measurements, with maximum excitation at wavelengths ranging from ultraviolet (UV) to 450 nm and a second increase above 560 nm. Gathered data were in good agreement with the expected properties of chlorophylls [16].

Figure 1. Fluorescence spectroscopy of endogenous fluorescence of algae Chlorella sp. A) Absorption spectrum at 300–700 nm (grey), compared do excitation spectrum recorded at emission 670 nm (black). B) Emission spectra measured following excitation 375 nm (black), 450 nm (light grey) and 630 nm (dark grey).
Download figure:
Standard image High-resolution imageEmission spectra were recorded at various excitations: 375 nm, 450 and 630 nm (figure 1(B)). Measurements revealed maximum emission of algae at 680 nm, in accordance with the major fluorescence band for the chlorophyll a [29, 30]. Excitation at 375 nm also uncovered a second peak at 420 nm, most likely related to NADPH [31]. In addition, blue excitation at 450 nm stimulated weak emission with a maximum at 540 nm, possibly linked to NADPH-related flavins, flavonoids, carotenoids and/or phenolic plant substances [32].
Recording of endogenous fluorescence intensity in Chlorella sp
To record endogenous fluorescence in Chlorella sp. algae, we have employed confocal imaging following excitation at 450 nm at two emission windows based on absorption and emission properties recorded at figure 1. The emission window of 500–550 nm of the channel 1 was designed to record the green fluorescence, while the emission window of 650–710 nm of the channel 2 was chosen to record the red chlorophyll fluorescence (figure 2(A)). It is important to precise that the intensity in the green channel was very low; consequently, the pinhole for the green channel was set to 2.28 AU (Versus 1.02 AU for the red channel), to read comparable intensities on both channels. In order to take into consideration the fluorescence from individual algae only, an image segmentation method was employed. Channel 3 served to monitor algae appearance in transmission. The contour of the cells, estimated by image segmentation, reached between 9–10 μm, with the cell surface averaging between 9–11 μm2 (supplement figure S2), indicating that the diameter of the cells was under 4 μm. Such a small size of the algae did not allow demonstration of the spatial differences in the distribution of the two sources (green and red) of endogenous fluorescence.
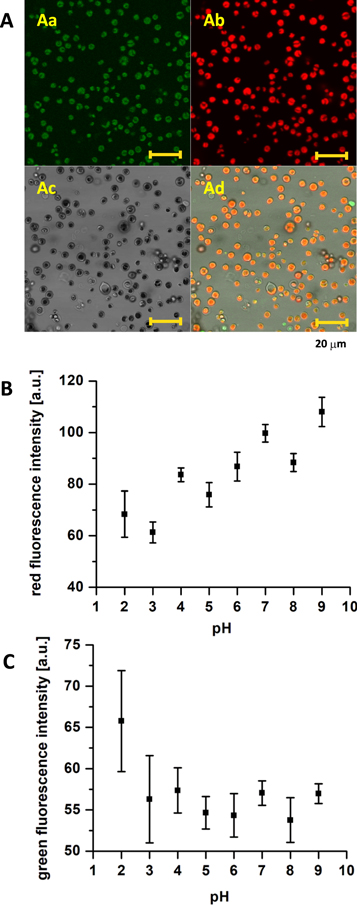
Figure 2. Fluorescence microscopy of endogenous fluorescence of algae Chlorella sp. A) Image recorded by laser scanning confocal microscopy in control conditions, excitation 450 nm. Emission: Aa) channel 1: 500–550 nm, Ab) channel 2: 650–710 nm, Ac) channel 3: transmission image, Ad) channel 4: overlay of channels 1–3; scale 20 μm. B, C) pH dependence of endogenous fluorescence of Chlorella sp. algae gathered by excitation at 450 nm, analysed using image segmentation method at the emission of B) 650–710 nm (channel 2), C) 500–550 nm (channel 1).
Download figure:
Standard image High-resolution imageTo evaluate the spectrum of the red fluorescence, we recorded confocal images at separate fluorescence wavelength between 638 nm and 713 nm using an 11 nm step (figure 3(A)). The red fluorescence peaked at 680 nm (figure 3(C)), corresponding well to the fluorescence of chlorophyll a [30]. An attempt to record the green fluorescence separately from the red one (supplement figure S3(A)–(C)), unmasked fluorescence peaking between 520–540 nm. These data were in agreement with our previous recordings of endogenous fluorescence in the algae Chlorella sp. [24, 25]. In the latter study, we showed that the green fluorescence increases in the presence of stress conditions, such as chemical bleaching by sodium hypochlorite (SAVO).
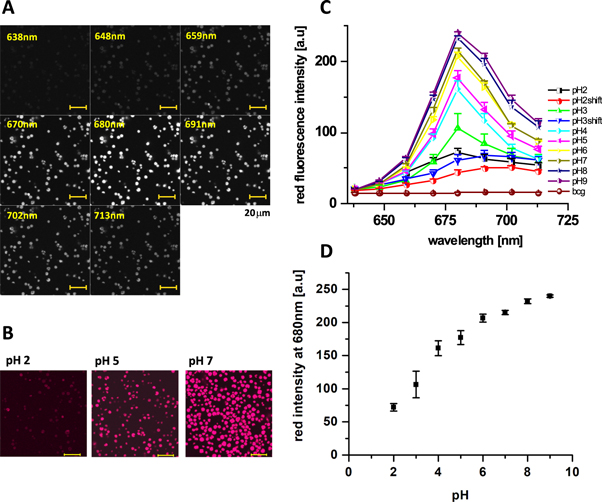
Figure 3. Spectrally-resolved images of endogenous fluorescence of Chlorella sp. algae. (A) Original images gathered by excitation at 450 nm with 11 nm step between 638–713 nm. (B) pH dependence of spectrally-resolved images of the red endogenous fluorescence of Chlorella sp. algae between 638–713 nm (composite image, scale: 20 μm). (C) Spectra of the red fluorescence recorded at various pH (bcg corresponds to the background, shift to cells with observed shifted spectra). Not corrected for background. (D) pH dependence of intensity at 680 nm, gathered from spectra recorded at C.
Download figure:
Standard image High-resolution imageRecordings and measurements of fluorescence lifetimes of Chlorella sp
FLIM images, recorded by TCSPC, were employed to gather fluorescence lifetimes following excitation by 475 nm picoseconds laser (figures 4Aa). The analysis was performed using a custom-made approach, to allow automatization of the procedure in varying experimental conditions. Measured FLIM images were firstly segmented to delineate boundaries and pixels belonging to each chlorella body in the image, comparably to approach employed for fluorescence evaluation. Segmentation was done using simple Otsu thresholding approach [33] on the fluorescence intensity image that was built by summation of fluorescence signal across all time channels of corresponding FLIM image. Segmented intensity image was further used to construct a binary image mask that enables to sum decay signals corresponding to pixels of individual chlorella body for each chlorella object in the image. Final summed decay signals were then analysed with two-component multi-exponential model separately for each chlorella object in image and results were presented as average values from all the chlorella bodies found in image. Data fitting was done using custom software exploiting open source NLOPT library [34]. As an instrument response function in data fitting procedure, the synthetic IRF function produced by SPCImage software (Becker Hickl, Germany) was used. Example of the employed custom-made fit (figures 4Ba), as opposed to a fit performed using commercially available SPCImage software (Becker Hickl, Germany, supplement figure S4 and table S1) shows a good correlation between the two approaches; main difference concerns the fitting of a very low number of photons with long lifetimes.

Figure 4. Fluorescence lifetime imaging microscopy (FLIM) of endogenous fluorescence of Chlorella sp. (A) FLIM image showed in the range 200–1200 ps in control condition recorded using Aa) LP500 filter or Ab) BP650-750 filter (b) following excitation at 475 nm. (B) Example of fitting of the measured fluorescence decay by a custom-made software (original data: black points, fitted curve: red line) (a). Comparison of fluorescence decays in chosen individual cells at different pH (b).
Download figure:
Standard image High-resolution imageTo analyse gathered data, the double-exponential analysis was used. The choice of the number of fluorescence lifetimes was based on the best χ2 in most of the recorded experimental conditions. Such choice was not an easy issue. When our approach was compared to a commercially available one in a randomly selected Chlorella sp. cell, we reached good agreement with resolved tau/a (see Supplement table S1). We tested also the possibility to resolve data using analysis by 3 exponentials. However, the number of photons was not sufficient for using 3 exponential analysis in all samples and also, in most cells, 3 exponentials did not give better χ2. That is why we have decided to employ a 2-exponential decay to analyse data gathered in this study.
To record FLIM images (figures 4Aa), we employed an LP500 filter. The choice of the filter was done to block the excitation laser of 475 nm and, at the same time, to accumulate a maximum of photons. We tested also the use of BP 650–750 (figures 4Ab), which lead to a decrease in the number of photon counts, without a change in the a1/a2 and slight, but not a significant increase in the two fluorescence lifetimes. Such lifetime increase could be related to many effects, including blocked green emission, better suppression of the excitation light and lowering of the fluorescence intensity when recordings were performed in the presence of the red filter. The number of photons in the trace of the presented images reached 32–42 000 when using the green filter (figures 4Aa), but when using the red filter, the number of photons in the trace was only 22–32 000 (figures 4Ab). This result, together with the one gathered by measurements of spectral characteristics (figure 3(C)) indicates that 2/3 of the fluorescence recorded in control FLIM images were derived from photons with a wavelength between 650–750 nm, which correspond to chlorophylls, namely chlorophyll a. However, in conditions when the red fluorescence was inhibited and rise in the green fluorescence occurred, the green fluorescence could also contribute to the resolved lifetimes in FLIM images recorded using LP500.
At the same time, it is important to reiterate that we aimed to find the behavioural pattern of the endogenous fluorescence lifetimes in the presence of stressors, not to resolve individual components related to specific pigments. Presented lifetime analysis was therefore mainly intended to obtain 'pattern-like' information on the potential change of the lifetime map in different environmental conditions than to precisely discern individual pigments based on their specific lifetime.
pH-dependence of Chlorella sp. endogenous fluorescence intensity
We have then evaluated changes in the acidic and basic environments. Sodium bicarbonate is crucial for the functioning of PSII, but not PSI [35]. On the other hand, a very acidic environment shuts down the PSII [36]. The pH was adjusted to specific values between 2 and 9, with a step of 1, using citric acid and/or sodium bicarbonate. For statistical comparisons, fluorescence intensity from confocal images was analysed using an image segmentation method, as mentioned in the Data analysis. We recorded a gradual decrease in the red fluorescence (figure 2(B)). Although gathered measurements point to a quasi-linear relationship of the red fluorescence decrease with pH, with only n = 8 different pH studied there were not enough points for more advanced analysis. It was therefore not possible to conclude on the curve's precise shape. In this regard, it is also important to take into consideration that pH scale itself is logarithmic. Green fluorescence was stable (figure 2(C)); significant increase could only be observed at very acidic pH of 2. Neither the contour nor the area of the cells was significantly affected by the short-term exposure of cells to the pH change (supplement figure S2(A) and S2(B). We previously described a differential sensitivity of the two components of endogenous fluorescence to severe stress conditions, namely active sodium hypochlorite [25]. The lack of increase in the green fluorescence at acidic pH down to pH 3 indicates a good resistance of the algae to the short-term exposure to low pH.
Red fluorescence spectra, recorded between 638 nm and 713 nm (figure 3(C)), showed a gradual decrease in the fluorescence at 680 nm, suggesting an involvement of the same molecular species in the acidification process. Interestingly, at pH 2 and 3 we recorded also cells in which the red fluorescence peaked at 690–700 nm (named as 'shift' at figure 3(C)), instead of 680 nm. Although it is well demonstrated that most of the chlorophyll a fluorescence come from PSII emitting at 685 nm [30], the existence of the weak fluorescence at 693–695 nm arising from PSI system was also shown [37, 38]. When recorded at a maximum of 680 nm, we observed a gradual decrease in the fluorescence intensity with the pH (figure 3(D)). Observed fluorescence thus suggest a gradual shut down of the PSII at low pH.
Green fluorescence spectra (supplement figure S3(C)), measured between 499–573 nm, showed two peaks: first at 510–520 nm and second at 540 nm. We noted little effect under acidification; only at pH 2 a significant increase in the green fluorescence was recorded at all studied wavelength, suggesting a possible damage to the cell at very acidic pH.
pH-dependence of Chlorella sp. endogenous fluorescence lifetimes
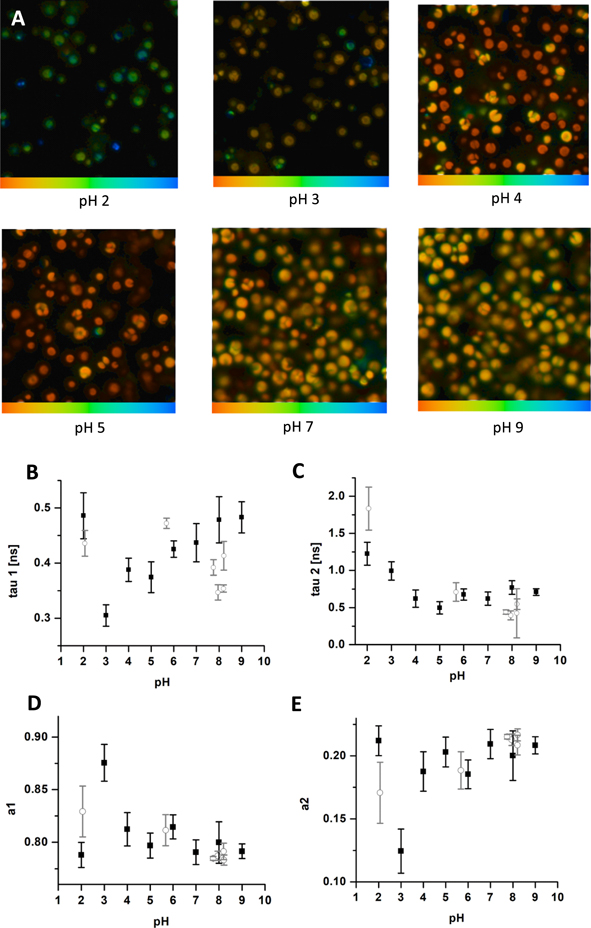
When FLIM data were sorted as a function of pH in individual conditions, we have observed a decrease in the fluorescence intensity following acidification (figures 4(A) and 5(A)). Tau 1 fluorescence lifetime presented shortening (figure 5(B) black) in a quasi-linear way. At pH 2, a possible contamination with another fluorescence species (most likely bound flavoproteins) can be assumed. For tau 2, the values did not show the significant change (figure 5(C)); only at pH 3 and 2, we have recorded a significant rise in the tau 2 (possibly due to appearance of free flavoproteins). This effect was accompanied by a little effect on the amplitudes (figures 5(D), (E)), although an increase in a1 and a decrease in a2 can be noted at pH 3.
Figure 5. FLIM images of endogenous fluorescence of Chlorella sp. by excitation 475 nm, LP 500 nm. (A) FLIM images showed in the range 200–1200ps in different pH. Distribution of fluorescence lifetime (B) tau 1, (C) tau2 and fluorescence amplitudes (D) a1, (E) a2 in different pH. Modulation in the presence of variable pH (black squares) and different pH modulators (grey circles) is presented.
Download figure:
Standard image High-resolution image
We wanted also to see whether this effect could be induced by other pH regulators, such as H2O2, urea or NaCl (as specified in Material and Method section), capable of inducing variations of ionic environment, such as active oxygen and nitrogen. We have observed good correlation for the data for a1, a2, as well as tau2 (figures 5(C)–(E)) grey). In the case of tau1 (figure 5(B) grey), we assumed that a faster decrease in the fluorescence lifetime in the presence of urea and NaCl at pH 7.95 and pH 8.2 indicated either the effect of sodium bicarbonate and/or that other factors (such as oxidative changes in the presence of H2O2, etc) additionally affect the cells.
In conclusion, taking into consideration that 1) the major contribution to the recorded fluorescence comes from the red spectral region, as well as that 2) the gradual decrease in this fluorescence was observed with pH and that 3) it was accompanied by shortening of the tau 1, all suggested that the tau 1 fluorescence lifetime could be most likely attributed to the chlorophylls of the PSII. Shortening of the tau1 in the presence of acidification was in agreement with gradual shutting down of the PSII in this condition [36]. On the other hand, prolongation of the longer lifetime in severe acidification can, at least in part, explain the rise in the green fluorescence observed in this condition. However, the shift of the red spectra towards 690 nm in pH 2 and 3 suggests that the contribution of photons of the chlorophyll a with longer lifetimes cannot be excluded [39, 40].
Discussion
Data presented in this paper demonstrated the sensitivity of the endogenous fluorescence intensity and its fluorescence lifetimes to acidification in Chlorella sp. algae, naturally presented in drinking water that is capable of photosynthesis. The main aim of the study was to test the possible use of the endogenous fluorescence of living algae to create natural biosensors for environmental changes (a concept described in [25]). We therefore mainly aimed to identify a 'pattern' of a spectral and time-resolved fluorescence changes in the conditions of environmental stress, rather than precisely understand the provenance of each of the resolved lifetime. We demonstrated that short-term exposure to acidification resulted in lowering of the red fluorescence associated with shortening of the fluorescence lifetime tau1. In severe acidification conditions, increase in the green fluorescence, a shift of the red fluorescence and prolongation of the fluorescence lifetime tau 2 was also present.
Fluorescence recorded under our experimental condition was derived mainly from pigments of the photosystem II (PSII), namely chlorophylls. Chlorophylls are light-absorbing pigments present naturally in all plants [16]. The main forms of chlorophyll in plants and algae are chlorophyll a and chlorophyll b, other pigments include xanthophylls and beta-carotenes. These highly conjugated compounds are capable to capture light energy in the form of radiation and subsequently, in a series of transfers to other molecules and complexes, to convert it into chemical energy in the form of ATP. Chlorophyll fluorescence is, therefore, a highly valuable non-destructive intrinsic probe of several aspects of oxygenic photosynthesis sensitive to change in the functional state of the algae, as well as plants [30]. This knowledge can be useful for evaluation of water pollution, allowing reliably monitoring of water quality, as well as for better comprehension of the efficient solar energy capture mechanisms. Chlorophyll a fluorescence is heterogeneous, but its major fluorescence emission band at 680–685 nm and its vibrational satellite at 720–735 nm is considered to be originating mostly in the PSII antenna complexes [29, 30]. When PSII reaction centres are closed, the existence of the weak fluorescence at 693–695 nm was shown by Krey and Govindjee [37, 38], arising from the PSI system, related to a transfer between chlorophyll a molecules in PSI and LHC [41]. These longer emission wavelengths were proposed to originate from a long-wavelength form of chlorophyll a rather than from vibrational bands [42]. Consequently, most of the chlorophyll a fluorescence (around 90%) comes from PSII, with the emission bands at 680–685 nm [30]. Endogenous fluorescence recorded in living Chlorella sp. algae cells is in agreement with these observations. Using silica gel chromatography measurements we demonstrated previously [24] that main endogenous pigment in the Chlorella sp. algae is related to the chlorophyll a; other bands corresponding to chlorophyll b and carotenoids were also found. As a result, we conclude that the main fluorescence recorded in Chlorella sp. under our experimental conditions was derived from that of the chlorophyll a.
Fluorescence lifetime recording is a very powerful measurement of molecular parameters at the biological level. Fluorescence lifetime depends on multiple factors: pH, temperature, oxygenation, density, presence or absence of quenchers, etc [reviewed in 43]. Our previous results demonstrated that time-resolved emission micro-spectroscopy allows fast and reproducible measurements of complex patterns of spectrally-resolved fluorescence decays directly in living cells [44]. Monitoring fluorescence lifetimes is particularly advantageous when studying the responsiveness of the system to changes in its environment while remaining independent of fluorescence intensity and/or photobleaching [19]. In living organisms, using picosecond excitation, the fluorescence lifetime of chlorophyll a was described under normal conditions in a vast range of values, often including a, short lifetime' between 250–600 ps and a, long lifetime' between 700–1600 ps [22, 39, 40, 45]. In the in vitro conditions, fluorescence lifetimes of chlorophyll a/b proteins were shown to have much longer lifetimes than in living cells and responded to the aggregation of monomeric forms [46]. We have demonstrated that the fluorescence lifetime of chlorophyll a band, isolated by chromatography from the Chlorella sp. algae, reached monoexponential fluorescence decay of 4 ns following excitation by 633 nm ps laser, which is much longer than that recorded directly in living cells [47]. For that reason, only measurements performed directly in living cells were considered.
The choice of the right analysis to evaluate corresponding lifetimes in living organisms is not an easy issue. We decided to employ a double exponential decay to study patterns of the fluorescence lifetime change and we recorded shortening of the tau 1 fluorescence lifetime, corresponding to the decrease in the red fluorescence, as well as, in severe acidification, the prolongation of the tau2, which corresponded to the rise in the green fluorescence and/or in the red fluorescence shifted towards 690 nm. Under our experimental conditions, using 2 exponential decays, tau1 turned out to be the most sensitive parameter, correlating with a decrease in the fluorescence intensity. The amplitude a1 corresponding to this lifetime represented a major (80%–90%) contribution. The tau 2 had lower contribution and was often close to noise values. We, therefore, consider the main result of our study the pH-sensitivity of the tau1 fluorescence lifetime. At the same time, it is important to note that these changes were relatively small and their possible use for biosensing still needs to be further tested, particularly by also exploring long-term exposure of algae to different pH conditions.
In addition to the chlorophyll fluorescence, we observed also the presence of much lower, but sustained green/yellow fluorescence. Previously, the blue-green fluorescence (BGF) was described in isolated chloroplasts, where it showed a reversible increase of BGF when illuminated with light, and it has been proposed that this light-induced variation of chloroplast BGF is completely NADPH dependent [48, 49]. Energy transfer from proteins to NADPH in chloroplasts was proposed to affect fluorescence lifetimes [50, 51]. In our experiments, green/yellow fluorescence stimulated by excitation at 450 nm was most pronounces between 510–550 nm. Observed green/yellow fluorescence can, therefore, be derived from NADPH-related flavins and flavonoids, presence of carotenoids [52], or lipid accumulation [53], but can also result from degradation products. This fluorescence can affect the measurement of chlorophyll fluorescence only under conditions of a very low red fluorescence, either due to bleaching or in conditions where chlorophyll fluorescence is inhibited. We previously observed an increase in this fluorescence under conditions of severe stress during chemical photobleaching in the Chlorella sp. algae [25]. Also, laser-induced photobleaching leads to an increase in the green fluorescence associated with the prolongation of the tau2 fluorescence lifetime (supplement figure S1). For this reason, we assume that the green fluorescence could contribute to the tau 2 lifetime and, namely in conditions when the red fluorescence is quenched, also partially to the tau 1. In this study, we also confirmed a rise in this fluorescence, but only under severe acidification at pH 2.
Testing algae responsiveness to acidification arises from the fact that endogenous fluorescence in algae and lower plants is sensitive to environmental pollution that includes pH changes. Most algae thrive and multiply in water with high pH levels ranging between 7 and 9, with optimum pH for most algae species at 8.2 to 8.7. Neutral or lower water pH decreases the growth of algae. The photosynthetic rates of marine algae were estimated to be highest above 8; however, in a large number of red, brown and green algae the rate decreased at pH 9.5 and higher [54]. At such pH, the HCO3- ions were unable to penetrate the cells and were therefore unavailable for photosynthesis. When measured at various pH, PSII electron flow was inhibited at pH 6.5 at a high light intensity, while at low light the inhibition occurred at pH 9.5 [36]. This observation was explained by substrate (CO2) limitation at alkaline pH. In the process of photosynthesis, carbon-fixing enzymes function optimally at pH 8; consequently, raising or lowering the pH from 8 negatively influences the rate of photosynthesis. At too high or too low pH levels, the enzymes in the plant can denature, stop working, or slow down - they can no longer carry out photosynthesis in the cell to their full potential.
Temporal characteristics of chlorophyll fluorescence were proposed to be a biomarker for the changing environment, such as Cd toxicity [55], in algal cells and we thus aimed to test the potential use of the algae endogenous fluorescence lifetimes in biosensing. Following water stress in plants, shortening of the chlorophyll fluorescence lifetime was noted from 1 ns to 0.45 ns [56]. On the other hand, the lifetime prolongation is in agreement with the reaction of chlorophyll a to stress conditions [22, 31], namely UV-induced stress. Our results pointed to shortening of the fluorescence lifetime tau1 with pH. In photosynthesis, the light energy absorbed by chlorophyll is utilised in the oxidation-reduction process against a gradient of chemical potential. Change in the pH affects this homeostasis by shutting down the PSII [36]. The decrease in red fluorescence at low pH is most likely resulting from inhibition of the PSII and/or decrease in the photosynthesis rate. This conclusion is also supported by the observed red-spectral shift from 680 nm to 690–700 nm in the conditions of severe acidification, which also points to shut down of PSII. Other stressors leading to modulation of pH revealed comparable effects on a1, a2 and tau 2. In the case of tau1, their effect was stronger, possibly due to their other action on the oxidation of cells, etc.
We hypothesize that quenching due to shutting down of the PSII during acidification is the possible mechanism involved. Stress-related LHCs, which serves as feedback mechanisms that dissipate excess photoexcitation and avoid detrimental oxidative stress, are also capable of sensing pH variations and reversibly tune its conformation from light-harvesting state to a dissipative one. For example, in green algae Chlamydomonas reinhardtii, stress-related LHCs were shown to sense pH variations - the conformational change is induced only by acidification of the environment and the size of the quenching correlates with the degree of acidification [14]. Stress-related LHCs are present in green algae and we previously demonstrated their role in cadmium-induced stress responses in sea algae Dunaliella [26]. We, therefore, believe that a comparable mechanism can also take place under our experimental conditions in Chlorella sp. In the Chlamydomonas, a sensor of the luminal pH was found in C-terminal subdomain, capable of tuning the quenching level of the complex [14]. In this case, the quenching was accompanied by a shortening of the fluorescence lifetime. The comparable situation can also occur under our experimental conditions. Gathered results support the idea of the quenching mechanism taking place during the acidification, resulting in the shortening of the fluorescence lifetimes and thus the decrease in the fluorescence amplitude. This process is quasi-linear until pH 4, most likely due to a gradual change in the number of molecules affected. Under pH 4, another process is also u nmasked, as demonstrated by the spectral shift in the red fluorescence, as well as the rise in the green fluorescence, accompanied by the prolongation of tau 2. In this case, as most of the molecules responsible for the red fluorescence are quenched, the presence of the green or the shifted red fluorescence prevails.
Performed experimentation acknowledges the employment of the time-resolved chlorophyll fluorescence in biosensing. Our results also revealed good resistance of the Chlorella sp. algae to short-term exposure to acidification. In the future, long-term effects (in terms of days or weeks) need also to be tested. The sensitivity of the fluorescence lifetimes to various environmental stressors should be further analysed. Simultaneous time and spectrally-resolved measurements are suitable to uncover a clear relationship between the spectra and the corresponding lifetimes. Pattern recognition [27], using different variables which include intensity, spectral and lifetime changes, need to be employed in varying experimental conditions before concluding on the potential use of the chlorophyll endogenous fluorescence as a potential biosensor in the future.
Conclusions
In conclusion, our data revealed the sensitivity of the endogenous fluorescence intensity and its lifetimes to acidification in the Chlorella sp. algae. We demonstrated the advantage of employing the time-resolved fluorescence measurements for non-invasive evaluation of the responsiveness of endogenous fluorescence to varying environmental conditions. The use of FLIM measurements to monitor chlorophyll endogenous fluorescence of algae cells in water environment can thus provides a complementary aspect to the imaging spectroscopy. FLIM signals allow non-invasive and immediate detection of the fluorescence sensitive to the cell environment–without sensitivity to photobleaching or intensity variations. Presented work thus demonstrates a novel approach on how to employ the multimodal imaging of endogenous fluorescence as a potential natural pH biosensor in the future.
Acknowledgments
This publication was supported by Slovak Research and Development Agency under the contract APVV-15-0227, as well as the Grant Agency of the Ministry of education, science, research and sport of the Slovak Republic under contract No. VEGA 2/0123/18. This project has received funding from the European Union's Horizon 2020 research and innovation programme under grant agreement no 871124 Laserlab-Europe V. The authors thank M. Valica from FPV UCM for helping with the cultivation of Chlorella sp, M. Danisova for helping with the original experimentation.
Conflict of interest
None declared, Ethical approval: none applicable.