


Type 2 diabetes is a multicomplex, heterogenic disease with a pathophysiology characterized by insulin resistance and β-cell dysfunction (Kahn et al., Reference Kahn, Cooper and Del Prato2014). Diabetes is diagnosed using specific criteria for plasma glucose (PG) concentrations either during fasting [fasting plasma glucose (FPG) ≥7 mmol/l] or at 2 h (PG ≥11.1 mmol/l) during an oral glucose tolerance test (OGTT; American Diabetes Association, 2019). However, the change in PG concentrations from healthy to the development of type 2 diabetes is a continuous process, where increases in glucose concentrations even within the normal range are found to relate to long-term risk for type 2 diabetes (Faerch et al., Reference Faerch, Witte, Tabak, Perreault, Herder, Brunner and Vistisen2013; Hulsegge et al., Reference Hulsegge, Spijkerman, van der Schouw, Bakker, Gansevoort, Smit and Verschuren2017; Malmstrom et al., Reference Malmstrom, Walldius, Carlsson, Grill, Jungner, Gudbjornsdottir and Hammar2018; Tabak et al., Reference Tabak, Jokela, Akbaraly, Brunner, Kivimaki and Witte2009). Recent studies have demonstrated that not only the FPG and the 2-h PG values indicate the future risk of diabetes but also the intermediate glucose concentrations during the OGTT, and hence the shape of the glucose response curve may predict the risk in subjects initially free from diabetes (Abdul-Ghani et al., Reference Abdul-Ghani, Lyssenko, Tuomi, Defronzo and Groop2010; Hayashi et al., Reference Hayashi, Boyko, Sato, McNeely, Leonetti, Kahn and Fujimoto2013; Hulman, Gujral et al., Reference Hulman, Gujral, Narayan, Pradeepa, Mohan, Anjana and Witte2017; Hulman, Simmons, Vistisen et al., Reference Hulman, Simmons, Vistisen, Tabak, Dekker, Alssema and Faerch2017; Hulman et al., Reference Hulman, Vistisen, Glumer, Bergman, Witte and Faerch2018). Hulman and colleagues have shown that there is considerable heterogeneity in the glucose response curves, and they demonstrated using latent class modeling that four or five specific latent classes of OGTT curve pattern appear, each associated with specific cardiometabolic risk profiles as well as future diabetes risk (Hulman, Gujral et al., Reference Hulman, Gujral, Narayan, Pradeepa, Mohan, Anjana and Witte2017; Hulman, Simmons, Vistisen et al., Reference Hulman, Simmons, Vistisen, Tabak, Dekker, Alssema and Faerch2017; Hulman et al., Reference Hulman, Vistisen, Glumer, Bergman, Witte and Faerch2018). However, it is somehow uncertain what affects a person’s classification or ‘belonging’ to one of the classes of the OGTT curve patterns, although it is also clearly related to age, body mass index (BMI) and other cardiometabolic risk factors as demonstrated in the previous studies (Hulman, Gujral et al., Reference Hulman, Gujral, Narayan, Pradeepa, Mohan, Anjana and Witte2017; Hulman, Simmons, Vistisen et al., Reference Hulman, Simmons, Vistisen, Tabak, Dekker, Alssema and Faerch2017; Hulman et al., Reference Hulman, Vistisen, Glumer, Bergman, Witte and Faerch2018).
Nevertheless, genetic variation has been reported associated with both fasting glucose (Dupuis et al., Reference Dupuis, Langenberg, Prokopenko, Saxena, Soranzo, Jackson and Pramstaller2010; Morris et al., Reference Morris, Voight, Teslovich, Ferreira, Segre, Steinthorsdottir and McCarthy2012) and 2-h PG after OGTT (Saxena et al., Reference Saxena, Hivert, Langenberg, Tanaka, Pankow, Vollenweider and Watanabe2010). Also, we and others have demonstrated using twin studies that fasting as well as 2-h glucose levels are heritable, ranging from 12% to 62% (Liu et al., Reference Liu, Riese, Spector, Mangino, O’Dell, Stolk and Snieder2009; Schousboe et al., Reference Schousboe, Visscher, Henriksen, Hopper, Sorensen and Kyvik2003), with a common set of genetic factors influencing them both (Liu et al., Reference Liu, Riese, Spector, Mangino, O’Dell, Stolk and Snieder2009).
We therefore speculated whether genetic variation, to some extent, could explain the heterogenic glucose response curve patterns and thus aimed to investigate the relative contribution of genetic and environmental factors for OGTT curve patterns using a twin design.
Materials and Methods
Study Population
The GEMINAKAR cohort was initiated in 1997 as an observational, prospective twin cohort study of 756 complete twin-pairs, aged 18–67 years, recruited from the nationwide population-based Danish Twin Registry during 1997–2000 as previously described (Pedersen et al., Reference Pedersen, Larsen, Nygaard, Mengel-From, McGue, Dalgard and Christensen2019; Schousboe et al., Reference Schousboe, Visscher, Henriksen, Hopper, Sorensen and Kyvik2003). To be included in the GEMINAKAR cohort, both twins in a pair had to be willing to participate. Also, the twins had to be without known diabetes or cardiovascular disease, be able to make a progressive maximal bicycle test and not be pregnant or breastfeeding.
The participants were followed up between 2010 and 2012, irrespective of whether both twins in a pair were able to or wanted to participate in the follow-up. A total of 1139 (∼79%) gave consent to participate with clinical examination in the follow-up.
At baseline, the participants underwent a standardized OGTT described below. Furthermore, at both baseline and follow-up, the participants went through a clinical examination, including anthropometric measurements and fasting blood sampling, and answered questionnaires regarding dietary habits, lifestyle and socioeconomic factors. Finally, the participants reported whether they were diagnosed with diabetes mellitus and cardiovascular disease by their physician.
For the current investigation, we excluded those with previously diagnosed diabetes (self-reporting a physician diagnosis of diabetes in questionnaire) or screen-detected diabetes (blood glucose ≥ 6.1 mmol/l or 2-h blood glucose ≥ 11.1 mmol/l; Alberti & Zimmet, Reference Alberti and Zimmet1998) based on the OGTT. Our study population was thus limited to 1455 twins who had valid data from the OGTT and were without diabetes at baseline.
All participants gave written informed consent both at baseline and follow-up. The study was approved by the regional Health Research Ethics Committee of the Region of Southern Denmark (baseline, S-VF-19970271; follow-up, S-20090065) and the SDU Research & Innovation Organisation, in compliance with the General Data Protection Regulation (17/50526).
Assessment of OGTT
At baseline, the twins in a pair were examined at the same day. They underwent a standardized 2-h 75-g OGTT in the morning between 8:00 and 11:00 am after a 10- to 12-h overnight fast (Schousboe et al., Reference Schousboe, Visscher, Henriksen, Hopper, Sorensen and Kyvik2003). After 15 min of rest, a capillary blood sample was drawn immediately before ingestion of the glucose solution, and two additional capillary blood samples were drawn 30 and 120 min later. Peripheral venous blood samples for insulin measurements were drawn at the same time points.
Assessment of Type 2 Diabetes
At follow-up, incident type 2 diabetes was defined as self-reported diabetes, FPG ≥ 7.0 mmol/l, HbA1c ≥ 48 mmol/mol (6.5%) or self-reported use of antidiabetic medicine.
Assessment of Covariates
At both baseline and follow-up, the clinical examination included measurements of weight in light clothing (to the nearest .1 kg) and height without shoes (to the nearest .1 cm), and BMI was calculated as weight (in kg) divided by height squared (m2). Waist circumference (to the nearest .1 cm) was measured midway between the lowest rib and the iliac crest. Systolic and diastolic blood pressures were measured after 30 min rest using a conventional mercury sphygmomanometer and hands-free stethoscope at the right arm. The average of three blood pressure measurements was used (Benyamin et al., Reference Benyamin, Sorensen, Schousboe, Fenger, Visscher and Kyvik2007).
At baseline, capillary blood glucose concentrations were measured by the glucose dehydrogenase oxidation method, and serum insulin concentrations were measured using a commercial time-resolved immunofluorometric assay (AutoDelfia; PerkinElmer, Turku, Finland) as reported previously (Schousboe et al., Reference Schousboe, Visscher, Henriksen, Hopper, Sorensen and Kyvik2003). Cholesterol, high-density lipoproteins (HDLs) and triglycerides were measured on fasting serum samples by a colorimetric method (VITROS; Johnson & Johnson, New Brunswick, NJ, USA). Low-density lipoproteins (LDLs) were calculated (Friedewald formula) by subtracting HDL and (.45 × trigylceride) from total cholesterol (Benyamin et al., Reference Benyamin, Sorensen, Schousboe, Fenger, Visscher and Kyvik2007).
At follow-up, peripheral venous blood samples were collected for HbA1c analysis carried out using a fully automated glycohemoglobin analyzer (Tosoh G8 equipment, Tosoh Corporation, Bioscience Division; Tosoh G8, Tokyo, Japan; Nielsen et al., Reference Nielsen, Petersen, Green, Christensen, Christensen and Brandslund2014). Also, FPG was determined using a hexokinase/G-6-PDH principle (Integra 700/Roche equipment).
Zygosity of the twins was determined by nine polymorphic DNA-based microsatellite markers with the PE Applied Biosystems AmpFISTR Profiler Plus Kit (Perkin Elmer, Foster City, CA, USA) (Schousboe et al., Reference Schousboe, Visscher, Henriksen, Hopper, Sorensen and Kyvik2003).
Statistical Analysis
Baseline data are expressed as median (25th–75th percentiles) or frequency (%). We tested differences between classes using the Kruskal–Wallis test for continuous variables and chi-square for categorical variables. Heterogeneity of glucose response during OGTT was modeled with latent class mixed-effects models, which for a predetermined number of latent classes identifies a grouping of observations, resulting in the most homogenous trajectories of glucose response within each group, following strategies applied in similar studies on singletons (Hulman, Gujral et al., Reference Hulman, Gujral, Narayan, Pradeepa, Mohan, Anjana and Witte2017). We investigated 2–7 latent variables. For more than seven latent variables, the sample size was not sufficient to achieve model convergence. We evaluated goodness of fit by Bayes information criterion and applied the model for a varying number of latent classes. We allowed age and sex of the twin individuals to influence the class membership and decided not to include the twin structure to avoid overfitting with respect to the following twin analyses.
We used the classical twin models to determine the contribution of genetic and environmental factors to the variance in class belonging. These models make use of the difference in genetic relatedness between monozygotic (MZ) twins (sharing ∼100% of their segregating genes) and the dizygotic (DZ) twins (sharing on average 50% of their segregating genes); hence, any greater concordance between MZ twins than DZ twins is assumed to be related to this genetic sharing. The modeling is based on structural equations to estimate the best fit of the proportion of variance on individual class membership that can be explained by variation in additive genetic factors (A), dominant genetic factors (D), common/shared environmental factors (C) and unique environmental factors (E). The heritability is the proportional contribution of genetic variance (A + D) to the total phenotypic variance (A + C + D + E). We investigated AE, DE, CE, ACE, ADE and DCE models and decided on the preferred model on the basis of optimal Akaike information criterion. In the models, we adjusted the marginal (individual) effect of each twin for the persons own sex and age.
Finally, we used logistic regression to examine the association between class belonging and diabetes at follow-up. We adjusted for age, sex, smoking status, cholesterol, HDL, BMI, waist circumference and systolic and diastolic blood pressure and used robust standard errors to account for dependency within twin-pairs.
We decided not to carry out analyses stratified by age or sex, due to the limited sample size.
The statistical modeling was performed in Stata (Release 15. College Station, TX, USA: StataCorp LLC) and RStudio version 1.0.143 (RStudio, Inc., Boston, MA).
Results
The baseline characteristics of the study population are demonstrated in Table 1. In total, 1455 twins, consisting of 708 complete pairs (42% MZ) and 39 singular twins (33% MZ), had valid glucose concentrations measured from the OGTT (>99% with all three measures) and were without diabetes at baseline. We identified four latent classes with different glucose response patterns comprising between 7% (n = 108, Class 4) and 37% (n = 554, Class 1) of the cohort (Figure 1).
Table 1. Characteristics of study participants stratified according to glucose response latent class curve

Note: Data are expressed as median (25th–75th percentiles) or frequency (%). *p values from χ2 analyses for categorical variables or Kruskal–Wallis test for continuous variables.
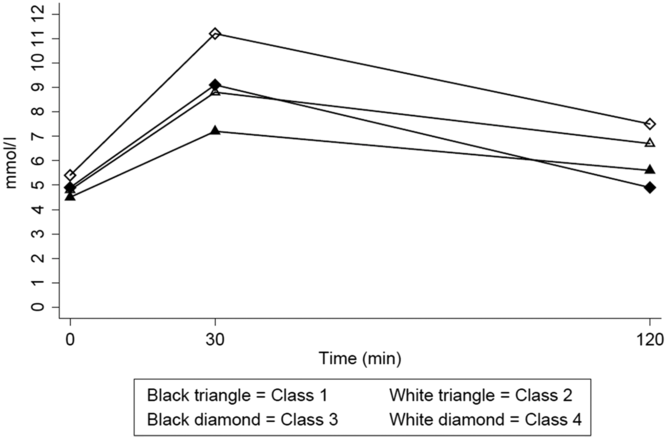
Fig. 1. Heterogenous blood glucose response curves during an OGTT among 1455 twins.
For glucose, Class 1 experienced the lowest values, Class 2 moderate values, and Class 4 the highest glucose values at all three time points. However, Class 3, although characterized by third highest glucose values at time zero (fasting) and 30 min, had the lowest glucose values at 2 h. All classes had lower 2-h values than at 30 min, but only Class 3 returned to fasting levels (Figure 1, Table 1).
For insulin, all four classes experienced almost same levels at fasting; however, Class 1 experienced the lowest increase at time 30 min and second lowest at time 2 h. Class 3 had the highest insulin response at 30 min and the steepest decline to the 2-h values, compared with the three other classes. Class 4 experienced a high and the highest levels at the following time points, respectively, compared with the other classes. All classes had lower 2-h values than at 30 min, but none of them returned to fasting levels (Table 1).
The four classes differed in their baseline characteristics. In general, Class 4 had the highest values of the cardiometabolic risk factors compared with the three other classes, except for HDL and waist circumference. Class 4 also had the highest mean age, 49 years compared with 34–40 years for the other three classes. Class 3 had the lowest proportion of women, ∼15% compared with 44–66%, and the highest proportion of smokers, ∼49% compared with 28–44% for the other three classes (Table 1, all p values <.05). There were marked differences in the various cardiometabolic risk factors between classes; Class 3 mean values were between Classes 1 and 2 for most of the risk factors except for waist circumference, BMI and systolic blood pressure.
For 53% of the pairs (372 of 708 complete pairs), both twins in a pair were assigned into the same class, consisting of a concordance of 60% (176 of 295) in MZ pairs and 47% (196 of 413) in DZ pairs. In comparison, the expected class concordance for two unrelated twins in the cohort would be only 32%. The observed casewise concordances for the individual classes varied between 42–70% in MZ twins and 28–55% in DZ twins.
We fitted different models for each of the four classes. Generally, the best-fitting models were the reduced AE models, with estimates indicating that the additive genetic component (the heritability) explained between 45% (95% confidence interval [CI] [31%, 60%) and 67% (95% CI [55%, 78%]) and the unique environmental component explained between 33% (95% CI [22%, 45%]) and 55% (95% CI [40%, 71%]) of the total variation of belonging to a specific class (Table 2).
Table 2. Casewise concordance rates showing probability of belonging to the same predicted latent class as the co-twin and best-fitting models to estimate the quantitative contribution of environmental and genetic factors on variance within each class

a Total number also includes 39 twins without their co-twin in the present study.
b Marginal indicates the expected class concordance for two unrelated twins in the cohort.
c A: additive genetic effect, D: dominant genetic effect, C: shared environmental effect, E: unique (nonshared) environmental effect (including error), all reported with 95% CI.
At follow-up during 2010–2012 (∼12 years after first intake), 1139 (79%) twins were participating and examined clinically; 3.9% were found to have type 2 diabetes. Among these, 1098 had been categorized by the glucose curve pattern class at baseline. Participants in Class 4 had a more than five-fold higher incidence of type 2 diabetes than the highest of the three other classes (20% vs. .2–3.5%). A clear association was observed between class belonging and diabetes. After adjustment for potential confounders, the odds ratio of diabetes was >70 times higher among participants classified into Class 4 (OR=75.5; 95% CI [8.3, 689.0], p<.001) compared with participants classified into Class 1. The large magnitude of this OR is biological implausible and caused by limited number of cases in the classes; however, a strong association, albeit most probably with less extreme true OR, with diabetes was robust also after adjustments.
Discussion
In the present study, we used a latent class analysis to identify four separate classes of glucose response to an OGTT, each with very different incidence of type 2 diabetes ∼12 years later. Furthermore, we determined the relative environmental and genetic contribution to the variation in belonging to one of the classes. The influence of unique environmental factors of 33–55% illustrates the preventative potential of type 2 diabetes.
We have used the same data-driven method to identify latent classes among subjects free from diabetes at baseline as Hulman and colleagues did in three recent studies (Hulman, Gujral et al., Reference Hulman, Gujral, Narayan, Pradeepa, Mohan, Anjana and Witte2017; Hulman, Simmons, Vistisen et al., Reference Hulman, Simmons, Vistisen, Tabak, Dekker, Alssema and Faerch2017; Hulman et al., Reference Hulman, Vistisen, Glumer, Bergman, Witte and Faerch2018); our study supports these studies both regarding curve shapes and the risk of incident type 2 diabetes according to class belonging. This is notable, as the four studies have differences among population characteristics. For instance, one of Hulman et al.’s studies was performed in an Asian Indian population (Hulman, Simmons, Brunner et al., Reference Hulman, Simmons, Brunner, Witte, Faerch, Vistisen and Tabak2017), and ours in a European population, mean ages ranged from 37–38 years to 49–50 years of age, and baseline fasting glucose (FG) ranged from 4.7 to 5.4 mmol/l.
Also, the long-term risk of type 2 diabetes associated with these patterns observed in the present study supports what has been demonstrated in the previous studies: the class with high/the highest blood glucose values at all three time points has the highest risk of diabetes. The study thus lends support to previous studies demonstrating that using both the FPG and glucose concentrations during the OGTT may improve the identification of subjects who are at increased risk for type 2 diabetes (Abdul-Ghani et al., Reference Abdul-Ghani, Lyssenko, Tuomi, Defronzo and Groop2010; Alyass et al., Reference Alyass, Almgren, Akerlund, Dushoff, Isomaa, Nilsson and Meyre2015; Hayashi et al., Reference Hayashi, Boyko, Sato, McNeely, Leonetti, Kahn and Fujimoto2013). The differences in risk between classes could be a result of the stage or trajectory for the development of type 2 diabetes, for example, the higher the mean age of the class, the higher the risk of type 2 diabetes of the class. It is well known that age is an important risk factor for type 2 diabetes, but still, we observed a much higher prevalence of diabetes in Class 4 than could be anticipated due to age alone (Guariguata et al., Reference Guariguata, Whiting, Hambleton, Beagley, Linnenkamp and Shaw2014; Wild et al., Reference Wild, Roglic, Green, Sicree and King2004). Also, the two articles by Hulman et al. and our results demonstrated that type 2 diabetes risk by class membership was independent of differences in well-known risk factors, including age, sex and waist circumference (Hulman, Gujral et al., Reference Hulman, Gujral, Narayan, Pradeepa, Mohan, Anjana and Witte2017; Hulman et al., Reference Hulman, Vistisen, Glumer, Bergman, Witte and Faerch2018). In further support of this, our results demonstrated that even with same sex, age and genotype, twins in a pair may be classified into different classes; for instance, 40% of the MZ twins in the complete pairs were classified differently.
Our quantitative genetic modeling demonstrated a moderate-to-high genetic influence on the probability of belonging to a specific class, given that the co-twin already was in the same class (Table 2). The high, but not full, concordance rate for the MZ twins suggests that also environmental factors influence class belonging. Furthermore, the higher concordance rates for the MZ twins than the DZ twins, which again are higher than for two unrelated twins in the cohort, indicate involvement of shared environment in the belonging of class. However, the modeling could not demonstrate an ACE model that includes shared environment (i.e., shared family-level environmental factors) but only an AE model; hence, the influence of shared environment is either rather low or nonexisting or there is not enough power to detect. Finally, the models estimated that the influence of genetic factors on belonging to a specific class was moderate to high (heritability varied from 45% to 67%). This demonstrates that, depending on class, environmental factors may have varying influence on belonging to a specific class, ranging from 33% to 55% (Table 2).
We were not able to identify other studies that have examined the heritability of the full OGTT curve patterns. But the values agree with heritability estimates for the time-specific PG concentrations during an OGTT found in other studies. Although some studies have found a higher heritability for fasting glucose concentrations than for 2-h glucose concentrations (Almgren et al., Reference Almgren, Lehtovirta, Isomaa, Sarelin, Taskinen, Lyssenko and Groop2011), we and others have previously found the opposite (Katoh et al., Reference Katoh, Lehtovirta, Kaprio, Harjutsalo, Koskenvuo, Eriksson and Tuomilehto2005; Liu et al., Reference Liu, Riese, Spector, Mangino, O’Dell, Stolk and Snieder2009; Schousboe et al., Reference Schousboe, Visscher, Henriksen, Hopper, Sorensen and Kyvik2003). Furthermore, Liu et al. (Reference Liu, Riese, Spector, Mangino, O’Dell, Stolk and Snieder2009) performed bivariate analyses of fasting and 2-h glucose concentrations and observed heritability estimates very like ours.
As the different curve patterns are associated with different risk of type 2 diabetes, finding the environmental factors that influence the individual class membership would potentially bring new understanding to the development of type 2 diabetes. Also, together with the knowledge on environmental factors, more insight would be gained by analyses of the G × E interaction.
Our study has several strengths, including the twin population recruited from a population-based register and the longitudinal study design. Moreover, the availability of three glucose measurements for each twin and the twin structure allowed us to combine the latent class modeling with classic twin methodology. However, it was not possible to consider the interplay between uncertainties from both methods at the same time, which might influence the CIs reported from the twin models. Previous studies have found sex-specific differences for fasting glucose and 2-h PG heritability, but still with this relatively large sample of twins we could not stratify by sex. Hence, the latent curve patterns are not estimated stratified by sex, and we were therefore not able to discover potential sex-specific differences in the relative contribution of genes and environment for curve patterns. Furthermore, the classical twin model cannot reflect gene–environment interaction with a possible result of an overestimation of environmental contribution to variance (Purcell, Reference Purcell2002). Also, a recent study has demonstrated age-varying heritability estimates of type 2 diabetes (Almgren et al., Reference Almgren, Lehtovirta, Isomaa, Sarelin, Taskinen, Lyssenko and Groop2011). It is therefore possible that the same age variation would be present in the OGTT curve patterns as they are related to type 2 diabetes risk. We did not stratify our analyses by age, again due to sample size and potential loss of power. However, the genetic variation of the pattern was of almost the same magnitude in the youngest Class 1 and oldest Class 4, although there was more than 15 years difference in median age, indicating that age may not be the primary determinant of the total phenotypic variation. Although we used a population-based register for recruitment (Pedersen et al., Reference Pedersen, Larsen, Nygaard, Mengel-From, McGue, Dalgard and Christensen2019), the participants were twins, which could limit the generalizability of our findings to singletons. Nevertheless, several studies have found similar prevalences of type 2 diabetes and other diseases in twins and singletons (Christensen et al., Reference Christensen, Wienke, Skytthe, Holm, Vaupel and Yashin2001; Petersen et al., Reference Petersen, Nielsen, Beck-Nielsen and Christensen2011).
In conclusion, in a nondiabetic population, we identified four classes of distinct glucose response curve patterns and demonstrated that individuals characterized by high 30-min and 2-h PG are at increased risk for incident type 2 diabetes. We showed that genetic variation explains a moderate-to-high proportion of variation in class belonging. Finding the genetic as well as the environmental factors that act on these curves may offer insight into potential personalized preventative strategies.
Author contributions
SM analyzed data; CD analyzed data, wrote the manuscript and has the primary responsibility for the final content. CD and KOK designed the study. All authors interpreted data, reviewed, revised and edited the manuscript for intellectual content, and all authors approved the final version. CD is the guarantor of this work and, as such, had full access to all the data in the study and takes responsibility for the integrity of the data and the accuracy of the data analyses.
Financial support
The GEMINAKAR cohort was supported by grants from the Danish Medical Research Fund; The Danish Diabetes Association; The NOVO Foundation; The Danish Heart Foundation; Interreg 4a Southern Denmark-Schleswig-KERN funded by the European Regional Development Fund (grant number 57-1.3-10); National Institute of Aging–National Institutes of Health, USA (grant number 95-103-11412); and the Danish Research Council for Health and Disease.
Conflict of interest
None.


