


Introduction
Rationale
Bovine respiratory disease complex (BRD) is the most economically significant disease of feedlot cattle. Putative causal organisms include Mannheimia haemolytica, Pasteurella multocida, Histophilus somni, Mycoplasma bovis, bovine herpes virus (BHV), bovine viral diarrhea virus (BVDV), bovine respiratory syncytial virus (BRSV), and parainfluenza type 3 virus (PI3) (Larson and Step, Reference Larson and Step2012; Theurer et al., Reference Theurer, Larson and White2015). Ideally, BRD can be prevented rather than treated because prevention can reduce antibiotic use and improve animal welfare. Although disease prevention can take many forms, vaccination generally plays an important role in veterinary science. Vaccines with unconditional licenses from the United States Department of Agriculture (USDA) Center for Veterinary Biologics and other regulatory agencies worldwide are expected to serve as an approach to preventing disease (American Veterinary Medical Association none provided). Also, based on section 151 of Chapter 5 of the Virus-Serum-Toxin Act 21 USC 151–159 (Anon 1913 as amended 1985), the preparation and sale of worthless or harmful products for domestic animals are prohibited. Evidence from the industry also suggests that producers expect BRD vaccines, in particular, to help prevent disease. According to the National Animal Health Monitoring Scheme Feedlot 2011 report, Vaccination is a cornerstone of disease prevention activities for all livestock operations, including feedlots. Vaccination with products targeting the pathogens most frequently associated with morbidity in the feedlots may lessen the numbers of animals affected as well as the severity of disease. More than 90% of feedlots vaccinated at least some cattle against some of the key respiratory pathogens such as BVDV and infectious bovine rhinotracheitis virus. More than 90% of all cattle placed were vaccinated for these pathogens (United States Department of Agriculture, Animal and Plant Health Inspection Service, Veterinary Services, 2013). Although this high level of usage implies some degree of efficacy, the actual efficacy of vaccines when used upon feedlot arrival is unclear. When designing economic disease prevention programs, it is important to understand their overall efficacy and any differences between vaccines.
Ideally, a series of relevant clinical trials providing evidence of comparative efficacy would be available to producers and veterinarians for decision-making. Such studies would be conducted in samples that are representative of the intended population and include contrasts of interest. In feedlot production, such trials might include a placebo group to allow producers to determine whether a vaccine is effective. Additionally, the trials would ideally include a comparison of vaccines to determine whether one is more effective than others. Such trials, however, are difficult to conduct for economic and logistic reasons. When high-quality relevant clinical trials are not available, then systematic reviews and pairwise meta-analyses of randomized controlled trials can yield evidence of comparative efficacy of treatments under field conditions. However, when an insufficient number of trials containing the comparison of interest is available for pairwise meta-analysis, information from a network of evidence can be used to obtain estimates of the comparative efficacy of vaccines using network meta-analysis.
Objectives
As a consequence of common vaccine usage and the need for producers and veterinarians to have information about the comparative efficacy of vaccines intended to prevent BRD, the objective of this systematic review and network meta-analysis was to determine the comparative efficacy of commercially available vaccines for the prevention of BRD among beef cattle in feedlots.
Methods
Protocol and registration
The protocol was developed prior to conducting the review, approved by the funding agency advisory board and staff, and posted online for public access (https://works.bepress.com/annette_oconnor/85/). Modifications to the original protocol are described when relevant.
Eligibility criteria
Eligibility criteria were defined based on the population (P), intervention (I), comparators (C), outcome (O), and study design (S), based on the PICOS format (Centre for Reviews and Dissemination (CRD) 2008).
Population
The eligible population was weaned cattle raised for meat in intensive systems at risk of BRD. Eligible cattle were housed in feedlot settings (i.e., groups of penned cattle receiving rations rather than grazing on pasture). Calves explicitly described as veal or dairy calves were excluded from consideration. Calves with vaccines administered post-weaning but prior to feedlot arrival were eligible provided that no difference other than vaccination existed between groups. Similarly, calves vaccinated after feedlot arrival were also eligible provided that no difference other than vaccination existed between groups. Although not in our original protocol, such studies were included because they provided more evidence to the network for estimation of the non-active control group baseline risk.
Interventions and comparators
The interventions of interest included commercially available vaccines in any country as recognized by the reporting of a brand name or manufacturer. This definition included commercially produced autogenous vaccines, which had to explicitly include the name of the manufacturer and identify as autogenous (i.e., farm of origin vaccines). Studies that administered the same vaccines at different times (e.g., before versus after feedlot arrival) were excluded, as the treatment effect in these cases reflected vaccination timing. If different products were compared, they had to be administered at the same time to avoid confounding by time. For studies to be included if the vaccination was used prior to feedlot arrival, the vaccination had to be the only difference in the regimen (i.e., animals had to have the same weaning dates, rations, etc. before feedlot arrival). Relevant comparators were non-active controls (e.g., saline or no vaccine) or active interventions (e.g., another vaccine).
Outcome
The cumulative incidence of the first treatment for BRD in the first 45 days of the feedlot period was the primary outcome of interest, as this is the period of increased BRD incidence. As possible secondary outcomes, we also extracted data for cumulative treatment for BRD over the entire feedlot period and BRD mortality. Extraction of metrics for cumulative incidence within the first 45 days was prioritized as follows:
• 1st priority metric: Estimates of efficacy that adjusted for clustering of feedlot populations, such as adjusted risk ratio, adjusted odds ratio, or arm-level probability of the event obtained by transforming the adjusted odds ratio. If the study was conducted in only one pen, then adjustment for clustering was not considered necessary.
• 2nd priority metric: Estimates of efficacy that did not adjust for clustering of feedlot populations such as unadjusted risk ratio, unadjusted odds ratio, or arm-level probability of the event obtained by transforming the unadjusted odds ratio.
• 3rd priority metric: Raw arm-level data, such as the number of animals with BRD or the number of animals allocated to and analyzed in a group.
If a prioritized metric was reported, lower-priority metrics were not extracted. The rationale for this prioritization is that the meta-analysis should use an adjusted summary effect, as most relevant studies are randomized trials conducted in clustered populations.
Study designs
Studies relevant to the review had to contain at least one comparison group (i.e., active comparator or placebo) and at least one commercial vaccine in a cattle population with naturally occurring BRD. Although the protocol stated that only randomized studies of natural infection were to be included, studies reporting the allocation of animals to a vaccine group were considered trials and therefore eligible for inclusion. If studies did not report allocation, the potential for bias associated with non-random allocation methods was measured in the risk of bias assessment. Cluster or individually based allocation methods were acceptable.
Report characteristics
In addition to the eligibility criteria as described in the PICOS elements described above, studies had to have a full text available in English. No country restrictions were applied. For the bacterial vaccines, no date restrictions were applied to the search. The results of the viral vaccine search strings were limited to those published from 2014 to current. The rationale for this restriction was that the number of citations returned by the search strings related to BRD viral vaccines was very large and we considered very likely to contain many a lot of irrelevant studies. Therefore, as proposed in the protocol we used prior reviews to identify studies published before 2014 and the database searches to capture recent relevant publications (Larson and Step, Reference Larson and Step2012; Theurer et al., Reference Theurer, Larson and White2015).
Information sources
The electronic databases used for the literature search were MEDLINE, MEDLINE In-Process and MEDLINE Daily, Epub Ahead of Print, Cambridge Agricultural and Biological Index (CABI), Science Citation Index, Conference Proceedings Citation Index Science, and AGRICOLA. MEDLINE sources were searched using the Ovid interface. AGRICOLA was searched via Proquest. The remainder of the databases were searched using the Iowa State University Web of Science interface.
The conference proceedings of the American Association of Bovine Practitioners (1997–2017) and World Buiatrics Congress (1998–2016) were hand-searched for relevant records. Conference reports with fewer than 500 words were not considered eligible, as our experience suggests that their reporting is not sufficiently detailed to conduct risk of bias assessment and extract detailed results. The reference lists of two recent reviews considered relevant to the project were also evaluated for relevant studies (Larson and Step, Reference Larson and Step2012; Theurer et al., Reference Theurer, Larson and White2015).
Search
The database search strategies, which were modified as appropriate for each database, are reported in Supplementary Tables S1 to S5. As the conference proceedings were hand-searched, no search terms are presented for these sources of information. Search results were imported into ®EndNoteX9 (Clarivate Analytics, Philadelphia, PA), and duplicate results were removed. Records were then uploaded to the systematic review management software ®DistillerSR (Evidence Partners, Ontario, Canada) and additionally examined for duplicate records.
Study selection
The first round of screening was based on titles and abstract, and the second round of screening was based on the full text. The questions used for each round of screening are provided in the review protocol, which underwent minor modifications for clarity as described in the supplementary materials section titled TS12.
For the title and abstract round of screening, the two reviews pre-tested 100 records to ensure clarity of the questions and consistency in understanding the questions. Records were excluded if both reviewers responded ‘no’ to any screening question. If one reviewer indicated ‘yes’ or ‘unclear’, the record was advanced to full-text screening. For the full-text round of screening, the two reviewers pre-tested five records to ensure clarity of the questions and consistency in understanding the questions.
Studies were included in the meta-analysis if sufficient data were reported to enable calculation of the log odds ratio and standard error of the log odds ratio based on the extraction of the prioritized metrics.
Data collection process
DistillerSR was used to extract data into pre-tested forms. Two reviewers independently extracted all data elements of interest from relevant full-text articles. After extraction, any disagreements were resolved by discussion. If the discussion did not lead to resolution of the conflict, a third reviewer was consulted. The unit of concern for data extraction was the individual study, if available. Therefore, if an article described multiple studies at different sites, data were extracted at the site level if this information was reported. If investigators combined multiple sites into a single analysis and only reported pooled information, then the pooled information was extracted. We did not contact authors when data were missing. If studies were linked (i.e., if the same data were reported in multiple publications, such as a conference proceeding and a journal article), we used all the available information but cited the version considered to be the most complete report.
Data items
Data were extracted to describe individual study-level characteristics, such as country, year, and outcomes measured. For baseline characteristics and loss to follow-up information, if reported, we extracted arm-level data in preference over data combining the groups. Other arm-level data extracted included the intervention and results (based on prioritization).
Geometry of the network
Network geometry was assessed using a previously described approach (Salanti et al., Reference Salanti, Kavvoura and Ioannidis2008). The probability of an interspecific encounter (PIE) index was calculated using a custom-written R script, and the C-score test was performed using the R package EcoSimR version 0.1.0 (Gotelli and Entsminger, Reference Gotelli and Entsminger2001). The PIE index is a continuous variable that decreases as unevenness increases, with values <0.75 reflecting a limited diversity of interventions. We also assessed co-occurrence using the C-score, which describes, based on checkerboard analysis, whether particular pairwise comparisons of treatments are preferred or avoided (Salanti et al., Reference Salanti, Kavvoura and Ioannidis2008).
Risk of bias in individual studies
The risk of bias form was based on the Cochrane Risk of Bias (ROB) 2.0 tool for randomized trials. However, this form was modified to ensure relevance to the review topic (Higgins et al., Reference Higgins, Sterne, Savović, Page, Hróbjartsson, Boutron, Reeves and Eldridge2016). The risk of bias assessment was conducted on the outcome level (i.e., BRD morbidity and mortality) for the outcome assessment domain; for the other risk domains, BRD morbidity and mortality outcomes were considered to be the same in a given study.
Summary measures
The summary measure used to describe pairwise comparative efficacy was the risk ratio. The baseline risk used to convert odds ratios to risk ratios was obtained using the distribution of the reported log odds in the placebo group. The posterior distribution of the mean of the baseline log odds was N( − 0.7183, 1.9537). The posterior distribution of the standard deviation of the baseline log odds was N(1.7958, 0.5186).
Planned method of statistical analysis
The proposed method of statistical analysis was a network meta-analysis, which is described in detail elsewhere (Dias et al., Reference Dias, Welton, Caldwell and Ades2010, Reference Dias, Welton, Sutton and Ades2011). Network meta-analysis is defined as ‘The simultaneous synthesis of evidence of all pairwise comparisons across more than two interventions’ (Coleman et al., Reference Coleman, Phung, Cappelleri, Baker, Kluger, White and Sobieraj2012). Although frequently used as a synonym for network meta-analysis, a mixed treatment comparisons meta-analysis is a subtype of a network meta-analysis in which ‘A statistical approach used to analyze a network of evidence with more than two interventions which are being compared indirectly, and at least one pair of interventions compared both directly and indirectly’ (Coleman et al., Reference Coleman, Phung, Cappelleri, Baker, Kluger, White and Sobieraj2012). Direct comparisons of interventions were calculated based on the observed effects in trials or observational studies that compared the pair of interventions of interest, whereas indirect comparisons of interventions were calculated based on the results of trials that did not directly compare the pair of interventions of interest.
We used a random effects Bayesian model to obtain a continuous outcome for the network meta-analysis. b denoted the baseline treatment of the whole network (usually placebo), and b i denoted the trial-specific baseline treatment of trial i. It could be the case that b ≠ b i. We supposed there were L treatments in a network and assumed a normal distribution for the continuous measure of the treatment effects of arm k relative to the trial-specific baseline arm b i in trial  $i\comma \;y_{ib_ik}$, with variance
  $V_{ib_ik}$, such that
 $$y_{ib_ik}\sim N\lpar {\theta_{ib_ik}\comma \;V_{ib_ik}} \rpar \comma \;$$
and
 $$\theta _{ib_ik}\sim \left\{{\matrix{ {N\lpar {d_{b_ik}\comma \;\sigma_{b_ik}^2 } \rpar \comma \;} & {{\rm for\;}b_i = b\comma \;} \cr {N\lpar {d_{bk} - d_{bb_i}\comma \;\sigma_{b_ik}^2 } \rpar \comma \;} & {{\rm for\;}b_i \ne b\comma \;} \cr } } \right.$$
where d bk was the treatment effects of k relative to the network baseline treatment b and where  $\sigma _{b_ik}^2 $ was the between-trial variance. The priors of d bk and
  $\sigma _{b_ik}$ were
 $$d_{bk}\sim N\lpar {0\comma \;10000} \rpar \comma \;$$
and there was a homogeneous variance assumption that  $\sigma _{b_ik}^2 = \sigma ^2$, where σ ~ U(0, 5). Thus, for L treatments, we have L − 1 priors for d bl, l ∈ {1, …, L}, l ≠ b. For l = b, we have d bb = 0.
Handling of multi-arm trials
For multi-arm trials, we assumed that the co-variance between  $\theta _{jb_jk}$ and
  $\theta _{jb_j{k}^{\prime}}$ was σ 2/2 (Higgins and Whitehead, Reference Higgins and Whitehead1996; Lu and Ades, Reference Lu and Ades2004). The likelihood of a trial i with a i arms would be defined as multivariate normal:
 $$\left({\matrix{ {y_{i\comma 1\comma 2}} \cr {y_{i\comma 1\comma 3}} \cr \vdots \cr {y_{i\comma 1\comma a_i}} \cr } } \right)\sim N_{a_i - 1}\left({\left({\matrix{ {\theta_{i\comma 1\comma 2}} \cr {\theta_{i\comma 1\comma 3}} \cr \vdots \cr {\theta_{i\comma 1\comma a_i}} \cr } } \right)\comma \;\left[{\matrix{ {V_{i\comma 1\comma 2}} & {se_{i1}^2 } & \cdots & {se_{i1}^2 } \cr {se_{i1}^2 } & {V_{i\comma 1\comma 3}} & \cdots & {se_{i1}^2 } \cr \vdots & \vdots & \ddots & \vdots \cr {se_{i1}^2 } & {se_{i1}^2 } & \cdots & {V_{i\comma 1\comma a_i}} \cr } } \right]} \right)\comma \;$$
where the diagonal elements in the variance-covariance matrix represent the variances of the treatment differences and the off-diagonal elements represent the observed variance in the control arm in trial i, denoted by  $se_{i1}^2 $.
For all studies, the results were converted to the log odds ratio for analysis. If the authors reported a risk ratio, this was converted back to the log odds ratio using the reported risk of disease in the placebo group. When the authors reported the probability of BRD in each treatment arm based on a model, that probability was converted back to the logs odds ratio using a previously described method (Hu et al., Reference Hu, Wang and O'Connor2019).
Vaccines for the same bacterial or viral target produced by different companies were considered to be different interventions, as the specific strains used in the manufacture of the vaccine may differ or the products may contain different antigens. However, if the same vaccine or intervention arm was administered in a different number of doses, then this was considered to be the same intervention. As much of the information about vaccines is proprietary and the production process can be country-specific, we assumed vaccines from the same company were different if they came from different countries unless the authors specifically indicated that a vaccine was equivalent to another company's product.
Selection of prior distributions in Bayesian analysis
Prior distributions were originally based on a previously reported approach (Dias et al., Reference Dias, Welton, Sutton and Ades2011). As with prior models, we assessed σ ~ U(0, 2) and σ ~ U(0, 5), and the results suggested σ ~ U(0, 5) was preferred. We repeated the assessment and retained the same prior used in a previous model (O'Connor et al., Reference O'Connor, Coetzee, da Silva and Wang2013, Reference O'Connor, Yuan, Cullen, Coetzee, da Silva and Wang2016).
Implementation and output
All posterior samples were generated using Markov Chain Monte Carlo (MCMC) simulation implemented using Just Another Gibbs Sampler (JAGS) software (version 3.4.0) (Plummer, Reference Plummer2015). All statistical analyses were performed using R software (version 3.2.1) (R Core Team, 2015). We fitted the model using JAGS, a MCMC sampler, using the R rjags package (Plummer, Reference Plummer2015). Three chains were simulated, and convergence was assessed using Gelman-Rubin diagnostics. We discarded 5000 ‘burn-in’ iterations and based the inferences on a further 10,000 iterations. The model output included all possible pairwise comparisons using log odds ratios (for inconsistency assessment), risk ratios (for comparative efficacy reporting), and treatment failure rankings (for comparative efficacy reporting).
Assessment of model fit
The fit of the model was assessed based on the log odds ratio by examining the residual deviance between the predicted values from the MTC model and the observed value for each study (Dias et al., Reference Dias, Welton, Caldwell and Ades2010, Reference Dias, Welton, Sutton and Ades2011).
Assessment of inconsistency
We used the back-calculation method to assess the consistency assumption (Dias et al., Reference Dias, Welton, Caldwell and Ades2010). We did not rely only on P-values during inconsistency evaluation. We also compared estimates from direct and indirect models and considered the standard deviation of each estimate. Comparisons for which the direct and indirect estimates had different signs were further evaluated and discussed.
Risk-of-bias assessment: individual studies and overall network
In systematic reviews, risk of bias assessment informs readers about the potential for bias in individual studies and facilitates their interpretation of estimates of efficacy. Intervention studies are generally considered to involve five risk of bias domains: bias related to the allocation process, deviation from the intended interventions, missing outcome data, outcome measurement, and selection of the reported result. (Higgins et al., Reference Higgins, Sterne, Savović, Page, Hróbjartsson, Boutron, Reeves and Eldridge2016). For this review, risk of bias assessment of individual studies was conducted based on the bias domains proposed by the Cochrane ROB 2.0 algorithm (Higgins et al., Reference Higgins, Sterne, Savović, Page, Hróbjartsson, Boutron, Reeves and Eldridge2016).
In assessing risk of bias due to the allocation process, the Cochrane ROB tool for individually allocated studies places substantial value on allocation concealment; however, it is unclear if this emphasis is applicable to production settings for beef, as the value of the individual animal is likely to be equivalent and/or is unlikely to be known at the time of allocation to treatment group. Therefore, rather than make an overall assessment of bias arising from the approach to allocation, we present answers to three signaling questions (SQ):
• SQ1.1 – Was the allocation sequence random?
• SQ1.2 – Was the allocation sequence concealed until participants were recruited and assigned to interventions?
• SQ1.3 – Were there baseline imbalances that suggest a problem with the randomization process?
For cluster-randomized trials, the first three signaling questions for bias arising from the allocation approach were also assessed and presented with the individual-level questions. Two additional questions related to bias arising from individual participant characteristics in cluster-randomized studies were assessed and presented separately:
• Were all individual participant characteristics likely to be evenly distributed across treatment groups?
• Were there baseline imbalances that suggest differential identification or recruitment of individual participants between arms?
We did not assess the risk of bias of studies that did not have reportable data. If studies within an article had different characteristics that impacted bias, such as sample size, risk of bias was assessed for each study separately. Otherwise, studies within an article are presented as a single set of results.
To describe the overall quality of the evidence network, a modification of the Grading of Recommendations Assessment, Development, and Evaluation (GRADE) approach was employed (Salanti et al., Reference Salanti, Del Giovane, Chaimani, Caldwell and Higgins2014; Papakonstantinou et al., Reference Papakonstantinou, Nikolakopoulou, Rucker, Chaimani, Schwarzer, Egger and Salanti2018) using Confidence in Network Meta-Analysis (CINeMA) online software (http://cinema.ispm.ch) (CINeMA: Confidence in Network Meta-Analysis [Software] 2017). CINeMA uses a frequentist approach to calculate treatment effects based on the R metafor package (Viechtbauer, Reference Viechtbauer2010), on which the contribution matrix for the risk of bias is based. The proposed system evaluates within-study bias, across-studies bias, indirectness, imprecision, heterogeneity, and incoherence. For within-study bias, we evaluated and report the contribution of studies based on randomization and blinding rather than an overall assessment of bias. The rationale for assessing and presenting these two factors is that evidence in veterinary science indicates that failure to include these design elements is associated with larger estimates of effect, whereas the Cochrane ROB tool considers design elements such as allocation concealment, for which there is no evidence of bias in livestock production to date. For randomization, we evaluated risk of bias based on the following questions.
• Low risk of bias: study reports random allocation with evidence provided; based on a ‘yes’ or ‘probably yes’ response to Q1.1 – Was the allocation sequence random?
• Unclear risk of bias: study reports random allocation but provides no evidence; based on a ‘no information random’ response to Q1.1 – Was the allocation sequence random?
• High risk of bias: study reports non-random allocation or no information about allocation; based on a ‘no’, ‘probably no’, or ‘no information at all’ response to Q1.1 – Was the allocation sequence random?
For blinding, we considered blinding of caregivers and outcomes assessors to be associated with a low risk of bias. If authors mentioned only one category, this was considered unclear, and if blinding of neither caregivers nor outcome assessors was reported, we assigned this as a high risk of bias.
• Low risk of bias: study reports blinding of caregivers and outcome assessors; based on a ‘no’ or ‘probably no’ response Q2.2 and Q4.1, which relate to whether these people were aware of the intervention assignment of animals.
• Unclear risk of bias: study reports blinding of caregivers or outcome assessors but not both; based on a ‘no’ or ‘probably no’ response to Q2.2 or Q4.1.
• High risk of bias: study that did not fall into the above two categories.
In CINeMA, indirectness refers to how closely the samples resemble the populations in which the intervention will be used. Given the narrow eligibility criteria for this review, indirectness was not considered an issue, and therefore the concerns were low for all studies. As the ability to assess across-studies bias in network meta-analysis is poorly developed, and no studies had a sufficient number of pairs such that pairwise assessment would be informative, this was not assessed. To assess imprecision (which indicates whether the boundaries of the confidence intervals for the treatment effects could allow different conclusions), we considered 0.8 to be a clinically relevant odds ratio. We used the same odds ratio of 0.8 to assess heterogeneity (NB: log(0.8) = −0.2231436 or 0.2231436). We did not present the inconsistency analysis from CINeMA because this was already conducted based on the Bayesian analysis.
Additional analyses
No additional analyses were conducted.
Results and discussion
Study selection
The flow of studies from retrieval to inclusion in the meta-analysis of the BRD morbidity outcome within 45 days of arrival at the feedlot is presented in Fig. 1 (Moher et al., Reference Moher, Liberati, Tetzlaff and Altman2009). The other outcomes were not reported, as the data available were too sparse. The flow chart shows numbers of unique studies. Some articles had multiple studies, some studies had multiple comparisons, and some studies report the outcome at multiple time periods. Fifty-three studies report at least one BRD morbidity outcome measured in the first 45 days in the feedlot period, which came from 44 articles (Griffin et al., Reference Griffin, Amstutz, Morter, Hendrix and Crandall1979; Wohler and Baugh, Reference Wohler and Baugh1980; Amstutz et al., Reference Amstutz, Horstman and Morter1981; Bennett, Reference Bennett1982; Morter et al., Reference Morter, Amstutz and Crandell1982; Confer et al., Reference Confer, Wright, Cummins, Panciera and Corstvet1983; Morter and Amstutz, Reference Morter and Amstutz1983; Martin et al., Reference Martin, Acres, Janzen, Willson and Allen1984; Morter et al., Reference Morter, Amstutz and Roussel1984; Purdy et al., Reference Purdy, Livingston, Frank, Cummins, Cole and Loan1986; Smith et al., Reference Smith, Hicks, Gill and Ball1986; Thomas et al., Reference Thomas, Stott, Howard and Gourlay1986; Bateman, Reference Bateman1988; Jim et al., Reference Jim, Guichon and Shaw1988; Ribble et al., Reference Ribble, Jim and Janzen1988; McLean et al., Reference McLean, Smith, Gill and Randolph1990; Thorlakson et al., Reference Thorlakson, Martin and Peters1990; Van Donkersgoed et al., Reference Van Donkersgoed, Janzen, Townsend and Durham1990; Bechtol et al., Reference Bechtol, Ballinger and Sharp1991; Mills, Reference Mills1991; Harland et al., Reference Harland, Potter, van Drunen-Littel-van den Hurk, Van Donkersgoed, Parker, Zamb and Janzen1992; Koevering et al., Reference Koevering, Gill, Owens, Smith and Ball1992; van Donkersgoed et al., Reference van Donkersgoed, Schumann, Harland, Potter and Janzen1993; Malcolm-Callis et al., Reference Malcolm-Callis, Galyean and Duff1994; Wright et al., Reference Wright, Mowat and Mallard1994; Gummow and Mapham, Reference Gummow and Mapham2000; O'Connor et al., Reference O'Connor, Martin, Harland, Shewen and Menzies2001; Frank et al., Reference Frank, Briggs, Duff, Loan and Purdy2002; Frank et al., Reference Frank, Briggs, Duff and Hurd2003; MacGregor et al., Reference MacGregor, Smith, Perino and Hunsaker2003; Schunicht et al., Reference Schunicht, Booker, Jim, Guichon, Wildman and Hill2003; Kirkpatrick et al., Reference Kirkpatrick, Step, Payton, Richards, McTague, Saliki, Confer, Cook, Ingram and Wright2008; Perrett et al., Reference Perrett, Wildman, Abutarbush, Pittman, Jones, Pollock, Schunicht, Guichon, Jim and Booker2008; Stilwell et al., Reference Stilwell, Matos, Carolino and Lima2008; Wildman et al., Reference Wildman, Perrett, Abutarbush, Guichon, Pittman, Booker, Schunicht, Fenton and Jim2008; Rogers et al., Reference Rogers, Portillo, Smialek, Miles, Lehenbauer and Smyth2009; Wildman et al., Reference Wildman, Jim, Perrett, Schunicht, Hannon, Fenton, Abutarbush and Booker2009; Grooms et al., Reference Grooms, Brock, Bolin, Grotelueschen and Cortese2014; McKaig and Taylor, Reference McKaig and Taylor2015; Richeson et al., Reference Richeson, Beck, Poe, Gadberry, Hess and Hubbell2015; Rogers et al., Reference Rogers, Miles, Hughes, Renter, Woodruff and Zuidhof2015; Bailey et al., Reference Bailey, Jaeger, Schmidt, Waggoner, Pacheco, Thomson and Olson2016; Rogers et al., Reference Rogers, Miles, Renter, Sears and Woodruff2016; White et al., Reference White, Theurer, Goehl and Thompson2017).
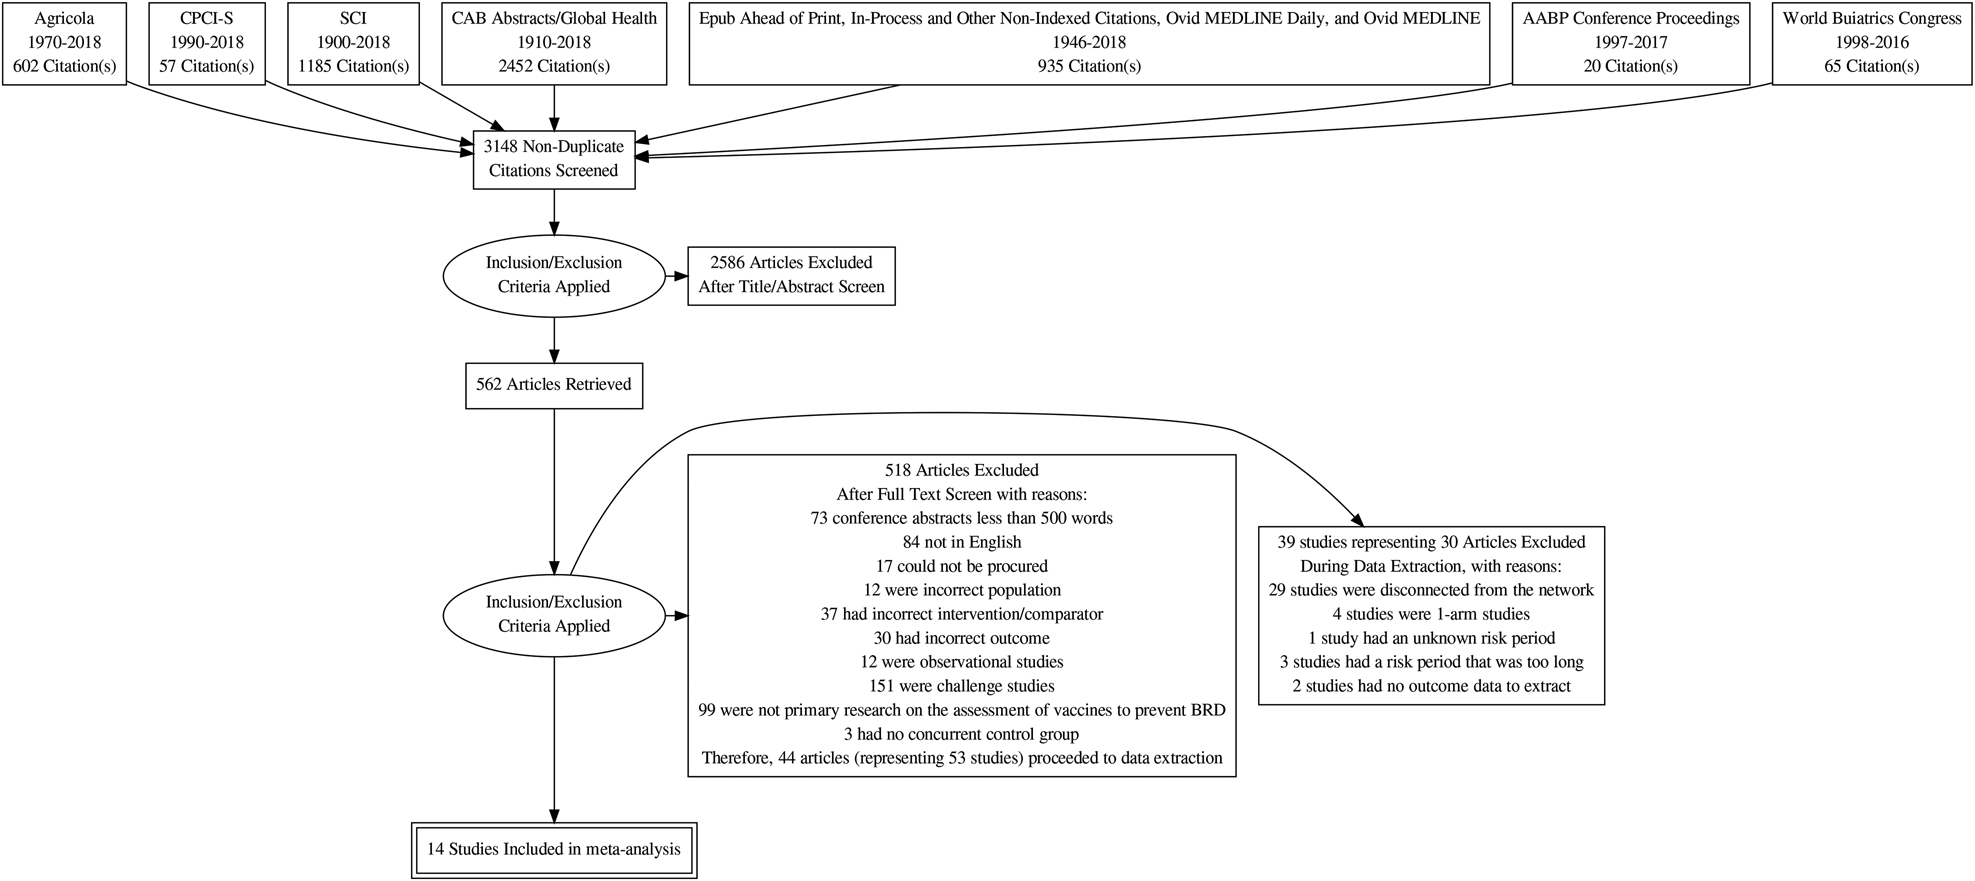
Fig. 1. Flowchart describing the flow of literature through the review.
The 53 studies were conducted in five countries, most commonly in the USA (N = 30/53; 56.5%) and Canada (N = 20/53; 37.5%). The year the study was conducted was reported for 37 out of 53 studies (69.8%), which was between 1978 and 2016. The studies were conducted on commercial feedlots (19/53; 35.8%), university/research feedlots (15/53; 28.3%), feedlots of unspecified type (14/53; 26.4%), setting not reported (2/53; 3.8%), a custom feedlot (1/53; 1.9%), a backgrounding yard (1/53; 1.9%), and a beef rearing farm (1/53; 1.9%).
Presentation of network structure
Although 53 studies were potentially relevant to the review, their approach to conducting BRD vaccine trials had major implications for the ability to assess the comparative efficacy of vaccines. A commonly used approach was to employ a control arm that received vaccines. For example, some authors might refer to a four-arm study as follows:
• Arm 1 – placebo
• Arm 2 – Mannheimia heamolytica vaccine
• Arm 3 – Histophilus somnus vaccine
• Arm 4 – Histophilus somnus and Mannhemia heamolytica vaccines
However, other authors might report that all animals received a four-way modified live viral (MLV) vaccine containing antigens for infectious bovine rhinotracheitis, BVDV, PI3, and BRSV upon arrival at the feedlot. As a consequence, the actual treatment arms would be:
• Arm 1 – four-way MLV vaccine
• Arm 2 – four-way MLV vaccine + Mannhemia heamolytica vaccine
• Arm 3 – four-way MLV vaccine + Histophilus somnus
• Arm 4 – four-way MLV vaccine + Histophilus somnus and Mannhemia heamolytica vaccines
Similarly, another study might be described as a controlled two-arm study of the following vaccines:
• Arm 1 – four-way killed vaccine
• Arm 2 – four-way MLV vaccine
However, as all animals in the feedlot, and therefore in the trial, were reported to have also received a Mannhemia heamolytica vaccine during processing, the actual treatment arms would be:
• Arm 1 – Mannhemia heamolytica vaccine + four-way killed vaccine
• Arm 2 – Mannhemia heamolytica vaccine + four-way MLV vaccine
This approach to study design means that each combination of vaccines must be treated as a novel treatment. Further fragmenting the data is the fact that it is not clear whether vaccines from different companies that target the same viral or bacterial organism are the same and that estimates of efficacy can or should be pooled. This situation contrasts with the situation encountered with antibiotics. For example, estimates of efficacy of the antibiotic oxytetracycline produced by many manufacturers were pooled to obtain a summary estimate, which seems reasonable because manufacturers must document equivalence with a registered product prior to approval by the US Food and Drug Administration. However, there is no documented evidence that such pooling is appropriate for BRD vaccines. For example, the USDA Center for Veterinary Biologics, which licenses vaccines in the USA, requires companies to document the efficacy of a vaccine rather than its equivalence to a previously registered product. This is presumably because different antigens, adjuvants, or challenge models could impact efficacy. The exception to this is when exactly the same product is re-marketed (i.e., re-bottled/re-labeled) and sold by a different company. However, it is often unclear to end-users when products are relabeled, so there is rarely the opportunity to combine vaccines that are known to be the same.
A consequence of these characteristics of the body of evidence for BRD vaccines is that the evidence network contains mainly novel vaccine protocol arms. As shown in Table S6, there were almost as many vaccine protocols as study arms, and almost 90% of vaccine protocols were unique. Also, because many trials used control arms with different products, it was not possible to link many vaccination protocols and compare efficacy. This point is illustrated in Fig. 2, which shows two important features. First, 17 groups of vaccine studies were not linked, and second, many of these groups evaluated unique combinations that were not replicated by other studies. The largest network was the star-shaped network that was tethered to a true non-active control (i.e., no other vaccine). Meta-analysis requires replication, otherwise, its major advantage (i.e., calculation of a pooled effect size using data from multiple studies) is not realized. Furthermore, it is difficult to make strong inferences about single study results because the result may be an isolated random effect.
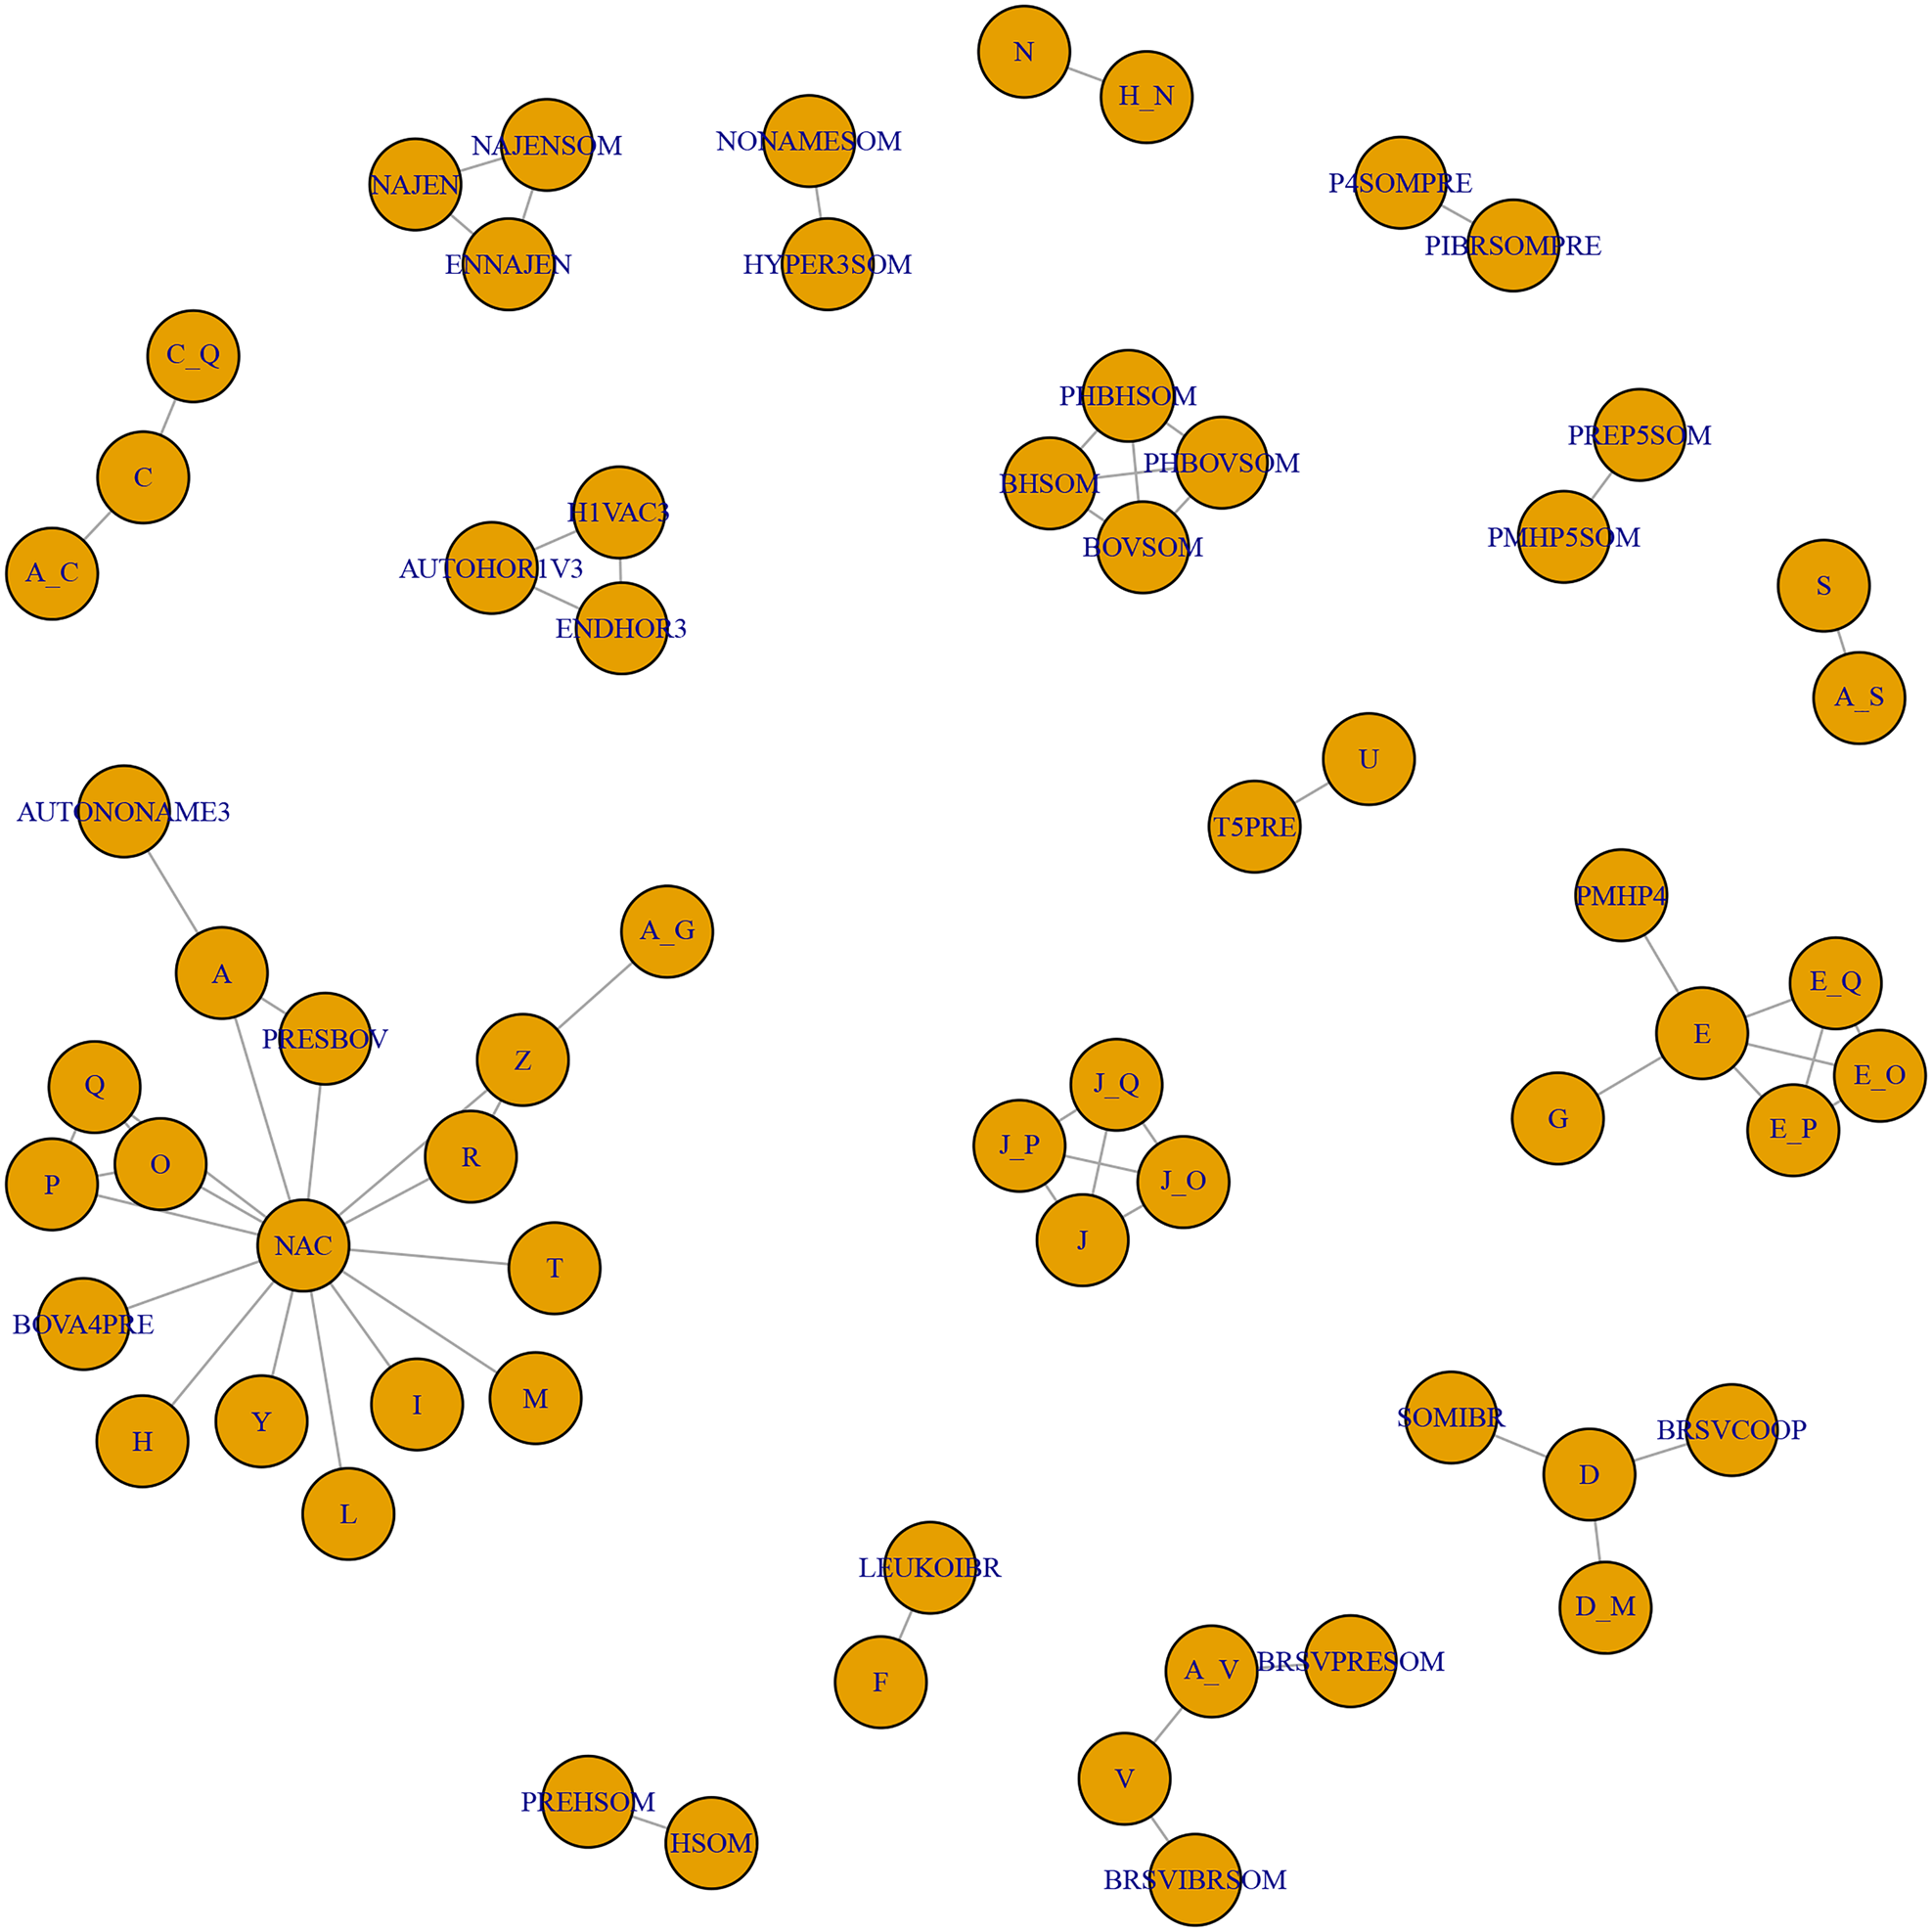
Fig. 2. The full network of studies relevant to the review. Each circle represents a vaccine, and lines between circles indicate a direct comparison. The key is reported in Table S6.
Due to these characteristics, it was necessary to limit the network meta-analysis to treatments of single products linked in the largest network to true non-active control. We expected, when two products were used in combination, to be able to assess evidence of an interaction by comparing the interaction term from predicted single-vaccine effects from the model with the observed effect size reported by the combination arm; however, the comparisons required were not reported.
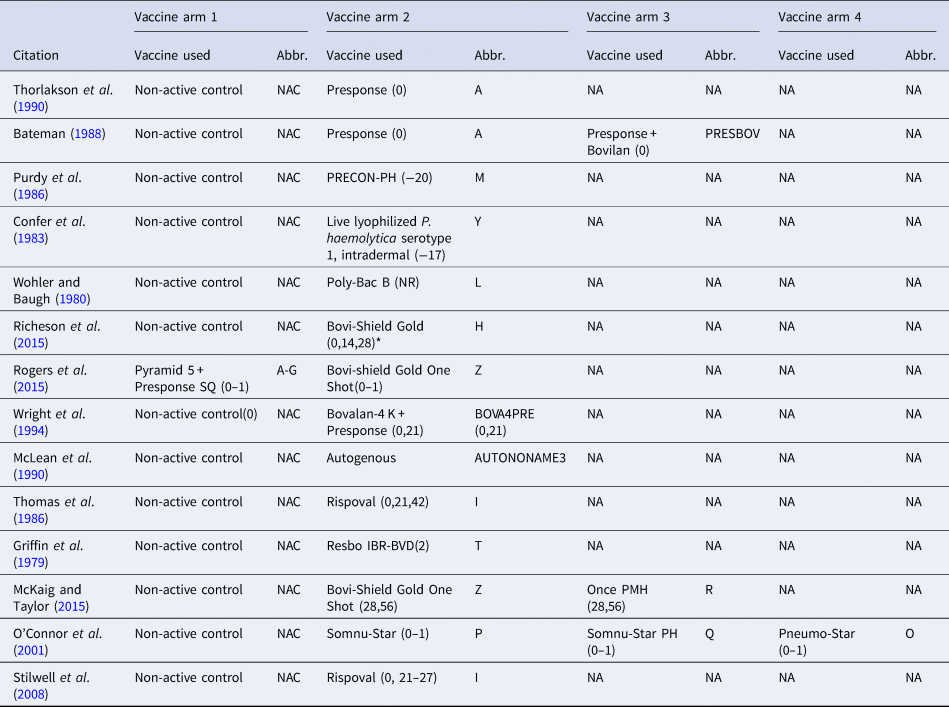
Therefore, the final network used in the meta-analysis to describe the efficacy of BRD vaccines contained vaccines evaluated in only 14 studies (Griffin et al., Reference Griffin, Amstutz, Morter, Hendrix and Crandall1979; Wohler and Baugh, Reference Wohler and Baugh1980; Confer et al., Reference Confer, Wright, Cummins, Panciera and Corstvet1983; Purdy et al., Reference Purdy, Livingston, Frank, Cummins, Cole and Loan1986; Thomas et al., Reference Thomas, Stott, Howard and Gourlay1986; Bateman, Reference Bateman1988; McLean et al., Reference McLean, Smith, Gill and Randolph1990; Thorlakson et al., Reference Thorlakson, Martin and Peters1990; Wright et al., Reference Wright, Mowat and Mallard1994; O'Connor et al., Reference O'Connor, Martin, Harland, Shewen and Menzies2001; Stilwell et al., Reference Stilwell, Matos, Carolino and Lima2008; McKaig and Taylor, Reference McKaig and Taylor2015; Richeson et al., Reference Richeson, Beck, Poe, Gadberry, Hess and Hubbell2015; Rogers et al., Reference Rogers, Miles, Hughes, Renter, Woodruff and Zuidhof2015), which included 17 vaccines and 73 treatment arms (Fig. 3). The vaccine regimens used by these studies are reported in Table 1. As shown in Table 1, not all trials report the use of the vaccine explicitly at arrival, but the results of all 17 vaccine protocols are included for completeness. Of these 14 studies, two were three-arm trials, one was a four-arm trial, and the remainder were two-arm trials. Twelve studies were non-active control-to-active comparisons, and two studies were active-to-active comparisons.
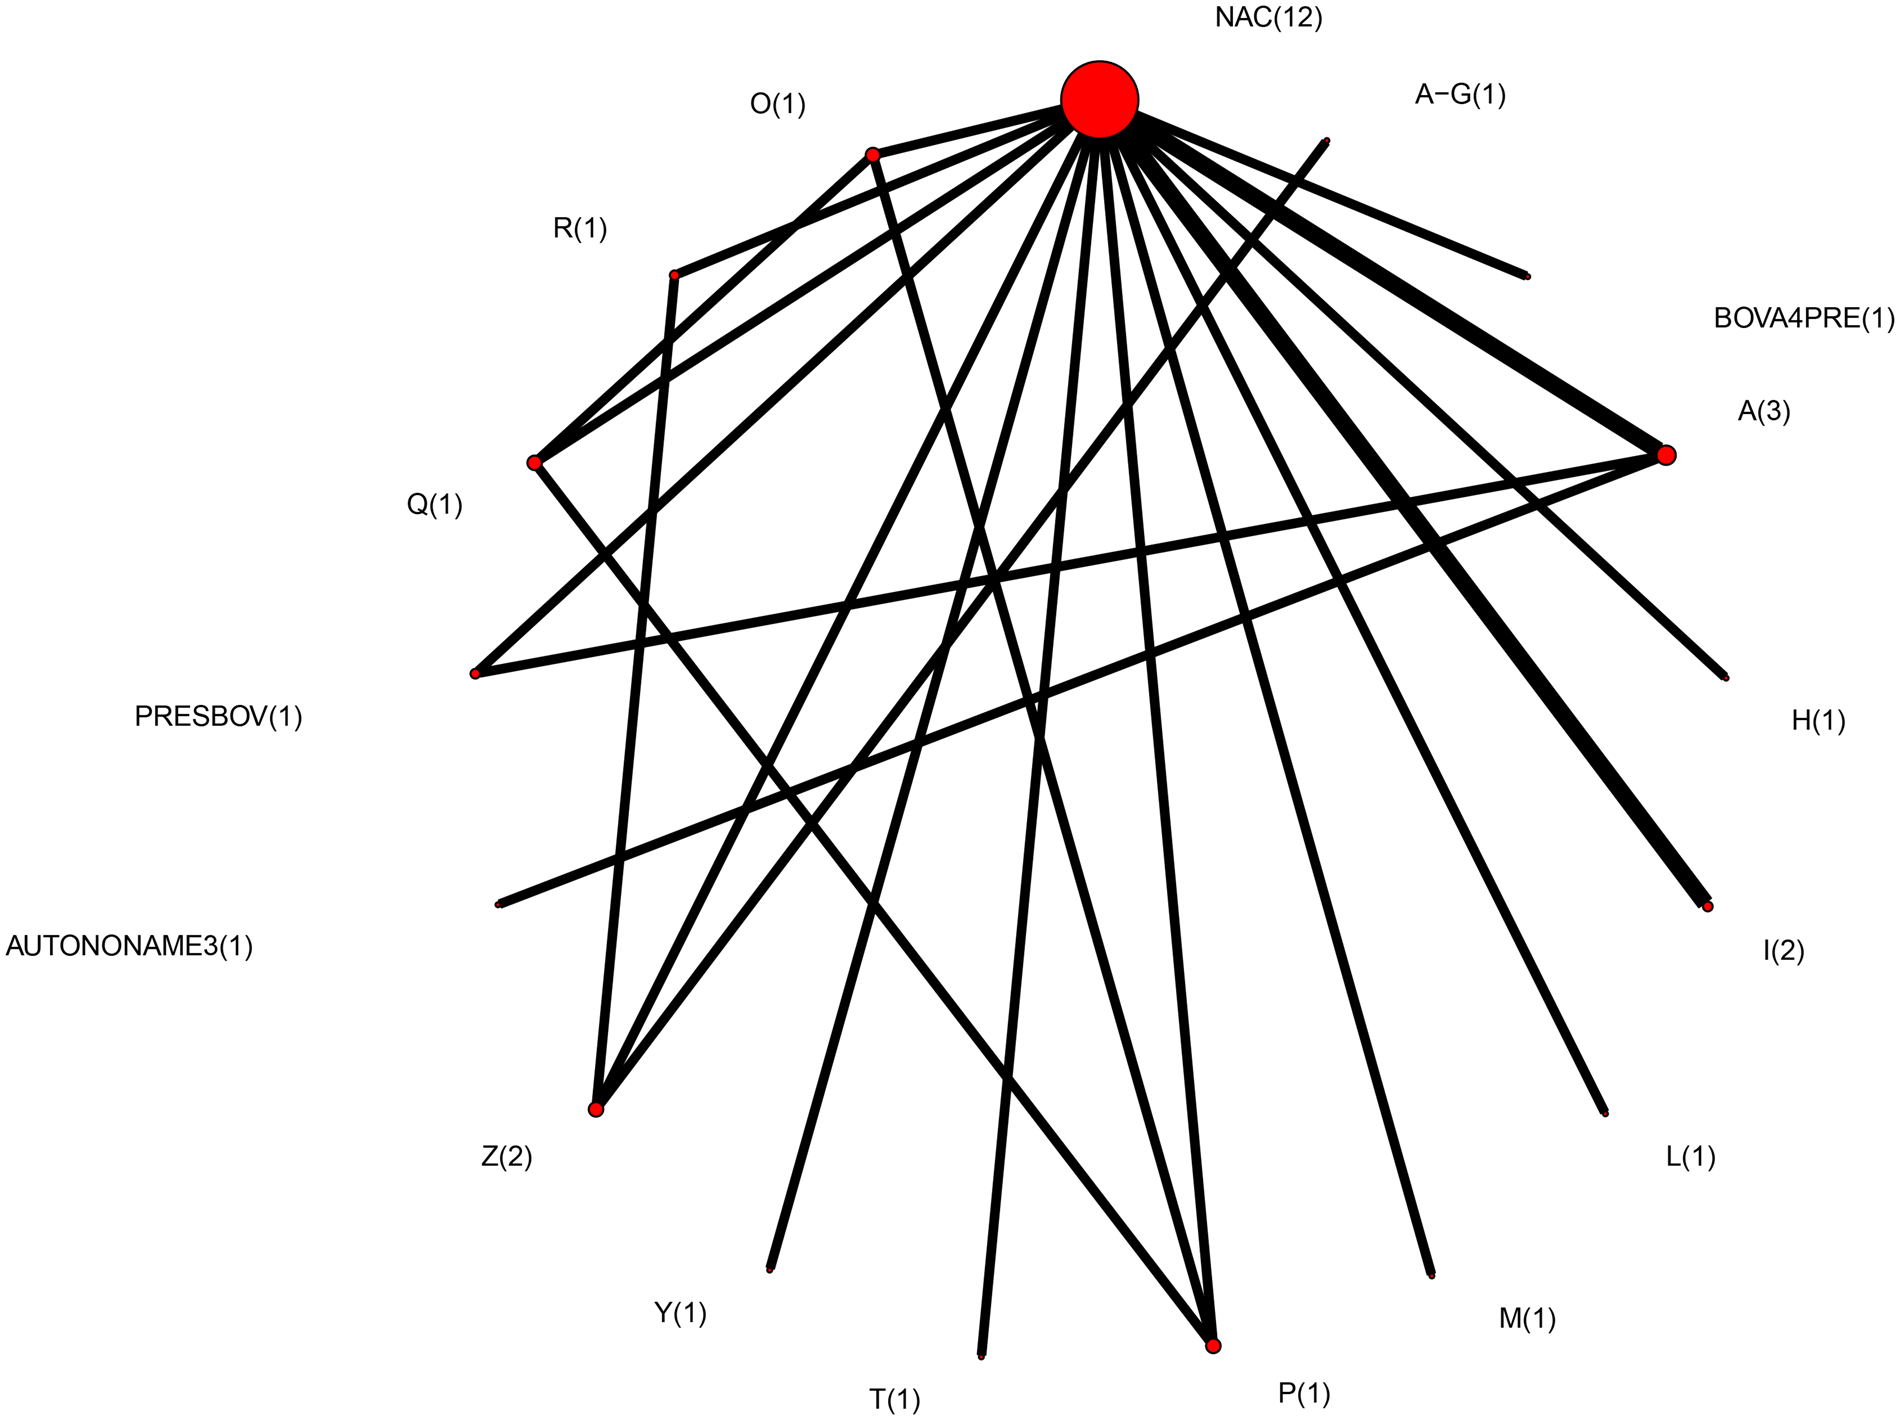
Fig. 3. The network of treatment arms used in mixed-treatment comparison meta-analysis. The size of the dot is a relative indicator of the number of arms, and the width of the line is a relative indicator of the number of direct comparisons (i.e., number of arms). Lines between circles indicate a direct comparison. Abbreviations are defined in Table 1.
Table 1. The vaccine product used and abbreviations in each study arm in the largest network of studies included in the review. The day the product was administered is included in parentheses

The day of arrival is considered day 0; (0–1) means that the vaccine was administered over 2 days (day 0 and day 1), and (0,1) means that the vaccine was administered on day 0 and day 1. NR means the date of vaccination was not reported, and NA means not applicable.
Summary of network geometry
The geometry of the meta-analysis network was sparse, with many vaccine regimens being assessed only once (Fig. 3). This network would be considered diverse as measured by a PIE index of 0.86 (Salanti et al., Reference Salanti, Kavvoura and Ioannidis2008). This finding is consistent with a visual examination of the network, which includes a large number of treatments (Fig. 3). The C-score was 1.6, and the C-score test had a large P-value (P = 0.57). These metrics evaluate how encounters occur in ecological populations, and when used in a network meta-analysis, they assess whether particular pairwise comparisons occur more (or less) often than expected by random encounter. Given the absence of replication in the entire network, the lack of statistical evidence of preferred comparisons is not surprising.
Study characteristics and study results
Descriptive information for studies is provided in the supplementary materials along with their definitions of success and exclusion criteria (Table S7). Particularly interesting information in this table relates to the baseline conditions applied to all animals in each trial. Notably, some authors failed to clearly document concurrent treatments such as non-BRD-related vaccinations, antiparasitic treatments, and antibiotics received.
Definitions of BRD are reported in Table S9. When multiple studies were described in the same article, they used the same definitions of the outcome and exclusion criteria, so the tables are indexed by article rather than study. The definitions of outcomes were very consistent across articles and frequently reported. The approach to handling BRD cases diagnosed at arrival is also reported in Table S8.
Individual study risk of bias
The results of individual study risk of bias assessments are shown in (Table S10). No studies were cluster-randomized trials, which is not unexpected for vaccine trials. For the design features most known to impact bias in veterinary science – randomization and blinding – most studies had an unclear risk of bias due to incomplete reporting. This is likely a function of the age of most vaccine studies. Although reporting of design features such as randomization and blinding has been improving (Totton et al., Reference Totton, Cullen, Sargeant and O'Connor2018), many of these studies are older.
Individual study results
As the individual study results were available in multiple forms (e.g., raw data, risk estimates, odds ratios), these were transformed to pooled risk ratios (when more than one study was available) in the final meta-analysis, which is shown in Table 2.
Table 2. Risk ratio of all possible pairwise comparisons within the evidence network
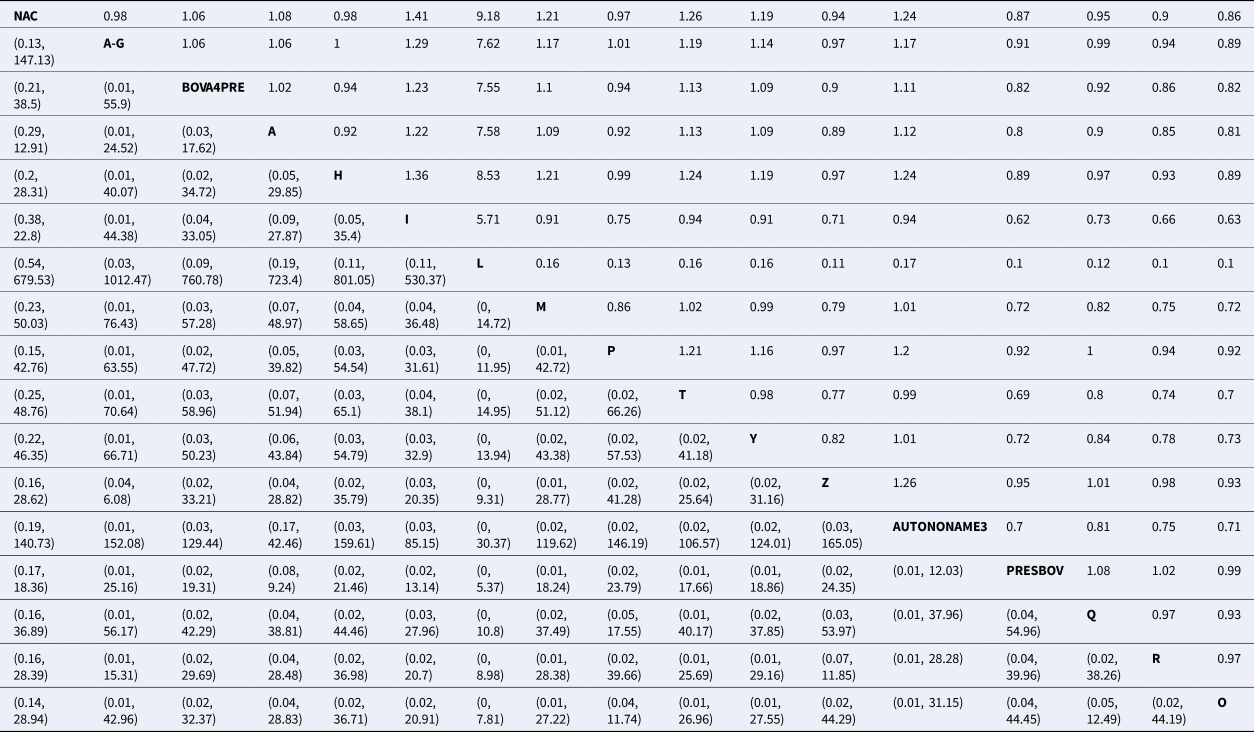
The upper right-hand quadrant represents the estimated risk ratio, and the lower quadrant represents the 95% confidence interval.
Abbreviations are defined in Table 1.
Synthesis of results
For the final meta-analysis including 14 studies, measures of convergence for the Bayesian model were within normal limits, which was assessed by visual examination of trace plots. The results of the model are presented in several ways. The estimates of average rank are provided in Fig. 4. Lower rankings are associated with a lower incidence of BRD post-vaccination (i.e., a vaccine associated with the lowest or highest BRD diagnosis post-arrival would have a ranking of 1 or 17, respectively). The non-active control group (NAC), which is based on 14 arms of data, has a middle rank. The rankings were extremely close to each other, suggesting little difference in the performance of vaccine protocols. There was not a single median rank separated by more than one unit for 16 of the 17 vaccines. For example, the second and third highest-ranked vaccine protocols had ranks of 6.82 and 7.74, respectively. Overall, the 16 products had rankings ranging from 6 to 12. By definition, a ranking plot must impose an order on the vaccines included in the meta-analysis, but the closeness of the ranking estimates illustrates that it was not possible to differentiate vaccines based on performance. The probability distributions of vaccination responses (i.e., control of BRD) is presented in Table S13 and Fig. S1. These distributions provide a different way of presenting information from the ranking plot and show that the vaccines are poorly differentiated. Similarly, Table 2 reports wide confidence intervals, which give no indication of any vaccine being substantially better or worse than the non-active control group in controlling BRD events.
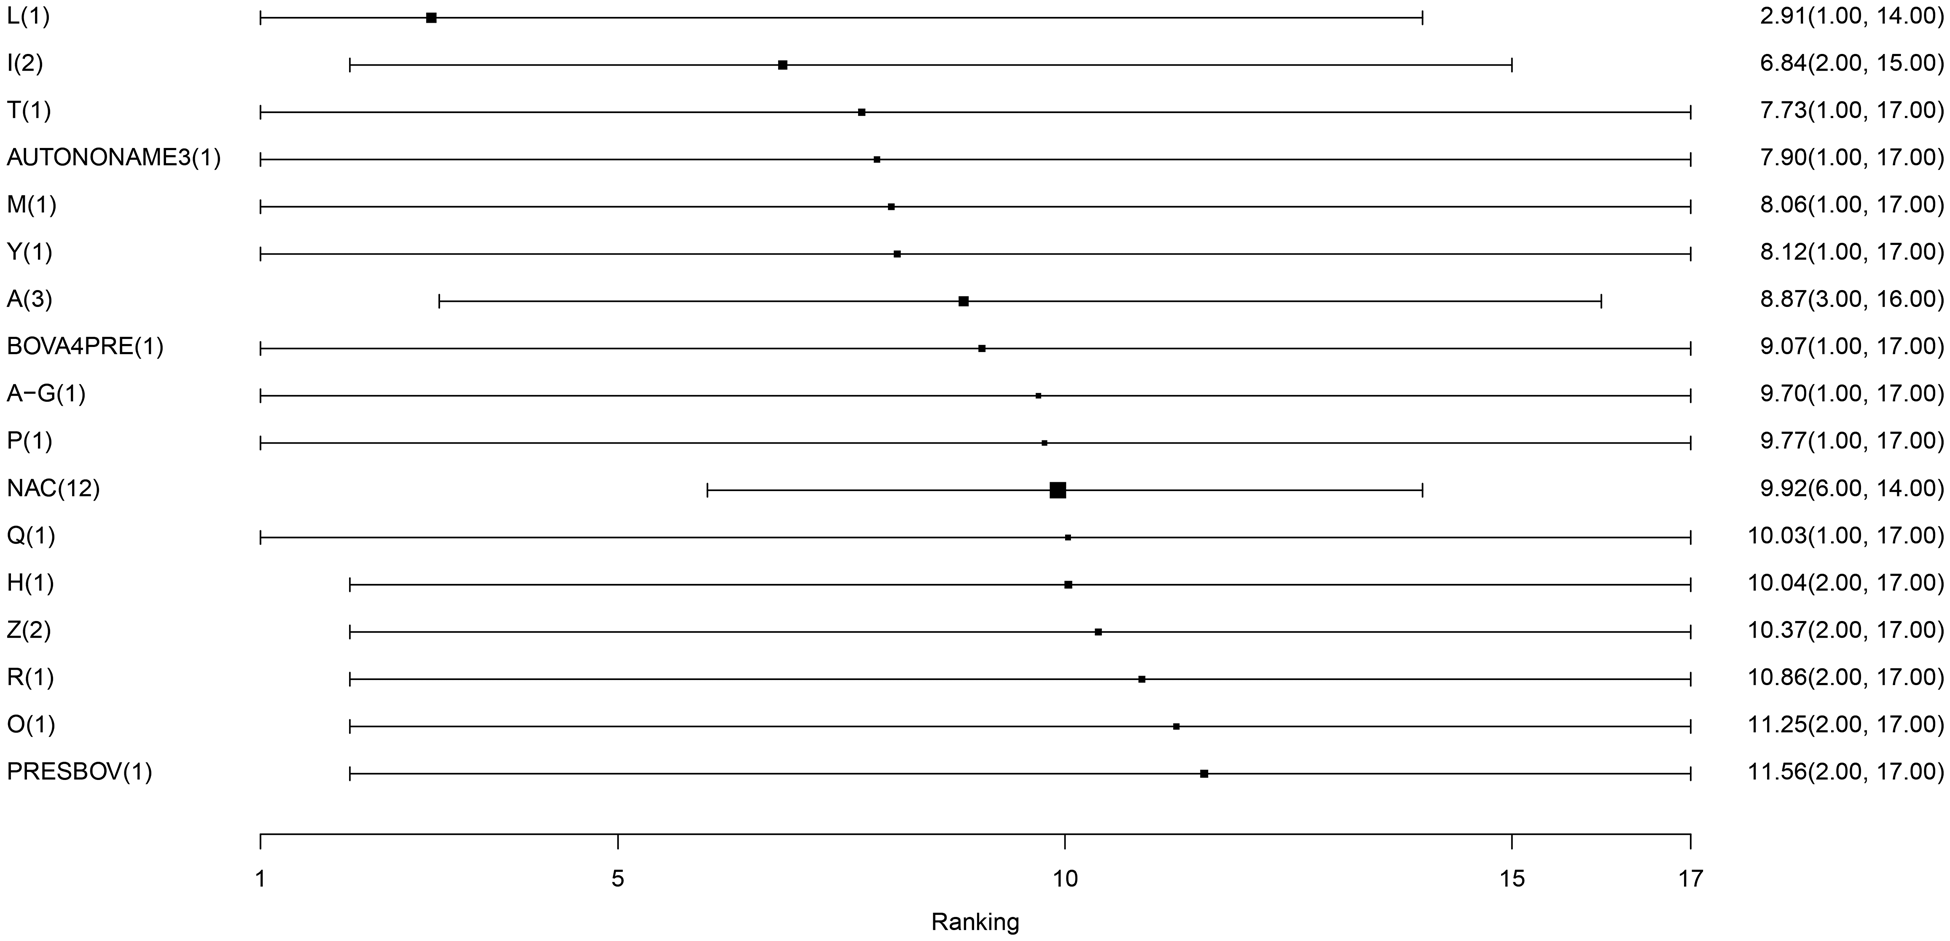
Fig. 4. The ranking plot of vaccine protocols included in the largest connected network. The scale of rankings is 1 to 17, with lower numerical rankings indicating the lower incidence of BRD. The black box represents the point estimate of the ranking, and the horizontal line represents the 95% confidence interval. Abbreviations are defined in Table 1. The size of the black box is reflecting on the weighing, which is the inverse of the variance. Since NAC has the smallest variance, it has the largest precision and therefore larger size of box.
Exploration of inconsistency
The consistency between the direct and indirect sources of evidence of the final model including 14 trials and 73 arms is reported in Table 3. There was no evidence of inconsistency between the direct and indirect estimates. Again, the potential cause of this finding is that the small number of studies available for some comparisons means that the confidence intervals for direct estimates were wide, making it difficult to detect differences between direct and indirect estimates.
Table 3. Results of indirect comparisons for the consistency assumption
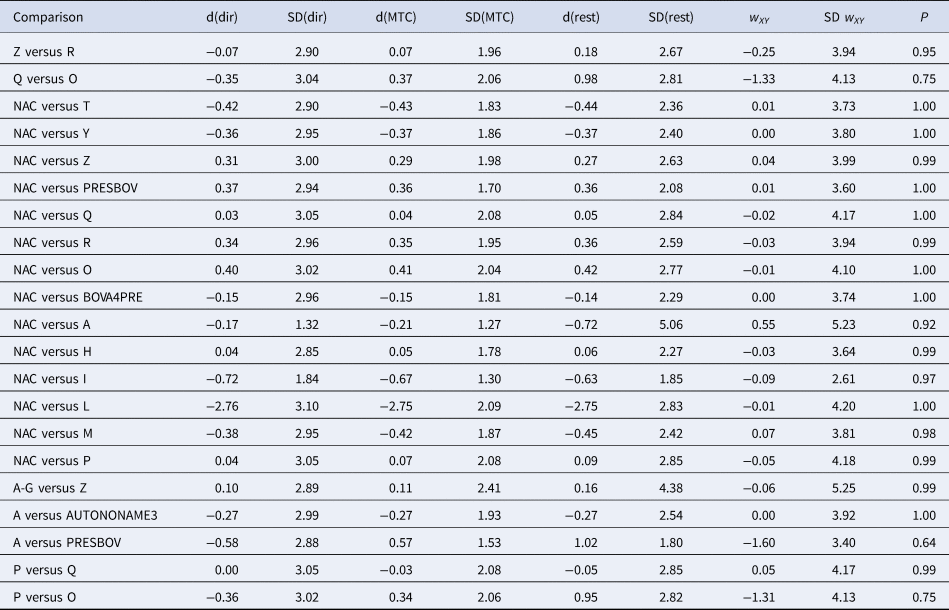
Posterior means (d) and standard deviations (SDs) of log odds ratios of treatment effects calculated using direct evidence only (dir), all evidence (MTC), or indirect evidence only (rest). The treatment on the left is the reference (denominator) and on the right is the comparator (numerator). w and SD(w) are the inconsistency estimate and SD of the inconsistency estimate, respectively.
Risk of bias across studies
As there were many possible pairwise comparisons for the risk of bias assessment across studies, we present a subset for illustrative purposes. As no vaccines appeared to be more effective than the non-active control, the overall picture of the risk of bias is more relevant than any particular pairwise comparison. Table S11 shows the number of direct comparisons available, with the largest number being two. Risk of bias assessment based on randomization status is presented in Figs. 5 and 6. Risk of bias assessment based on blinding status is presented in Figs. 7 and 8. These are split into two sets of studies for ease of presentation. The overall picture is of a body of work with incomplete reporting of randomization and blinding.
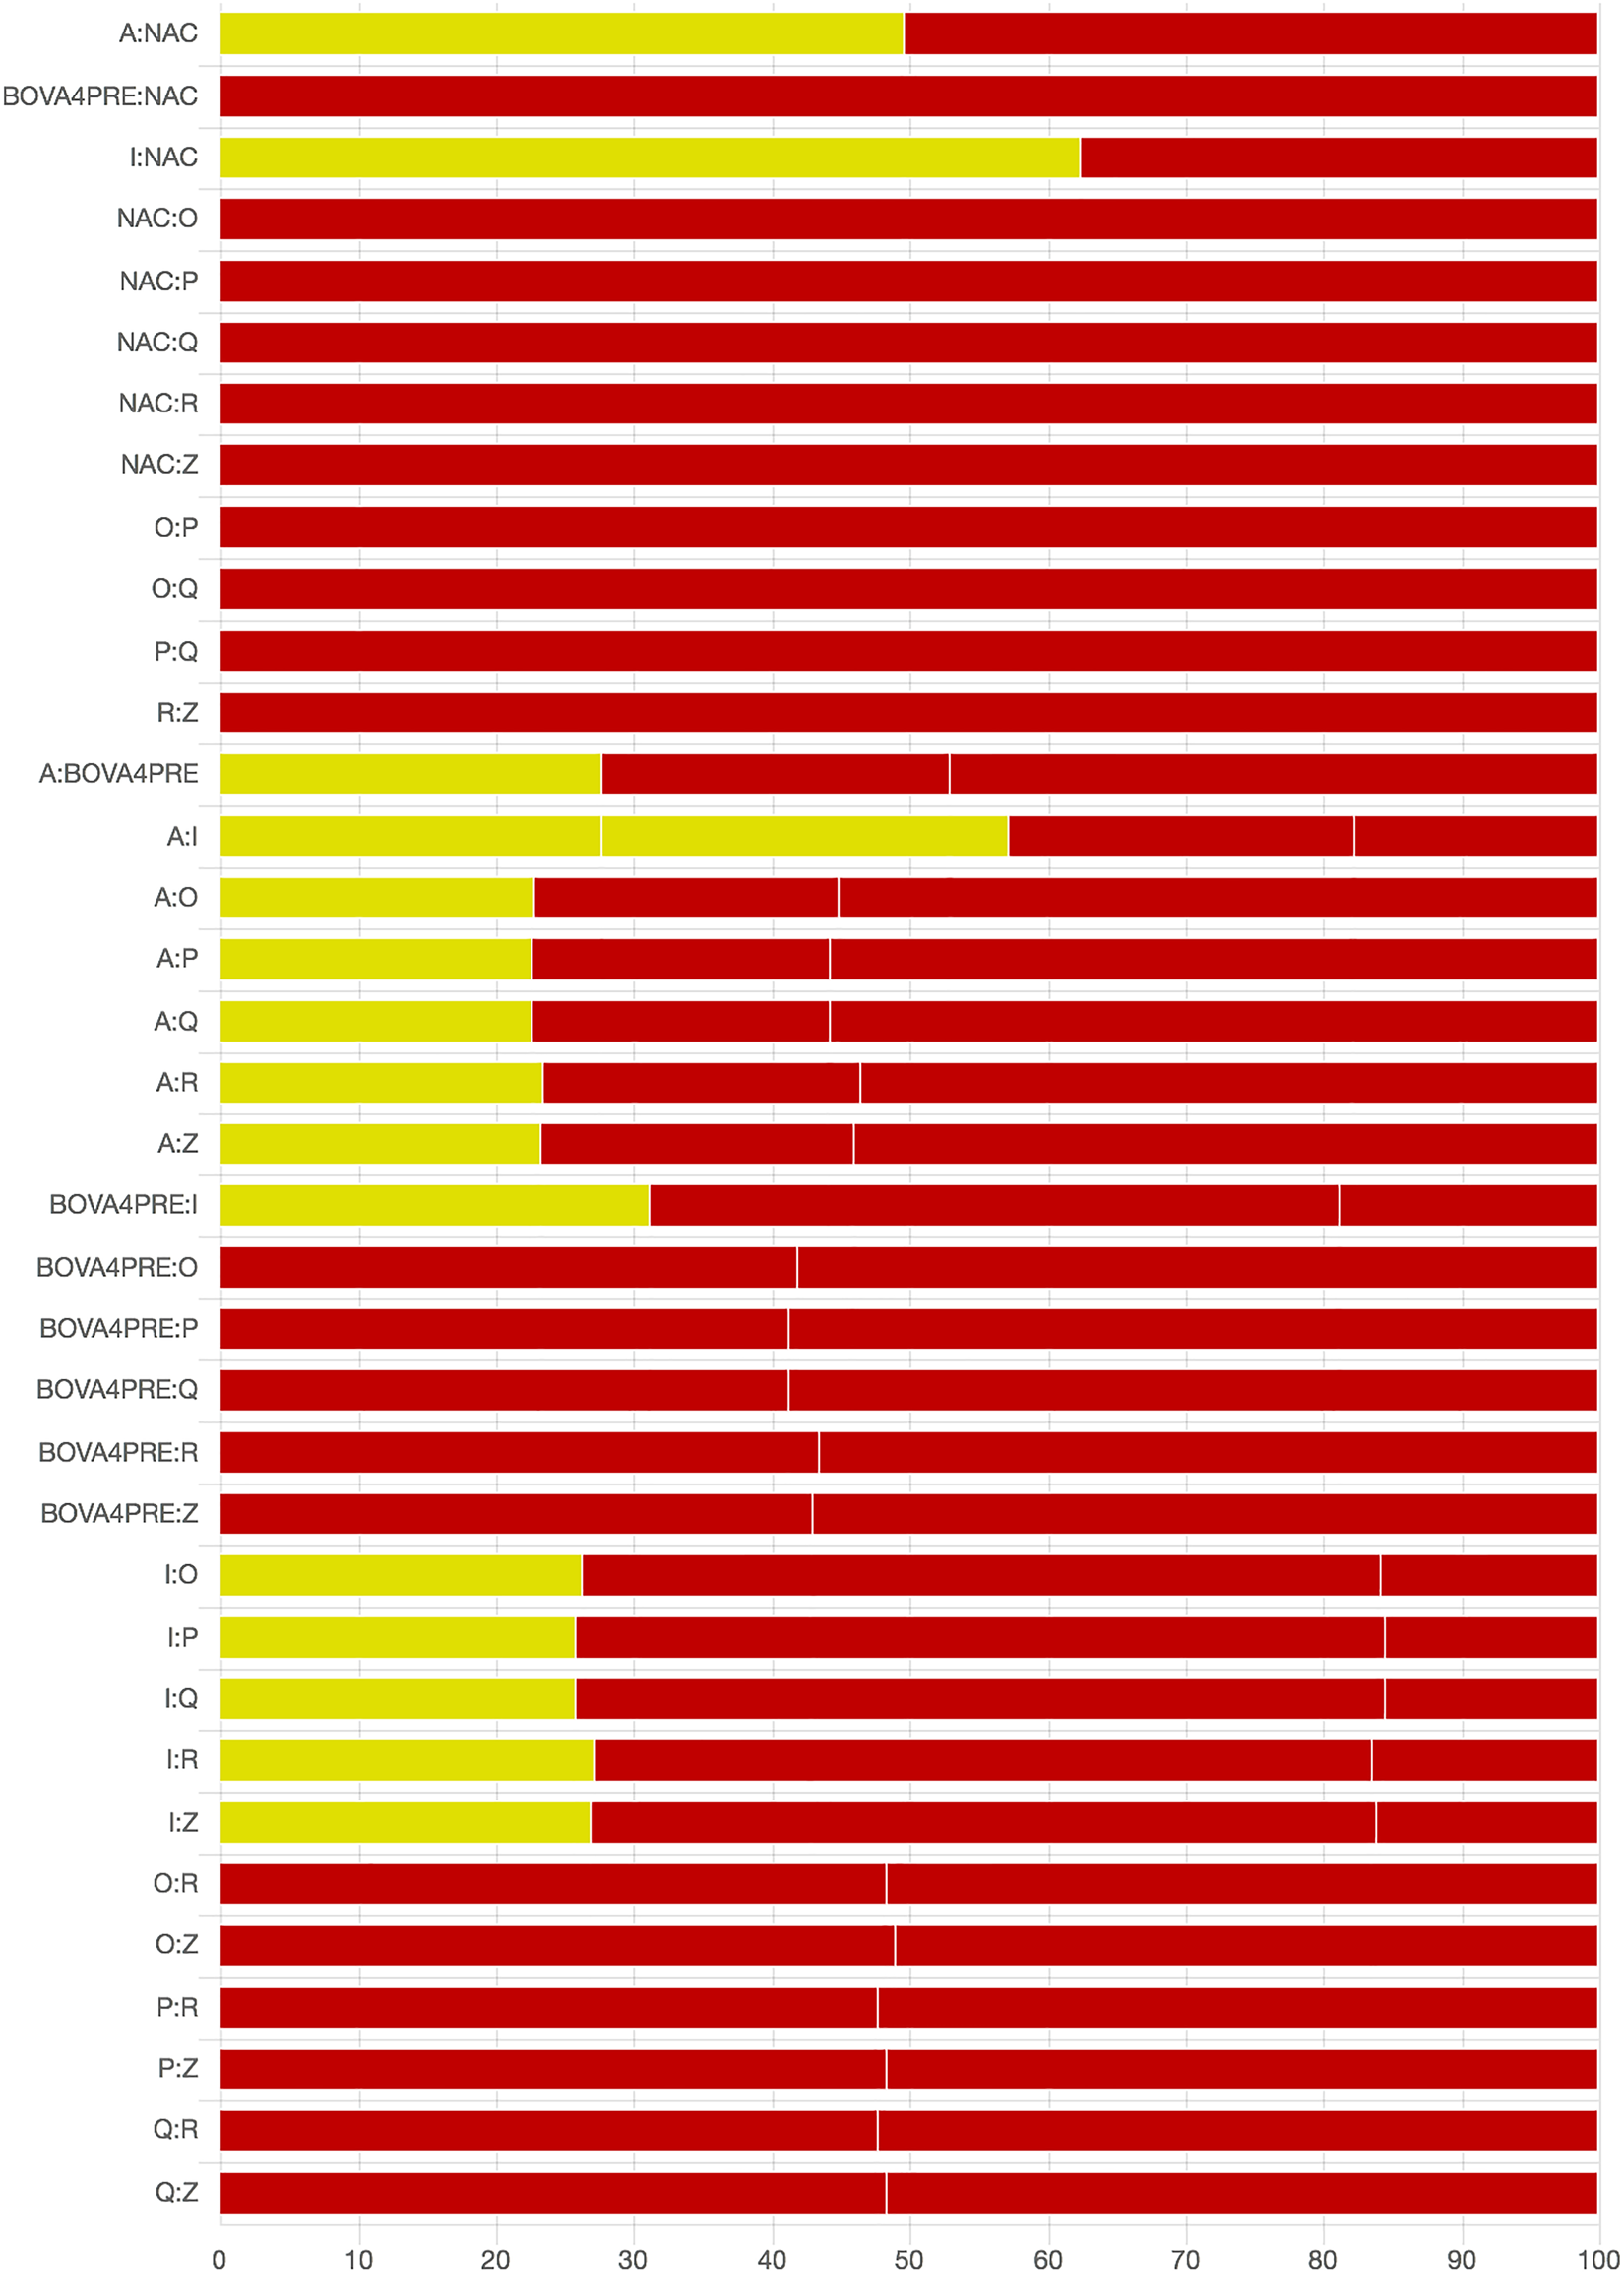
Fig. 5. Part 1: Contribution of studies to the point estimate based on the description of the allocation approach. Green indicates a study providing evidence of random allocation, yellow indicates a study reporting random allocation but providing no supporting evidence, and red indicates a study reporting no allocation approach or a non-random allocation approach. White vertical lines indicate the percentage contribution of separate studies. Each bar shows the percentage contribution from studies judged to be at low (green), moderate (yellow), and high (red) risk of bias.
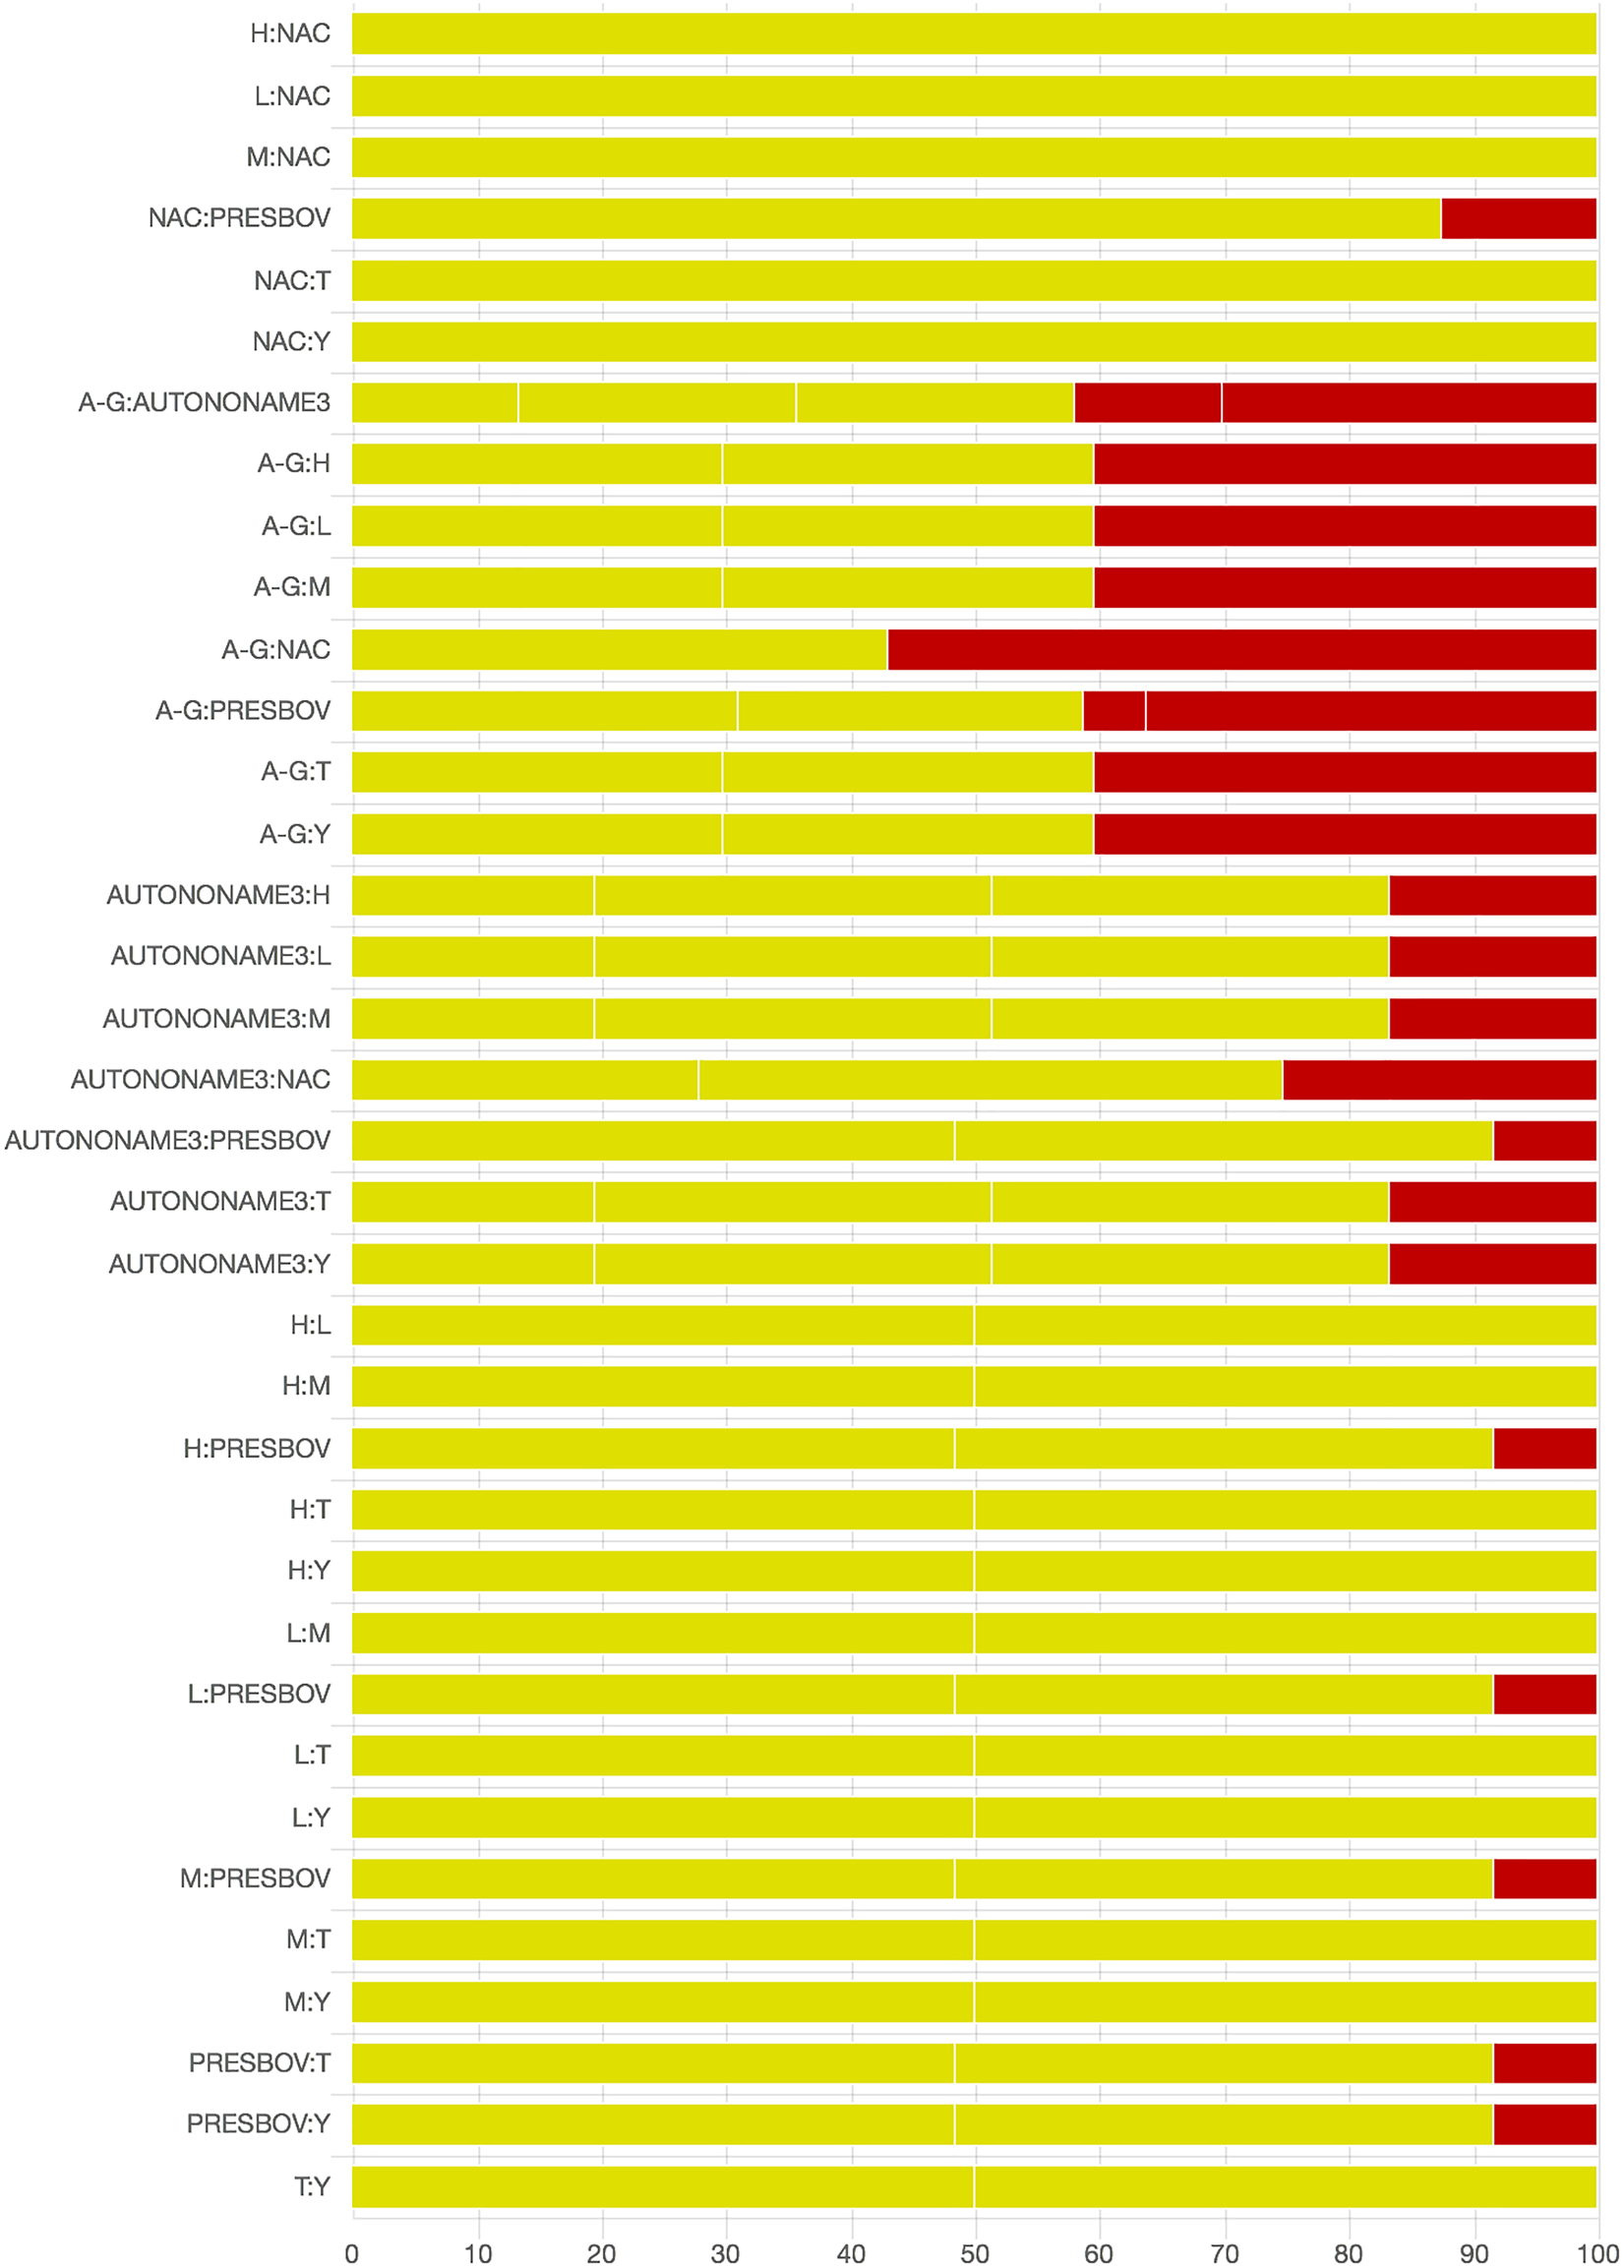
Fig. 6. Part 2: Contribution of studies to the point estimate based on the description of the allocation approach. Green indicates a study providing evidence of random allocation, yellow indicates a study reporting random allocation but providing no supporting evidence, and red indicates a study reporting no allocation approach or a non-random allocation approach. White vertical lines indicate the percentage contribution of separate studies. Each bar shows the percentage contribution from studies judged to be at low (green), moderate (yellow) and high (red) risk of bias.
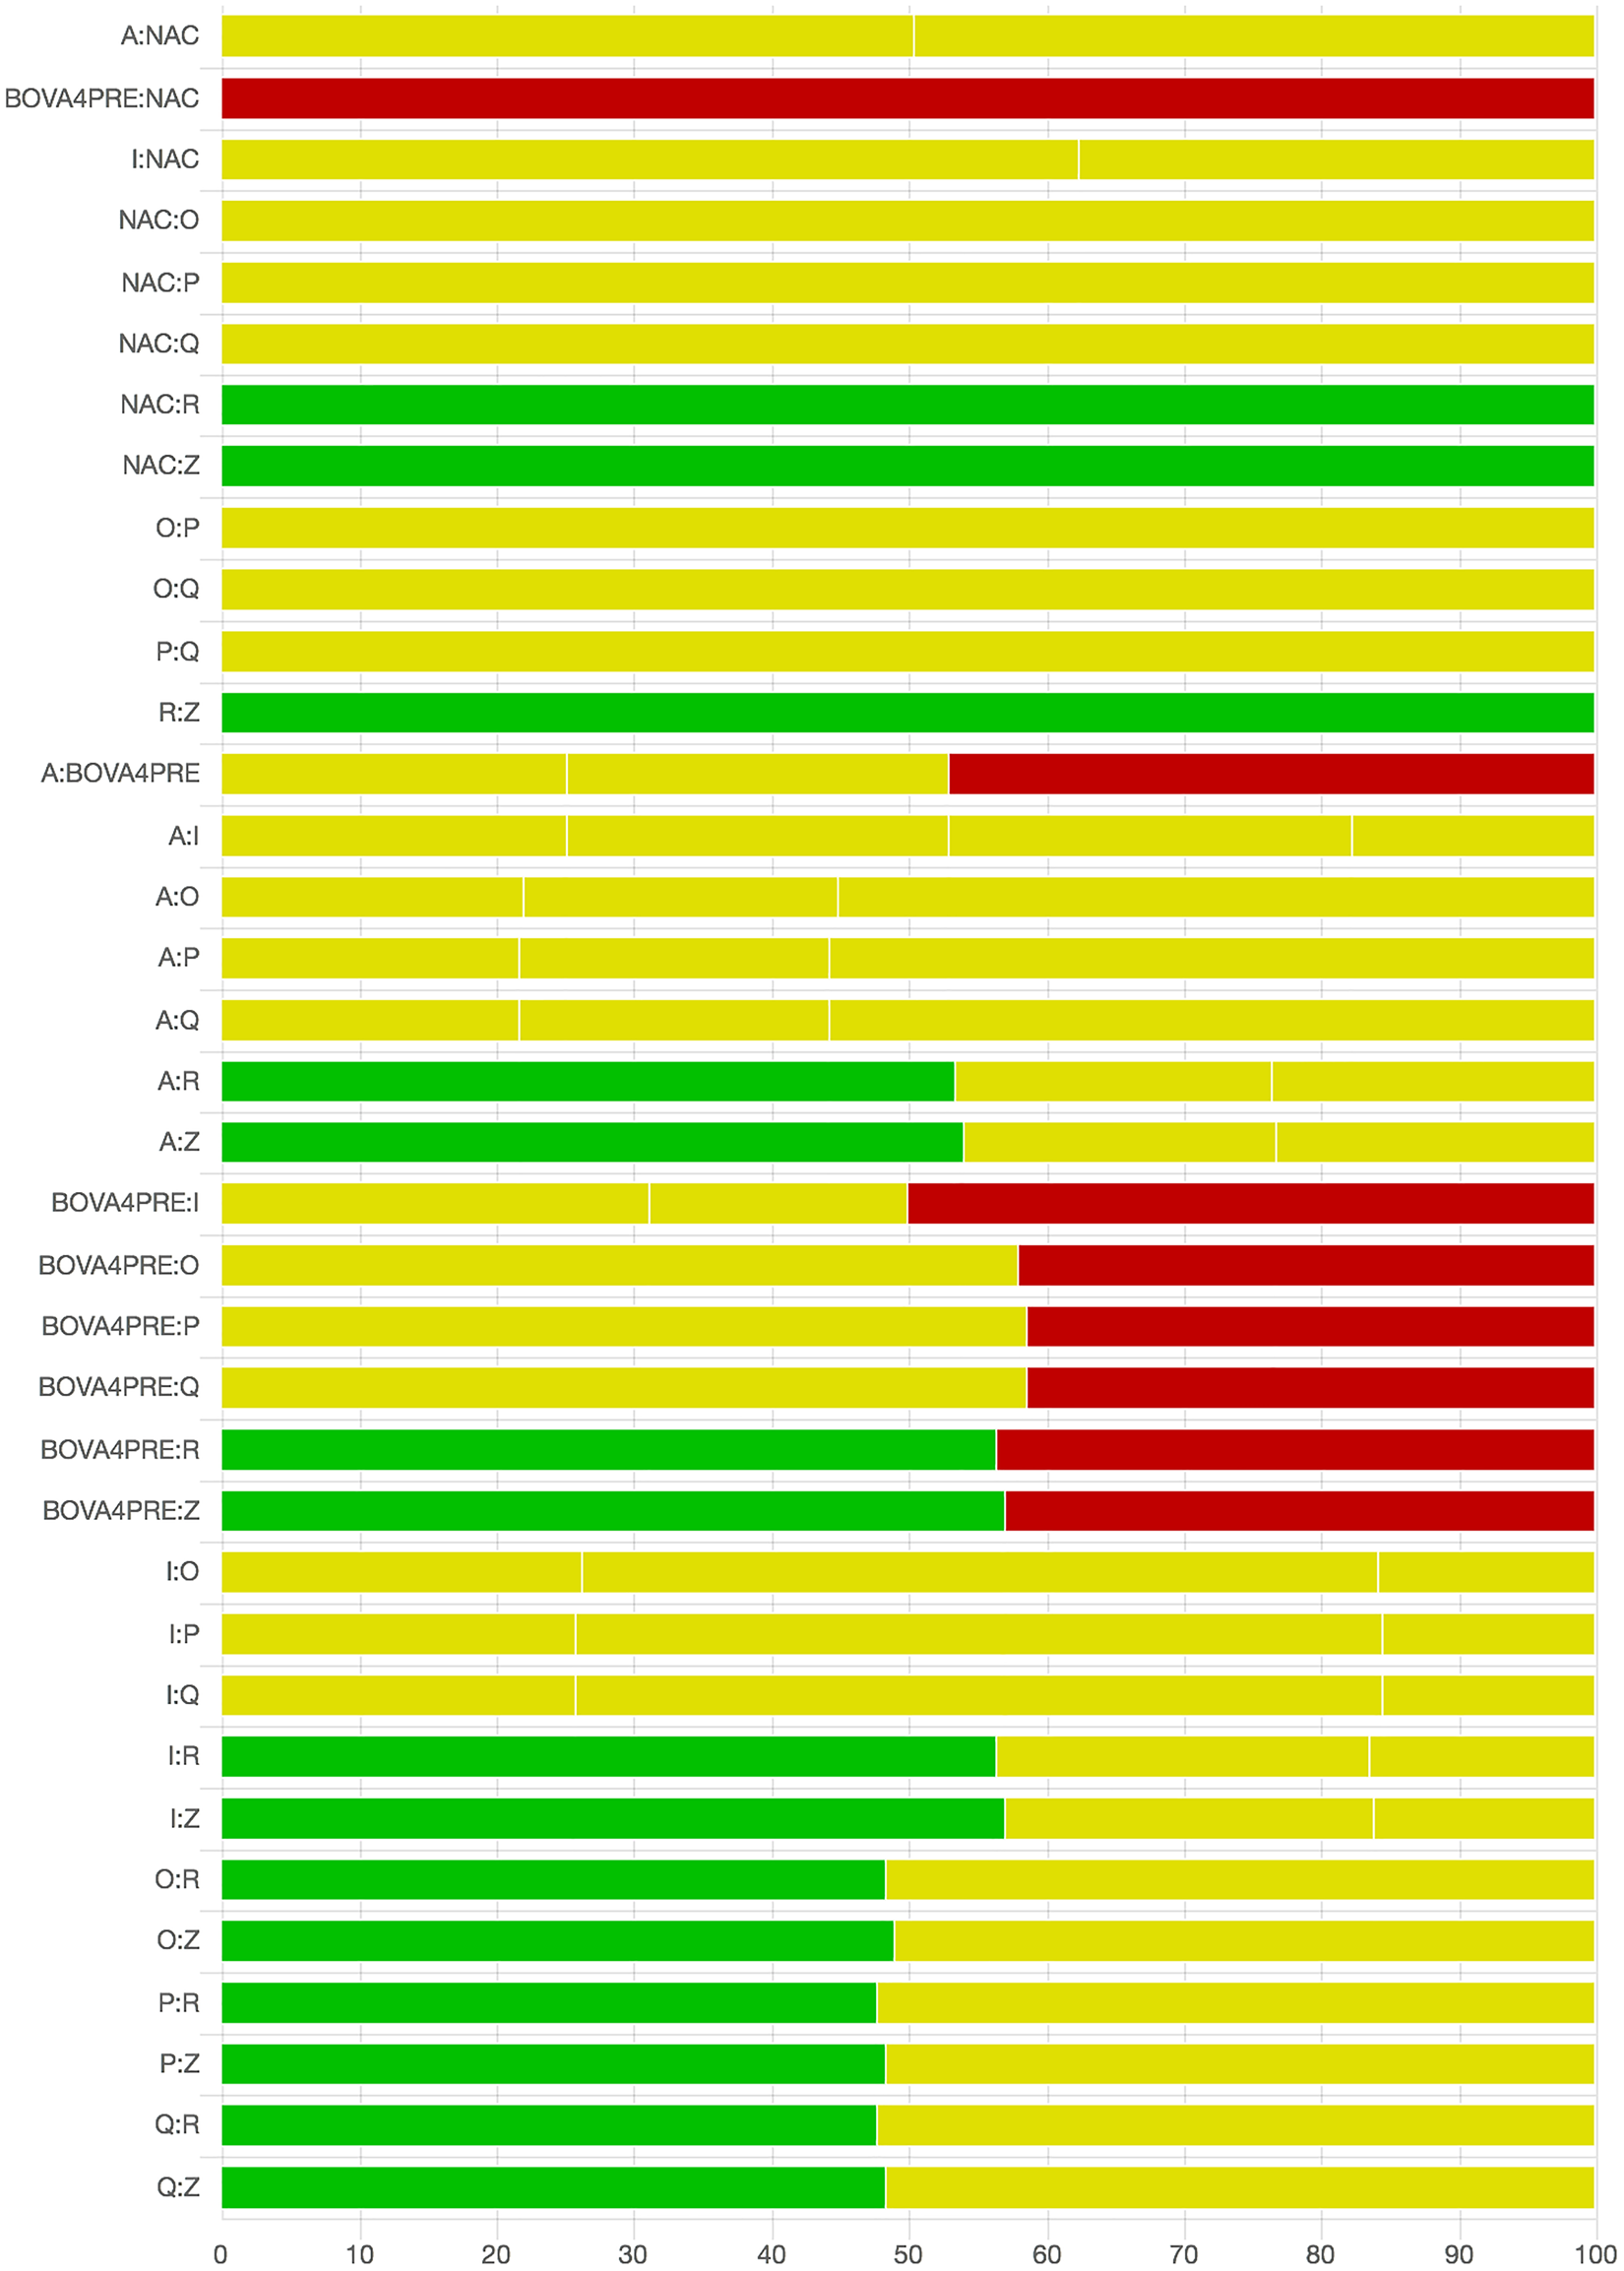
Fig. 7. Part 1: The contribution of studies to the point estimate based on the blinding approach. Green indicates a study providing evidence of blinding of caregivers and outcome assessors, yellow indicates a study providing evidence that either caregivers or outcome assessors were blinded, and red indicates a study reporting no blinding of caregivers or outcome assessors. White vertical lines indicate the percentage contribution of separate studies. Each bar shows the percentage contribution from studies judged to be at low (green), moderate (yellow), and high (red) risk of bias.
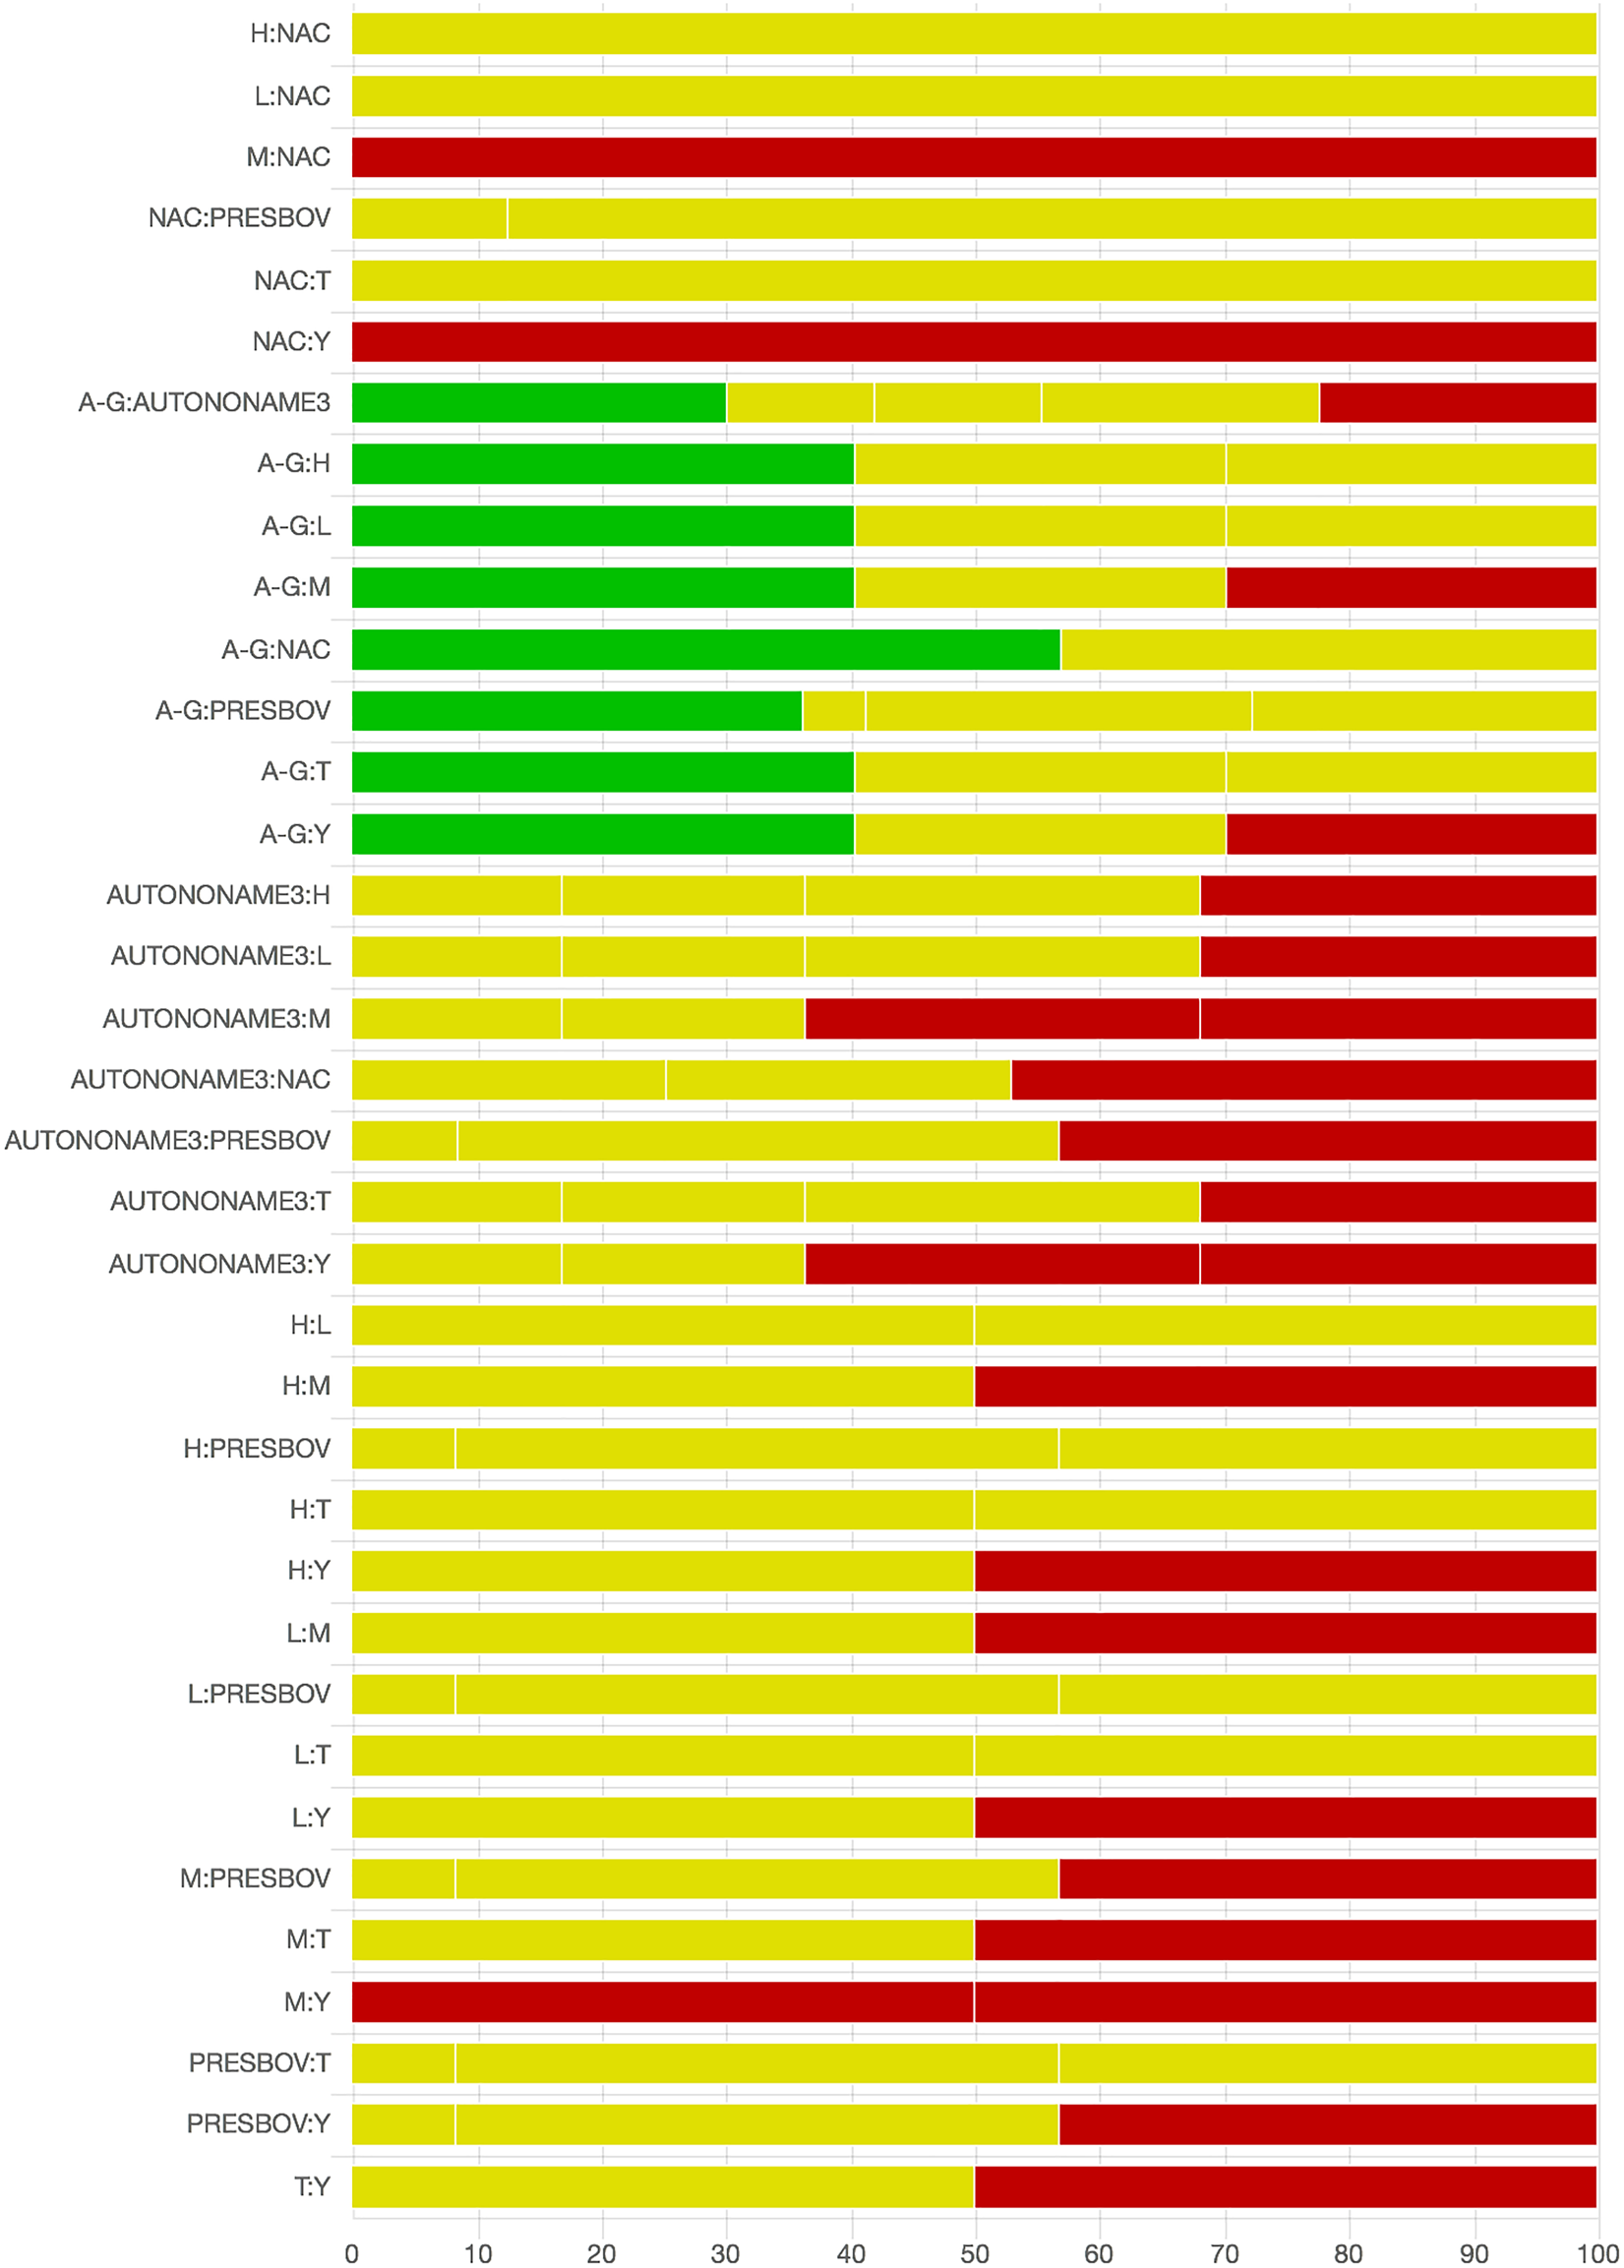
Fig. 8. Part 2: The contribution of studies to the point estimate based on the blinding approach. Green indicates a study providing evidence of blinding of caregivers and outcome assessors, yellow indicates a study providing evidence that either caregivers or outcome assessors were blinded, and red indicates a study reporting no blinding of caregivers or outcome assessors. White vertical lines indicate the percentage contribution of separate studies. Each bar shows the percentage contribution from studies judged to be at low (green), moderate (yellow), and high (red) risk of bias.
Results of additional analyses
No additional analyses were conducted.
Summary of evidence
The results of our network meta-analysis suggest that there is insufficient evidence to support the contention that commercial vaccines are effective at preventing the incidence of BRD among beef cattle when administered upon feedlot arrival. Given that 90% of feedlots use and 90% of cattle receive vaccines upon feedlot arrival in the USA, this may seem like a surprising finding. However, this finding is consistent with the existing primary and review literature.
An evaluation of the primary literature reveals that the observed magnitude of protection afforded by BRD vaccines is low, with some trials showing higher disease occurrence among vaccinated animals. This phenomenon is observable in the ranking plot, in which some vaccines have a lower rank than non-active controls. This result is not a product of the Bayesian model used but rather a product of the number of single studies. For single studies, the Bayesian model uses the point estimate of the risk ratio or odds ratio obtained from the study. That is, for treatments with a single evidence arm, the only evidence used in the point estimate is the original study data; however, the precision of the risk ratio estimate is influenced by the model, which uses between-study variation information drawn from the entire network. Vaccines with ranks lower than those of non-active controls had non-significant effects in the original studies, but empirically the reported disease risk was higher in vaccinated than in non-vaccinated animals. However, as we would not propose that effect sizes below the null value be interpreted as evidence of efficacy without replication of the results, we would not propose that there is evidence that vaccines with positive risk ratios have evidence of harm. A better alternative explanation might be that the use of vaccines upon feedlot arrival is ineffective (i.e., with effect sizes randomly distributed around the null value).
The finding that vaccines used upon feedlot arrival are not effective may not be surprising, as this has been known for years, and there are no new trials of vaccines reported that would be expected to produce different results. For example, below are quotes from various prior reviews of BRD vaccines:
• ‘In North America, vaccination has resulted in equivocal changes in the incidence of BRD and many of the studies on vaccination of feeder calves in which adequate control groups were included, suggests the practice does not appreciably reduce the incidence or severity of BRD or have a beneficial effect on growth rate and feed conversion efficiency.’ (Cusack et al., Reference Cusack, McMeniman and Lean2003)
• ‘It is highly unlikely that control of BRD in the feedlot can be accomplished through an on-arrival vaccination program. … A literature review of scientifically valid field efficacy vaccine trials by Perino and Hunsaker found that modified-live BHV-1 (IBR) achieved equivocal results. Studies concerning efficacy of BVDV and PI3 vaccines lacked any reliable results, whereas BRSV vaccine studies showed efficacy was equivocal, lacking any negative impact on health.’ (Edwards, Reference Edwards2010)
• ‘Vaccination against bacterial and viral pathogens implicated in BRD is broadly accepted as an effective control measure and is widely practiced, although supportive evidence of efficacy is sometimes lacking’. (Theurer et al., Reference Theurer, Larson and White2015). This review reports that, with the exception of vaccination against BHV-1 (inactivated or modified live) and BVDV (inactivated only), meta-analyses of trials from experimental challenge studies show no strong evidence of differences in the risk of BRD-related morbidity in vaccinated animals compared with non-vaccinated controls.
Although many other examples are available, we conclude that, overall, our results are consistent with those of other reviews. There may be one important difference in the inference about vaccines between the present review and the prior review by Theurer et al. (Reference Theurer, Larson and White2015) as it relates to the effect of four-way modified live viral vaccines, which are the most commonly used vaccines in feedlot production. In Theurer et al.'s review and meta-analysis of viral BRD vaccines (antigens of interest were BHV-1, BVDV, BRSV, and PI3), pairwise meta-analysis was conducted for five trials that compared the efficacy of vaccines versus a no-vaccine placebo group against natural BRD infection in beef calves. Their summary risk ratio indicates that morbidity in vaccinated calves was lower than in non-vaccinated calves (risk ratio = 0.44; 95% confidence interval = 0.26–0.74), suggesting a protective effect. Factors contributing to this discrepancy between studies could include differences in eligibility criteria, choice of outcome measure, approach to combining vaccines, and the particular studies included in the analysis.
• Eligibility criteria: The pairwise meta-analysis by Theurer et al., included two studies that would not be eligible for our review, as their study populations were beef cattle aged 2–6 weeks and dairy cows (Makoschey et al., Reference Makoschey, Bielsa, Oliviero, Olivier, Pillet, Dufe, Giorgio and Cavirani2008).
• Outcome metrics: Due to our prioritization of metrics, we extracted the adjusted estimate of effect (i.e., odds ratio adjusted for breed and age at vaccination) from Stilwell et al. (Reference Stilwell, Matos, Carolino and Lima2008) study; therefore, this study was considered one adjusted analysis and result. Theurer et al. did not use this approach to data extraction and instead extracted raw data from three breeds and treated these as separate experiments.
• Pooling approach: BRD vaccines made by different companies potentially use different viral antigens and adjuvants. In a meta-analysis of active-to-active comparisons by Theurer et al., some cattle in the included studies received bacterial BRD vaccines (Presponse®, Vision 7 Somnus® with Spur®) at processing as part of the BRD vaccine intervention, which made comparisons between groups more complex to interpret.
• Studies included: In our review, we identified two studies that reported using Rispoval® (Thomas et al., Reference Thomas, Stott, Howard and Gourlay1986; Stilwell et al., Reference Stilwell, Matos, Carolino and Lima2008). One of these studies reported a very large vaccination effect (odds ratio = 0.2), and the other reported no vaccination effect (odds ratio = 1.02).
These factors impact the inferences made by the two reviews. However, rather than focusing on minor explainable differences, we believe that the more important message is that there is a lack of high-quality controlled studies in relevant study populations supporting the use of modified live vaccines upon feedlot arrival.
Risk of bias assessment in systematic reviews allows an understanding of how bias might impact estimates of efficacy. When a null effect is observed, it is hard to predict the direction of the risk of bias. However, we note that, overall, the reporting of studies is poor, with critical information about allocation approach and blinding of outcome assessment often missing. This may be because many of the included studies are older, whereas reporting standards have changed in the past decade, contributing to improvements in the quality of reporting over time (Totton et al., Reference Totton, Cullen, Sargeant and O'Connor2018).
It would be interesting to understand why producers bear the cost of vaccination despite evidence against the practice. For decades, commercial vaccines have been given to feedlot cattle in North America with the aim of controlling BRD (Cusack et al., Reference Cusack, McMeniman and Lean2003). This is despite the fact that registration of such vaccines relies on efficacy studies often utilizing artificial (as opposed to natural) antigen challenge (Cusack et al., Reference Cusack, McMeniman and Lean2003). However, challenge studies may overestimate the efficacy of vaccines against natural infection in feedlots (Theurer et al., Reference Theurer, Larson and White2015). Registration of vaccines is related to efficacy against an organism in healthy animals but not in a particular setting such as feedlot arrival. These factors suggest vaccines would not work when administered to animals arriving at a feedlot, especially considering that many feedlots use metaphylaxis concurrent with vaccination, which implies that the animals are not healthy. The question remains: When used in the field by producers, are vaccines effective and the research evidence incorrect? Or is efficacy not a factor in the decision to use vaccines? An important issue with this body of work is that groups identified as control groups may, in fact, have received BRD vaccines as part of the baseline processing protocol for all cattle entering the feedlot. However, studies of vaccine-to-vaccine comparisons did not acknowledge baseline processing vaccines as part of the protocol given to all animals, regardless of the intervention group. For example, a study that actually evaluated
• Arm 1 – Mannhemia heamolytica vaccine + four-way killed vaccine
• Arm 2 – Mannhemia heamolytica vaccine + four-way MLV vaccine
often referred to the treatments as
• Arm 1 – four-way killed vaccine
• Arm 2 – four-way MLV vaccine
in their title, abstract, results, and discussion. Other reviews of BRD vaccine use in feedlot beef cattle did not explicitly identify this issue. For example, MacGregor et al. report that there are no significant differences in BRD morbidity between ‘vaccinated and unvaccinated groups’ based on a study of field efficacy of vaccines in beef cattle (MacGregor et al., Reference MacGregor, Smith, Perino and Hunsaker2003). In that study (MacGregor et al., Reference MacGregor, Smith, Perino and Hunsaker2003), vaccinated groups received an M. haemolytica bacterin toxoid. However, the ‘unvaccinated’ group received pyramid MLV (as did the vaccinated group), so this is not a true comparison between vaccinated and unvaccinated cattle. Likewise, in a review of bacterial vaccines for naturally infected feedlot cattle, although the authors report excluding studies confounded by ‘other vaccine treatment’ and only including studies with a placebo/control group, in many of the included studies all enrolled cattle (including control groups) had been vaccinated with viral BRD vaccines (Larson and Step, Reference Larson and Step2012). The results of that review indicate possible evidence of the efficacy of M. haemolytica or M. haemolytica + P. multocida vaccines but no evidence of efficacy of H. somni vaccines against BRD (Larson and Step, Reference Larson and Step2012).
Limitations
Our review question was restricted to the application of vaccines upon feedlot arrival, although the largest connected network included vaccination prior to feedlot entry with no other changes in management practice and delayed vaccination. Our rationale for focusing on vaccination upon arrival is that we were interested in the impact of interventions that could potentially substitute for antibiotic use to prevent BRD incidence. When considering alternatives to antibiotic use, many options are available that are not a direct substitute at the time of feedlot arrival. For example, ensuring that all calves are weaned and trained to use a bunk for feed for 4 weeks on the farm of origin prior to shipping is an alternative to antibiotics upon feedlot arrival. However, we focused on interventions that are widely used in approximately the same manner as antibiotics (i.e., vaccines upon arrival). This seems a sensible focus, as more than 90% of feedlots use and more than 90% of cattle in feedlots are vaccinated for BRD (United States Department of Agriculture, Animal and Plant Health Inspection Service, Veterinary Services, 2013). It would be interesting to understand why this practice is so prevalent. We could not find veterinary organizations that suggest vaccination upon feedlot arrival, even though some biologic companies suggest the practice might be useful (https://www.zoetisus.com/news-and-media/on-arrival-vaccination-research-shows-benefit-to-bottom-line.aspx).
Also, the results of our review should not be inferred to represent the efficacy of BRD vaccines in other settings or production systems or at other timings. Furthermore, authors of previous reviews suggest that results from dairy cattle or differently age animals may not be relevant to the feedlot population (Theurer et al., Reference Theurer, Larson and White2015). Vaccine-induced immunity may take 14–21 days to develop (Edwards, Reference Edwards2010), and risk factors for BRD morbidity may occur prior to feedlot arrival, including those related to weaning, mixing of animals from different farms of origin (e.g., at an auction barn), transport, and fasting during transport (Cusack et al., Reference Cusack, McMeniman and Lean2003; Edwards, Reference Edwards2010). Thus, BRD control may be best managed by limiting these risk factors.
It should also be noted that the limitations of the body of literature, in particular, the absence of evidence that vaccines are effective, is not related to the approach to evidence synthesis because prior systematic and narrative reviews have found the same information.
Conclusions
In conclusion, we found no evidence that vaccination of beef cattle upon feedlot arrival is effective in reducing BRD incidence. It was not possible to evaluate the comparative efficacy of vaccines, as we had proposed, because the products do not appear to be effective. If producers and veterinarians are under the impression that vaccines reduce the incidence of BRD when administered upon feedlot arrival, then this perception needs to be understood. The veterinary community should seek to understand why vaccines are used upon feedlot arrival and how we can either provide a better evidence base for their use or change the approach to vaccine use so that the products can better reduce BRD incidence in feedlots.
Supplementary material
The supplementary material for this article can be found at https://doi.org/10.1017/S1466252319000288.
Acknowledgments
None to declare.
Author contributions
AOC developed the review protocol, coordinated the project team, assisted with the data analysis, interpreted the results, and prepared the manuscript drafts. DH conducted the data analysis, provided guidance for the interpretation of the results, commented on manuscript drafts, and approved the final manuscript version. ST conducted relevance screening, extracted data, provided guidance for the interpretation of the results, commented on manuscript drafts, and approved the final manuscript version. NS conducted relevance screening, extracted data, provided guidance for the interpretation of the results, commented on manuscript drafts, and approved the final manuscript version. CW developed the review protocol, provided guidance for the interpretation of the results, commented on manuscript drafts, and approved the final manuscript version. JG developed the review protocol, provided guidance on the creation of the search, commented on manuscript drafts, and approved the final manuscript version. HW developed the review protocol, developed and conducted the search, commented on manuscript drafts, and approved the final manuscript version. BWang developed the review protocol, provided guidance on the conduct of the analyses and interpretation of the results, commented on manuscript drafts, and approved the final manuscript version. CW developed the review protocol, provided guidance on the conduct of the analyses and interpretation of the results, commented on manuscript drafts, and approved the final manuscript version. BWhite developed the review protocol, provided guidance on the conduct of the analyses and interpretation of the results, commented on manuscript drafts, and approved the final manuscript version. RL developed the review protocol, provided guidance on the conduct of the analyses and interpretation of the results, commented on manuscript drafts, and approved the final manuscript version. JS developed the review protocol, provided guidance for the interpretation of the results, commented on manuscript drafts, and approved the final manuscript version.
Publication declaration
The authors declare that this is a full and accurate description of the project and no important information or analyses are omitted.
Financial support
Support for this project was provided by The Pew Charitable Trusts.
Conflicts of interest
AOC, ST, JS, CW, NS, CW, DH, JG, HW, BWang have no conflicts to declare. RL has conducted research or consulting for Zoetis Animal Health, Merck & Company, CEVA Biomune, Boehringer Ingelheim Vetmedica, and Merial Animal Health which may manufacture one or more of the products assessed. BW has conducted research or consulting for Bayer Animal Health, Boehringer Ingelheim, Elanco Animal Health, Merck Animal Health, Merial Animal Health and Zoetis Animal Health which may manufacture one or more of the products assessed.


 Open access