Introduction
Reelin (RELN) is a secreted extracellular glycoprotein with a size of about 410 kDa that is highly conserved among vertebrate species [1, 2].
RELN is a ligand to two transmembrane receptors of the low-density-lipoprotein receptor family, the apolipoprotein E receptor 2 (ApoER2) and the very-low-density-lipoprotein receptor (VLDLR). Upon binding to its target receptors RELN is ingested into the cell, initiating a downstream signaling cascade based on Disabled 1 (Dab1) dependent src-family kinase phosphorylation [3–5].
During the embryonic period RELN is particularly found in Cajal-Retzius-cells in the cortex’ marginal zone where it acts as a start-stop-signal in neuronal migration and affects cytoskeletal dynamics by interaction with motor proteins such as dynein via the ApoER2/VLDLR signaling cascade [6–11]. Knock-out mice lacking RELN therefore display severe abnormalities in the architecture of the whole brain, inter alia inversed histological layer formation of the whole neocortex, reduced numbers of dendritic spines in the hippocampus and an atrophied cerebellum [12–14]. In the adult brain RELN is mainly expressed by GABA-ergic interneurons [6]. It regulates the activity of glutamatergic hippocampal synapses by interaction with NMDA and AMPA receptors and stimulates dendrite proliferation through interaction with transcription factors such as CREB. Thereby RELN is crucial for synaptic plasticity and learning processes. Reelin-deficient mice show severe deficits in long-term potentiation and cognitive learning [15–21].
Recent studies discovered RELN in peripheral organ systems as well. It has been found inter alia in human blood, liver, pancreas, mamma and intestines [22–26].
Alterations in RELN function are associated with several medical conditions in human beings. Amongst these are neuropsychiatric disorders such as schizophrenia, lissencephaly and Alzheimer’s disease as well as a variety of other diseases, for instance cancerous diseases [24–26]. In schizophrenia for example, epigenetic changes lead to downregulation of cerebral RELN expression, while a mutation in the RELN gene is responsible for an autosomal recessive form of lissencephaly [27–31].
These associations make RELN come into question as a potential biomarker for diseases in humans. Hence, the protein’s serum and plasma levels have been subject to a number of studies carried out to investigate correlations with different pathological findings, summarized in Table I.
Table I
Summary of findings on altered levels of RELN and its isoforms in serum or plasma
To be able to interpret the findings of these studies and as a key premise for a potential use of reelin as a biomarker it is crucial to learn more about RELN’s physiology in the bloodstream. Therefore we examined whether there are variations in healthy individuals’ serum RELN levels in the course of 24 h. Actually our study is the first in the international literature to investigate variations in blood reelin levels over time.
Material and methods
Test subjects
We acquired ten healthy test subjects (six male, four female) aged between 24 and 30 years. All subjects were required not to meet a set of exclusion criteria including any severe acute or chronic disease, current medication intake, drug or alcohol abuse and pregnancy.
Experimental setup
From all test persons eight blood samples each were obtained in the course of 24 h. Samples were gained at intervals of 3 h, starting at 8:00. To achieve the best possible comparability among test subjects, testings were carried out according to a set framework. Participants were obliged to get up at 8:00 and go to sleep at 0:00. Meals were eaten at 9:00, 12:00 and 18:00. Exceptional mental or physical stress was avoided. No alcohol, nicotine, caffeine or other drugs were consumed.
Ethics statement
Prior to commencing the study approval from the Albert Ludwig University of Freiburg’s ethics committee was acquired (no. 335/13). Test subjects gave written consent to participate in the study.
Enzyme-linked immunosorbent assay
The venous blood samples were obtained in standard serum test tubes, centrifuged and the serum samples stored at –80°C. Subsequently the samples’ RELN concentrations were determined using a sandwich ELISA by Cusabio. The assay’s upper detection limit is 10 ng/ml RELN at a sensitivity of < 0.039 ng/ml. Samples with RELN concentrations below that range were therefore approximated as 0 ng/ml. The assay is highly specific for human reelin; no significant cross reactivities were observed. Spike recovery testing and linearity testing accounted for an average of 103% and 98%, respectively, in human serum. Intra- and inter-assay coefficients of variation, determined by twentyfold testing of three reference samples on one plate or on different plates, respectively, are < 8% and < 10%. Hence the assay is very precise with little scattering. Epitope mapping was not performed.
The standard series was obtained by performing six 1 : 2 dilution steps starting with a high standard with an antigen concentration of 10 ng/ml (thus resulting in concentrations of 5 ng/ml, 2.5 ng/ml, 1.25 ng/ml, 0.625 ng/ml, 0.312 ng/ml, 0.156 ng/ml). A solution with a concentration of 0 ng/ml served as a zero standard.
100 μl of a sample or standard at a time were pipetted into the wells of a 12 × 8 polystyrene microtiter plate precoated with a human reelin-specific monoclonal mouse antibody and incubated for 2 h at 37°C. After removal of supernatant 100 μl of a solution containing biotinylated polyclonal goat antibody specific for human reelin was added to each well and incubated for 1 h at 37°C. Unbound detection antibody was thereafter removed by applying 200 μl of wash buffer and aspirating three times per well. Subsequently 100 μl of avidin-bound HRP (horseradish peroxidase) solution were added to each well and incubated for 1 h at 37°C. Afterwards aspiration/washing was repeated five times. Then 90 μl of TMB substrate (3,3’,5,5’-tetramethylbenzidine) were added and incubated at 37°C. The probes were protected from light. After 25 min 50 μl of stop solution (1 N sulfuric acid) at a time were added. Within a period of 5 min the optical densities were determined using a Dynex MRX microplate reader set to a wavelength of 450 nm. Samples and standards were then evaluated with the software Dynex Revelations.
Statistical analysis
The repeated measurements of each individual were graphically explored by plotting RELN concentrations against time. For better visualization the row values were log-transformed and the extreme values of one individual excluded. For exploring a time trend, we fitted a mixed effect model with the subjects as random and time as a continuous variable, studying polynomial trends. Using the whole row data set the Friedman test (a nonparametric counterpart of two-way analysis of variance) was performed to test for a significant time effect. The statistical software R (version 3.2.0) was used.
Results
Variations in serum RELN levels
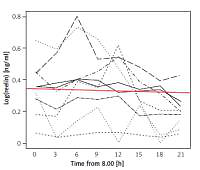
RELN could be detected in all obtained blood samples. The test subjects’ serum RELN levels did not only differ interindividually but showed considerable intraindividual variations over time (Figure 1). Except for one test subject displaying very high concentrations beyond the assay’s detection range at two times of measurement, detected serum RELN levels ranged between 0.052 ng/ml and 1.23 ng/ml. Test subjects showed different extents of intraindividual variation in their serum RELN concentrations over time, the slightest fluctuation ranging between 0.052 ng/ml and 0.072 ng/ml, differing by a factor of 1.38, and the most distinct ranging between 0.161 ng/ml and 1.08 ng/ml, differing by a factor of 6.71.
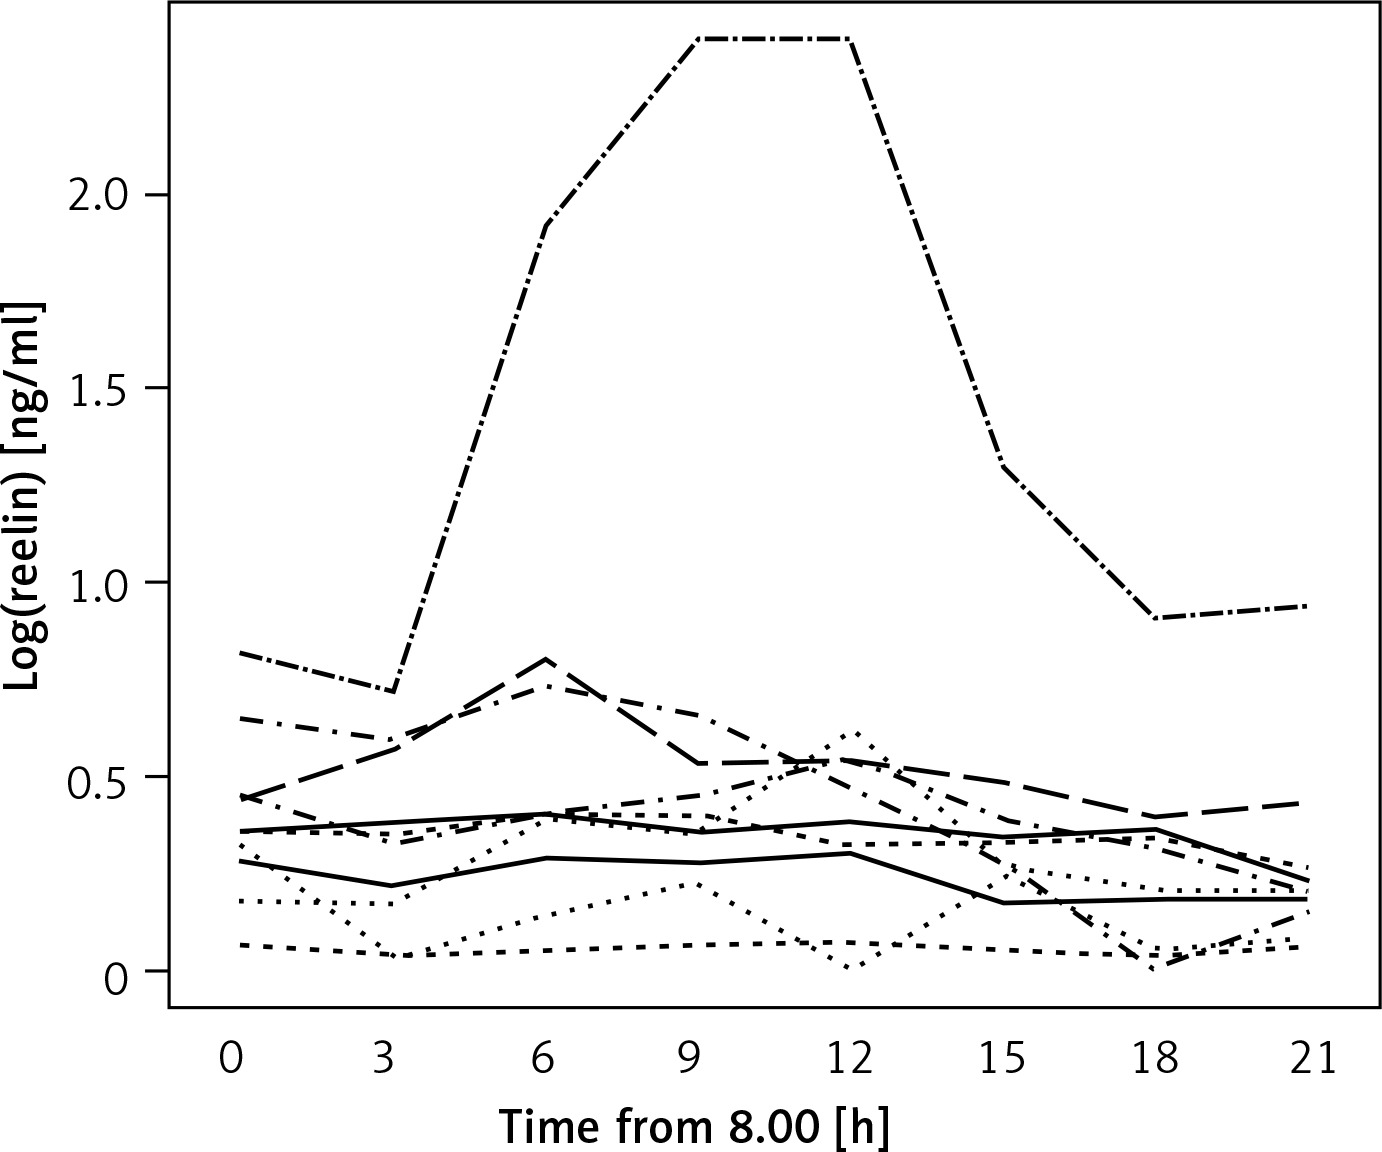
Time effect
The Friedman rank sum test showed a highly significant time effect for all tested individuals’ serum RELN concentrations (p = 0.00014; df = 7; χ2 = 29.09).
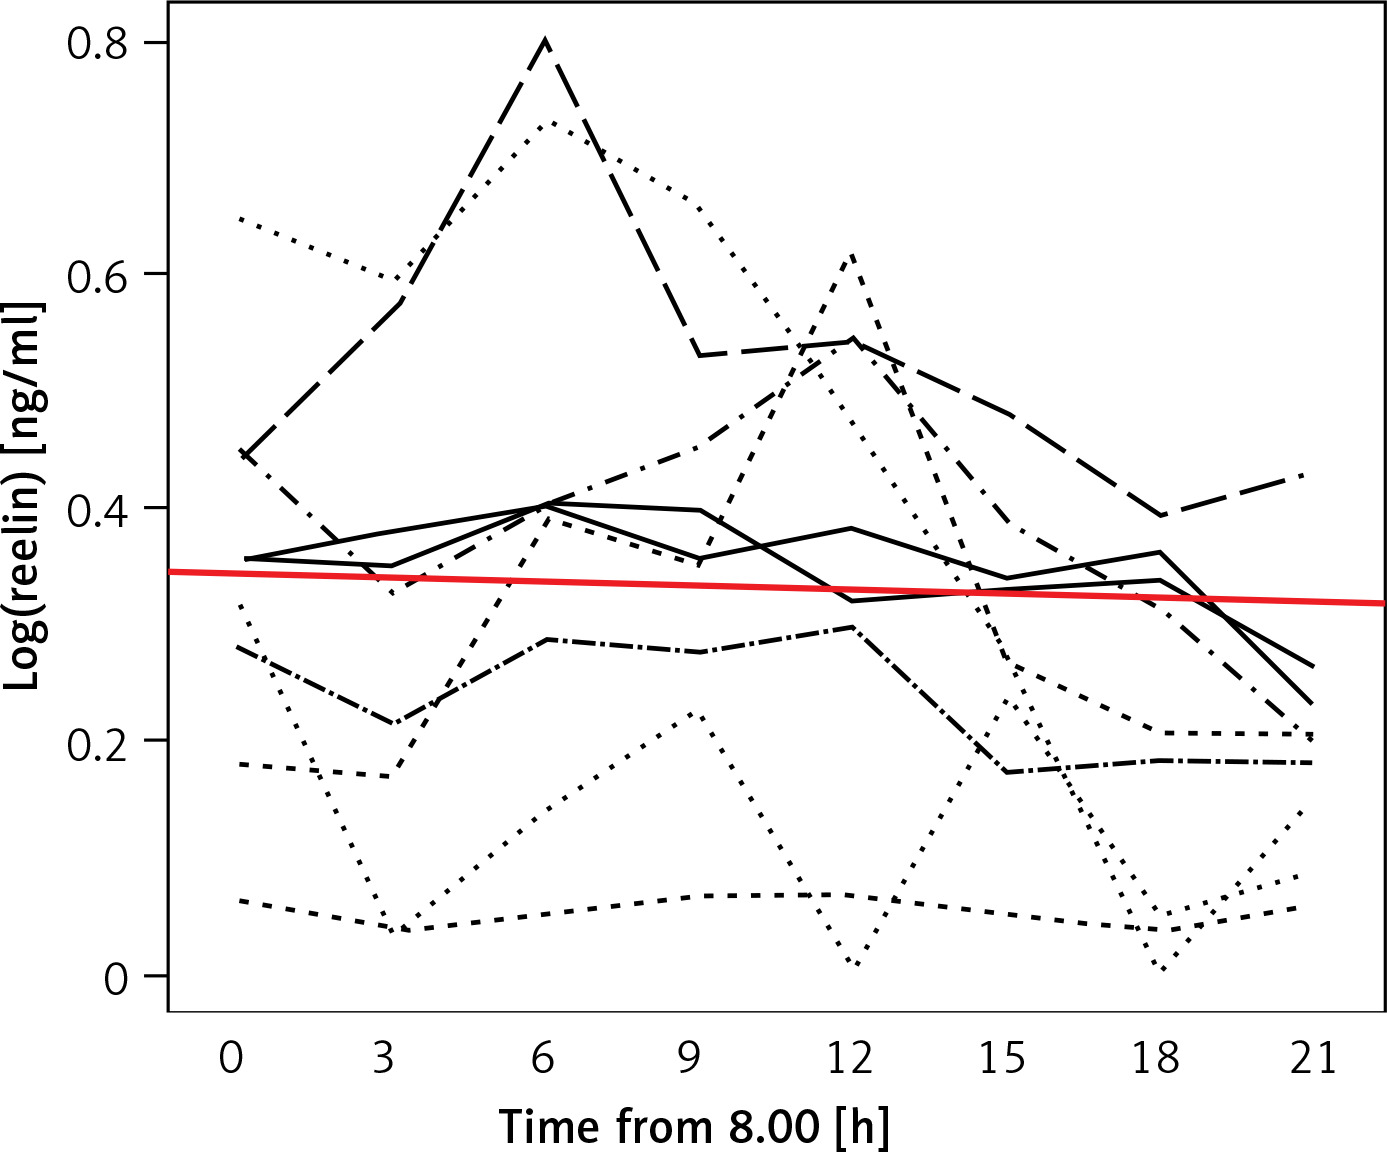
Although a uniform trend in the variations of individuals’ serum RELN levels was not recognizable the entirety of test subjects’ RELN levels over time could be described as a linear function with a negative gradient (c(t) = 0.4689 – 0.00357 × t), showing an overall slight decrease in serum RELN concentrations (Figure 2).
Figure 2
Linear function describing the entirety of serum RELN day profiles. The red line depicts a linear function (c(t) = 0.4689 – 0.00357 × t) that describes the entirety of the test subjects’ serum RELN day profiles. The function’s negative gradient expresses a slight overall decrease in serum RELN in the course of our measurements
Concentration peaks
With respect to the starting time all but one test subjects’ RELN levels increased in the course of our measurement to peak at one time of measurement. Although not statistically depictable, two groups could be distinguished: Four test subjects’ RELN levels peaked at the third time of measurement at 14:00, while five test subjects’ levels peaked at the fifth time of measurement at 20:00. The remaining test subject’s peak was at 08:00.
Discussion
Our main finding was that healthy individuals’ serum RELN levels displayed significant variations in the course of a day. This finding is highly interesting with respect to both exploring the physiology of RELN in peripheral blood as well as its possible clinical relevancy as a diagnostic marker. Unfortunately, still very little is known about the protein’s physiology in the body’s periphery in contrast to its better understood role in the central nervous system, for which reason one can only speculate about the significance of our findings. However, several findings, such as cell damage leading to up-regulation of blood RELN levels or malfunction of the RELN pathway occurring in multiple cancerous diseases, point to RELN contributing to tissue organization and cell architecture in peripheral organs – comparable to its functions in the central nervous system [24–26, 32, 33]. This serves well to account for the permanent presence of RELN in the bloodstream, circulating to reach its target organs, but hardly explains the short-term fluctuations we observed. Yet, the fact that we found significant variations over time in all tested individuals’ serum RELN levels points to these fluctuations being part of physiological RELN homeostasis. At the same time the abundance of a uniform trend in the variations suggests the regulation of blood RELN levels to be both highly individual and complex. Hormones and cytokines could be influencing factors among others. Animal models show that application of triiodothyronine (T3) and hepatocyte growth factor (HGF) increase cerebral RELN synthesis [34, 35]. Glucocorticoids in contrast inhibit hepatic RELN synthesis in vitro [22, 36]. A link to cortisol metabolism could explain circadian changes in RELN levels. However, we observed no clear decline in RELN levels during the day (as you would expect opposite to cortisol levels). Future studies in vitro and in vivo will be necessary to identify effectors of blood RELN homeostasis.
We examined a rather small number of test subjects. Their serum RELN profiles being highly different, a higher number of test subjects could offer a greater chance of distinguishing regularities among the profiles. Furthermore, we acquired blood samples at relatively large intervals of 3 h for the limited time period of 24 h, which gave us a sufficient number of points of measurement to acknowledge significant variations in blood RELN levels over time. However, smaller intervals in future works carried out over longer periods of time could help to establish a more precise picture of blood RELN dynamics. Our experiments were performed on a homogeneous set of test subjects according to a set framework ensuring comparability among them. Still, creating an even higher degree of standardization to eliminate disturbance variables would be necessary to clearly identify single factors affecting blood RELN homeostasis. This could for instance imply accommodating test subjects under strictly controlled conditions for the duration of measurements in order to monitor effects of environmental influences on blood RELN levels.
In conclusion, variations in its blood levels over time could be part of RELN’s physiological homeostasis. Our study being the first in the international literature to investigate variations in blood RELN levels over time, future studies will have to confirm these findings and further illuminate RELN blood level profiles. A more profound understanding of RELN’s physiology in blood is a key premise for a potential clinical use as a biomarker. Possible fluctuations in blood RELN levels will also have to be taken into account when interpreting existing or planning future studies investigating blood RELN levels.
We found significant inter- and intraindividual variations over time in healthy individuals’ blood RELN levels, suggesting these fluctuations to be part of physiological RELN homeostasis. Intensified research will be necessary to gain a better understanding of RELN’s physiology in peripheral blood, especially with respect to RELN’s role as a possible biomarker for diseases in humans.