


Many observational studies show that low vitamin D status is associated with an unfavourable cardiovascular risk profile in children(Reference Dolinsky, Armstrong and Mangarelli1–Reference Ekbom and Marcus3) and adults(Reference Parker, Hashmi and Dutton4–Reference Ke, Mason and Kariuki7), but results on the effect of vitamin D supplementation on cardiometabolic markers are inconsistent(Reference Ferira, Laing and Hausman8–Reference Wang, Xia and Yang14). The role of vitamin D is difficult to ascertain in short intervention studies as the development of CVD is slow and may begin already in childhood(Reference Li, Chen and Srinivasan15–Reference Chen and Wang19). The risk of confounding is high in observational studies since both risk factors and vitamin D status correlate with other important lifestyle factors such as physical activity, BMI and fatty fish intake. The use of Mendelian randomisation studies is increasing(Reference Manousaki, Mokry and Ross20–Reference Vimaleswaran, Berry and Lu22) as this approach allows investigation of cardiometabolic effects of genetically low vitamin D status with limited influence from possible confounders, as confounders are assumed to be evenly distributed among genotypes.
The main source of vitamin D is UVB radiation-mediated biosynthesis in the skin, which depends on latitude and season(Reference Michos and Melamed23). Vitamin D status, that is, serum concentrations of 25-hydroxyvitamin D (25(OH)D), can also be increased by intake of foods rich in vitamin D, mainly fatty fish, fortified foods and supplements(Reference Holick24). Furthermore, serum 25(OH)D is influenced by polymorphisms in genes encoding proteins that are involved in the synthesis, transport and catabolism of vitamin D metabolites (Fig. 1). A number of studies in children and adults have shown associations between serum 25(OH)D and SNP in genes encoding 7-dehydrocholesterol reductase (DHCR7), group-specific complement (GC), cytochrome P450 subfamily IIR1 (CYP2R1) and vitamin D 24-hydroxylase (CYP24A1)(Reference Wang, Zhang and Richards25–Reference Nissen, Rasmussen and Ravn-Haren28).
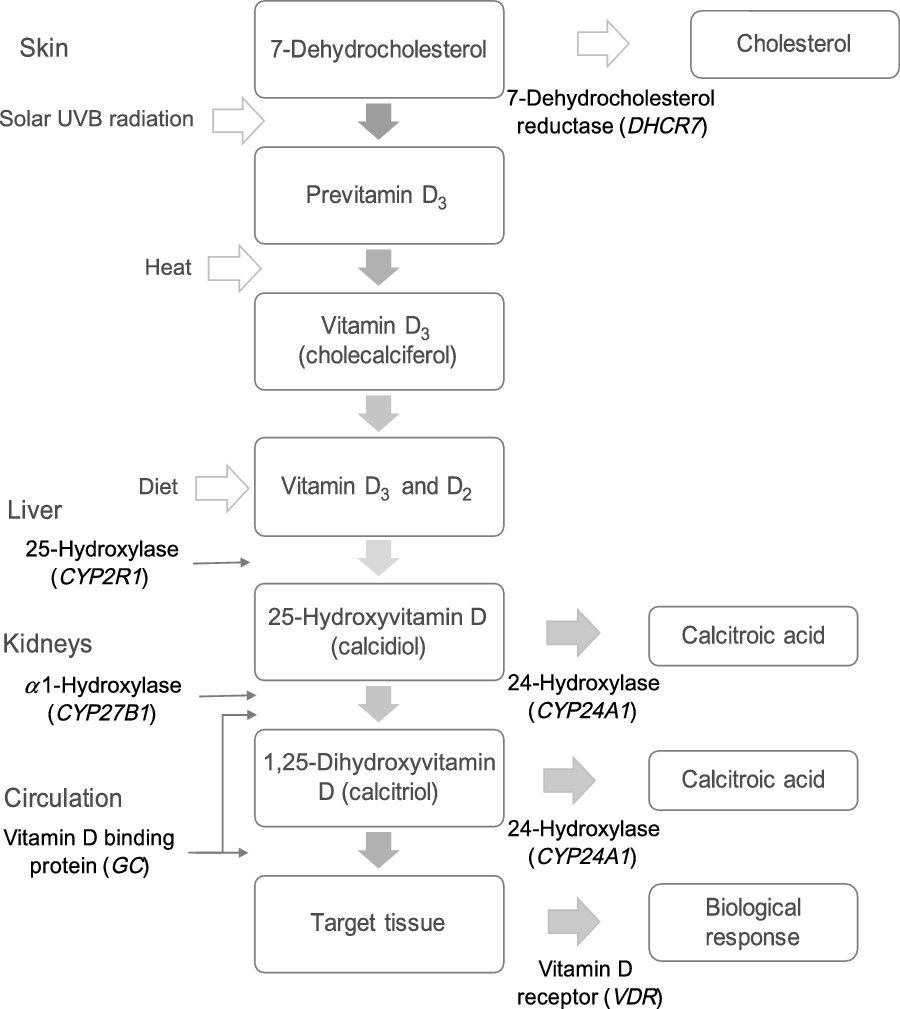
Fig. 1. Genes involved in the metabolic pathway of vitamin D. DHCR7 encodes 7-dehydrocholesterol reductase, which converts 7-dehydrocholesterol to cholesterol. 7-Dehydrocholesterol is the substrate for cutaneous synthesis of vitamin D3. CYP2R1 encodes a hepatic NADPH-dependent enzyme that hydroxylates vitamin D3 (and D2) to 25-hydroxyvitamin D (25(OH)D). CYP27B1 encodes a NADPH-dependent mitochondrial enzyme, which is expressed mainly in the kidneys and hydroxylates 25(OH)D to the active form 1,25-dihydroxyvitamin D (1,25(OH)2D). GC encodes for group-specific complement, a vitamin D binding protein transporting vitamin D and its metabolites in the body. VDR encodes the vitamin D receptor, which mediates the biological actions of the active form 1,25(OH)2D. CYP24A1 encodes the enzyme that inactivates 1,25(OH)2D and 25(OH)D by conversion to water-soluble calcitroic acid.
Large Mendelian randomisation studies in adults suggest favourable effects of genetically increased 25(OH)D on blood pressure(Reference Vimaleswaran, Cavadino and Berry29) and type 2 diabetes risk(Reference Afzal, Brøndum-Jacobsen and Bojesen30). Most of these studies have been limited to single SNP in genes influencing circulating 25(OH)D. Additional insight can be provided by use of genetic risk scores associated with serum 25(OH)D or variation in genes of importance for the synthesis or function of the biologically active vitamin D metabolite 1,25-dihydroxyvitamin D, for example, CYP27B1, and the vitamin D receptor gene (VDR). SNP in the VDR gene could affect the activity of the vitamin D receptor, which is expressed in many tissues, including vascular smooth muscle, endothelium and cardiac muscle(Reference Reid and Bolland31). SNP in VDR have been used to modify associations between serum 25(OH)D and major clinical outcomes(Reference Levin, Robinson-Cohen and de Boer32), but to our knowledge, no studies have examined effect modification for cardiometabolic markers in children.
The present Mendelian randomisation study uses cross-sectional data from a randomised trial in schoolchildren(Reference Petersen, Larsen and Damsgaard33) to examine the combined effects of SNP in genes related to vitamin D synthesis, transport and catabolism (DHCR7, GC, CYP2R1 and CYP24A1) on autumn levels of serum 25(OH)D to generate a genetic risk score for low 25(OH)D, which we will use in analyses of association with blood pressure, plasma lipids and insulin. We also investigate whether SNP in genes involved in the synthesis and function of 1,25-dihydroxyvitamin D (CYP27B1 and VDR) modify associations between serum 25(OH)D and the cardiometabolic markers.
Methods
Study design and population
The present study is based on cross-sectional baseline data collected during August through November 2011 in the OPUS School Meal Study, a large cluster-randomised cross-over trial, which included 3rd- and 4th-grade children from nine primary schools in Denmark. The aim of the trial was to investigate the effect of school meals based on the New Nordic Diet on dietary intake and nutrient status, cardiometabolic markers and cognitive function in 8–11-year-old Danish schoolchildren. The OPUS trial was conducted in accordance with the Declaration of Helsinki guidelines and approved by the Committees on Biomedical Research Ethics for the Capital Region of Denmark (H-1-2010-124). The study protocol was registered with ClinicalTrials.gov (NCT 01577277, https://clinicaltrials.gov/ct2/show/NCT01577277?term=01577277&cntry=DK&rank=1). The details of the study design and recruitment were published previously(Reference Damsgaard, Dalskov and Petersen34). Written informed consent was obtained from the custody holders of all children, and children were only excluded if they had diseases or conditions that might obstruct the measurements or put the children at risk if eating the diet and concomitant participation in other studies(Reference Damsgaard, Dalskov and Petersen34).
Of the 834 children originally enrolled in the OPUS School Meal Study, we included data from 699 children, who had data on serum 25(OH)D, at least one of the cardiometabolic markers (BP, insulin, HDL-cholesterol and TAG), and at least one of the vitamin D-related SNP.
Background information
Data on demographic and socio-economic characteristics were collected by a thorough interview with the families. Parental education level was categorised as lower secondary education (≤10 years of schooling), upper secondary education, vocational education, short higher education, bachelor’s degree, or equivalent or a master’s degree or higher (≥17 years of schooling) based on the highest education level attained in the household. The children were categorised as Caucasian (including Middle East, Pakistan and India), Asian, African, Latin or Other.
The assessment of physical activity was validated and described in detail previously(Reference Hjorth, Chaput and Michaelsen35). The children wore an ActiGraph tri-axis accelerometer monitor (GT3X+ or GT3X, ActiGraph) at the right hip for 7 d and eight nights and were asked to remove it only during water activities (i.e. showering or swimming). We used the time spent in moderate-to-vigorous physical activity (≥2296 counts/min)(Reference Trost, Loprinzi and Moore36), which has previously been shown to be a determinant of serum 25(OH)D in this study population(Reference Petersen, Damsgaard and Dalskov37).
The week before the clinical examination, children, with the help of their parents, recorded their daily intake of food and beverages at the end of the day for seven consecutive days using a Web-based Dietary Assessment Software for Children. The software has been developed specifically for children aged 8–11 years, to use it with or without support from their parents, and has been validated in the OPUS School Meal Pilot Study(Reference Biltoft-Jensen, Hjorth and Trolle38,Reference Biltoft-Jensen, Bysted and Trolle39) . Intake data were processed at The National Food Institute, Technical University of Denmark using the General Intake Estimation System, which was originally developed for the Danish National Survey of Diet and Physical Activity 2003–2008. Energy intake was evaluated in relation to an estimated BMR(Reference Henry40), and dietary data were excluded for under-reporters (energy intake/BMR ≤ 1·05) and over-reporters (energy intake/BMR ≥ 2·28)(Reference Black41) and children with dietary records from less than 4 d. The consumption of dietary supplements was registered and dichotomised based on whether the child had ingested any kind of vitamin D-containing supplements, including multivitamins, during the registration period.
Clinical measurements
Clinical measurements and venous blood sampling were conducted in the morning following an overnight fast in a mobile laboratory truck parked at the schools. Body weight was assessed on a digital scale (BWB 800 S, Tanita), and height was measured three times to the nearest one decimal using a transportable stadiometer (CMS Weighing Equipment Ltd) with the head in the Frankfurt horizontal plane. Sex- and age-adjusted z-scores for BMI were calculated using WHO AnthroPlus software, and the prevalence of underweight, overweight and obesity was based on cut-offs defined by centiles passing through BMI of 18·5, 25 and 30 kg/m2 at 18 years(Reference Cole, Bellizzi and Flegal42). Body composition was measured by dual-energy X-ray absorptiometry (Lunar Prodigy Pro™, GE Medical Systems) using EnCore™ software version 13.5. Fat mass index was calculated as: fat mass index (kg/m2) = (fat mass (kg))/(height (m))2. Pubertal status was self-evaluated by the child based on breast development in girls and pubic hair in boys (Tanner stages). Tanner stage ≥2 was defined as an indicator of entered puberty and classified in a categorical variable (yes/no).
Blood pressure was measured with automated devices (UA-787 Plus, A&D Medical) and (ProBP 3400 Sure BP, Welch Allyn Inc.) after 10 min of rest, as previously described(Reference Damsgaard, Dalskov and Petersen34). Measurements were performed three times, and the mean of the last two measurements was used.
Blood analyses
Blood collected in serum tubes with gel was centrifuged after 30 min of coagulation at room temperature, and it was stored at –80°C for later batch analysis of insulin and 25(OH)D. Total cholesterol, LDL-cholesterol and HDL-cholesterol, and TAG were analysed in serum stored at –80°C for batch analysis. All samples were analysed on the same device with the same reagent lot, and all samples from each child were analysed on the same day. Total cholesterol, HDL-cholesterol and TAG were quantified on the Vitros 5.1 FS analyzer (Ortho-Clinical Diagnostics, Johnson & Johnson), whereas LDL-cholesterol was calculated using Friedewald’s equation(Reference Friedewald, Levy and Fredrickson43). Serum insulin was quantified on ADVIA Centaur XP (Siemens Healthcare). The inter- and intra-assay CV were 1·4 and 1·2 % for total cholesterol; 2·0 and 1·2 % for HDL-cholesterol; 1·5 and 0·8 % for TAG; and 2·5 and 3·1 % for insulin, respectively.
Serum 25(OH)D was analysed using an automated chemiluminescent immunoassay on DiaSorin LIAISON (DiaSorin AB) at Department of Clinical Biochemistry, Aalborg University Hospital, Denmark. Before analysis, serum was thawed at room temperature for 30 min before being centrifuged at 4000 rpm for 3 min. Values are presented in nmol/l (1 nmol/l = 0·4006 ng/ml), and lowest detection limit was 10 nmol/l. The inter- and intra-assay CV were 5·4 and 7·6 % for 25(OH)D, respectively, with a detection limit of 10 nmol/l. Vitamin D deficiency and insufficiency were defined as serum 25(OH)D concentrations <25 and ≤50 nmol/l, respectively, according to the recommendations of the European Society for Pediatric Gastroenterology, Hepatology, and Nutrition(Reference Braegger, Campoy and Colomb44).
DNA extraction and genotyping
DNA extraction and genotyping were performed at LGC Genomics (LGC Genomics Ltd) using KASP™ genotyping technology, which facilitates bi-allelic discrimination through competitive PCR and incorporation of a fluorescent resonance energy transfer quencher cassette. The genotypes were called by use of Kraken software with visual quality control of all calls. Call rates for all SNP were 100 % for samples and 0 % for non-template controls.
Thirteen SNP in six genes (DHCR7, GC, CYP2R1, CYP27B1, VDR and CYP24A1) were included in the present study. Eight of these (DHCR7 rs12785878 and rs3829251, GC rs4588 and rs7041, CYP2R1 rs10741657, rs10500804 and rs156292, and VDR rs757343) were included in a previous study from the OPUS cohort(Reference Petersen, Larsen and Damsgaard33). We added additional five SNP based on previously reported associations with serum 25(OH)D (rs12512631 in GC, rs2296241 in CYP24A1 and rs10877012 in CYP27B1)(Reference Wang, Zhang and Richards25,Reference Nissen, Rasmussen and Ravn-Haren28) or with cardiometabolic outcomes (rs2228570 and rs11568820 in VDR)(Reference Sentinelli, Bertoccini and Barchetta45,Reference Muldowney, Lucey and Hill46) .
Statistical analyses
Descriptive characteristics are presented as mean values and standard deviations, medians and interquartile ranges, or numbers and percentages. All statistical analyses were carried out using STATA (version 14, StataCorp). Deviations from Hardy–Weinberg equilibrium were tested for the study population using a χ 2 test. Assumptions for all parametric statistical models were checked by visual inspection of residual and normal probability plots. P values <0·05 were considered statistically significant, and P < 0·1 was used as an indicator of interaction.
Analyses of association were performed by linear and multiple linear regression models. To capture systematic variation in the effect estimates and adjust for any skewed distribution of covariates between genotypes models with serum 25(OH)D concentrations as the outcome were adjusted for dietary vitamin D intake, intake of vitamin D-containing supplements (yes/no), fat mass index and moderate-to-vigorous physical activity. Models with cardiometabolic markers (systolic blood pressure (sBP), diastolic blood pressure, plasma TAG, LDL-cholesterol, HDL-cholesterol and insulin) as outcomes were adjusted for age, sex, parental education, entered puberty (yes/no), fat mass index and moderate-to-vigorous physical activity. We included cardiometabolic markers typically included in the diagnosis of the metabolic syndrome in children (excluding central obesity)(Reference Higgins and Adeli47), that is, blood pressure, plasma HDL-cholesterol, TAG and insulin.
The genetic risk score for low serum 25(OH)D was calculated as the sum of the number of risk alleles when combining SNP from the two individual genes with the strongest effect on serum 25(OH)D and the lowest level of linkage. Risk alleles for each SNP were defined as those with the lowest 25(OH)D concentrations. We constructed a risk score consisting of three categories with increasing numbers of risk alleles (0–2, 3–5 and 6–8) to maximise statistical power in the analysis of associations between the risk score and the cardiometabolic outcomes.
Potential modifying effect of SNP in CYP27B1 and VDR on associations between serum 25(OH)D and cardiometabolic markers was assessed in models with a SNP × serum 25(OH)D interaction term in linear and multiple linear regression models including the same adjustments as described above. The heterozygous (Mm) and minor (mm) genotypes were grouped together in order to maximise statistical power. Additional analyses were performed to assess the potential modifying effects of VDR on associations between the genetic risk score and cardiometabolic risk markers.
Results
Most children (96 %) were Caucasian and only 1·6, 1·3, 0·7 and 0·1 % were Asian, African-American, Hispanic and other categories, respectively. The majority of the children had a normal weight status (77 %) and sufficient vitamin D status (72 %) defined as serum 25(OH)D > 50 nmol/l (Table 1).
Table 1. Characteristics of the study population
(Mean values and standard deviations; numbers and percentages; medians and 25th, 75th percentiles)

UW, underweight; NW, normal weight; OW, overweight; OB, obesity; S, sufficient vitamin D status; I, insufficient vitamin D status; D, deficient vitamin D status; 25(OH)D, 25-hydroxyvitamin D.
* A: ≤lower secondary education, B: higher secondary education, C: vocational education, D: short higher education, E: bachelor’s degree or equivalent, F: ≥master’s degree.
† Based on age- and sex-specific cut-offs defined to pass through BMI of 18·5, 25 and 30 kg/m2 at age 18 years, as described by Cole et al. (Reference Cole, Bellizzi and Flegal42).
‡ Registered intake of vitamin D-containing supplements ≥1 d during the recording period (9 d).
§ Sufficient: 25(OH)D > 50 nmol/l; insufficient: 25(OH)D 25–50 nmol/l; deficient: 25(OH)D < 25 nmol/l.
|| Subjects with fasting status.
All the studied SNP in CYP2R1 and GC were associated with the serum 25(OH)D concentration (online Supplementary Table S1). Minor allele carriage of GC rs4588 and rs7041 was associated with lower 25(OH)D as previously observed in longitudinal analyses in the OPUS study(Reference Petersen, Larsen and Damsgaard33), whereas rs12512631 was associated with a 7·3 nmol/l (P < 0·001) higher serum 25(OH)D compared with major allele homozygotes. Serum 25(OH)D was about 10 nmol/l higher in the minor allele homozygotes compared with major alleles homozygotes of CYP2R1 rs10741657 and rs1562902; minor allele homozygotes of rs10500804 on the other hand decrease concentration with 9·0 nmol/l relative to homozygote majors, which again is in accordance with our previous observations(Reference Petersen, Larsen and Damsgaard33). We found no associations between serum 25(OH)D and CYP24A1 (rs2296241) and DHCR7 (rs3829251) (online Supplementary Table S1), but contrary to previous findings(Reference Petersen, Larsen and Damsgaard33), minor allele homozygotes of DHCR7 rs12785878 had –5·5 nmol/l (P = 0·009) lower serum 25(OH)D compared with those with two major alleles (online Supplementary Table S1).
An allele dose–response relationship was indicated for most of the SNP in the range 2–8 nmol/l 25(OH)D per allele (Fig. 1 and online Supplementary Table S1). Based on the effect size and the linkage disequilibrium between the SNP in the GC and CYP2R1 genes that were significantly associated with serum 25(OH)D concentrations (online Supplementary Table S2), a combined genetic risk score was generated including CYP2R1 (rs10741657 and rs10500804) and GC (rs4588 and rs12512631). The genetic risk score was calculated as the sum of the number of G-alleles of rs10741657, G-alleles of rs10500804, A-alleles of rs4588 and T-alleles of rs12512631. Serum 25(OH)D decreased with −3·4 nmol/l (95 % CI –4·2, –2·6, P < 0·001) for each increasing allele in the score, and the total range of variation from 0 to 8 risk alleles was 33 nmol/l of serum 25(OH)D (Fig. 2). For further analysis, the genetic risk score was reduced to three categories in order to avoid categories with small numbers (Table 2). There was a dose-dependent association between the three-category risk score and serum 25(OH)D concentrations of –8·7 nmol/l (95 % CI –10·9, –6·6, P < 0·001) per increase in category. Carriers of 6–8 risk alleles had 17 nmol/l lower 25(OH)D than those with 0–2 risk alleles, which corresponded to a difference of about 1 sd (Table 2). This was not changed by the exclusion of non-Caucasian children (data not shown). There was no association between the three-category risk score and any of the cardiometabolic markers (sBP and diastolic blood pressure, insulin, HDL-cholesterol and TAG) (Table 3). Furthermore, there was no association between the genetic risk score as a continuous variable and the markers (data not shown).

Fig. 2. Serum 25-hydroxyvitamin D (25(OH)D) according to the genetic risk score based on group-specific complement (GC) (rs4588 and rs12512631) and cytochrome P450 subfamily IIR1 (CYP2R1) (rs10741657 and rs10500804). The X-axis gives the sum of risk alleles in GC (rs4588 and rs12512631) and CYP2R1 (rs10741657 and rs10500804) and the Y-axis serum 25(OH)D (nmol/l), which is plotted as means and standard deviations.
Table 2. Association between the genetic risk score based on group-specific complement (GC) (rs4588 and rs12512631) and cytochrome P450 subfamily IIR1 (CYP2R1) (rs10741657 and rs10500804) and serum 25-hydroxyvitamin D (25(OH)D) concentrations
(Mean values and standard deviations; β values and 95 % confidence intervals)

* Linear regression model adjusted for fat mass index (kg/m2), vitamin D dietary intake (µg/d), vitamin D supplements intake (yes/no) and moderate-to-vigorous physical activity (min/d).
Table 3. Association between the genetic risk score based on group-specific complement (GC) (rs4588 and rs12512631) and cytochrome P450 subfamily IIR1 (CYP2R1) (rs10741657 and rs10500804) and cardiometabolic risk markers
(Mean values and standard deviations; β values and 95 % confidence intervals)

* Linear regression model adjusted for age, sex, parental education, entered puberty (yes/no), fat mass index (kg/m2) and moderate-to-vigorous physical activity (min/d).
† Analysis with log-transformed values and back transformed to normal units.
‡ Subjects with fasting status.
The SNP in CYP27B1 and VDR were evaluated as potential effect modifiers of the association between serum 25(OH)D and the cardiometabolic markers. There was no interaction between 25(OH)D and CYP27B1 (rs10877012) for any of the cardiometabolic markers, but interactions were indicated for VDR SNP (Table 4). Increasing 25(OH)D was inversely associated with insulin among homozygous major allele carriers, but directly associated among variant allele carriers of rs757343. Data for rs2228570 were pointed in the same direction, but the difference was reduced after adjustment (Table 4). Effect modification by VDR rs11568820 was apparent on the association between 25(OH)D and sBP, which reflected a reduction in sBP with increasing 25(OH)D only among homozygous major allele carriers (Table 4). A similar interaction with this SNP was observed when the genetic risk score was used as proxy for 25(OH)D concentrations (online Supplementary Table S3) and in tendencies for effect modification by rs757343 and rs11568820 on association with diastolic blood pressure (Table 4). The association between 25(OH)D and TAG was modified by rs2228570 (P interaction = 0·021), which was driven by an inverse association between serum 25(OH)D and TAG among major allele homozygotes and no association among variant allele carriers (Table 4). An inverse association between 25(OH)D and TAG of similar effect size was also observed only in major allele homozygotes for rs757343 and among minor allele carriers of rs11568820, but the interactions for these SNP were far from significant.
Table 4. Effect modification by SNP in the vitamin D receptor gene (VDR) on associations between serum 25-hydroxyvitamin D (25(OH)D) and cardiometabolic risk markers
(Mean values and standard deviations; β values and 95 % confidence intervals)

Mm, heterozygous genotype; mm, minor genotypes.
* Linear regression model adjusted for age, sex, parental education, entered puberty (yes/no), fat mass index (kg/m2) and moderate-to-vigorous physical activity (min/d). Regression coefficients are presented as cardiometabolic outcome change per 10 nmol/l increase in serum 25(OH)D.
† Analysis with log-transformed values and back transformed to normal units.
‡ Subjects with fasting status.
Discussion
Our results showed that the serum 25(OH)D concentration during autumn was strongly affected by SNP in CYP2R1 and GC in Danish schoolchildren. Despite a marked effect on serum 25(OH)D, the combined genetic risk score, based on GC and CYP2R1 variants, was not associated with any of the cardiometabolic markers. However, interactions were observed between VDR SNP and serum 25(OH)D on sBP and TAG, which reflected an inverse association between 25(OH)D and these cardiometabolic markers among major allele homozygotes only.
The observed associations between SNP in GC and CYP2R1 and serum 25(OH)D are consistent with previous results from longitudinal analyses in the OPUS study(Reference Petersen, Larsen and Damsgaard33) as well as findings in another study in 344 Danish children(Reference Nissen, Rasmussen and Ravn-Haren28) and studies in adults(Reference Engelman, Fingerlin and Langefeld48,Reference Fang, van Meurs and Arp49) . Furthermore, a large GWAS in 33 996 individuals of European descent showed that major alleles of CYP2R1 rs10741657 were associated with a 21 % higher risk of 25(OH)D insufficiency(Reference Wang, Zhang and Richards25).
Our genetic risk score based on alleles in GC (rs4588 and rs1251263) and CYP2R1 (rs10741657 and rs10500804) SNP showed a dose-dependent association with serum 25(OH)D, with a 33 nmol/l lower serum 25(OH)D among those with the highest compared with those with the lowest genetic risk score. Nissen et al.(Reference Nissen, Rasmussen and Ravn-Haren28) used a comparable risk score based on CYP2R1 (rs10741657 and rs10766197) and GC (rs4588 and rs842999) and reported 81 % higher mean serum 25(OH)D in late summer among children, who were carriers of zero v. eight risk alleles. A large study in Danish adults (n 31 040) with a genetic risk score based solely on CYP2R1 (rs10741657 and rs12794714) showed 6 nmol/l lower serum 25(OH)D in participants with four v. zero risk alleles(Reference Vimaleswaran, Cavadino and Berry29). These studies show that polymorphisms in CYP2R1 and GC predispose to low vitamin D status and indicate that risk scores should include polymorphisms in several genes that affect the serum concentration of 25(OH)D, to reflect the overall genetic variation in vitamin D status. This is especially important in Mendelian randomisation studies that aim to examine associations with functional outcomes.
Despite its marked effect on serum 25(OH)D concentration, we found no association between the genetic risk score and any of the cardiometabolic markers. Based on the previously observed associations with plasma lipids in this study population(Reference Petersen, Dalskov and Sørensen2), we estimate that the difference in 25(OH)D between those in the lowest and highest risk score category should be about –0·04 mmol/l TAG and that a potential difference in diastolic blood pressure could be expected to be about –0·6 mmHg. The previously observed effect sizes of the associations(Reference Petersen, Dalskov and Sørensen2) may however be overestimated due to confounding from other lifestyle factors. A recent study in Finnish prepubertal children found an association between CYP2R1 (rs12794714) and total and LDL-cholesterol, even after adjustment for 25(OH)D(Reference Soininen, Eloranta and Viitasalo50), and large studies in adults have reported associations between DHCR7 (rs12785878) and CYP2R1 (rs12794714) and blood pressure (about −0·1 mmHg per risk score unit)(Reference Vimaleswaran, Cavadino and Berry29) and risk of type 2 diabetes(Reference Afzal, Brøndum-Jacobsen and Bojesen30). The children in the present study have a relatively healthy cardiometabolic profile, and this may limit our ability to detect associations with our genetic risk score.
A potential association between vitamin D status and cardiometabolic outcomes is supported by the observed modifications of the association between serum 25(OH)D concentration and sBP, insulin and TAG by SNP in the VDR gene. Furthermore, the associations between 25(OH)D and sBP and TAG were in the same direction in major allele homozygotes of rs11568820 and rs2228570, respectively, and similar although far from significant associations were observed for the other VDR variants. In addition, we observed similar effect modifications between VDR SNP and the genetic risk score for both insulin and sBP. The direction of the associations and the effect estimates for TAG are in line with the previously observed associations with serum 25(OH)D in this population of children, which found no association for sBP(Reference Petersen, Dalskov and Sørensen2). Contrary to our findings, Vimaleswaran et al.(Reference Vimaleswaran, Power and Hyppönen51) did not find any VDR polymorphism modification of the associations between serum 25(OH)D and obesity, blood pressure, plasma lipids and Hb1Ac in a cohort of more than 5000 adults.
The Mendelian randomisation approach can be used as an instrument to evaluate causal effects, as it is less prone to confounding than other observational studies. However, Mendelian randomisation studies generally require large sample sizes(Reference Berry, Vimaleswaran and Whittaker52), so the relatively small sample size in the present study increases the risk of type II error. We tried to overcome this by pooling genetic risk score groups with few children as well as heterozygotes and minor allele homozygotes in the individual SNP analyses. A genetic risk score is a powerful instrument(Reference Berry, Vimaleswaran and Whittaker52), which in the present study allowed us to identify groups of children with genotypes that differed markedly in serum 25(OH)D. Our study is furthermore strengthened by the analyses of potential effect-modifying actions of SNP in genes related to the biological activity of 1,25-dihydroxyvitamin D on the association between serum 25(OH)D and the cardiometabolic markers, which is a new method to try to verify results from potentially confounded analyses. Moreover, there was no association between dietary intake of vitamin D and serum 25(OH)D concentration in autumn(Reference Petersen, Damsgaard and Dalskov37), which minimises any dietary interference in the Mendelian analyses. The stratified analyses of associations between serum 25(OH)D and the cardiometabolic markers are, however, still prone to confounding even after our extensive adjustments.
One limitation of the Mendelian randomisation approach that needs to be considered in the interpretation of the results is that the SNP could have pleiotropic effects, which could lead to associations through a mechanism that does not involve 25(OH)D(Reference Berry, Vimaleswaran and Whittaker52). This risk is diminished by the verification of the effects of GC and CYP2RI on vitamin D status. Moreover, we used multiple SNP with different locations in the selected genes, and the observed effects of the VDR polymorphisms are biologically plausible. The VDR is expressed in a variety of extra-skeletal tissues, and the selected VDR polymorphisms have been shown to be associated with outcomes related to CVD(Reference Sentinelli, Bertoccini and Barchetta45,Reference Muldowney, Lucey and Hill46) . There are several hypotheses that may explain how vitamin D receptor activity could affect plasma TAG among others by suppression of parathyroid hormone secretion, which in turn would reduce lipolysis(Reference Zemel, Shi and Greer53) and lower the hepatic synthesis of TAG(Reference Cho, Kang and Choi54). Activation of the vitamin D receptor by 1,25-dihydroxyvitamin D has also been proposed to affect blood pressure through a variety of mechanisms including involvement of the renin–angiotensin–aldosterone system and vascular smooth muscle(Reference Wacker and Holick55,Reference Kassi, Adamopoulos and Basdra56) . Some randomised clinical trials in children and adolescents have indicated potential beneficial effects of vitamin D supplementation on TAG and glucose metabolism markers(Reference Belenchia, Tosh and Hillman12,Reference Kelishadi, Salek and Salek57) , but most studies have not found any cardiometabolic benefits after an increase in serum concentration of 25(OH)D(Reference Nader, Aguirre Castaneda and Wallace9,Reference Hauger, Mølgaard and Mortensen58,Reference Smith, Tripkovic and Hauger59) . Our analyses were performed in healthy children with mean serum 25(OH)D > 50 nmol/l during autumn, when the serum 25(OH)D is expected to be close to the annual peak, as UVB radiation in Denmark is only sufficient to induce cutaneous vitamin D3 synthesis from March to late September(Reference Webb, Kline and Holick60). Most of the children were Caucasian, and exclusion of non-Caucasian children did not affect the results, but the results may not be generalisable to older children or children with diseases or severe vitamin D deficiency.
In conclusion, the results of the present study show that a genetic risk score based on polymorphisms in genes related to vitamin D synthesis and transport has a substantial impact on serum vitamin D status. The genetic vitamin D risk score was not associated with the cardiometabolic markers, but interactions between both 25(OH)D and the genetic risk score and SNP in VDR were indicated for some of the cardiometabolic markers. Further investigations of associations between vitamin D status and cardiometabolic risk are warranted in larger Mendelian randomisation studies and randomised trials in children.
Acknowledgements
The authors thank the National Food Institute at the Technical University of Denmark for collecting the dietary data.
The OPUS project ‘Optimal well-being, development and health for Danish children through a healthy New Nordic Diet’ was supported by a grant from Nordea-fonden (grant no. 02-2010-0389).
L. L., H. H., R. A. P., U. V., C. T. D. and A. L.-M. designed research; A. L.-M. analysed data; L. L., H. H., R. A. P., U. V. and C. T. D. provided substantial contribution to interpretation of data; A. L., L. L., H. H., R. A. P. and C. T. D. wrote the article; U. L. revised the content of the paper; A. L.-M. had primary responsibility for the final content. All authors read the paper critically and approved the final manuscript.
None of the authors has any conflicts of interest to declare and Nordea-fonden had no role in the trial design, analysis or interpretation of the data or the decision to publish.
Supplementary material
For supplementary material referred to in this article, please visit https://doi.org/10.1017/S0007114520000148


